Gap Offers Upbeat Guidance For Full Year -- Update
09 February 2016 - 10:34AM
Dow Jones News
By Josh Beckerman
Gap Inc. gave rosy guidance for the fiscal year ended Jan. 30
even though sales declined overall in the fourth quarter and
comparable-store sales at the retailer's three major brands dropped
in January.
Shares, up 4.7% in the past month, rose 3.1% to $24.74 in
after-hours trading.
Gap said it projects full-year earnings per share, excluding
items, to come in at $2.41 to $2.42. That is at the high end of
earlier guidance.
The San Francisco company said overall sales for the fourth
quarter totaled $4.39 billion, down 7% from $4.71 billion in the
year-earlier period. Analysts polled by Thomson Reuters had
forecast sales of $4.46 billion. Gap said the decline was 5% when
the impacts of currency fluctuations were stripped out.
Retailers have faced challenges recently including unusually
warm weather that has damped demand for coats, sweaters and other
winter gear. In addition, tourists visiting the U.S. are spending
less due to a stronger dollar. These issues have prompted some
retailers to cut prices to attract shoppers.
Gap has been struggling to revamp its namesake brand. The
company brought on new leadership, including former Banana Republic
veteran Wendi Goldman, who had led the Pink line at Victoria's
Secret. It has also been working through cost-cutting measures.
In January, comparable-store sales declined 6% at Gap, 17% at
Banana Republic and 6% at Old Navy. According to Gap's recorded
sales call, Old Navy sales were hurt by the shift of three "Super
Cash" redemption days to February this year from January of last
year.
Sales at Gap's three main brands also declined in December.
Gap is slated to release full fourth-quarter results Feb.
25.
Write to Josh Beckerman at josh.beckerman@wsj.com
(END) Dow Jones Newswires
February 08, 2016 18:19 ET (23:19 GMT)
Copyright (c) 2016 Dow Jones & Company, Inc.
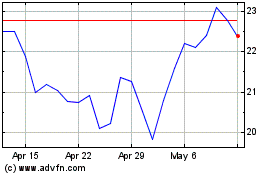
Gap (NYSE:GPS)
Historical Stock Chart
From Mar 2024 to Apr 2024

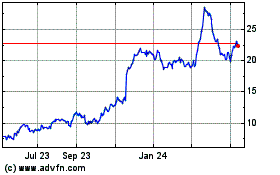
Gap (NYSE:GPS)
Historical Stock Chart
From Apr 2023 to Apr 2024
