Kellogg Sales Continue to Slide Despite Improving Cereal Trends
12 February 2016 - 1:47AM
Dow Jones News
By Chelsey Dulaney
Kellogg Co. on Thursday said sales slid 11% in its fourth
quarter, though the company's cost-cutting efforts helped drive
profit that beat Wall Street views.
Like other big packaged-food producers, Kellogg has faced
challenges from shifting consumer tastes in the U.S. as well as
foreign exchange hits on its sales abroad. On Thursday, the company
said cereal trends continued to improve in the fourth quarter.
Last year, the Battle Creek, Mich., maker of Frosted Flakes and
Eggo waffles, became the latest big packaged-food producer to adopt
the financial tool known as zero-base budgeting to try to slash
costs amid weak demand and the strong U.S. dollar's squeeze on
overseas sales.
In all for the period ended Jan. 2, the company reported a loss
of $41 million, or 12 cents a share, compared with a loss of $293
million, or 82 cents a share, a year earlier.
Selling, general and administrative expenses fell 22% to $1
billion.
Excluding mark-to-market costs and restructuring charges,
per-share earnings were 79 cents. Analysts polled by Thomson
Reuters had expected 74 cents a share.
Revenue fell 11% to $3.14 billion, below the $3.16 billion
analysts had expected. Excluding currency swings, core sales rose
4.2%.
In the North America division, sales fell 8%, or 0.4% on a
comparable basis and excluding currency impacts.
Kellogg said its U.S. breakfast division improved, helped by
improving cereal sales, though the U.S. snacks business logged a
1.9% decline in comparable sales.
In its international division, growth in snacks such as Pringles
helped drive 1.6% core sales growth in Europe. Sales in the Asia
Pacific business increased 3.3% on a comparable basis in the
quarter.
Comparable sales in Latin America jumped 45.3% because of
Kellogg's Venezuelan business. That business experienced
significant inflation in the second half of the year, impacting
year-over-year growth.
The company backed its guidance for the year.
Write to Chelsey Dulaney at Chelsey.Dulaney@wsj.com
(END) Dow Jones Newswires
February 11, 2016 09:32 ET (14:32 GMT)
Copyright (c) 2016 Dow Jones & Company, Inc.
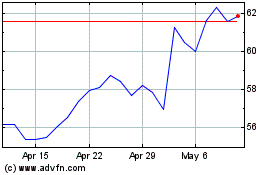
Kellanova (NYSE:K)
Historical Stock Chart
From Mar 2024 to Apr 2024

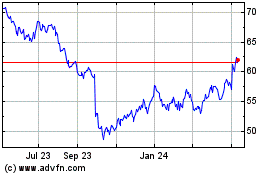
Kellanova (NYSE:K)
Historical Stock Chart
From Apr 2023 to Apr 2024
