ING 3Q Net Profit Rose, Supported by Increased Income -- Update
04 November 2021 - 6:17PM
Dow Jones News
By Sabela Ojea
ING Groep NV on Thursday reported a higher net profit for the
third quarter from the prior year, and said that it aims to reduce
its funding for the oil-and-gas sector by 2025 as part of its
target of reaching net-zero emissions by 2050.
The Dutch bank posted a net profit for the period of 1.37
billion euros ($1.59 billion) compared with EUR788 million for the
same period a year earlier.
Net interest income was EUR3.39 billion, up from EUR3.33 billion
for the year-earlier period. Total income climbed 8.4% to EUR4.65
billion, helped by higher fee income.
ING's common equity Tier 1 ratio--a key measure of balance-sheet
strength--was 15.8% at the end of the period, up from 15.3% as at
the third quarter of 2020 and 15.7% in the second quarter of
2021.
The lender also said it has reserved EUR684 million of quarterly
net profit for distribution in the third quarter, which is part of
the EUR1.74 billion share buyback program it launched on Oct.
5.
When the bank posted its second-quarter results, it said it
would distribute EUR3.62 billion to shareholders after Sept.
30.
Regarding its net-zero emissions target, ING said it has
sharpened its target for upstream oil and gas and now aims to
reduce its funding for the sector by 12% by 2025 when compared with
2019 levels. It will also set targets for the other eight sectors
of its "Terra approach", it added.
ING is measuring its lending in the sectors of its loan book
that are responsible for most greenhouse gas emissions: power
generation, fossil fuels, automotive, shipping, aviation, steel,
cement, residential mortgages and commercial real estate, it
said.
Write to Sabela Ojea at sabela.ojea@wsj.com; @sabelaojeaguix
(END) Dow Jones Newswires
November 04, 2021 03:02 ET (07:02 GMT)
Copyright (c) 2021 Dow Jones & Company, Inc.
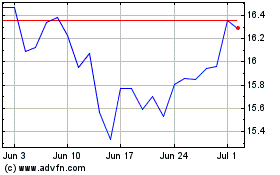
ING Groep NV (EU:INGA)
Historical Stock Chart
From Mar 2024 to Apr 2024

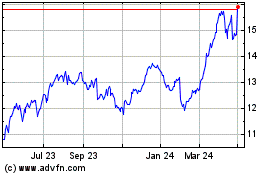
ING Groep NV (EU:INGA)
Historical Stock Chart
From Apr 2023 to Apr 2024
