U.S. Dollar Higher With Inflation Data In Focus
11 July 2022 - 8:06PM
RTTF2
The U.S. dollar advanced against its major counterparts in the
European session on Monday, as investors awaited U.S. inflation
data due this week, after strong jobs data supported expectations
for the aggressive policy tightening path by the Federal
Reserve.
The consumer price index is expected to rise to 8.8 percent
year-on-year in June from 8.6 percent in May.
A strong reading is likely to boost bets for super-sized hikes
from the Fed to tame it.
The currency was further supported by a drop in European shares
amid fresh COVID-19 curbs in China and the energy crunch in
Europe.
Virus worries intensified after Shanghai detected its first case
of the latest highly contagious variant of Covid-19, BA.5
omicron.
Russia stopped gas exports through the Nord Stream gas pipeline,
heightening the energy crisis in Europe.
The greenback reached as high as 1.0066 against the euro, its
highest level since December 2, 2002. The greenback is seen
challenging resistance around the 0.97 level.
The greenback touched near a 4-week high of 0.9824 against the
franc and a 5-day high of 1.1907 against the pound, off its
previous lows of 0.9758 and 1.2037, respectively. The greenback may
face resistance around 1.00 against the franc and 1.14 against the
pound.
Against the loonie, the greenback was higher at 1.3027. Next
likely resistance for the greenback is seen around the 1.32
level.
The greenback approached more than 2-year highs of 0.6738
against the aussie and 0.6110 against the kiwi, following its early
lows of 0.6855 and 0.6193, respectively. Immediate resistance for
the greenback is likely seen around 0.64 against the aussie and
0.585 against the kiwi.
The greenback resumed its rally against the yen, hitting near a
24-year high of 137.75. If the greenback rises further, 139.00 is
seen as its next resistance level.
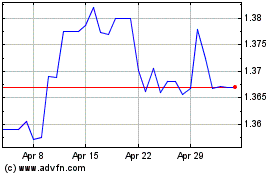
US Dollar vs CAD (FX:USDCAD)
Forex Chart
From Mar 2024 to Apr 2024

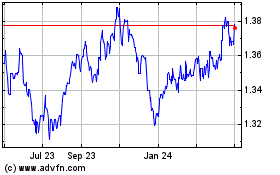
US Dollar vs CAD (FX:USDCAD)
Forex Chart
From Apr 2023 to Apr 2024
