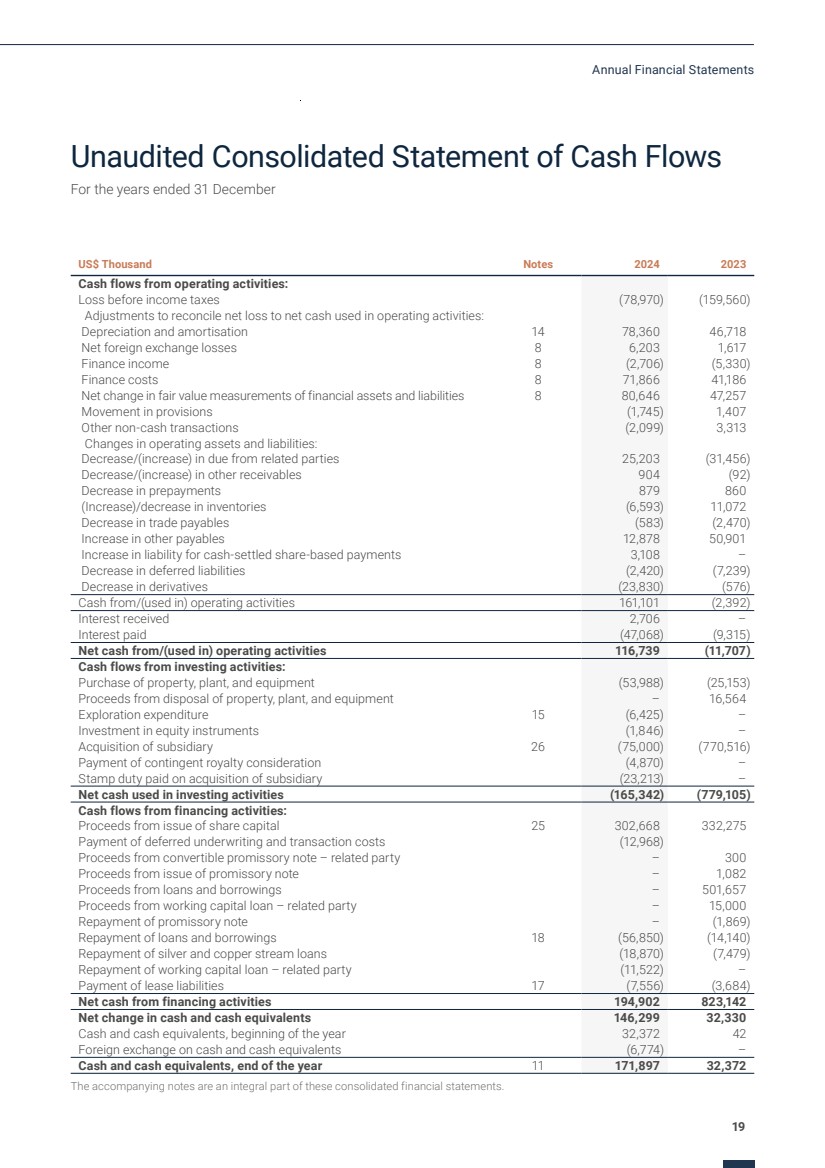
| Unaudited Consolidated Statement of Cash Flows
For the years ended 31 December
US$ Thousand Notes 2024 2023
Cash flows from operating activities:
Loss before income taxes (78,970) (159,560)
Adjustments to reconcile net loss to net cash used in operating activities:
Depreciation and amortisation 14 78,360 46,718
Net foreign exchange losses 8 6,203 1,617
Finance income 8 (2,706) (5,330)
Finance costs 8 71,866 41,186
Net change in fair value measurements of financial assets and liabilities 8 80,646 47,257
Movement in provisions (1,745) 1,407
Other non-cash transactions (2,099) 3,313
Changes in operating assets and liabilities:
Decrease/(increase) in due from related parties 25,203 (31,456)
Decrease/(increase) in other receivables 904 (92)
Decrease in prepayments 879 860
(Increase)/decrease in inventories (6,593) 11,072
Decrease in trade payables (583) (2,470)
Increase in other payables 12,878 50,901
Increase in liability for cash-settled share-based payments 3,108 –
Decrease in deferred liabilities (2,420) (7,239)
Decrease in derivatives (23,830) (576)
Cash from/(used in) operating activities 161,101 (2,392)
Interest received 2,706 –
Interest paid (47,068) (9,315)
Net cash from/(used in) operating activities 116,739 (11,707)
Cash flows from investing activities:
Purchase of property, plant, and equipment (53,988) (25,153)
Proceeds from disposal of property, plant, and equipment – 16,564
Exploration expenditure 15 (6,425) –
Investment in equity instruments (1,846) –
Acquisition of subsidiary 26 (75,000) (770,516)
Payment of contingent royalty consideration (4,870) –
Stamp duty paid on acquisition of subsidiary (23,213) –
Net cash used in investing activities (165,342) (779,105)
Cash flows from financing activities:
Proceeds from issue of share capital 25 302,668 332,275
Payment of deferred underwriting and transaction costs (12,968)
Proceeds from convertible promissory note – related party – 300
Proceeds from issue of promissory note – 1,082
Proceeds from loans and borrowings – 501,657
Proceeds from working capital loan – related party – 15,000
Repayment of promissory note – (1,869)
Repayment of loans and borrowings 18 (56,850) (14,140)
Repayment of silver and copper stream loans (18,870) (7,479)
Repayment of working capital loan – related party (11,522) –
Payment of lease liabilities 17 (7,556) (3,684)
Net cash from financing activities 194,902 823,142
Net change in cash and cash equivalents 146,299 32,330
Cash and cash equivalents, beginning of the year 32,372 42
Foreign exchange on cash and cash equivalents (6,774) –
Cash and cash equivalents, end of the year 11 171,897 32,372
The accompanying notes are an integral part of these consolidated financial statements.
19
Annual Financial Statements |
