true
Wolverine World Wide, Inc. is filing this Current Report on Form 8-K/A (this "8-K/A"): (1) To correct a typographical error in the press release attached as Exhibit 99.1 to the Current Report on Form 8-K that the Company filed with the Securities and Exchange Commission on February 19, 2025 (the "Original 8-K"). The error was included in the table under the header "2025 GUIDANCE RECONCILIATION TABLES." The press release attached as Exhibit 99.1 to this 8-K/A corrects this error and is hereby incorporated by reference. The full text of the Original 8-K is included in Item 2.02 below. (2) To include Item 7.01 below. This 8-K/A, Exhibit 99.1 and Exhibit 99.2 shall not be deemed "filed" for purposes of Section 18 of the Securities Exchange Act of 1934, as amended (the "Exchange Act"), or incorporated by reference in any filing under the Securities Act of 1933, as amended (the "Securities Act"), or the Exchange Act, except as shall be expressly set forth by specific reference in such a filing.
0000110471
0000110471
2025-02-19
2025-02-19
iso4217:USD
xbrli:shares
iso4217:USD
xbrli:shares
UNITED STATES
SECURITIES AND EXCHANGE COMMISSION
Washington, D.C. 20549
FORM 8-K/A
(Amendment No. 1)
CURRENT REPORT
Pursuant to Section 13 or 15(d) of The
Securities Exchange Act of 1934
Date of Report (Date of earliest event reported):
February 20, 2025 (February 19, 2025)
| WOLVERINE
WORLD WIDE, INC. |
| (Exact name of registrant as specified in its charter) |
| Delaware |
|
001-06024 |
|
38-1185150 |
|
(State or other jurisdiction of
incorporation) |
|
(Commission File Number) |
|
(IRS Employer
Identification No.) |
| 9341
Courtland Drive N.E., Rockford, Michigan |
|
49351 |
| (Address of principal executive offices) |
|
(Zip Code) |
Registrant’s telephone number, including
area code: (616) 866-5500
Check the appropriate box below if the Form 8-K filing is intended
to simultaneously satisfy the filing obligation of the registrant under any of the following provisions (see General Instruction A.2.
below):
| ¨ | Written communications pursuant to Rule 425 under the Securities Act (17 CFR 230.425) |
| ¨ | Soliciting material pursuant to Rule 14a-12 under the Exchange Act (17 CFR 240.14a-12) |
| ¨ | Pre-commencement communications pursuant to Rule 14d-2(b) under the Exchange Act (17 CFR 240.14d-2(b)) |
| ¨ | Pre-commencement communications pursuant to Rule 13e-4(c) under the Exchange Act (17 CFR 240.13e-4(c)) |
| Securities registered pursuant to Section 12(b) of the Act: |
| |
| Title of each class |
Trading symbol |
Name of each exchange on which registered |
| Common Stock, $1 Par Value |
WWW |
New York Stock Exchange |
Indicate by check mark whether the registrant is an emerging growth
company as defined in Rule 405 of the Securities Act of 1933 (§230.405 of this chapter) or Rule 12b-2 of the Securities
Exchange Act of 1934 (§240.12b-2 of this chapter).
Emerging growth company ¨
If
an emerging growth company, indicate by check mark if the registrant has elected not to use the extended transition period for complying
with any new or revised financial accounting standards provided pursuant to Section 13(a) of the Exchange Act. ¨
Explanatory Note
Wolverine World Wide, Inc. is filing this Current Report on Form 8-K/A
(this “8-K/A”):
(1) To correct a typographical error in the press release attached
as Exhibit 99.1 to the Current Report on Form 8-K that the Company filed with the Securities and Exchange Commission on February 19,
2025 (the “Original 8-K”). The error was included in the table under the header "2025 GUIDANCE RECONCILIATION TABLES.”
The press release attached as Exhibit 99.1 to this 8-K/A corrects this error and is hereby incorporated by reference. The full text
of the Original 8-K is included in Item 2.02 below.
(2) To include Item 7.01 below.
This 8-K/A, Exhibit 99.1 and Exhibit 99.2 shall not be deemed
“filed” for purposes of Section 18 of the Securities Exchange Act of 1934, as amended (the “Exchange Act”),
or incorporated by reference in any filing under the Securities Act of 1933, as amended (the “Securities Act”), or the Exchange
Act, except as shall be expressly set forth by specific reference in such a filing.
| Item 2.02 |
Results of Operations and Financial Condition. |
On February 19, 2025, Wolverine World Wide, Inc.
(the “Company”) issued a press release announcing its financial results for the Company’s fourth quarter of 2024, attached
as Exhibit 99.1 to this Current Report on Form 8-K (the “8-K”), which is hereby incorporated by reference. This
8-K and Exhibit 99.1 shall not be deemed “filed” for purposes of Section 18 of the Securities Exchange Act of 1934,
as amended (the “Exchange Act”), or incorporated by reference in any filing under the Securities Act of 1933, as amended (the
“Securities Act”), or the Exchange Act, except as shall be expressly set forth by specific reference in such a filing.
| Item 7.01 |
Regulation FD Disclosure. |
The Company is furnishing the investor relations presentation attached
as Exhibit 99.2 to this 8-K/A, which is incorporated by reference herein.
The Company’s investor relations presentation
has been posted to the Company’s website, www.wolverineworldwide.com. The Company plans to use its website to disseminate future
updates to its investor relations presentation, which includes important information about the Company, and does not intend to file or
furnish a Form 8-K alerting investors each time the presentation is updated.
SIGNATURES
Pursuant to the requirements
of the Securities Exchange Act of 1934, the registrant has duly caused this report to be signed on its behalf by the undersigned hereunto
duly authorized.
| Dated: February 20, 2025 |
WOLVERINE WORLD WIDE, INC.
(Registrant) |
| |
|
| |
|
| |
/s/ Taryn L. Miller |
| |
Taryn L. Miller |
| |
Chief Financial Officer and Treasurer |
Exhibit 99.1
 |
9341 Courtland Drive NE, Rockford, MI 49351
Phone (616) 866-5500 |
FOR IMMEDIATE RELEASE
CONTACT: Alex Wiseman
(616) 863-3974
WOLVERINE
WORLDWIDE REPORTS FOURTH QUARTER
AND
FISCAL 2024 RESULTS
Company
Meets Guidance, Inflects to Growth, and Issues 2025 Outlook
ROCKFORD, Mich., February 19,
2025 – Wolverine World Wide, Inc. (NYSE: WWW) today reported financial results for the fourth quarter
and full year 2024 ended December 28, 2024.
“A
year ago, we outlined an ambitious turnaround strategy composed of three chapters: stabilization, transformation, and inflection. We shared
a plan to meaningfully strengthen the Company's balance sheet, expand profitability, and sequentially improve revenue trends – culminating
with an inflection to growth in the final quarter of 2024,” said Chris Hufnagel, President and Chief Executive Officer of Wolverine
Worldwide. “I'm pleased to report that we accomplished all of these objectives. In the fourth quarter, we exceeded our expectations
for revenue and earnings and inflected to growth as a Company – delivering better-than-anticipated results for 2024. As we begin
2025, our brands are poised to continue to build on our momentum, standing on a much healthier foundation with stronger product pipelines
and compelling storytelling. Our team is encouraged by the work we've accomplished together and excited to turn the page."
FINANCIAL HIGHLIGHTS
Financial results for 2024, and comparable results
from 2023, in each case, for our ongoing business exclude the impact of Keds, which was sold in February 2023, the U.S. Wolverine
Leathers business, which was sold in August 2023, the non-U.S. Wolverine Leathers business, which was sold in December 2023,
and the Sperry business, which was sold in January 2024. Tables have been provided in the back of this release showing the impact
of these adjustments on financial results for 2024 and 2023.
FOURTH-QUARTER 2024 FINANCIAL HIGHLIGHTS
| (in millions) | |
December 28,
2024 | | |
December 30,
2023 | | |
Y/Y Change | | |
Constant
Currency Change | |
| Reported Segment Revenue Results: | |
| | | |
| | | |
| | | |
| | |
| Active Group | |
$ | 331.7 | | |
$ | 341.3 | | |
| (2.8 | )% | |
| (3.2 | )% |
| Work Group | |
$ | 151.1 | | |
$ | 125.3 | | |
| 20.6 | % | |
| 21.4 | % |
| Other | |
$ | 11.9 | | |
$ | 60.1 | | |
| (80.2 | )% | |
| (77.4 | )% |
| Total Revenue | |
$ | 494.7 | | |
$ | 526.7 | | |
| (6.1 | )% | |
| (5.8 | )% |
| Ongoing Total Revenue | |
$ | 494.7 | | |
$ | 480.5 | | |
| 3.0 | % | |
| 3.3 | % |
| Supplemental Revenue Information | |
| | | |
| | | |
| | | |
| | |
| Merrell | |
$ | 163.4 | | |
$ | 161.8 | | |
| 1.0 | % | |
| 1.0 | % |
| Saucony | |
$ | 99.6 | | |
$ | 105.1 | | |
| (5.3 | )% | |
| (5.2 | )% |
| Wolverine | |
$ | 62.4 | | |
$ | 51.8 | | |
| 20.5 | % | |
| 20.5 | % |
| Sweaty Betty | |
$ | 63.4 | | |
$ | 67.3 | | |
| (5.9 | )% | |
| (7.9 | )% |
| International - Reported | |
$ | 252.7 | | |
$ | 267.2 | | |
| (5.4 | )% | |
| | |
| International - Ongoing | |
$ | 252.7 | | |
$ | 256.0 | | |
| (1.3 | )% | |
| | |
| Direct-to-Consumer - Reported | |
$ | 151.7 | | |
$ | 186.9 | | |
| (18.8 | )% | |
| | |
| Direct-to-Consumer - Ongoing | |
$ | 151.7 | | |
$ | 163.2 | | |
| (7.0 | )% | |
| | |
| Reported Financial Metrics | |
| | | |
| | | |
| | | |
| | |
| Gross Margin | |
| 44.0 | % | |
| 36.6 | % | |
| 740 | bps | |
| | |
| Operating Expenses | |
$ | 177.9 | | |
$ | 379.9 | | |
| (53.2 | )% | |
| | |
| Operating Margin | |
| 8.0 | % | |
| (35.5 | )% | |
| 4,350 | bps | |
| | |
| Diluted Earnings Per Share | |
$ | 0.29 | | |
$ | (1.15 | ) | |
| 125.2 | % | |
| | |
| Non-GAAP and Ongoing Business Financial Metrics | |
| | | |
| | | |
| | | |
| | |
| Adjusted Gross Margin | |
| 44.0 | % | |
| 37.8 | % | |
| 620 | bps | |
| | |
| Adjusted Operating Expenses | |
$ | 167.0 | | |
$ | 195.5 | | |
| (14.6 | )% | |
| | |
| Adjusted Operating Margin | |
| 10.2 | % | |
| (2.9 | )% | |
| 1,310 | bps | |
| | |
| Adjusted Diluted Earnings Per Share | |
$ | 0.42 | | |
$ | (0.26 | ) | |
| 261.5 | % | |
| | |
| Constant Currency Diluted Earnings Per Share | |
$ | 0.48 | | |
$ | (0.26 | ) | |
| 284.6 | % | |
| | |
Gross margin improved significantly due
to lower supply chain costs, product costs and lower sales of end-of-life inventory.
Inventory at the end of the quarter was
$241 million and was down $133 million or approximately 35.6% compared to the prior year.
Net Debt at the end of the quarter was
$496 million, down $246 million or approximately 33.1% compared to the prior year.
FULL-YEAR 2024 FINANCIAL HIGHLIGHTS
| (in millions) | |
December 28,
2024 | | |
December 30,
2023 | | |
Y/Y Change | | |
Constant
Currency Change | |
| Reported Segment Revenue Results: | |
| | | |
| | | |
| | | |
| | |
| Active Group | |
$ | 1,246.1 | | |
$ | 1,439.1 | | |
| (13.4 | )% | |
| (13.8 | )% |
| Work Group | |
$ | 455.3 | | |
$ | 480.6 | | |
| (5.3 | )% | |
| (5.1 | )% |
| Other | |
$ | 53.6 | | |
$ | 323.2 | | |
| (83.4 | )% | |
| (83.0 | )% |
| Total Revenue | |
$ | 1,755.0 | | |
$ | 2,242.9 | | |
| (21.8 | )% | |
| (21.9 | )% |
| Ongoing Total Revenue | |
$ | 1,750.4 | | |
$ | 1,992.1 | | |
| (12.1 | )% | |
| (12.3 | )% |
| Supplemental Brand Information | |
| | | |
| | | |
| | | |
| | |
| Merrell | |
$ | 598.4 | | |
$ | 675.8 | | |
| (11.5 | )% | |
| (11.5 | )% |
| Saucony | |
$ | 406.5 | | |
$ | 495.8 | | |
| (18.0 | )% | |
| (18.0 | )% |
| Wolverine | |
$ | 193.1 | | |
$ | 201.2 | | |
| (4.0 | )% | |
| (4.0 | )% |
| Sweaty Betty | |
$ | 198.9 | | |
$ | 203.8 | | |
| (2.4 | )% | |
| (4.6 | )% |
| International - Reported | |
$ | 861.6 | | |
$ | 1,025.0 | | |
| (15.9 | )% | |
| | |
| International - Ongoing | |
$ | 861.0 | | |
$ | 966.2 | | |
| (10.9 | )% | |
| | |
| Direct-to-Consumer - Reported | |
$ | 483.9 | | |
$ | 582.4 | | |
| (16.9 | )% | |
| | |
| Direct-to-Consumer - Ongoing | |
$ | 480.8 | | |
$ | 501.2 | | |
| (4.1 | )% | |
| | |
| Reported Financial Metrics: | |
| | | |
| | | |
| | | |
| | |
| Gross Margin | |
| 44.5 | % | |
| 38.9 | % | |
| 560 | bps | |
| | |
| Operating Expenses | |
$ | 680.5 | | |
$ | 940.7 | | |
| (27.7 | )% | |
| | |
| Operating Margin | |
| 5.8 | % | |
| (3.0 | )% | |
| 880 | bps | |
| | |
| Diluted Earnings Per Share | |
$ | 0.58 | | |
$ | (0.51 | ) | |
| 213.7 | % | |
| | |
| Non-GAAP and Ongoing Business Financial Metrics | |
| | | |
| | | |
| | | |
| | |
| Adjusted Gross Margin | |
| 44.6 | % | |
| 39.9 | % | |
| 470 | bps | |
| | |
| Adjusted Operating Expenses | |
$ | 650.5 | | |
$ | 716.3 | | |
| (9.2 | )% | |
| | |
| Adjusted Operating Margin | |
| 7.5 | % | |
| 3.9 | % | |
| 360 | bps | |
| | |
| Adjusted Diluted Earnings Per Share | |
$ | 0.91 | | |
$ | 0.15 | | |
| 506.7 | % | |
| | |
| Constant Currency Diluted Earnings Per Share | |
$ | 1.02 | | |
$ | 0.15 | | |
| 580.0 | % | |
| | |
FULL-YEAR 2025 OUTLOOK
The Company expects to build on the momentum gained
in 2024 and make continued progress on its transformation in fiscal year 2025. The outlook for 2025 highlights the strength of our focused
portfolio and investments to support our brands and strategic initiatives. Additionally, projections reflect the impact of foreign currency
headwinds and a 53rd week, which will affect annual comparisons. A breakdown of these factors can be found in the Investor Presentation
on our website.
Comparable results from 2024 for our ongoing business
exclude the financial impact of Sperry which was sold in January 2024.
For fiscal year 2025, the Company expects:
| • | Revenue to be approximately $1.795 to $1.825 billion, representing
growth of approximately 2.5% to 4.3% compared to the 2024 ongoing business and constant currency growth of approximately 4.7% to 6.5%. |
| • | Gross margin of approximately 45.5%, up 100 basis points compared to 2024. |
| • | Operating margin to be approximately 7.7%, up 190 basis points compared to 2024 operating margin, and adjusted operating margin
to be approximately 8.3%, up 80 basis points compared to 2024 adjusted operating margin for our ongoing business. |
| • | The effective tax rate to be approximately 18.0%. |
| • | Diluted earnings per share in the range of $0.95 to $1.10 and adjusted diluted earnings per share in the range of $1.05 to
$1.20. These full-year EPS expectations include an approximate $0.08 negative impact from expected foreign currency exchange rate fluctuations. |
| • | Diluted weighted average shares of approximately 81.5 million. |
“2024 was a pivotal year for our 142-year-old
Company. While we haven't yet reached our full potential, I'm encouraged by the progress we've made and thankful for our teams and
partners around the world," Hufnagel continued. "The most important chapter is the next one, as we drive together to deliver
better, more consistent returns for our shareholders."
NON-GAAP FINANCIAL MEASURES
Measures referred to in this release as “adjusted” financial
results and the financial results of the "ongoing business" are non-GAAP measures. Adjusted financial results exclude environmental
and other related costs net of recoveries, non-cash impairment of long-lived assets, reorganization costs, gain on the sale of businesses,
trademarks and long-lived assets, Sperry® store closure costs, costs associated with divestitures and pension costs. The financial
results of the ongoing business exclude financial results from the Keds business, Sperry business and Wolverine Leathers business prior
to the respective dates of sale of such businesses. Revenue adjusted for divestitures and business model changes excludes financial results
from the Keds business, Sperry business and Wolverine Leathers business prior to the respective dates of sale of such businesses and are
adjusted to include the impact of business model changes in 2023 (the transition of Hush Puppies North America to a licensing model, Hush
Puppies IP sale, and conversion of the China joint ventures to the distributor model) and business model changes in 2024 (the transition
of Merrell and Saucony Kids to a licensing model). The Company also presents constant currency information, which is a non-GAAP measure
that excludes the impact of fluctuations in foreign currency exchange rates. The Company calculates constant currency basis by converting
the current-period local currency financial results using the prior period exchange rates and comparing these adjusted amounts to the
Company's current period reported results. The Company believes providing each of these non-GAAP measures provides valuable supplemental
information regarding its results of operations, consistent with how the Company evaluates performance.
The Company has provided a reconciliation of each of the above non-GAAP
financial measures to the most directly comparable GAAP financial measure. The Company believes these non-GAAP measures provide useful
information to both management and investors because they increase the comparability of current period results to prior period results
by adjusting for certain items that may not be indicative of core operating results and enable better identification of trends in our
business. The adjusted financial results are used by management to, and allow investors to, evaluate the operating performance of the
Company on a comparable basis. Management does not, nor should investors, consider such non-GAAP financial measures in isolation from,
or as a substitute for, financial information prepared in accordance with GAAP.
EARNINGS CALL INFORMATION
The Company will host a conference call today at 8:30 a.m. ET
to discuss these results and current business trends. The conference call will be broadcast live and accessible under the “Investor
Relations” tab at www.wolverineworldwide.com. A replay of the conference call will be available on the Company’s website for
a period of approximately 30 days.
ABOUT WOLVERINE WORLDWIDE
Founded in 1883, Wolverine World Wide, Inc.
(NYSE:WWW) is one of the world’s leading marketers and licensors of branded casual, active lifestyle, work, outdoor sport, athletic,
children's and uniform footwear and apparel. The Company's diverse portfolio of highly recognized brands includes Merrell®, Saucony®,
Sweaty Betty®, Hush Puppies®, Wolverine®, Chaco®, Bates®, HYTEST®, and Stride Rite®. Wolverine Worldwide is
also the global footwear licensee of the popular brands Cat® and Harley-Davidson®. Based in Rockford, Michigan, for more than
140 years, the Company's products are carried by leading retailers in the U.S. and globally in approximately 170 countries and territories.
For additional information, please visit our website, www.wolverineworldwide.com.
FORWARD-LOOKING STATEMENTS
This press release contains forward-looking
statements, including statements regarding the Company’s turnaround and transformation; the Company's outlook for 2025 including,
among others: reported, adjusted and constant currency revenue; reported and adjusted gross margin; reported and adjusted operating margin;
reported and adjusted net earnings; effective tax rate; reported and adjusted diluted earnings per share; diluted weighted average shares;
as well as statements regarding the strength of the Company’s focused portfolio and investments to support its brands and strategic
initiatives. and the effect of currency headwinds. In addition, words such as “estimates,” “anticipates,” “believes,”
“forecasts,” “step,” “plans,” “predicts,” “focused,” “projects,”
“outlook,” “is likely,” “expects,” “intends,” “should,” “will,”
“confident,” variations of such words, and similar expressions are intended to identify forward-looking statements. These
statements are not guarantees of future performance and involve certain risks, uncertainties, and assumptions (“Risk Factors”)
that are difficult to predict with regard to timing, extent, likelihood, and degree of occurrence. Risk Factors include, among others:
changes in general economic conditions, employment rates, business conditions, interest rates, tax policies, and other factors affecting
consumer spending in the markets and regions in which the Company’s products are sold; the inability for any reason to effectively
compete in global footwear, apparel and direct-to-consumer markets; the inability to maintain positive brand images and anticipate, understand
and respond to changing footwear and apparel trends and consumer preferences; the inability to effectively manage inventory levels; increases
or changes in duties, tariffs, quotas or applicable assessments in countries of import and export; foreign currency exchange rate fluctuations;
currency restrictions; supply chain and capacity constraints, production and distribution disruptions, including service interruptions
at shipping and receiving ports, reduction in operating hours, labor shortages, and facility closures resulting in production delays at
the Company’s manufacturers, quality issues, price increases or other risks associated with foreign sourcing; the cost, including
the effect of inflationary pressures, and availability of raw materials, inventories, services and labor for contract manufacturers; changes
in relationships with, including the loss of, significant wholesale customers; risks related to the significant investment in, and performance
of, the Company’s direct-to-consumer operations; risks related to expansion into new markets and complementary product categories;
the impact of seasonality and unpredictable weather conditions; the impact of changes in general economic conditions and/or the credit
markets on the Company’s manufacturers, distributors, suppliers, joint venture partners and wholesale customers; changes in the
Company’s effective tax rates; failure of licensees or distributors to meet planned annual sales goals or to make timely payments
to the Company; the risks of doing business in developing countries, and politically or economically volatile areas; the ability to secure
and protect owned intellectual property or use licensed intellectual property; legal compliance and litigation risks, including with respect
to with federal, state and local laws and regulations relating to the protection of the environment, environmental remediation and other
related costs, and environmental effects on human health; risks of breach of the Company’s databases or other systems, or those
of its vendors, which contain certain personal information, payment card data or proprietary information, due to cyberattack or other
similar events; strategic actions, including new initiatives and ventures, acquisitions and dispositions, and the Company’s success
in integrating acquired businesses, including Sweaty Betty®; risks related to stockholder
activism; the risk of impairment to goodwill and other intangibles; the success of the Company's restructuring and realignment initiatives
undertaken from time to time; changes in future pension funding requirements and pension expenses; and additional factors discussed in
the Company’s reports filed with the Securities and Exchange Commission and exhibits thereto. The foregoing Risk Factors, as well
as other existing Risk Factors and new Risk Factors that emerge from time to time, may cause actual results to differ materially from
those contained in any forward-looking statements. Given these or other risks and uncertainties, investors should not place undue reliance
on forward-looking statements as a prediction of actual results. Furthermore, the Company undertakes no obligation to update, amend, or
clarify forward-looking statements whether as a result of new information, future events or otherwise.
Any standards of measurement and performance made in reference to our environmental, social, governance and other sustainability plans
and goals are developing and based on assumptions, and no assurance can be given that any such plan, initiative, projection, goal, commitment,
expectation or prospect can or will be achieved.
# # #
WOLVERINE WORLD WIDE, INC.
CONSOLIDATED CONDENSED STATEMENTS OF OPERATIONS
(Unaudited)
(In millions, except earnings per share)
| | |
Quarter Ended | | |
Fiscal Year Ended | |
| | |
December 28,
2024 | | |
December 30,
2023 | | |
December 28,
2024 | | |
December 30,
2023 | |
| Revenue | |
$ | 494.7 | | |
$ | 526.7 | | |
$ | 1,755.0 | | |
$ | 2,242.9 | |
| Cost of goods sold | |
| 277.0 | | |
| 333.7 | | |
| 973.5 | | |
| 1,370.4 | |
| Gross profit | |
| 217.7 | | |
| 193.0 | | |
| 781.5 | | |
| 872.5 | |
| Gross margin | |
| 44.0 | % | |
| 36.6 | % | |
| 44.5 | % | |
| 38.9 | % |
| | |
| | | |
| | | |
| | | |
| | |
| Selling, general and administrative expenses | |
| 175.4 | | |
| 245.4 | | |
| 690.0 | | |
| 856.2 | |
| Gain on sale of business, trademarks and long-lived assets | |
| — | | |
| (12.6 | ) | |
| (8.5 | ) | |
| (90.4 | ) |
| Impairment of long-lived assets | |
| — | | |
| 129.5 | | |
| 9.3 | | |
| 185.3 | |
| Environmental and other related costs (income), net of recoveries | |
| 2.5 | | |
| 17.6 | | |
| (10.3 | ) | |
| (10.4 | ) |
| Operating expenses | |
| 177.9 | | |
| 379.9 | | |
| 680.5 | | |
| 940.7 | |
| Operating expenses as a % of revenue | |
| 36.0 | % | |
| 72.1 | % | |
| 38.8 | % | |
| 41.9 | % |
| | |
| | | |
| | | |
| | | |
| | |
| Operating profit (loss), net | |
| 39.8 | | |
| (186.9 | ) | |
| 101.0 | | |
| (68.2 | ) |
| Operating margin | |
| 8.0 | % | |
| (35.5 | )% | |
| 5.8 | % | |
| (3.0 | )% |
| | |
| | | |
| | | |
| | | |
| | |
| Interest expense, net | |
| 9.2 | | |
| 16.1 | | |
| 42.7 | | |
| 63.5 | |
| Other expense (income), net | |
| 2.1 | | |
| (0.7 | ) | |
| (3.3 | ) | |
| 2.5 | |
| Total other expenses | |
| 11.3 | | |
| 15.4 | | |
| 39.4 | | |
| 66.0 | |
| Earnings (loss) before income taxes | |
| 28.5 | | |
| (202.3 | ) | |
| 61.6 | | |
| (134.2 | ) |
| | |
| | | |
| | | |
| | | |
| | |
| Income tax expense (benefit) | |
| 3.2 | | |
| (111.7 | ) | |
| 10.1 | | |
| (95.0 | ) |
| Effective tax rate | |
| 10.9 | % | |
| 55.2 | % | |
| 16.3 | % | |
| 70.7 | % |
| | |
| | | |
| | | |
| | | |
| | |
| Net earnings (loss) | |
| 25.3 | | |
| (90.6 | ) | |
| 51.5 | | |
| (39.2 | ) |
| | |
| | | |
| | | |
| | | |
| | |
| Less: net earnings attributable to noncontrolling interests | |
| 0.7 | | |
| 0.6 | | |
| 3.6 | | |
| 0.4 | |
| Net earnings (loss) attributable to Wolverine World Wide, Inc. | |
$ | 24.6 | | |
$ | (91.2 | ) | |
$ | 47.9 | | |
$ | (39.6 | ) |
| Diluted earnings (loss) per share | |
$ | 0.29 | | |
$ | (1.15 | ) | |
$ | 0.58 | | |
$ | (0.51 | ) |
| | |
| | | |
| | | |
| | | |
| | |
| Supplemental information: | |
| | | |
| | | |
| | | |
| | |
| Net earnings (loss) used to calculate diluted earnings (loss) per share | |
$ | 23.8 | | |
$ | (91.4 | ) | |
$ | 46.3 | | |
$ | (40.3 | ) |
| Shares used to calculate diluted earnings (loss) per share | |
| 80.5 | | |
| 79.5 | | |
| 80.0 | | |
| 79.4 | |
WOLVERINE WORLD WIDE, INC.
CONSOLIDATED CONDENSED BALANCE SHEETS
(Unaudited)
(In millions)
| | |
December 28,
2024 | | |
December 30,
2023 | |
| ASSETS | |
| | | |
| | |
| Cash and cash equivalents | |
$ | 152.1 | | |
$ | 179.0 | |
| Accounts receivables, net | |
| 209.4 | | |
| 230.8 | |
| Inventories, net | |
| 240.6 | | |
| 373.6 | |
| Current assets held for sale | |
| — | | |
| 160.6 | |
| Other current assets | |
| 86.4 | | |
| 81.1 | |
| Total current assets | |
| 688.5 | | |
| 1,025.1 | |
| Property, plant and equipment, net | |
| 89.7 | | |
| 96.3 | |
| Lease right-of-use assets | |
| 102.1 | | |
| 118.2 | |
| Goodwill and other indefinite-lived intangibles | |
| 597.6 | | |
| 601.2 | |
| Other noncurrent assets | |
| 190.9 | | |
| 222.0 | |
| Total assets | |
$ | 1,668.8 | | |
$ | 2,062.8 | |
| | |
| | | |
| | |
| LIABILITIES AND STOCKHOLDERS' EQUITY | |
| | | |
| | |
| Accounts payable and other accrued liabilities | |
$ | 419.4 | | |
$ | 519.7 | |
| Lease liabilities | |
| 33.7 | | |
| 34.7 | |
| Current maturities of long-term debt | |
| 10.0 | | |
| 10.0 | |
| Borrowings under revolving credit agreements | |
| 70.0 | | |
| 305.0 | |
| Total current liabilities | |
| 533.1 | | |
| 869.4 | |
| Long-term debt | |
| 568.0 | | |
| 605.8 | |
| Lease liabilities, noncurrent | |
| 116.0 | | |
| 132.4 | |
| Other noncurrent liabilities | |
| 135.2 | | |
| 155.2 | |
| Stockholders' equity | |
| 316.5 | | |
| 300.0 | |
| Total liabilities and stockholders' equity | |
$ | 1,668.8 | | |
$ | 2,062.8 | |
WOLVERINE WORLD WIDE, INC.
CONSOLIDATED CONDENSED STATEMENTS OF CASH FLOWS
(Unaudited)
(In millions)
| | |
Fiscal Year Ended | |
| | |
December 28,
2024 | | |
December 30,
2023 | |
| OPERATING ACTIVITIES: | |
| | | |
| | |
| Net earnings (loss) | |
$ | 51.5 | | |
$ | (39.2 | ) |
| Adjustments to reconcile net earnings (loss) to net cash provided by operating activities: | |
| | | |
| | |
| Depreciation and amortization | |
| 26.2 | | |
| 35.1 | |
| Deferred income taxes | |
| 21.4 | | |
| (95.8 | ) |
| Stock-based compensation expense | |
| 19.1 | | |
| 15.2 | |
| Pension and SERP expense | |
| 0.2 | | |
| 0.7 | |
| Impairment of long-lived assets | |
| 9.3 | | |
| 185.3 | |
| Environmental and other related costs | |
| (13.3 | ) | |
| (55.1 | ) |
| Gain on sale of business, trademarks and long-lived assets | |
| (8.5 | ) | |
| (90.4 | ) |
| Other | |
| (8.4 | ) | |
| (2.0 | ) |
| Changes in operating assets and liabilities | |
| 82.6 | | |
| 168.0 | |
| Net cash provided by operating activities | |
| 180.1 | | |
| 121.8 | |
| | |
| | | |
| | |
| INVESTING ACTIVITIES: | |
| | | |
| | |
| Additions to property, plant and equipment | |
| (20.2 | ) | |
| (14.6 | ) |
| Proceeds from sale of business, trademarks and long-lived assets, net of cash disposed of | |
| 102.4 | | |
| 188.9 | |
| Proceeds from company-owned insurance policy liquidations | |
| 7.9 | | |
| — | |
| Other | |
| (3.3 | ) | |
| (2.7 | ) |
| Net cash provided by investing activities | |
| 86.8 | | |
| 171.6 | |
| | |
| | | |
| | |
| FINANCING ACTIVITIES: | |
| | | |
| | |
| Payments under revolving credit agreements | |
| (619.0 | ) | |
| (743.0 | ) |
| Borrowings under revolving credit agreements | |
| 384.0 | | |
| 623.0 | |
| Proceeds from company-owned insurance policies | |
| 7.0 | | |
| — | |
| Payments on long-term debt | |
| (39.2 | ) | |
| (118.3 | ) |
| Payments of debt issuance costs | |
| — | | |
| (0.9 | ) |
| Cash dividends paid | |
| (32.5 | ) | |
| (32.6 | ) |
| Employee taxes paid under stock-based compensation plans | |
| (2.6 | ) | |
| (5.8 | ) |
| Proceeds from the exercise of stock options | |
| 3.1 | | |
| 0.1 | |
| Contributions from noncontrolling interests | |
| — | | |
| 31.2 | |
| Net cash used in financing activities | |
| (299.2 | ) | |
| (246.3 | ) |
| | |
| | | |
| | |
| Effect of foreign exchange rate changes | |
| (0.2 | ) | |
| 2.0 | |
| Increase (decrease) in cash and cash equivalents | |
| (32.5 | ) | |
| 49.1 | |
| | |
| | | |
| | |
| Cash and cash equivalents at beginning of the year | |
| 184.6 | | |
| 135.5 | |
| Cash and cash equivalents at end of the year | |
$ | 152.1 | | |
$ | 184.6 | |
The following tables contain information regarding the non-GAAP financial
measures used by the Company in the presentation of its financial results:
WOLVERINE WORLD WIDE, INC.
Q4 2024 RECONCILIATION TABLES
RECONCILIATION OF REPORTED REVENUE TO ADJUSTED
REVENUE ON A CONSTANT CURRENCY BASIS*
(Unaudited)
(In millions)
| | |
GAAP Basis
2024-Q4 | | |
Foreign
Exchange
Impact | | |
Constant
Currency
Basis 2024-Q4 | | |
GAAP Basis
2023-Q4 | | |
Reported
Change | | |
Constant
Currency
Change | |
| REVENUE | |
| | | |
| | | |
| | | |
| | | |
| | | |
| | |
| Active Group | |
$ | 331.7 | | |
$ | (1.2 | ) | |
$ | 330.5 | | |
$ | 341.3 | | |
| (2.8 | )% | |
| (3.2 | )% |
| Work Group | |
| 151.1 | | |
| 1.0 | | |
| 152.1 | | |
| 125.3 | | |
| 20.6 | % | |
| 21.4 | % |
| Other | |
| 11.9 | | |
| 1.7 | | |
| 13.6 | | |
| 60.1 | | |
| (80.2 | )% | |
| (77.4 | )% |
| Total | |
$ | 494.7 | | |
$ | 1.5 | | |
$ | 496.2 | | |
$ | 526.7 | | |
| (6.1 | )% | |
| (5.8 | )% |
RECONCILIATION OF REPORTED REVENUE
TO ADJUSTED REVENUE*
(Unaudited)
(In millions)
| | |
GAAP Basis | | |
Divestitures (1) | | |
As Adjusted | |
| Revenue - Fiscal 2024 Q4 | |
$ | 494.7 | | |
$ | — | | |
$ | 494.7 | |
| | |
| | | |
| | | |
| | |
| Revenue - Fiscal 2023 Q4 | |
$ | 526.7 | | |
$ | 46.2 | | |
$ | 480.5 | |
| (1) | | Q4
2023 adjustments reflect results for the Sperry business and Wolverine Leathers business included in the consolidated condensed statement
of operations. |
RECONCILIATION OF REPORTED GROSS MARGIN
TO ADJUSTED GROSS MARGIN *
(Unaudited)
(In millions)
| | |
GAAP Basis | | |
Divestitures (2) | | |
As Adjusted | |
| Gross Profit - Fiscal 2024 Q4 | |
$ | 217.7 | | |
$ | — | | |
$ | 217.7 | |
| | |
| | | |
| | | |
| | |
| Gross margin | |
| 44.0 | % | |
| | | |
| 44.0 | % |
| | |
| | | |
| | | |
| | |
| Gross Profit - Fiscal 2023 Q4 | |
$ | 193.0 | | |
$ | (11.4 | ) | |
$ | 181.6 | |
| | |
| | | |
| | | |
| | |
| Gross margin | |
| 36.6 | % | |
| | | |
| 37.8 | % |
| (2) | Q4 2023 adjustments reflect results
for the Sperry business and Wolverine Leathers business included in the consolidated condensed statement of operations. |
RECONCILIATION OF REPORTED OPERATING EXPENSES
TO ADJUSTED OPERATING EXPENSES*
(Unaudited)
(In millions)
| | |
GAAP Basis | | |
Adjustment (1) | | |
Divestitures (2) | | |
As Adjusted | |
| Operating expenses - Fiscal 2024 Q4 | |
$ | 177.9 | | |
$ | (10.9 | ) | |
$ | — | | |
$ | 167.0 | |
| | |
| | | |
| | | |
| | | |
| | |
| Operating expenses - Fiscal 2023 Q4 | |
$ | 379.9 | | |
$ | (168.8 | ) | |
$ | (15.6 | ) | |
$ | 195.5 | |
| (1) | Q4 2024 adjustments reflect $8.4
million of reorganization costs and $2.5 million of environmental and other related costs net of recoveries. Q4 2023 adjustments reflect
$129.4 million for non-cash impairments of long-lived assets, $31.3 million of reorganization costs, $17.6 million of environmental and
other related costs net of recoveries, and $3.1 million of costs associated with divestitures, partially offset by $12.6 million gain
on the sale of businesses, trademarks and long-lived assets. |
| | |
| (2) | Q4 2023 adjustments reflect results
for the Sperry business and Wolverine Leathers business included in the consolidated condensed statement of operations. |
RECONCILIATION OF REPORTED OPERATING MARGIN
TO ADJUSTED OPERATING MARGIN*
(Unaudited)
(In millions)
| | |
GAAP Basis | | |
Adjustments (1) | | |
Divestitures (2) | | |
As Adjusted | |
| Operating Profit - Fiscal 2024 Q4 | |
$ | 39.8 | | |
$ | 10.9 | | |
$ | — | | |
$ | 50.7 | |
| | |
| | | |
| | | |
| | | |
| | |
| Operating margin | |
| 8.0 | % | |
| | | |
| | | |
| 10.2 | % |
| | |
| | | |
| | | |
| | | |
| | |
| Operating Profit - Fiscal 2023 Q4 | |
$ | (186.9 | ) | |
$ | 168.8 | | |
$ | 4.2 | | |
$ | (13.9 | ) |
| | |
| | | |
| | | |
| | | |
| | |
| Operating margin | |
| (35.5 | )% | |
| | | |
| | | |
| (2.9 | )% |
| (1) | Q4 2024 adjustments reflect $8.4
million of reorganization costs and $2.5 million of environmental and other related costs net of recoveries. Q4 2023 adjustments reflect
$129.4 million for non-cash impairments of long-lived assets, $31.3 million of reorganization costs, $17.6 million of environmental and
other related costs net of recoveries, and $3.1 million of costs associated with divestitures, partially offset by $12.6 million gain
on the sale of businesses, trademarks and long-lived assets. |
| (2) | Q4 2023 adjustments reflect
results for the Sperry business and Wolverine Leathers business included in the consolidated condensed statement of operations. |
RECONCILIATION
OF REPORTED DILUTED EPS TO ADJUSTED
DILUTED
EPS ON A CONSTANT CURRENCY BASIS*
(Unaudited)
| | |
GAAP Basis | | |
Adjustments (1) | | |
Divestitures (2) | | |
As Adjusted | | |
Foreign
Exchange
Impact | | |
As Adjusted
EPS On a Constant
Currency Basis | |
| EPS - Fiscal 2024 Q4 | |
$ | 0.29 | | |
$ | 0.13 | | |
$ | — | | |
$ | 0.42 | | |
$ | 0.06 | | |
$ | 0.48 | |
| | |
| | | |
| | | |
| | | |
| | | |
| | | |
| | |
| EPS - Fiscal 2023 Q4 | |
$ | (1.15 | ) | |
$ | 0.85 | | |
$ | 0.04 | | |
$ | (0.26 | ) | |
| | | |
| | |
| (1) | Q4 2024 adjustments reflect
reorganization costs, environmental and other related costs net of recoveries, and pension settlement costs. Q4 2023 adjustments reflect
non-cash impairments of long-lived assets, reorganization costs, environmental and other related costs net of recoveries, and costs associated
with divestitures, partially offset by gain on the sale of businesses, trademarks and long-lived assets and SERP curtailment gain. |
| (2) | Q4 2023 adjustments reflect
results for the Sperry business and Wolverine Leathers business included in the consolidated condensed statement of operations. |
2024 FULL-YEAR
RECONCILIATION TABLES
RECONCILIATION OF REPORTED REVENUE TO ADJUSTED
REVENUE ON A CONSTANT CURRENCY BASIS*
(Unaudited)
(In millions)
| | |
GAAP Basis 2024 | | |
Foreign
Exchange
Impact | | |
Constant
Currency
Basis 2024 | | |
GAAP Basis
2023 | | |
Reported
Change | | |
Constant
Currency
Change | |
| REVENUE | |
| | | |
| | | |
| | | |
| | | |
| | | |
| | |
| Active Group | |
$ | 1,246.1 | | |
| (5.1 | ) | |
$ | 1,241.0 | | |
$ | 1,439.1 | | |
| (13.4 | )% | |
| (13.8 | )% |
| Work Group | |
| 455.3 | | |
| 1.0 | | |
| 456.3 | | |
| 480.6 | | |
| (5.3 | )% | |
| (5.1 | )% |
| Other | |
| 53.6 | | |
| 1.3 | | |
| 54.9 | | |
| 323.2 | | |
| (83.4 | )% | |
| (83.0 | )% |
| Total | |
$ | 1,755.0 | | |
$ | (2.8 | ) | |
$ | 1,752.2 | | |
$ | 2,242.9 | | |
| (21.8 | )% | |
| (21.9 | )% |
RECONCILIATION OF REPORTED REVENUE
TO ADJUSTED REVENUE*
(Unaudited)
(In millions)
| | |
GAAP Basis | | |
Divestitures (1) | | |
As Adjusted | |
| Revenue - Fiscal 2024 | |
$ | 1,755.0 | | |
$ | 4.6 | | |
$ | 1,750.4 | |
| | |
| | | |
| | | |
| | |
| Revenue - Fiscal 2023 | |
$ | 2,242.9 | | |
$ | 250.8 | | |
$ | 1,992.1 | |
| (1) | 2024 adjustments reflect the
Sperry business results included in the consolidated condensed statement of operations. 2023 adjustments reflect the Sperry business,
Keds business and Wolverine Leathers business results included in the consolidated condensed statement of operations. |
RECONCILIATION OF REPORTED GROSS MARGIN
TO ADJUSTED GROSS MARGIN*
(Unaudited)
(In millions)
| | |
GAAP Basis | | |
Adjustments (1) | | |
Divestitures (2) | | |
As Adjusted | |
| Gross Profit - Fiscal 2024 | |
$ | 781.5 | | |
$ | — | | |
$ | (0.1 | ) | |
$ | 781.4 | |
| | |
| | | |
| | | |
| | | |
| | |
| Gross margin | |
| 44.5 | % | |
| | | |
| | | |
| 44.6 | % |
| | |
| | | |
| | | |
| | | |
| | |
| Gross Profit - Fiscal 2023 | |
$ | 872.5 | | |
$ | 0.4 | | |
$ | (78.8 | ) | |
$ | 794.1 | |
| | |
| | | |
| | | |
| | | |
| | |
| Gross margin | |
| 38.9 | % | |
| | | |
| | | |
| 39.9 | % |
| (1) | 2023 adjustment reflects $0.4
million of costs associated with divestitures. |
| (2) | 2024 adjustments reflect the
Sperry business results included in the consolidated condensed statement of operations. 2023 adjustments reflect the Sperry business,
Keds business and Wolverine Leathers business results included in the consolidated condensed statement of operations. |
RECONCILIATION OF REPORTED OPERATING EXPENSES
TO ADJUSTED OPERATING EXPENSES*
(Unaudited)
(In millions)
| | |
GAAP Basis | | |
Adjustment (1) | | |
Divestitures (2) | | |
As Adjusted | |
| Operating expenses - Fiscal 2024 | |
$ | 680.5 | | |
$ | (19.1 | ) | |
$ | (10.9 | ) | |
$ | 650.5 | |
| | |
| | | |
| | | |
| | | |
| | |
| Operating expenses - Fiscal 2023 | |
$ | 940.7 | | |
$ | (136.7 | ) | |
$ | (87.7 | ) | |
$ | 716.3 | |
| (1) | 2024 adjustments reflect $28.6
million of reorganization costs and $9.3 million for non-cash impairments of long-lived assets, partially offset by $8.5 million gain
on the sale of businesses, trademarks and long-lived assets and $10.3 million of environmental and other related costs net of recoveries.
2023 adjustments reflect $185.3 million for non-cash impairments of long-lived assets, $47.1 million of reorganization costs, and $5.1
million of costs associated with divestitures, partially offset by $90.4 million gain on the sale of businesses, trademarks and long-lived
assets and $10.4 million of environmental and other related costs net of recoveries. |
| (2) | 2024 adjustments reflect the
Sperry business and Wolverine Leathers results included in the consolidated condensed statement of operations. 2023 adjustments reflect
the Sperry business, Keds business and Wolverine Leathers business results included in the consolidated condensed statement of operations. |
RECONCILIATION OF REPORTED OPERATING MARGIN
TO ADJUSTED OPERATING MARGIN*
(Unaudited)
(In millions)
| | |
GAAP Basis | | |
Adjustments (1) | | |
Divestitures (2) | | |
As Adjusted | |
| Operating Profit (Loss) - Fiscal 2024 | |
$ | 101.0 | | |
$ | 19.1 | | |
$ | 10.8 | | |
$ | 130.9 | |
| | |
| | | |
| | | |
| | | |
| | |
| Operating margin | |
| 5.8 | % | |
| | | |
| | | |
| 7.5 | % |
| | |
| | | |
| | | |
| | | |
| | |
| Operating Profit (Loss) - Fiscal 2023 | |
$ | (68.2 | ) | |
$ | 137.1 | | |
$ | 8.9 | | |
$ | 77.8 | |
| | |
| | | |
| | | |
| | | |
| | |
| Operating margin | |
| (3.0 | )% | |
| | | |
| | | |
| 3.9 | % |
| (1) | 2024 adjustments reflect $28.6
million of reorganization costs and $9.3 million for non-cash impairments of long-lived assets, partially offset by $8.5 million gain
on the sale of businesses, trademarks and long-lived assets and $10.3 million of environmental and other related costs net of recoveries.
2023 adjustments reflect $185.3 million for non-cash impairments of long-lived assets, $47.1 million of reorganization costs, and $5.5
million of costs associated with divestitures, partially offset by $90.4 million gain on the sale of businesses, trademarks and long-lived
assets and $10.4 million of environmental and other related costs net of recoveries. |
| (2) | 2024 adjustments reflect the
Sperry business results included in the consolidated condensed statement of operations. 2023 adjustments reflect the Sperry business,
Keds business and Wolverine Leathers business results included in the consolidated condensed statement of operations. |
RECONCILIATION OF REPORTED DILUTED EPS TO ADJUSTED
DILUTED EPS ON A CONSTANT CURRENCY BASIS*
(Unaudited)
| | |
GAAP Basis | | |
Adjustments (1) | | |
Divestitures (2) | | |
As Adjusted | | |
Foreign
Exchange
Impact | | |
As Adjusted
EPS On a Constant
Currency Basis | |
| EPS - Fiscal 2024 | |
$ | 0.58 | | |
$ | 0.21 | | |
$ | 0.12 | | |
$ | 0.91 | | |
$ | 0.11 | | |
$ | 1.02 | |
| | |
| | | |
| | | |
| | | |
| | | |
| | | |
| | |
| EPS - Fiscal 2023 | |
$ | (0.51 | ) | |
$ | 0.57 | | |
$ | 0.09 | | |
$ | 0.15 | | |
| | | |
| | |
| (1) | 2024 adjustments reflect reorganization
costs, non-cash impairments of long-lived assets, and pension settlement costs, partially offset by gain on the sale of businesses, trademarks
and long-lived assets and environmental and other related costs net of recoveries. 2023 adjustments
reflect non-cash impairments of long-lived assets, reorganization costs, costs associated with divestitures, and debt modification costs,
partially offset by gain on the sale of businesses, trademarks and long-lived assets, environmental and other related costs net of recoveries,
and SERP curtailment gain. |
| | |
| (2) | 2024 adjustments reflect the
Sperry business results included in the consolidated condensed statement of operations. 2023 adjustments reflect the Sperry business,
Keds business and Wolverine Leathers business results included in the consolidated condensed statement of operations. |
DIVESTITURE
FINANCIAL SUMMARY
(Unaudited)
(In millions, except per share amounts)
In order to provide visibility regarding the financial
impact of completed divestitures, the Company has provided additional information within the supplemental table below. The items included
in the tables represent amounts that are reflected in the reported fiscal 2024 and 2023 results that are related to businesses the Company
has sold. The Company believes providing the following information is helpful to better understand the impact of the divestitures on the
Company's ongoing business.
| | |
Q1 | | |
Q2 | | |
Q3 | | |
Q4 | | |
2024 Full-Year | |
| Revenue - Impact | |
| | | |
| | | |
| | | |
| | | |
| | |
| Sperry business (1) | |
$ | 4.1 | | |
$ | 0.4 | | |
$ | 0.1 | | |
$ | — | | |
$ | 4.6 | |
| Total Revenue - Impact | |
$ | 4.1 | | |
$ | 0.4 | | |
$ | 0.1 | | |
$ | — | | |
$ | 4.6 | |
| | |
| | | |
| | | |
| | | |
| | | |
| | |
| Operating profit - Impact | |
| | | |
| | | |
| | | |
| | | |
| | |
| Sperry business (1) | |
$ | (8.2 | ) | |
$ | (1.2 | ) | |
$ | (0.8 | ) | |
$ | — | | |
$ | (10.2 | ) |
| Wolverine Leathers business (2) | |
| (0.6 | ) | |
| — | | |
| — | | |
| — | | |
| (0.6 | ) |
| Total Operating profit - Impact | |
$ | (8.8 | ) | |
$ | (1.2 | ) | |
$ | (0.8 | ) | |
$ | — | | |
$ | (10.8 | ) |
| | |
| | | |
| | | |
| | | |
| | | |
| | |
| Net earnings per share - Impact | |
$ | (0.10 | ) | |
$ | (0.01 | ) | |
$ | (0.01 | ) | |
$ | — | | |
$ | (0.12 | ) |
| | |
| | | |
| | | |
| | | |
| | | |
| | |
| | |
| Q1 | | |
| Q2 | | |
| Q3 | | |
| Q4 | | |
| 2023 Full-Year | |
| Revenue - Impact | |
| | | |
| | | |
| | | |
| | | |
| | |
| Sperry business (1) | |
$ | 62.9 | | |
$ | 57.4 | | |
$ | 46.2 | | |
$ | 40.7 | | |
$ | 207.2 | |
| Wolverine Leathers business (2) | |
| 12.5 | | |
| 10.9 | | |
| 8.2 | | |
| 5.5 | | |
| 37.1 | |
| Keds business (3) | |
| 6.5 | | |
| — | | |
| — | | |
| — | | |
| 6.5 | |
| Total Revenue - Impact | |
$ | 81.9 | | |
$ | 68.3 | | |
$ | 54.4 | | |
$ | 46.2 | | |
$ | 250.8 | |
| | |
| | | |
| | | |
| | | |
| | | |
| | |
| Operating profit - Impact | |
| | | |
| | | |
| | | |
| | | |
| | |
| Sperry business (1) | |
$ | (2.3 | ) | |
$ | 0.2 | | |
$ | (4.0 | ) | |
$ | (4.2 | ) | |
$ | (10.3 | ) |
| Wolverine Leathers business (2) | |
| 1.4 | | |
| 0.8 | | |
| 1.1 | | |
| — | | |
| 3.3 | |
| Keds business (3) | |
| (1.9 | ) | |
| — | | |
| — | | |
| — | | |
| (1.9 | ) |
| Total Operating profit - Impact | |
$ | (2.8 | ) | |
$ | 1.0 | | |
$ | (2.9 | ) | |
$ | (4.2 | ) | |
$ | (8.9 | ) |
| | |
| | | |
| | | |
| | | |
| | | |
| | |
| Net earnings per share - Impact | |
$ | (0.03 | ) | |
$ | 0.01 | | |
$ | (0.03 | ) | |
$ | (0.04 | ) | |
$ | (0.09 | ) |
| (1) | The Sperry® business reflects the revenue
and operating profit from sale of Sperry® products through the sale of the Sperry® business
effective January 10, 2024. The amounts also include revenue and operating profit associated with Sperry®
stores not included in the divestiture which the Company has closed, costs associated with Sperry® employees not
included in the divestiture transaction and costs incurred winding down the Sperry® business, including the Sperry®
business with joint venture partners, that are not covered by the transition service agreement with the purchaser. The Sperry®
business revenue and operating profit did not and will not reoccur after the Company's 2024 third quarter. |
| (2) | The Wolverine Leathers business line item reflects revenue
and operating profit from the Wolverine Leathers business that will not reoccur after the Wolverine Leathers business is sold. The Company
divested the U.S. Wolverine Leathers business in August 2023 and divested the non-U.S. Wolverine Leathers business in December 2023.
The Wolverine Leathers costs incurred in 2024 are associated with employees not included in the divestiture transaction. |
| (3) | The Keds® business line item reflects
the revenue and operating profit from sale of Keds® products that will not reoccur after the Company's first period
in fiscal 2023 as a result of the sale of the global Keds® business effective February 4, 2023. |
For purposes of providing additional information regarding year-over-year
revenue comparisons, the below table adjusts 2023 revenue for divestitures and business model changes.
DIVESTITURE AND BUSINESS MODEL CHANGES
RECONCILIATION OF 2023 REPORTED REVENUE
TO ADJUSTED REVENUE*
(Unaudited)
(In millions)
| | |
Q1 | | |
Q2 | | |
Q3 | | |
Q4 | | |
FY | |
| Revenue - Fiscal 2023 | |
$ | 599.4 | | |
$ | 589.1 | | |
$ | 527.7 | | |
$ | 526.7 | | |
$ | 2,242.9 | |
| Adjustment for divestitures (1) | |
| | | |
| | | |
| | | |
| | | |
| | |
| | |
| | | |
| | | |
| | | |
| | | |
| | |
| Leathers | |
| (12.5 | ) | |
| (10.9 | ) | |
| (8.2 | ) | |
| (5.5 | ) | |
| (37.1 | ) |
| Keds | |
| (6.5 | ) | |
| — | | |
| — | | |
| — | | |
| (6.5 | ) |
| Sperry | |
| (62.9 | ) | |
| (57.4 | ) | |
| (46.2 | ) | |
| (40.7 | ) | |
| (207.2 | ) |
| | |
| | | |
| | | |
| | | |
| | | |
| | |
| Ongoing business (2) | |
$ | 517.5 | | |
$ | 520.8 | | |
$ | 473.3 | | |
$ | 480.5 | | |
$ | 1,992.1 | |
| | |
| | | |
| | | |
| | | |
| | | |
| | |
| Adjustments for 2023 business model changes (3) | |
| (13.0 | ) | |
| (13.5 | ) | |
| (16.9 | ) | |
| (13.9 | ) | |
| (57.3 | ) |
| Adjustments for 2024 business model changes (4) | |
| — | | |
| (6.7 | ) | |
| (7.5 | ) | |
| (3.3 | ) | |
| (17.5 | ) |
| | |
| | | |
| | | |
| | | |
| | | |
| | |
| Ongoing business adjusted for business model changes | |
$ | 504.5 | | |
$ | 500.6 | | |
$ | 448.9 | | |
$ | 463.3 | | |
$ | 1,917.3 | |
| (1) | Divestitures: Keds sold in
February 2023, Leathers US sold in August 2023, Leathers non-US sold in December 2023, and Sperry sold in January 2024. |
| | |
| (2) | Ongoing business excludes the
impact of the Wolverine Leathers, Keds and Sperry businesses. |
| | |
| (3) | Business model changes occurring
in 2023 provided for enhanced comparability, and include the impact of Hush Puppies North America transition to licensing model, Hush
Puppies IP sale, and China joint venture converted to distributor model. |
| | |
| (4) | Business model changes occurring
in 2024 provided for enhanced comparability, include the impact of Merrell and Saucony Kids transition to licensing model. |
2025 GUIDANCE RECONCILIATION TABLES
RECONCILIATION OF REPORTED GUIDANCE TO ADJUSTED
GUIDANCE,
REPORTED DILUTED EPS GUIDANCE TO ADJUSTED DILUTED
EPS
GUIDANCE AND SUPPLEMENTAL INFORMATION*
(Unaudited)
(In millions, except earnings per share)
| | |
GAAP Basis | | |
Adjustments (1) | | |
As Adjusted | |
| Revenue - Fiscal 2025 Full Year | |
| $1,795 - $1,825 | | |
| | | |
| $1,795 - $1,825 | |
| | |
| | | |
| | | |
| | |
| Gross Margin - Fiscal 2025 Full Year | |
| 45.5 | % | |
| | | |
| 45.5 | % |
| | |
| | | |
| | | |
| | |
| Operating Margin - Fiscal 2025 Full Year | |
| 7.7 | % | |
| 0.6 | % | |
| 8.3 | % |
| | |
| | | |
| | | |
| | |
| Dilutive EPS - Fiscal 2025 Full Year | |
| $0.95 - $1.10 | | |
$ | 0.10 | | |
| $1.05 - $1.20 | |
| | |
| | | |
| | | |
| | |
| Fiscal 2025 Full Year Supplemental information: | |
| | | |
| | | |
| | |
| | |
| | | |
| | | |
| | |
| Net Earnings | |
| $81 - $93 | | |
$ | 8 | | |
| $89 - $101 | |
| | |
| | | |
| | | |
| | |
| Net Earnings used to calculate diluted earnings per share | |
| $78 - $90 | | |
$ | 8 | | |
| $86 - $98 | |
| | |
| | | |
| | | |
| | |
| Shares used to calculate diluted earnings per share | |
| 81.5 | | |
| | | |
| 81.5 | |
| (1) | 2025 adjustments reflect estimated environmental and other
related costs net of recoveries and reorganization costs. |
| * | To supplement the consolidated condensed financial statements presented in accordance with Generally Accepted
Accounting Principles ("GAAP"), the Company describes what certain financial measures would have been if environmental and other
related costs net of recoveries, non-cash impairment of long-lived assets, reorganization costs and gain on the sale of businesses, trademarks
and long-lived assets, and pension costs were excluded. The financial results of the ongoing business for 2023 and 2024 exclude financial
results from the Sperry business, the Keds business and Wolverine Leathers business. Revenue adjusted for divestitures and business model
changes excludes financial results from the Keds business, Sperry business and Wolverine Leathers business prior to the respective dates
of sale of such businesses and are adjusted to include the impact of business model changes in 2023 (the transition of Hush Puppies North
America to a licensing model, Hush Puppies IP sale, and conversion of the China joint ventures to the distributor model) and business
model changes in 2024 (the transition of Merrell and Saucony Kids to a licensing model). The Company believes these non-GAAP measures
provide useful information to both management and investors by increasing comparability to the prior period by adjusting for certain items
that may not be indicative of the Company's core ongoing operating business results and to better identify trends in the Company's ongoing
business. The adjusted financial results are used by management to, and allow investors to, evaluate the operating performance of the
Company on a comparable basis |
The constant currency presentation,
which is a non-GAAP measure, excludes the impact of fluctuations in foreign currency exchange rates. The Company believes providing constant
currency information provides valuable supplemental information regarding results of operations, consistent with how the Company evaluates
performance. The Company calculates constant currency by converting the current-period local currency financial results using the prior
period exchange rates and comparing these adjusted amounts to the Company's current period reported results.
Management does not, nor should investors,
consider such non-GAAP financial measures in isolation from, or as a substitution for, financial information prepared in accordance with
GAAP. A reconciliation of all non-GAAP measures included in this press release, to the most directly comparable GAAP measures are
found in the financial tables above.
Exhibit 99.2

| Investor Presentation | Fourth Quarter 2024 |
| + Investor Presentation | 4Q24
Forward-Looking Statements
2
This presentation contains forward-looking statements, including statements regarding the Company’s turnaround and transformation; the Company's
outlook for 2025 including, among others: reported, adjusted and constant currency revenue; reported and adjusted gross margin; reported and adjusted
operating margin; reported and adjusted net earnings; effective tax rate; reported and adjusted diluted earnings per share; diluted weighted average
shares; as well as statements regarding the strength of the Company’s focused portfolio and investments to support its brands and strategic initiatives.
and the effect of currency headwinds. In addition, words such as “estimates,” “anticipates,” “believes,” “forecasts,” “step,” “plans,” “predicts,” “focused,”
“projects,” “outlook,” “is likely,” “expects,” “intends,” “should,” “will,” “confident,” variations of such words, and similar expressions are intended to identify
forward-looking statements. These statements are not guarantees of future performance and involve certain risks, uncertainties, and assumptions (“Risk
Factors”) that are difficult to predict with regard to timing, extent, likelihood, and degree of occurrence. Risk Factors include, among others: changes in
general economic conditions, employment rates, business conditions, interest rates, tax policies, and other factors affecting consumer spending in the
markets and regions in which the Company’s products are sold; the inability for any reason to effectively compete in global footwear, apparel and direct-to-consumer markets; the inability to maintain positive brand images and anticipate, understand and respond to changing footwear and apparel trends
and consumer preferences; the inability to effectively manage inventory levels; increases or changes in duties, tariffs, quotas or applicable assessments in
countries of import and export; foreign currency exchange rate fluctuations; currency restrictions; supply chain and capacity constraints, production and
distribution disruptions, including service interruptions at shipping and receiving ports, reduction in operating hours, labor shortages, and facility closures
resulting in production delays at the Company’s manufacturers, quality issues, price increases or other risks associated with foreign sourcing; the cost,
including the effect of inflationary pressures, and availability of raw materials, inventories, services and labor for contract manufacturers; changes in
relationships with, including the loss of, significant wholesale customers; risks related to the significant investment in, and performance of, the Company’s
direct-to-consumer operations; risks related to expansion into new markets and complementary product categories; the impact of seasonality and
unpredictable weather conditions; the impact of changes in general economic conditions and/or the credit markets on the Company’s manufacturers,
distributors, suppliers, joint venture partners and wholesale customers; changes in the Company’s effective tax rates; failure of licensees or distributors to
meet planned annual sales goals or to make timely payments to the Company; the risks of doing business in developing countries, and politically or
economically volatile areas; the ability to secure and protect owned intellectual property or use licensed intellectual property; legal compliance and
litigation risks, including with respect to with federal, state and local laws and regulations relating to the protection of the environment, environmental
remediation and other related costs, and environmental effects on human health; risks of breach of the Company’s databases or other systems, or those
of its vendors, which contain certain personal information, payment card data or proprietary information, due to cyberattack or other similar events;
strategic actions, including new initiatives and ventures, acquisitions and dispositions, and the Company’s success in integrating acquired businesses,
including Sweaty Betty®; risks related to stockholder activism; the risk of impairment to goodwill and other intangibles; the success of the Company's
restructuring and realignment initiatives undertaken from time to time; changes in future pension funding requirements and pension expenses; and
additional factors discussed in the Company’s reports filed with the Securities and Exchange Commission and exhibits thereto. The foregoing Risk Factors,
as well as other existing Risk Factors and new Risk Factors that emerge from time to time, may cause actual results to differ materially from those
contained in any forward-looking statements. Given these or other risks and uncertainties, investors should not place undue reliance on forward-looking
statements as a prediction of actual results. Furthermore, the Company undertakes no obligation to update, amend, or clarify forward-looking statements
whether as a result of new information, future events or otherwise. Any standards of measurement and performance made in reference to our
environmental, social, governance and other sustainability plans and goals are developing and based on assumptions, and no assurance can be given
that any such plan, initiative, projection, goal, commitment, expectation or prospect can or will be achieved. |
| + Investor Presentation | 4Q24
Overview
3
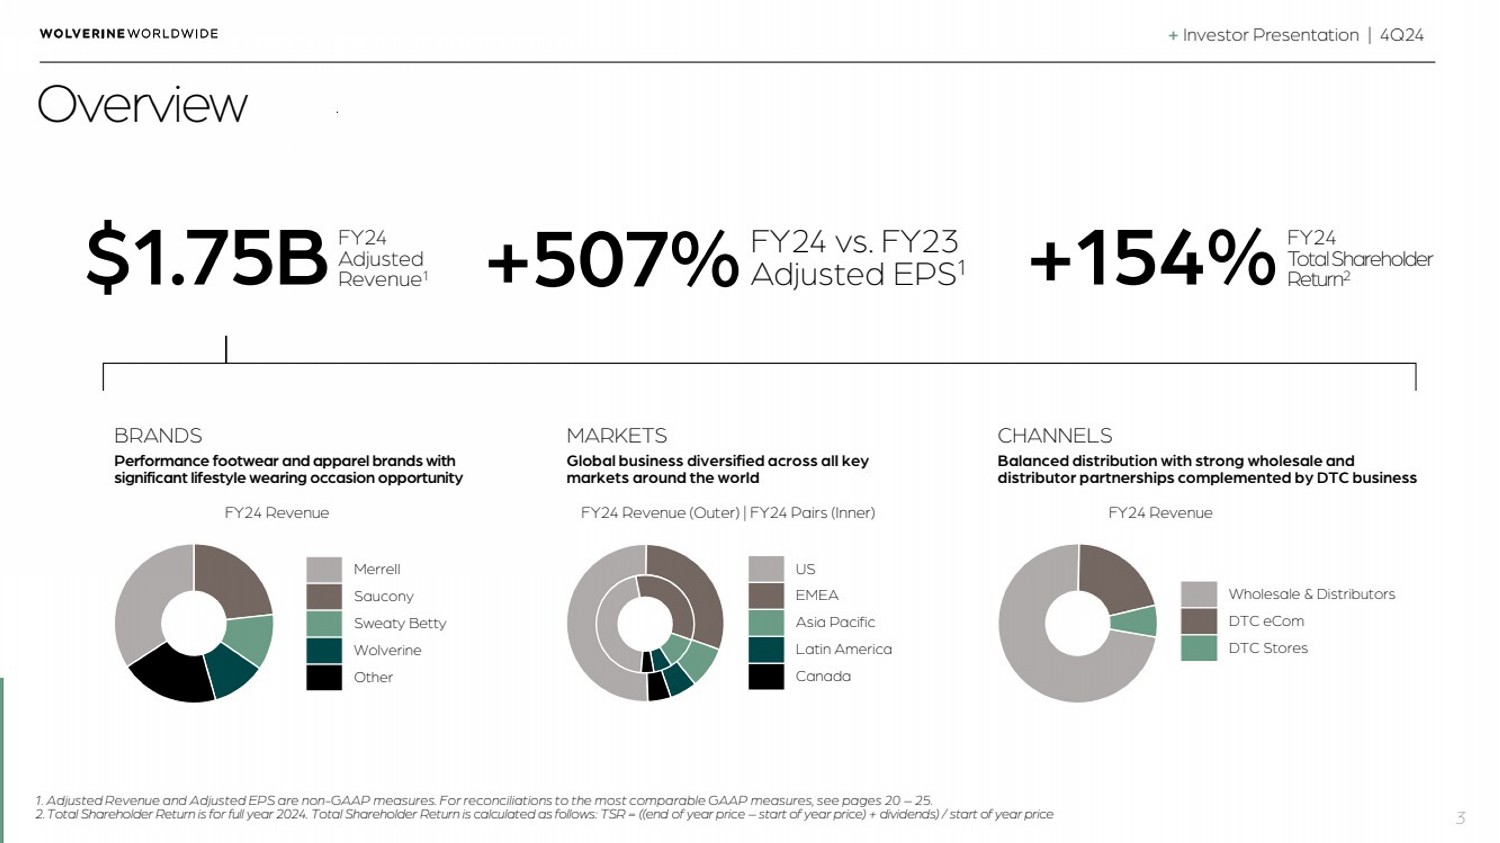
$1.75BFY24
Adjusted
Revenue1
FY24 Revenue (Outer) | FY24 Pairs (Inner) FY24 Revenue
US
EMEA
Asia Pacific
Latin America
Canada
Wholesale & Distributors
DTC eCom
DTC Stores
+507%FY24 vs. FY23
Adjusted EPS1 +154%FY24
Total Shareholder
Return2
FY24 Revenue
Merrell
Saucony
Sweaty Betty
Wolverine
Other
BRANDS
Performance footwear and apparel brands with
significant lifestyle wearing occasion opportunity
MARKETS
Global business diversified across all key
markets around the world
CHANNELS
Balanced distribution with strong wholesale and
distributor partnerships complemented by DTC business
1. Adjusted Revenue and Adjusted EPS are non-GAAP measures. For reconciliations to the most comparable GAAP measures, see pages 20 – 25.
2.Total Shareholder Return is for full year 2024. Total Shareholder Return is calculated as follows: TSR = ((end of year price – start of year price) + dividends) / start of year price |
| + Investor Presentation | 4Q24
4
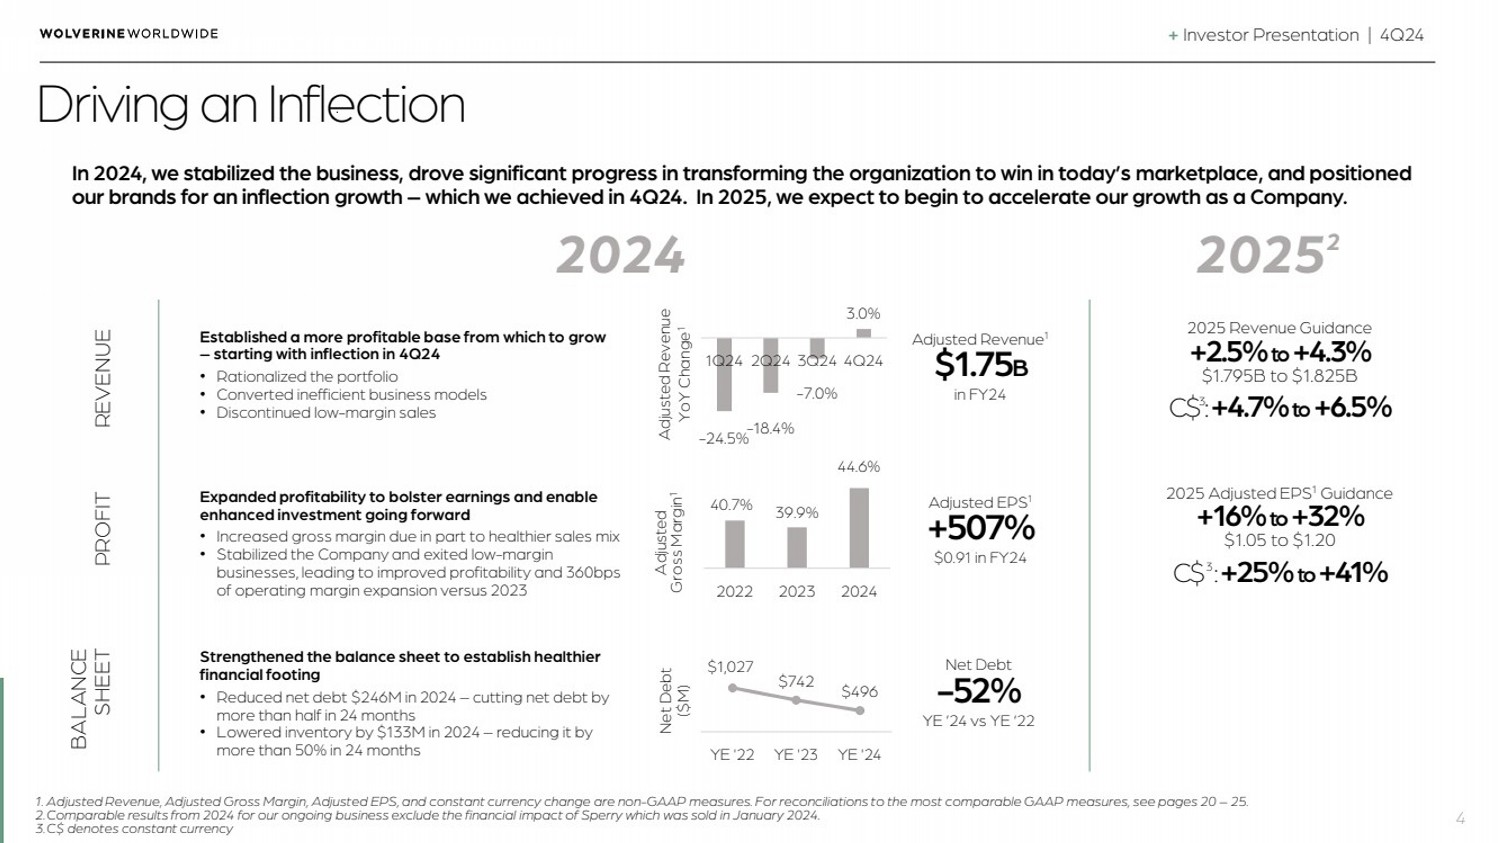
Driving an Inflection REVENUE PROFIT BALANCE SHEET
2025 Revenue Guidance
+2.5% to+4.3%
$1.795B to $1.825B
C$3
: +4.7% to+6.5%
2025 Adjusted EPS1 Guidance
+16% to+32%
$1.05 to $1.20
C$3
: +25% to+41%
2024 20252
In 2024, we stabilized the business, drove significant progress in transforming the organization to win in today’s marketplace, and positioned
our brands for an inflection growth – which we achieved in 4Q24. In 2025, we expect to begin to accelerate our growth as a Company.
1. Adjusted Revenue, Adjusted Gross Margin, Adjusted EPS, and constant currency change are non-GAAP measures. For reconciliations to the most comparable GAAP measures, see pages 20 – 25.
2.Comparable results from 2024 for our ongoing business exclude the financial impact of Sperry which was sold in January 2024.
3.C$ denotes constant currency
Established a more profitable base from which to grow
– starting with inflection in 4Q24
• Rationalized the portfolio
• Converted inefficient business models
• Discontinued low-margin sales
Expanded profitability to bolster earnings and enable
enhanced investment going forward
• Increased gross margin due in part to healthier sales mix
• Stabilized the Company and exited low-margin
businesses, leading to improved profitability and 360bps
of operating margin expansion versus 2023
Adjusted EPS1
+507%
$0.91 in FY24
Strengthened the balance sheet to establish healthier
financial footing
• Reduced net debt $246M in 2024 – cutting net debt by
more than half in 24 months
• Lowered inventory by $133M in 2024 – reducing it by
more than 50% in 24 months
$1,027 $742 $496
YE '22 YE '23 YE '24
Net Debt
($M)
40.7% 39.9%
44.6%
2022 2023 2024
Adjusted
Gross Margin1
-24.5%-18.4%
-7.0%
3.0%
1Q24 2Q24 3Q24 4Q24
Adjusted Revenue
YoY Change1
Adjusted Revenue1
$1.75B
in FY24
Net Debt
-52%
YE ’24 vs YE ‘22 |
| + Investor Presentation | 4Q24
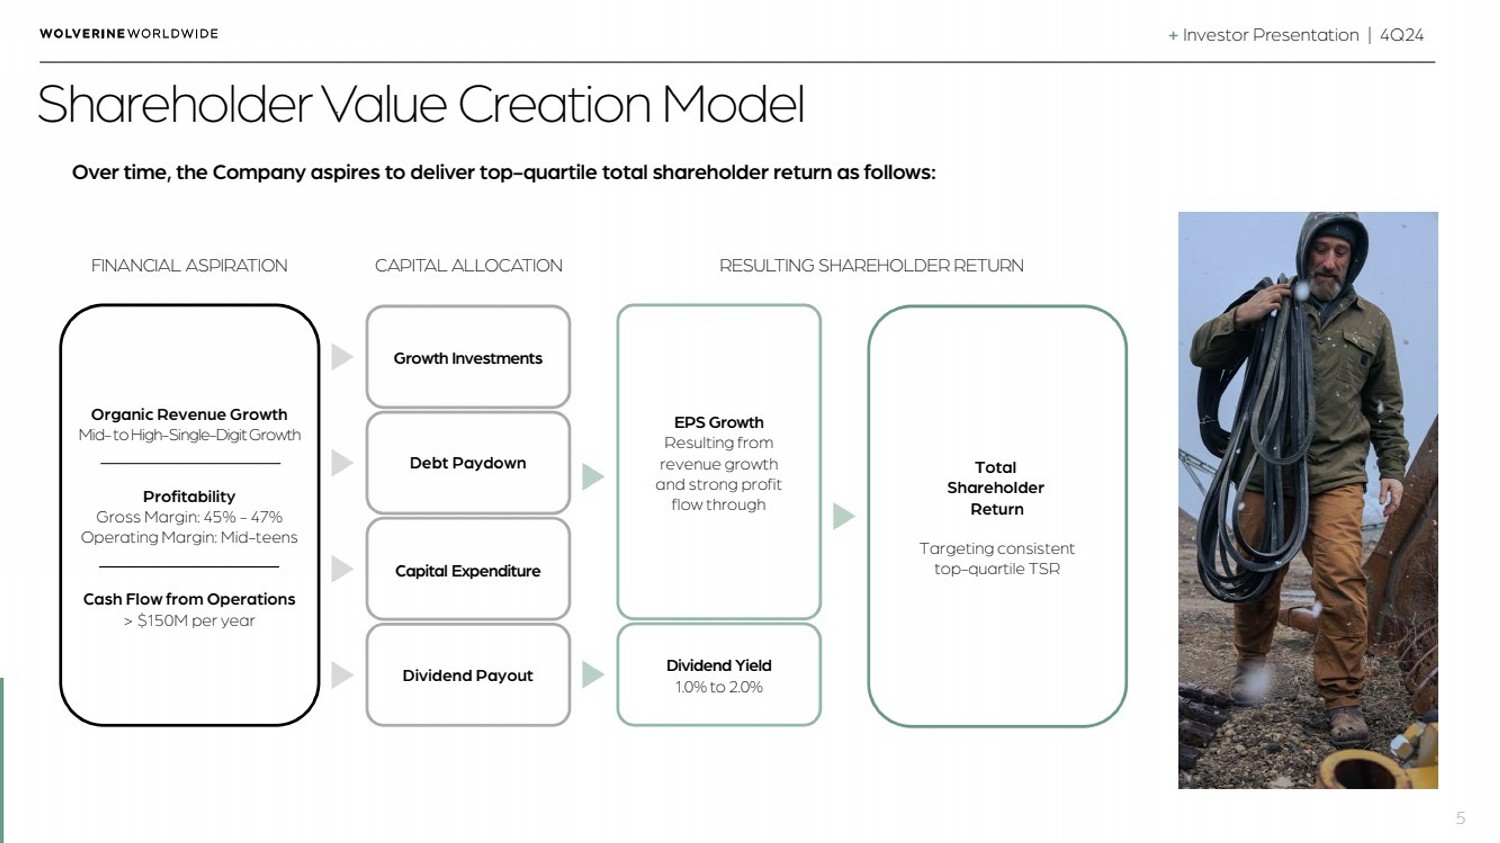
Shareholder Value Creation Model
5
Over time, the Company aspires to deliver top-quartile total shareholder return as follows:
Total
Shareholder
Return
Targeting consistent
top-quartile TSR
Organic Revenue Growth
Mid-to High-Single-Digit Growth
Profitability
Gross Margin: 45% - 47%
Operating Margin: Mid-teens
Cash Flow from Operations
> $150M per year
FINANCIAL ASPIRATION RESULTING SHAREHOLDER RETURN
Dividend Yield
1.0% to 2.0%
EPS Growth
Resulting from
revenue growth
and strong profit
flow through
Dividend Payout
Capital Expenditure
Debt Paydown
Growth Investments
CAPITAL ALLOCATION |
| + Investor Presentation | 4Q24
6
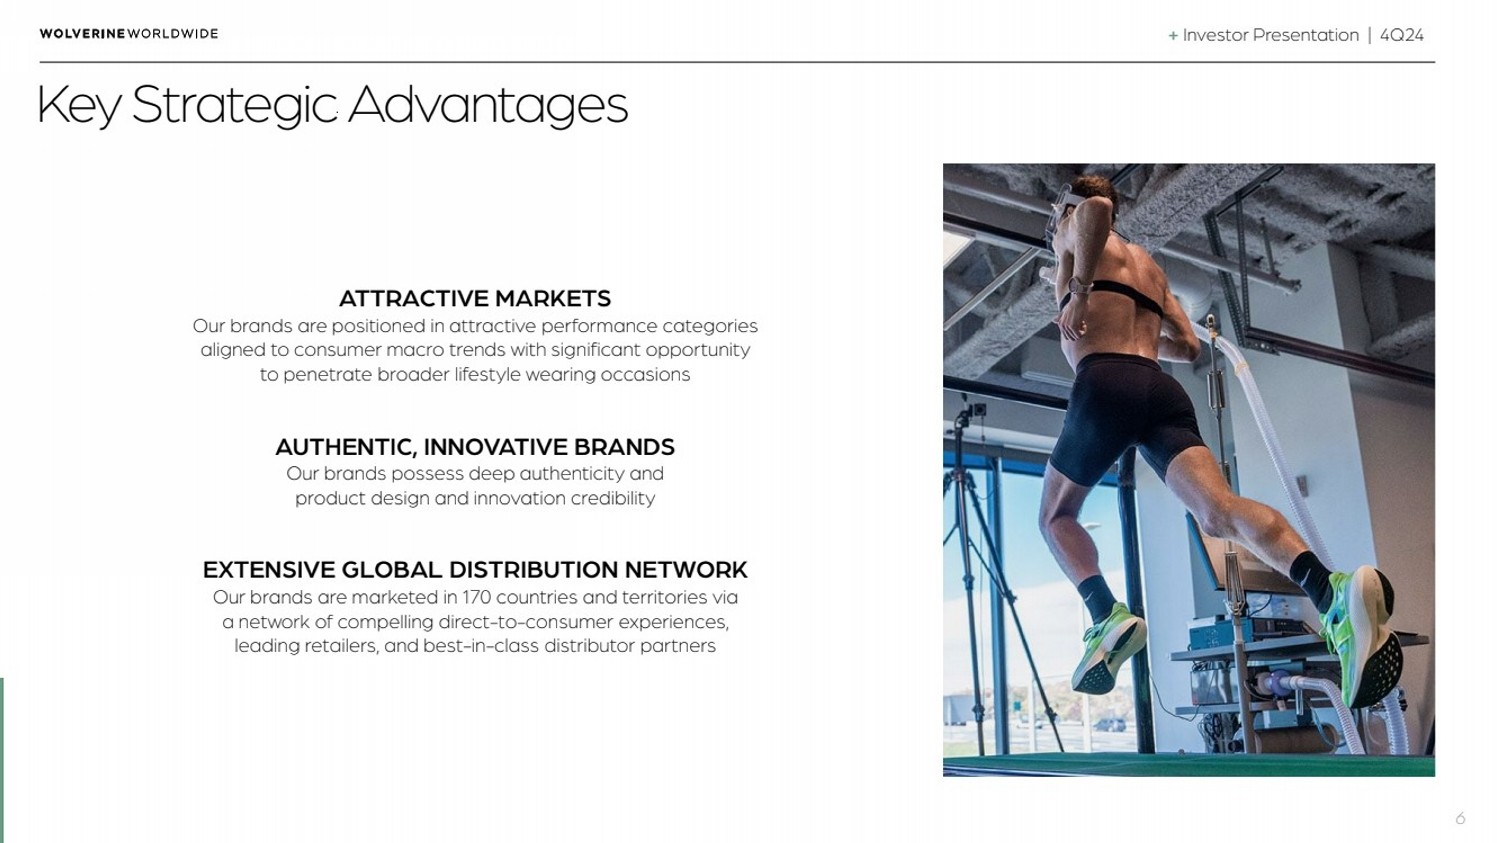
Key Strategic Advantages
ATTRACTIVE MARKETS
Our brands are positioned in attractive performance categories
aligned to consumer macro trends with significant opportunity
to penetrate broader lifestyle wearing occasions
AUTHENTIC, INNOVATIVE BRANDS
Our brands possess deep authenticity and
product design and innovation credibility
EXTENSIVE GLOBAL DISTRIBUTION NETWORK
Our brands are marketed in 170 countries and territories via
a network of compelling direct-to-consumer experiences,
leading retailers, and best-in-class distributor partners |
| + Investor Presentation | 4Q24
7
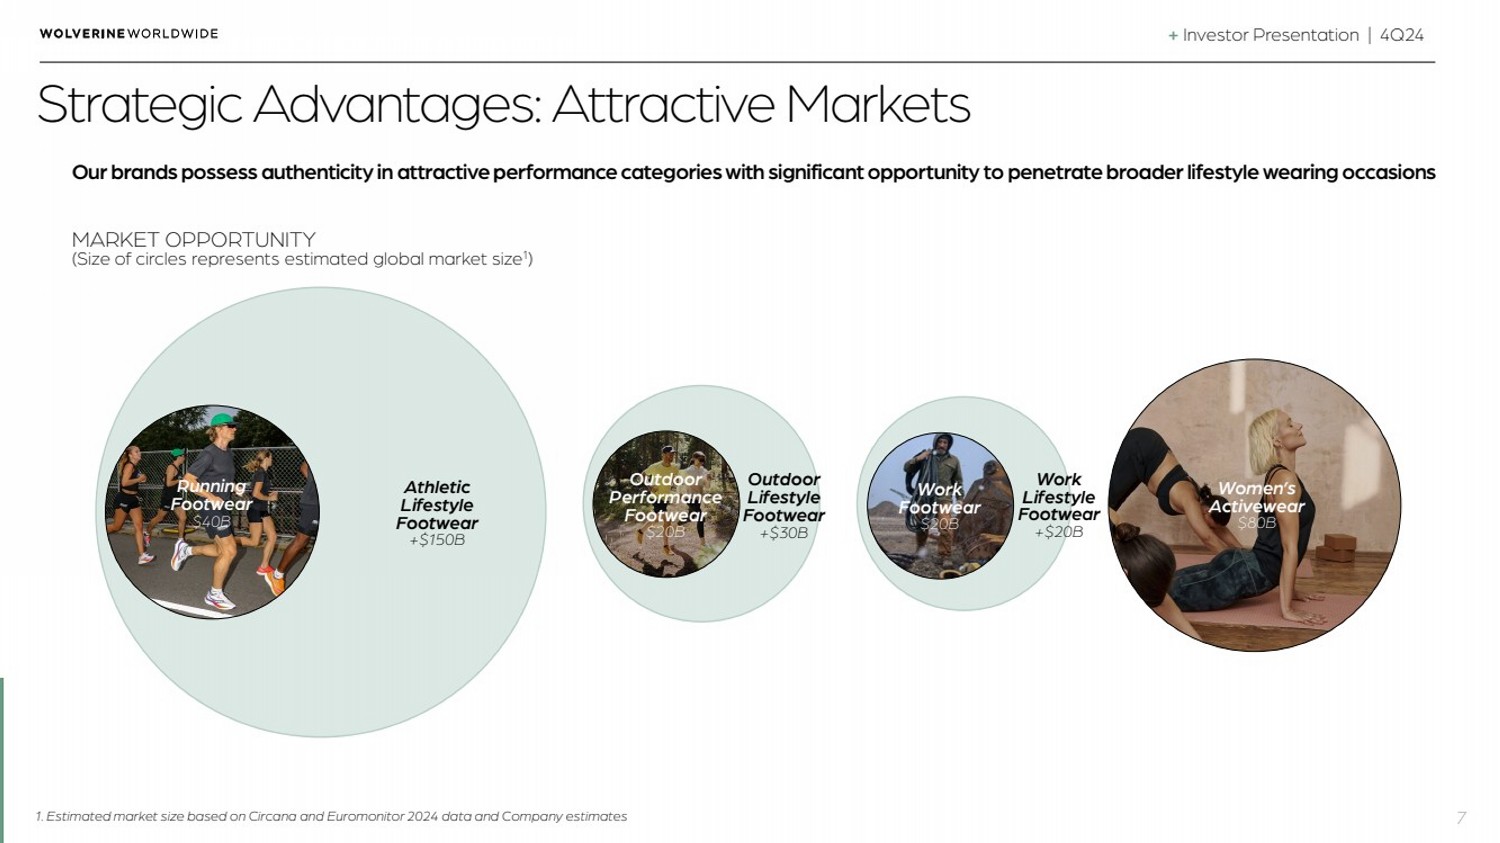
Strategic Advantages: Attractive Markets
Our brands possess authenticity in attractive performance categories with significant opportunity to penetrate broader lifestyle wearing occasions
Running
Footwear
$40B
Outdoor
Performance
Footwear
$20B
Women’s
Activewear
$80B
Athletic
Lifestyle
Footwear
+$150B
Work
Lifestyle
Footwear
+$20B
Work
Footwear
$20B
Outdoor
Lifestyle
Footwear
+$30B
1. Estimated market size based on Circana and Euromonitor 2024 data and Company estimates
MARKET OPPORTUNITY
(Size of circles represents estimated global market size1
) |

| + Investor Presentation | 4Q24
8
Strategic Advantages: Authentic, Innovative Brands
Additional Brands:
1. Source: Circana, LLC, Retail Tracking Service, US, Women’s Footwear, Hiking/Trekking/Mountaineering Class, Running & Running Specialty, and Work/Occupational/Safety Class, Type: Boots, Dollars Adjusted, Jan – Dec 2024
Global outdoor performance
and lifestyle brand
Est. 1983
SpeedARC Surge BOA®
Time’s Best Inventions & ISPO Award
#1
Hike1
Original work brand with
trusted comfort technology
Est. 1883
#1
Work
Boots1
Rancher Pro
HyperRest® cushioning
Nimbus Puffer
100% recycled waterproof fabric
Premium women’s
activewear brand
Est. 1998
Endorphin Elite 2
incrediRun superfoam
Original running brand
with renowned innovation
Est. 1898
Top
10
Run1 |
| + Investor Presentation | 4Q24
9
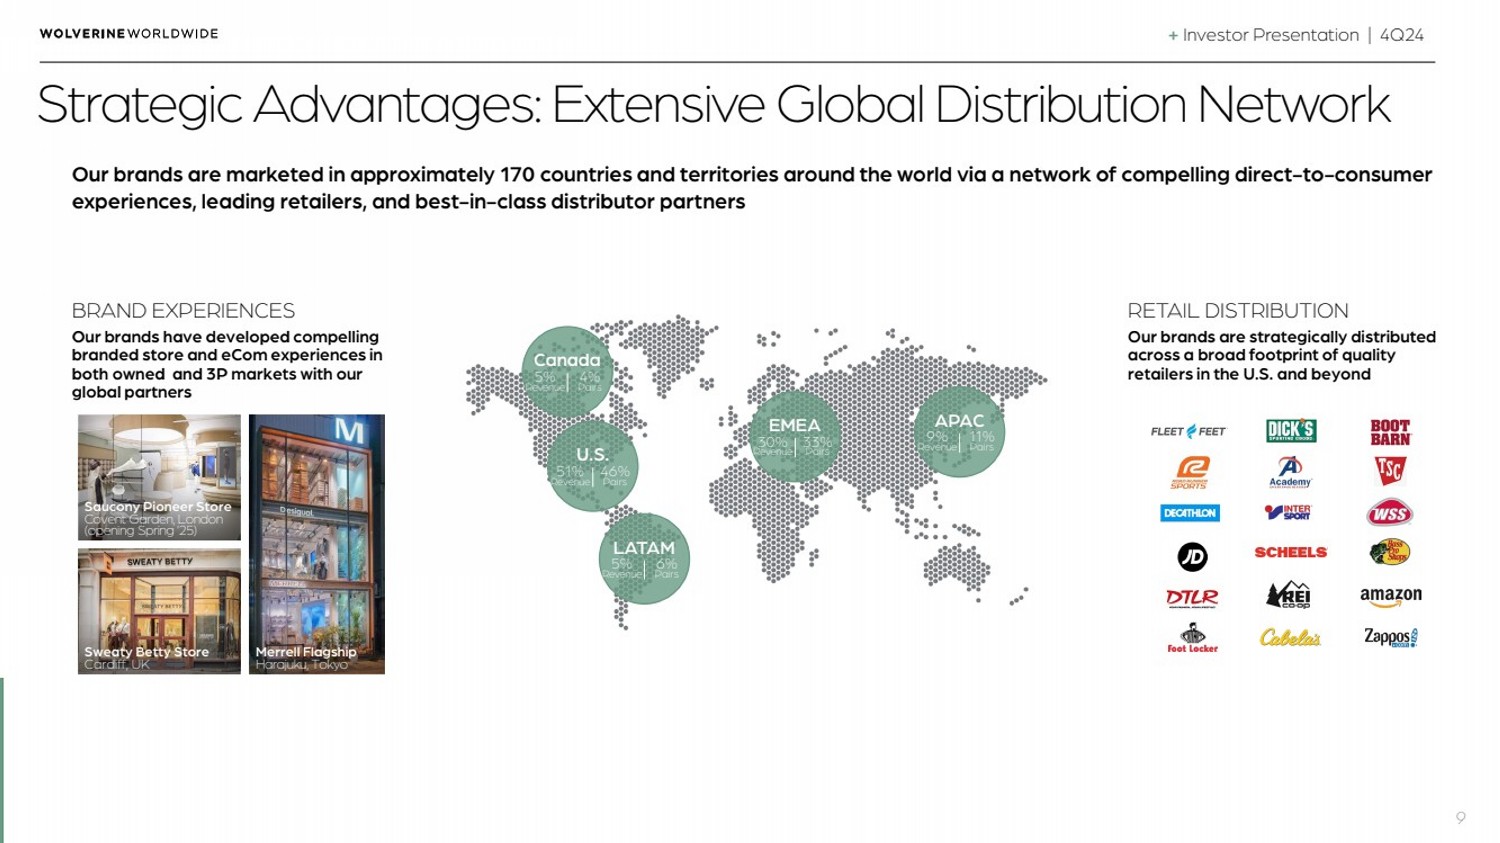
Strategic Advantages: Extensive Global Distribution Network
U.S.
51%
Revenue
46%
Pairs
Canada
5%
Revenue
4%
Pairs
LATAM
5%
Revenue
6%
Pairs
EMEA
30%
Revenue
33%
Pairs
APAC
9%
Revenue
11%
Pairs
Our brands are marketed in approximately 170 countries and territories around the world via a network of compelling direct-to-consumer
experiences, leading retailers, and best-in-class distributor partners
BRAND EXPERIENCES
Our brands have developed compelling
branded store and eCom experiences in
both owned and 3P markets with our
global partners
Saucony Pioneer Store
Covent Garden, London
(opening Spring ’25)
Sweaty Betty Store
Cardiff, UK
Merrell Flagship
Harajuku, Tokyo
RETAIL DISTRIBUTION
Our brands are strategically distributed
across a broad footprint of quality
retailers in the U.S. and beyond |

| + Investor Presentation | 4Q24
10
Financial Results & Outlook |
| + Investor Presentation | 4Q24
4Q24 Financial Results
11
Financial results for 2024, and comparable results from 2023, in
each case, for our ongoing business exclude the impact of Keds,
which was sold in February 2023, the U.S. Wolverine Leathers
business, which was sold in August 2023, the non-U.S. Wolverine
Leathers business, which was sold in December 2023, and the
Sperry business, which was sold in January 2024. Tables have been
provided in the back of this release showing the impact of these
adjustments on financial results for 2024 and 2023. |
| + Investor Presentation | 4Q24
12
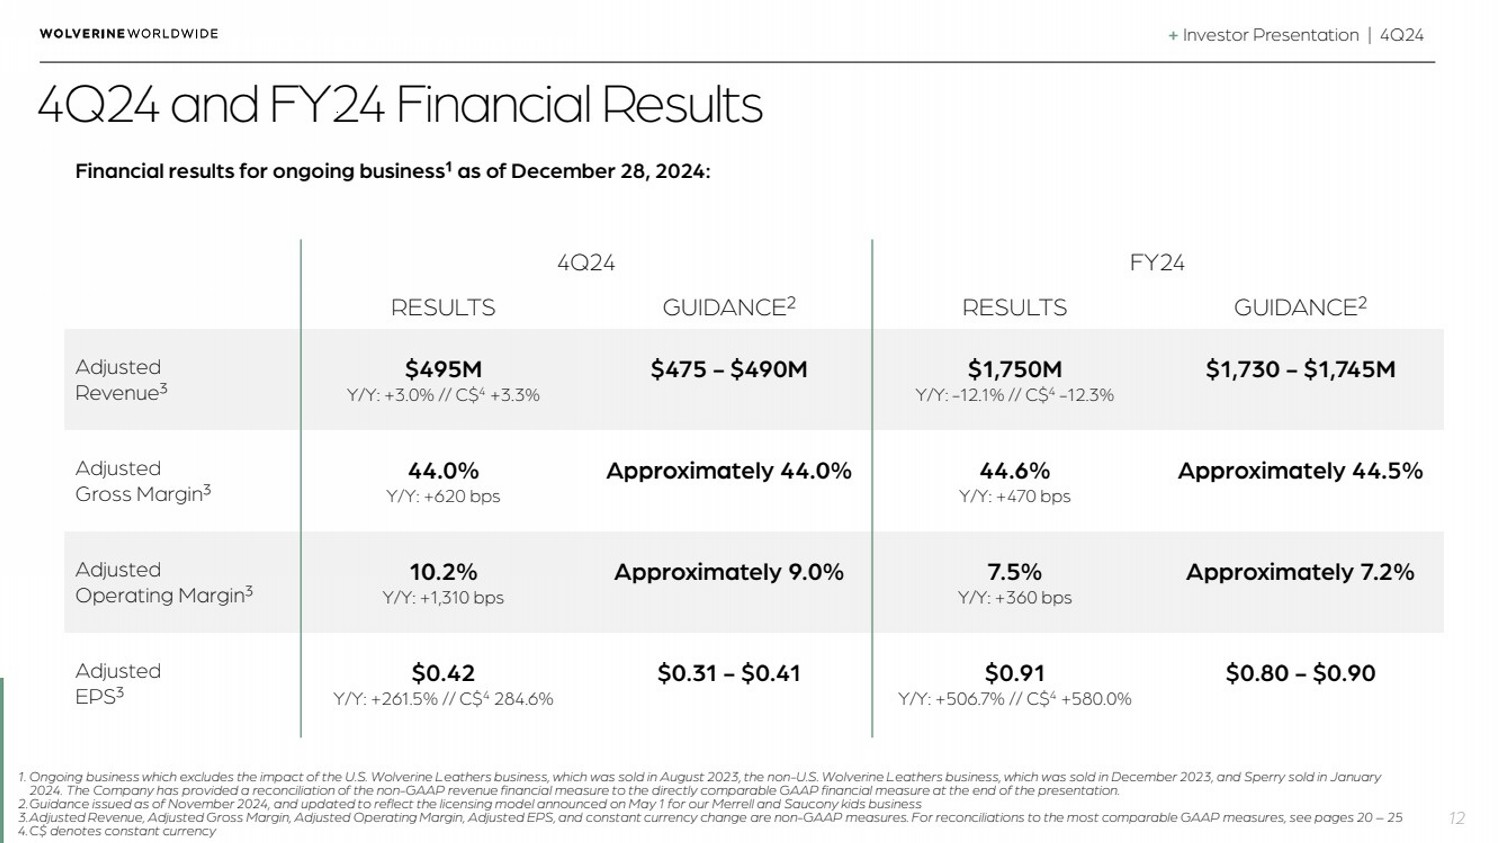
4Q24 and FY24 Financial Results
Financial results for ongoing business¹ as of December 28, 2024:
1. Ongoing business which excludes the impact of the U.S. Wolverine Leathers business, which was sold in August 2023, the non-U.S. Wolverine Leathers business, which was sold in December 2023, and Sperry sold in January
2024. The Company has provided a reconciliation of the non-GAAP revenue financial measure to the directly comparable GAAP financial measure at the end of the presentation.
2.Guidance issued as of November 2024, and updated to reflect the licensing model announced on May 1 for our Merrell and Saucony kids business
3.Adjusted Revenue, Adjusted Gross Margin, Adjusted Operating Margin, Adjusted EPS, and constant currency change are non-GAAP measures. For reconciliations to the most comparable GAAP measures, see pages 20 – 25
4.C$ denotes constant currency
4Q24 FY24
RESULTS GUIDANCE² RESULTS GUIDANCE²
Adjusted
Revenue³
$495M
Y/Y: +3.0% // C$4 +3.3%
$475 - $490M $1,750M
Y/Y: -12.1% // C$4 -12.3%
$1,730 - $1,745M
Adjusted
Gross Margin³
44.0%
Y/Y: +620 bps
Approximately 44.0% 44.6%
Y/Y: +470 bps
Approximately 44.5%
Adjusted
Operating Margin³
10.2%
Y/Y: +1,310 bps
Approximately 9.0% 7.5%
Y/Y: +360 bps
Approximately 7.2%
Adjusted
EPS³
$0.42
Y/Y: +261.5% // C$4 284.6%
$0.31 - $0.41 $0.91
Y/Y: +506.7% // C$4 +580.0%
$0.80 - $0.90 |
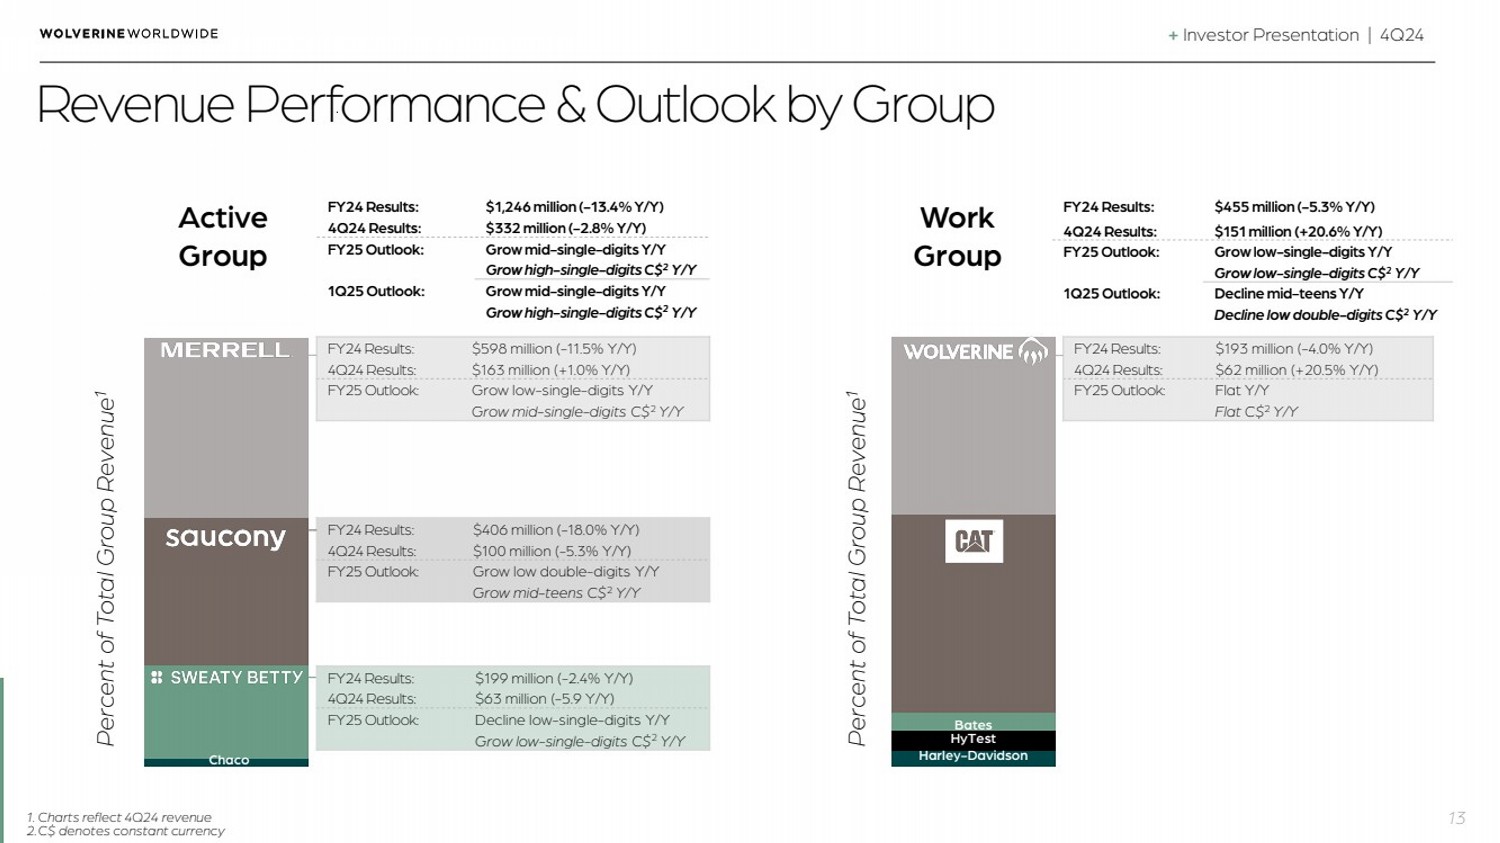
| + Investor Presentation | 4Q24
Revenue Performance & Outlook by Group
13
Active
Group
Work
Group
Bates
HyTest
Harley-Davidson
FY24 Results: $598 million (-11.5% Y/Y)
4Q24 Results: $163 million (+1.0% Y/Y)
FY25 Outlook: Grow low-single-digits Y/Y
Grow mid-single-digits C$2 Y/Y
FY24 Results: $406 million (-18.0% Y/Y)
4Q24 Results: $100 million (-5.3% Y/Y)
FY25 Outlook: Grow low double-digits Y/Y
Grow mid-teens C$2 Y/Y
FY24 Results: $193 million (-4.0% Y/Y)
4Q24 Results: $62 million (+20.5% Y/Y)
FY25 Outlook: Flat Y/Y
Flat C$2 Y/Y
FY24 Results: $1,246 million (-13.4% Y/Y)
4Q24 Results: $332 million (-2.8% Y/Y)
FY25 Outlook: Grow mid-single-digits Y/Y
Grow high-single-digits C$2 Y/Y
1Q25 Outlook: Grow mid-single-digits Y/Y
Grow high-single-digits C$2 Y/Y
FY24 Results: $455 million (-5.3% Y/Y)
4Q24 Results: $151 million (+20.6% Y/Y)
FY25 Outlook: Grow low-single-digits Y/Y
Grow low-single-digits C$2 Y/Y
1Q25 Outlook: Decline mid-teens Y/Y
Decline low double-digits C$2 Y/Y
Percent of Total Group Revenue¹
Percent of Total Group Revenue¹
FY24 Results: $199 million (-2.4% Y/Y)
4Q24 Results: $63 million (-5.9 Y/Y)
FY25 Outlook: Decline low-single-digits Y/Y
Grow low-single-digits C$2 Y/Y
Chaco
1. Charts reflect 4Q24 revenue
2.C$ denotes constant currency |
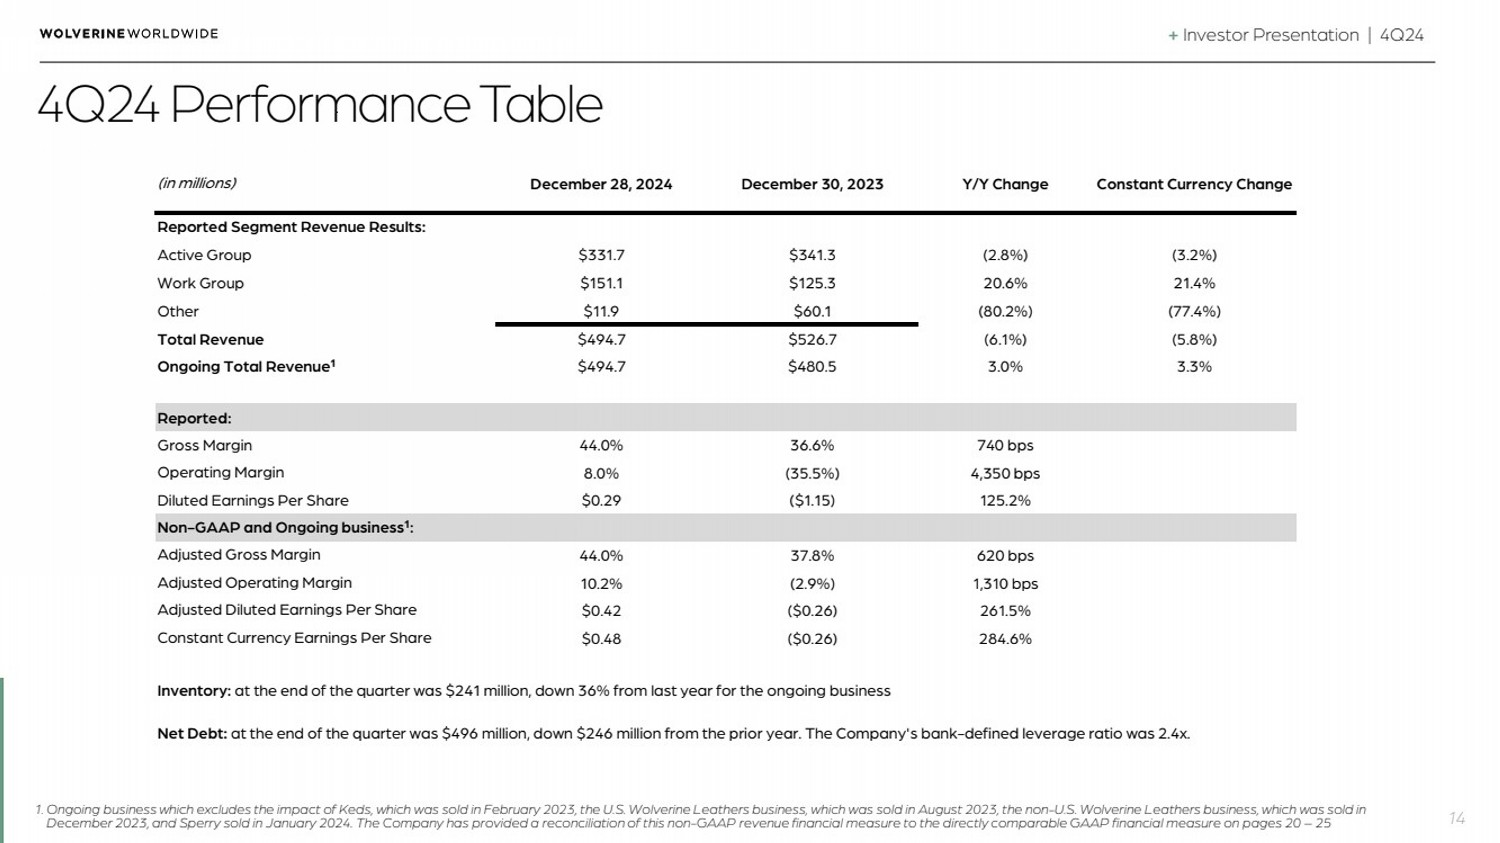
| + Investor Presentation | 4Q24
December 28, 2024 December 30, 2023 Y/Y Change Constant Currency Change
Active Group $331.7 $341.3 (2.8%) (3.2%)
Work Group $151.1 $125.3 20.6% 21.4%
Other $11.9 $60.1 (80.2%) (77.4%)
Total Revenue $494.7 $526.7 (6.1%) (5.8%)
Ongoing Total Revenue¹ $494.7 $480.5 3.0% 3.3%
Reported:
44.0% 36.6% 740 bps
8.0% (35.5%) 4,350 bps
$0.29 ($1.15) 125.2%
44.0% 37.8% 620 bps
10.2% (2.9%) 1,310 bps
$0.42 ($0.26) 261.5%
$0.48 ($0.26) 284.6%
Inventory: at the end of the quarter was $241 million, down 36% from last year for the ongoing business
Net Debt: at the end of the quarter was $496 million, down $246 million from the prior year. The Company's bank-defined leverage ratio was 2.4x.
Constant Currency Earnings Per Share
(in millions)
Reported Segment Revenue Results:
Gross Margin
Operating Margin
Diluted Earnings Per Share
Non-GAAP and Ongoing business¹:
Adjusted Gross Margin
Adjusted Operating Margin
Adjusted Diluted Earnings Per Share
4Q24 Performance Table
14 1. Ongoing business which excludes the impact of Keds, which was sold in February 2023, the U.S. Wolverine Leathers business, which was sold in August 2023, the non-U.S. Wolverine Leathers business, which was sold in
December 2023, and Sperry sold in January 2024. The Company has provided a reconciliation of this non-GAAP revenue financial measure to the directly comparable GAAP financial measure on pages 20 – 25 |
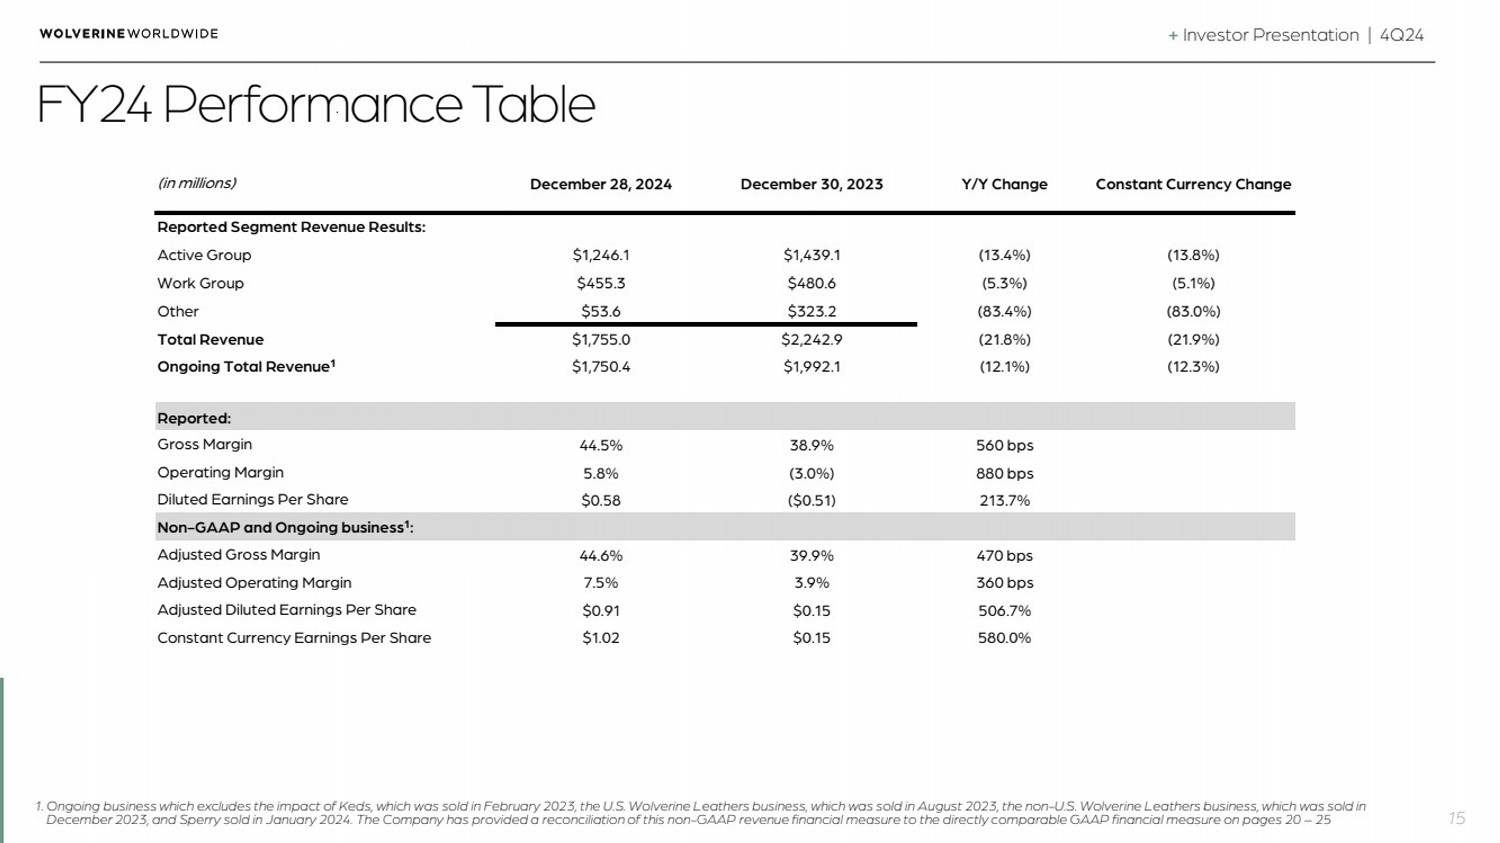
| + Investor Presentation | 4Q24
December 28, 2024 December 30, 2023 Y/Y Change Constant Currency Change
Active Group $1,246.1 $1,439.1 (13.4%) (13.8%)
Work Group $455.3 $480.6 (5.3%) (5.1%)
Other $53.6 $323.2 (83.4%) (83.0%)
Total Revenue $1,755.0 $2,242.9 (21.8%) (21.9%)
Ongoing Total Revenue¹ $1,750.4 $1,992.1 (12.1%) (12.3%)
Reported:
44.5% 38.9% 560 bps
5.8% (3.0%) 880 bps
$0.58 ($0.51) 213.7%
44.6% 39.9% 470 bps
7.5% 3.9% 360 bps
$0.91 $0.15 506.7%
$1.02 $0.15 580.0%
Non-GAAP and Ongoing business¹:
Adjusted Gross Margin
Adjusted Operating Margin
Adjusted Diluted Earnings Per Share
Constant Currency Earnings Per Share
(in millions)
Reported Segment Revenue Results:
Gross Margin
Operating Margin
Diluted Earnings Per Share
FY24 Performance Table
15
1. Ongoing business which excludes the impact of Keds, which was sold in February 2023, the U.S. Wolverine Leathers business, which was sold in August 2023, the non-U.S. Wolverine Leathers business, which was sold in
December 2023, and Sperry sold in January 2024. The Company has provided a reconciliation of this non-GAAP revenue financial measure to the directly comparable GAAP financial measure on pages 20 – 25 |
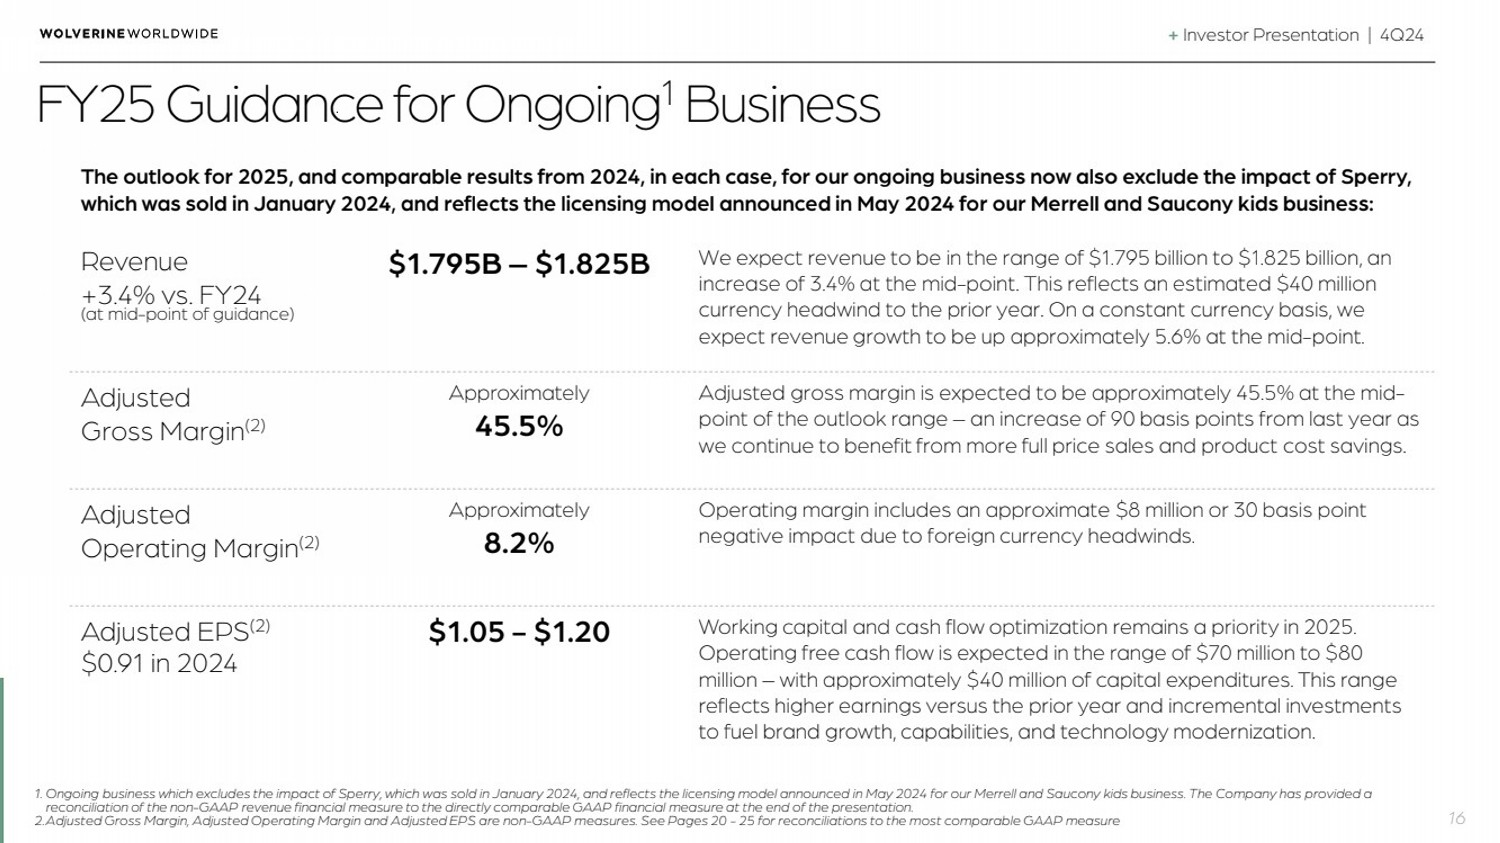
| + Investor Presentation | 4Q24
FY25 Guidance for Ongoing1Business
16
Revenue
+3.4% vs. FY24
(at mid-point of guidance)
$1.795B – $1.825B We expect revenue to be in the range of $1.795 billion to $1.825 billion, an
increase of 3.4% at the mid-point. This reflects an estimated $40 million
currency headwind to the prior year. On a constant currency basis, we
expect revenue growth to be up approximately 5.6% at the mid-point.
Adjusted
Gross Margin(2)
Approximately
45.5%
Adjusted gross margin is expected to be approximately 45.5% at the mid-point of the outlook range – an increase of 90 basis points from last year as
we continue to benefit from more full price sales and product cost savings.
Adjusted
Operating Margin(2)
Approximately
8.2%
Operating margin includes an approximate $8 million or 30 basis point
negative impact due to foreign currency headwinds.
Adjusted EPS(2)
$0.91 in 2024
$1.05 - $1.20 Working capital and cash flow optimization remains a priority in 2025.
Operating free cash flow is expected in the range of $70 million to $80
million – with approximately $40 million of capital expenditures. This range
reflects higher earnings versus the prior year and incremental investments
to fuel brand growth, capabilities, and technology modernization.
The outlook for 2025, and comparable results from 2024, in each case, for our ongoing business now also exclude the impact of Sperry,
which was sold in January 2024, and reflects the licensing model announced in May 2024 for our Merrell and Saucony kids business:
1. Ongoing business which excludes the impact of Sperry, which was sold in January 2024, and reflects the licensing model announced in May 2024 for our Merrell and Saucony kids business. The Company has provided a
reconciliation of the non-GAAP revenue financial measure to the directly comparable GAAP financial measure at the end of the presentation.
2.Adjusted Gross Margin, Adjusted Operating Margin and Adjusted EPS are non-GAAP measures. See Pages 20 - 25 for reconciliations to the most comparable GAAP measure |
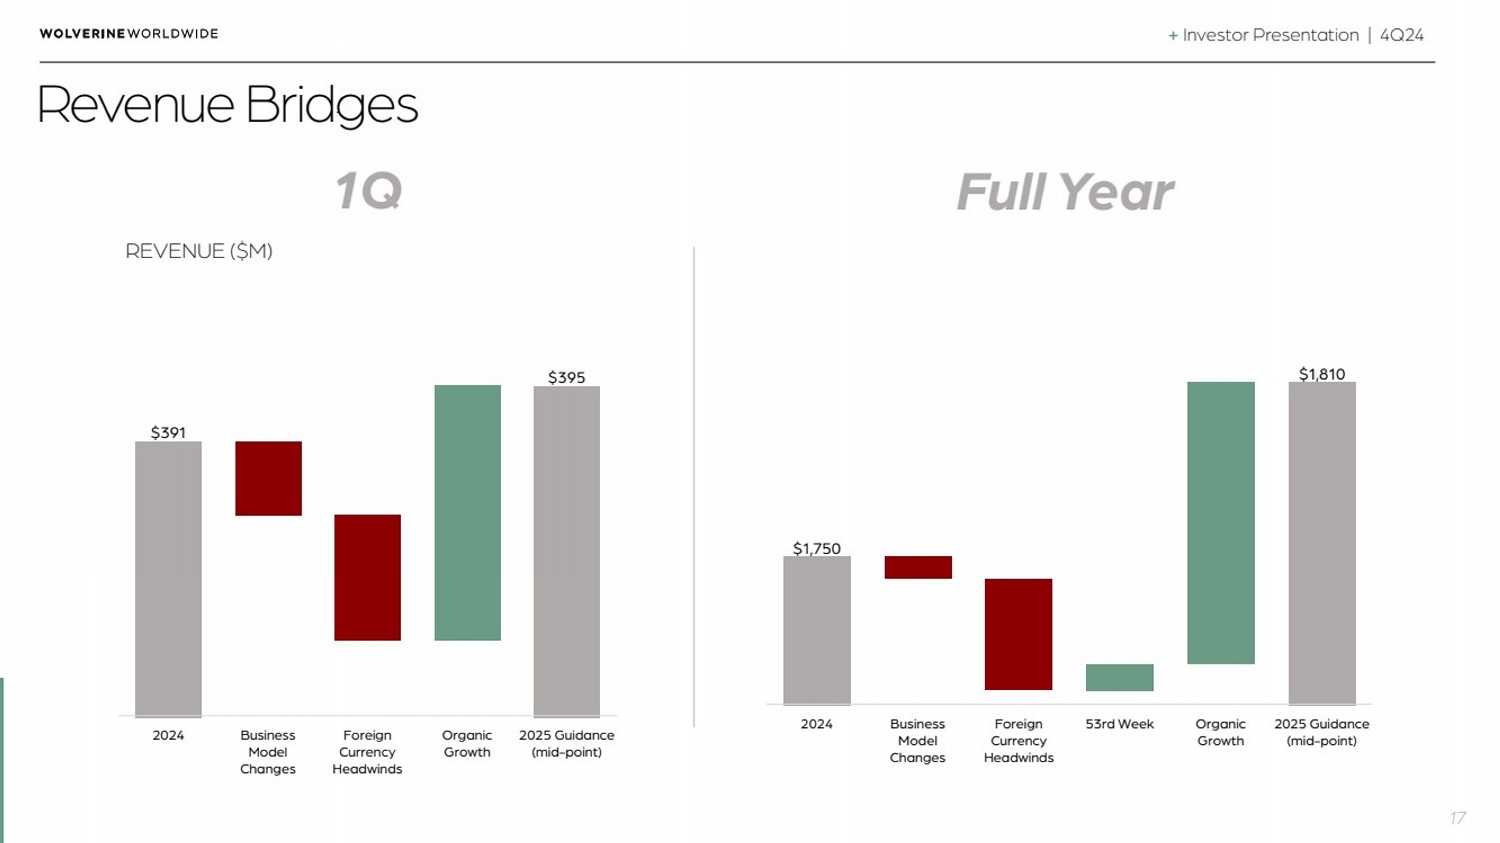
| + Investor Presentation | 4Q24
Revenue Bridges
17
REVENUE ($M)
1Q Full Year
$391
$395
2024 Business
Model
Changes
Foreign
Currency
Headwinds
Organic
Growth
2025 Guidance
(mid-point)
$1,750
$1,810
2024 Business
Model
Changes
Foreign
Currency
Headwinds
53rd Week Organic
Growth
2025 Guidance
(mid-point) |

| + Investor Presentation | 4Q24
18
Supplemental & Non-GAAP Reconciliation Tables |
| +
Investor Presentation | 4Q24
Non
-GAAP Information
19
Measures referred to in this release as “adjusted” financial results and the financial
results of the "ongoing business" are non
-GAAP measures
. Adjusted financial results
exclude environmental and other related costs net of recoveries, non
-cash
impairment of long
-lived assets, reorganization costs, gain on the sale of businesses,
trademarks and long
-lived assets, Sperry® store closure costs, costs associated
with divestitures and pension costs
. The financial results of the ongoing business
exclude financial results from the Keds business, Sperry business and Wolverine
Leathers business prior to the respective dates of sale of such businesses
. Revenue
adjusted for divestitures and business model changes exclude financial results from
the Keds business, Sperry business and Wolverine Leathers business prior to the
respective dates of sale of such businesses and are adjusted to include the impact of
business model changes in 2023 (the transition of Hush Puppies North America to
a
licensing model, Hush Puppies IP sale, and conversion of the China joint ventures to
the distributor model) and business model changes in 2024 (the transition of Merrell
and Saucony Kids to
a licensing model)
. The Company also presents constant
currency information, which is
a non
-GAAP measure that excludes the impact of
fluctuations in foreign currency exchange rates
. The Company calculates constant
currency basis by converting the current
-period local currency financial results using
the prior period exchange rates and comparing these adjusted amounts to the
Company's current period reported results
. The Company believes providing each of
these non
-GAAP measures provides valuable supplemental information regarding
its results of operations, consistent with how the Company evaluates performance
.
The Company has provided
a reconciliation of each of the above non
-GAAP
financial measures to the most directly comparable GAAP financial measure
. The
Company believes these non
-GAAP measures provide useful information to both
management and investors because they increase the comparability of current
period results to prior period results by adjusting for certain items that may not be
indicative of core operating results and enable better identification of trends in our
business
. The adjusted financial results are used by management to, and allow
investors to, evaluate the operating performance of the Company on
a comparable
basis
. Management does not, nor should investors, consider such non
-GAAP
financial measures in isolation from, or as
a substitute for, financial information
prepared in accordance with GAAP
. |
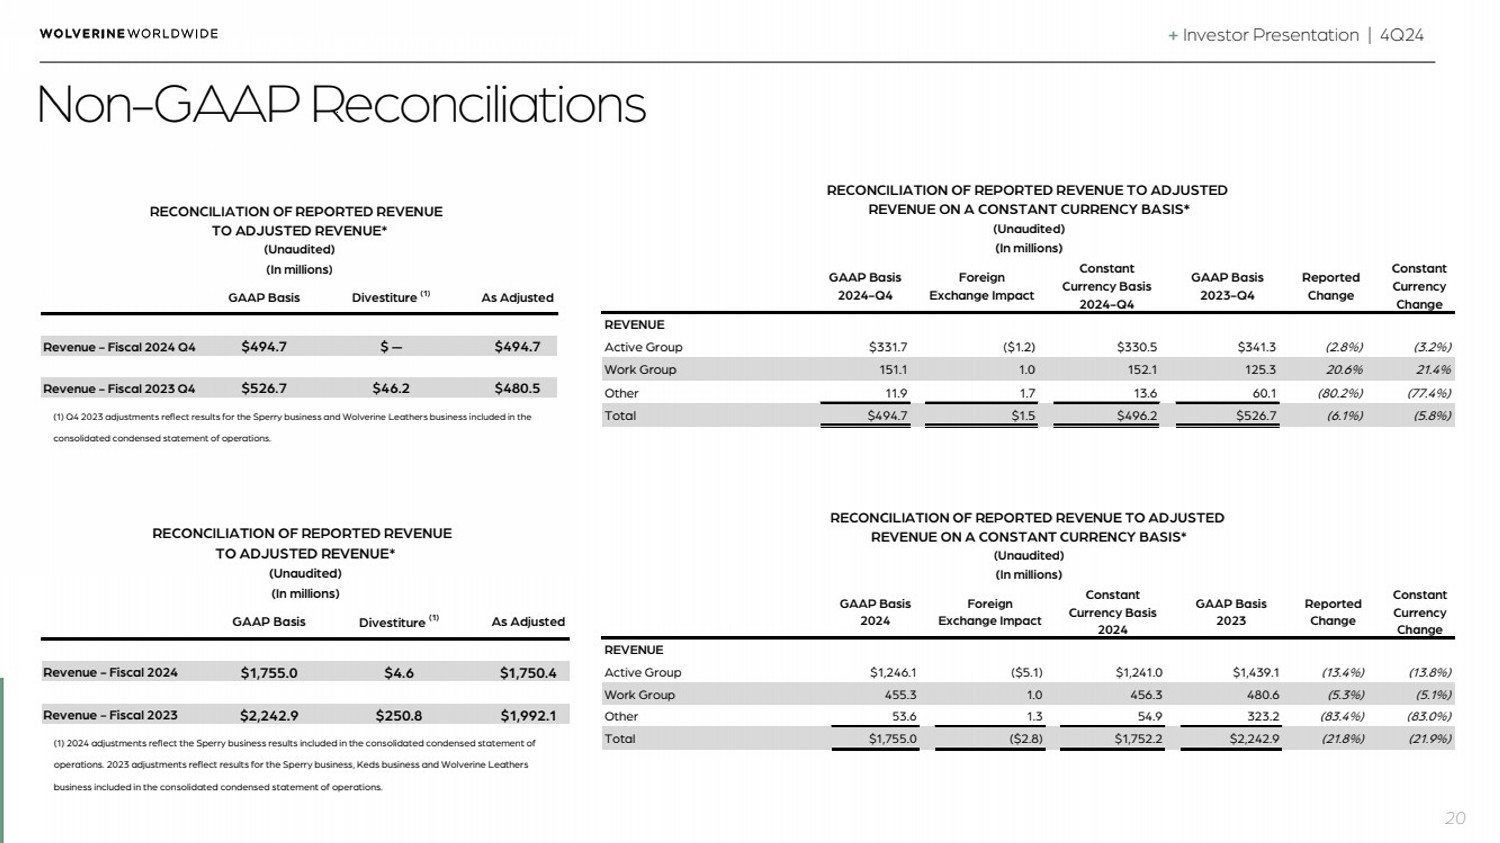
| + Investor Presentation | 4Q24
GAAP Basis
2024-Q4
Foreign
Exchange Impact
Constant
Currency Basis
2024-Q4
GAAP Basis
2023-Q4
Reported
Change
Constant
Currency
Change
REVENUE
Active Group $331.7 ($1.2) $330.5 $341.3 (2.8%) (3.2%)
Work Group 151.1 1.0 152.1 125.3 20.6% 21.4%
Other 11.9 1.7 13.6 60.1 (80.2%) (77.4%)
Total $494.7 $1.5 $496.2 $526.7 (6.1%) (5.8%)
REVENUE ON A CONSTANT CURRENCY BASIS*
(Unaudited)
(In millions)
RECONCILIATION OF REPORTED REVENUE TO ADJUSTED
GAAP Basis
2024
Foreign
Exchange Impact
Constant
Currency Basis
2024
GAAP Basis
2023
Reported
Change
Constant
Currency
Change
REVENUE
Active Group $1,246.1 ($5.1) $1,241.0 $1,439.1 (13.4%) (13.8%)
Work Group 455.3 1.0 456.3 480.6 (5.3%) (5.1%)
Other 53.6 1.3 54.9 323.2 (83.4%) (83.0%)
Total $1,755.0 ($2.8) $1,752.2 $2,242.9 (21.8%) (21.9%)
RECONCILIATION OF REPORTED REVENUE TO ADJUSTED
REVENUE ON A CONSTANT CURRENCY BASIS*
(Unaudited)
(In millions)
GAAP Basis Divestiture (1) As Adjusted
Revenue - Fiscal 2024 $1,755.0 $4.6 $1,750.4
Revenue - Fiscal 2023 $2,242.9 $250.8 $1,992.1
RECONCILIATION OF REPORTED REVENUE
TO ADJUSTED REVENUE*
(Unaudited)
(In millions)
(1) 2024 adjustments reflect the Sperry business results included in the consolidated condensed statement of
operations. 2023 adjustments reflect results for the Sperry business, Keds business and Wolverine Leathers
business included in the consolidated condensed statement of operations.
GAAP Basis Divestiture (1) As Adjusted
Revenue - Fiscal 2024 Q4 $494.7 $ — $494.7
Revenue - Fiscal 2023 Q4 $526.7 $46.2 $480.5
(1) Q4 2023 adjustments reflect results for the Sperry business and Wolverine Leathers business included in the
consolidated condensed statement of operations.
RECONCILIATION OF REPORTED REVENUE
TO ADJUSTED REVENUE*
(Unaudited)
(In millions)
Non-GAAP Reconciliations
20 |
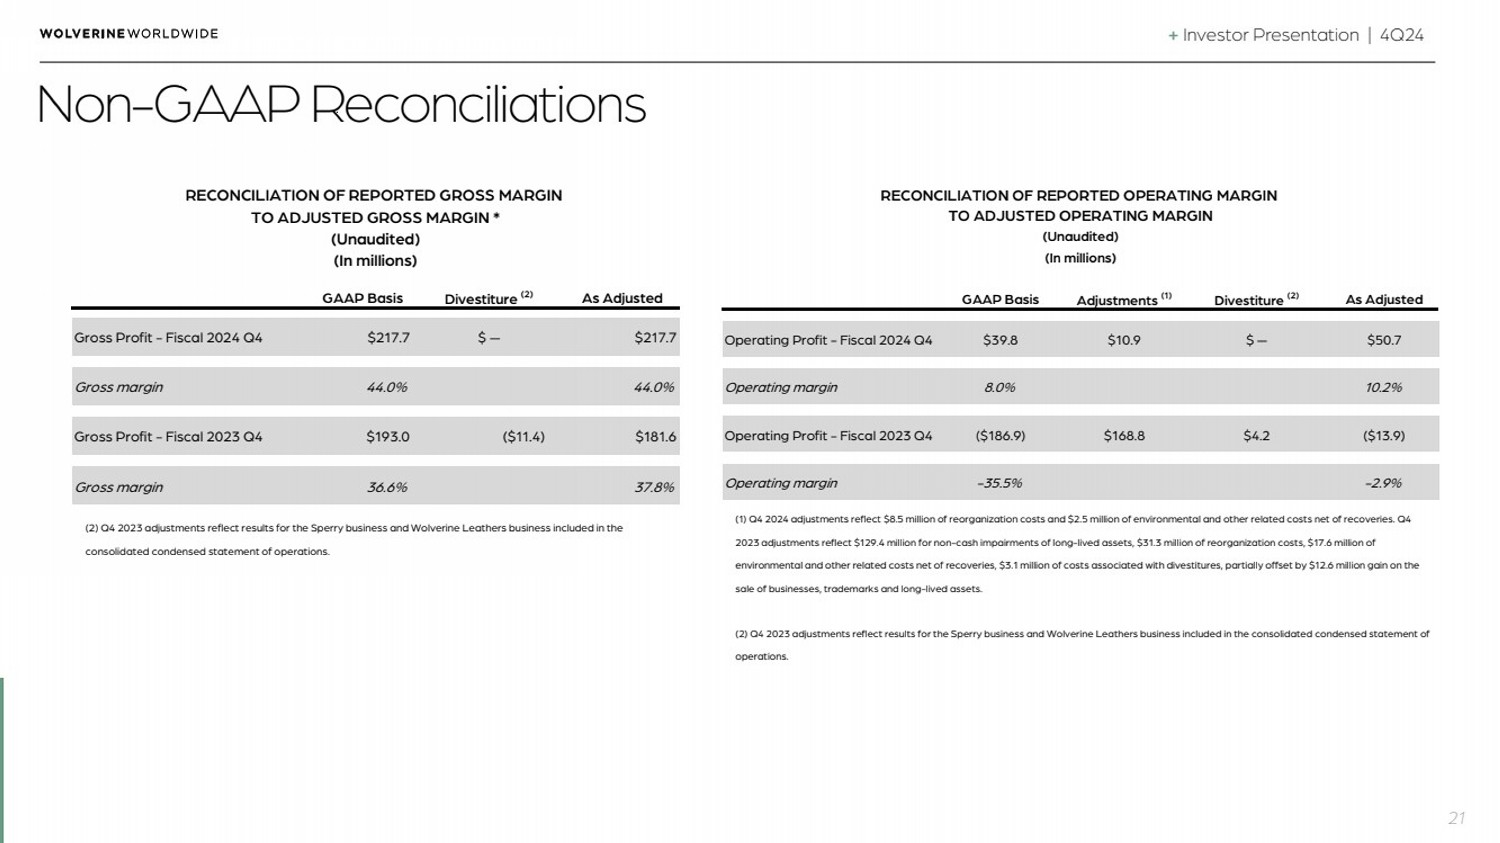
| + Investor Presentation | 4Q24
GAAP Basis Divestiture (2) As Adjusted
Gross Profit - Fiscal 2024 Q4 $217.7 $ — $217.7
Gross margin 44.0% 44.0%
Gross Profit - Fiscal 2023 Q4 $193.0 ($11.4) $181.6
Gross margin 36.6% 37.8%
(2) Q4 2023 adjustments reflect results for the Sperry business and Wolverine Leathers business included in the
consolidated condensed statement of operations.
RECONCILIATION OF REPORTED GROSS MARGIN
TO ADJUSTED GROSS MARGIN *
(Unaudited)
(In millions)
GAAP Basis Adjustments (1) Divestiture (2) As Adjusted
Operating Profit - Fiscal 2024 Q4 $39.8 $10.9 $ — $50.7
Operating margin 8.0% 10.2%
Operating Profit - Fiscal 2023 Q4 ($186.9) $168.8 $4.2 ($13.9)
Operating margin -35.5% -2.9%
(2) Q4 2023 adjustments reflect results for the Sperry business and Wolverine Leathers business included in the consolidated condensed statement of
operations.
RECONCILIATION OF REPORTED OPERATING MARGIN
TO ADJUSTED OPERATING MARGIN
(Unaudited)
(In millions)
(1) Q4 2024 adjustments reflect $8.5 million of reorganization costs and $2.5 million of environmental and other related costs net of recoveries. Q4
2023 adjustments reflect $129.4 million for non-cash impairments of long-lived assets, $31.3 million of reorganization costs, $17.6 million of
environmental and other related costs net of recoveries, $3.1 million of costs associated with divestitures, partially offset by $12.6 million gain on the
sale of businesses, trademarks and long-lived assets.
Non-GAAP Reconciliations
21 |
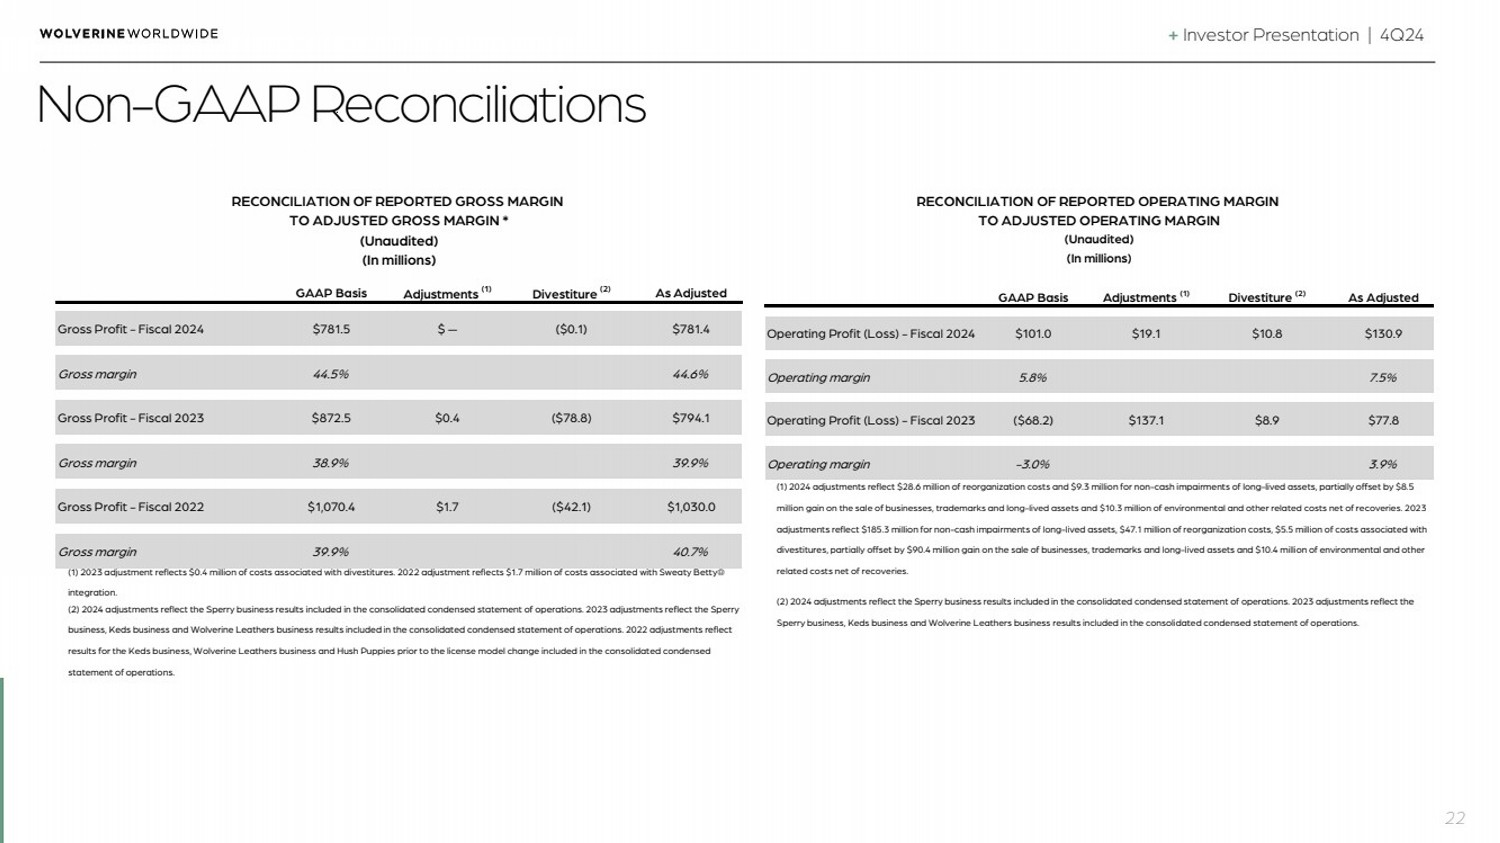
| + Investor Presentation | 4Q24
GAAP Basis Adjustments (1) Divestiture (2) As Adjusted
Gross Profit - Fiscal 2024 $781.5 $ — ($0.1) $781.4
Gross margin 44.5% 44.6%
Gross Profit - Fiscal 2023 $872.5 $0.4 ($78.8) $794.1
Gross margin 38.9% 39.9%
Gross Profit - Fiscal 2022 $1,070.4 $1.7 ($42.1) $1,030.0
Gross margin 39.9% 40.7%
RECONCILIATION OF REPORTED GROSS MARGIN
TO ADJUSTED GROSS MARGIN *
(Unaudited)
(In millions)
(1) 2023 adjustment reflects $0.4 million of costs associated with divestitures. 2022 adjustment reflects $1.7 million of costs associated with Sweaty Betty®
integration.
(2) 2024 adjustments reflect the Sperry business results included in the consolidated condensed statement of operations. 2023 adjustments reflect the Sperry
business, Keds business and Wolverine Leathers business results included in the consolidated condensed statement of operations. 2022 adjustments reflect
results for the Keds business, Wolverine Leathers business and Hush Puppies prior to the license model change included in the consolidated condensed
statement of operations.
GAAP Basis Adjustments (1) Divestiture (2) As Adjusted
Operating Profit (Loss) - Fiscal 2024 $101.0 $19.1 $10.8 $130.9
Operating margin 5.8% 7.5%
Operating Profit (Loss) - Fiscal 2023 ($68.2) $137.1 $8.9 $77.8
Operating margin -3.0% 3.9%
(2) 2024 adjustments reflect the Sperry business results included in the consolidated condensed statement of operations. 2023 adjustments reflect the
Sperry business, Keds business and Wolverine Leathers business results included in the consolidated condensed statement of operations.
RECONCILIATION OF REPORTED OPERATING MARGIN
TO ADJUSTED OPERATING MARGIN
(Unaudited)
(In millions)
(1) 2024 adjustments reflect $28.6 million of reorganization costs and $9.3 million for non-cash impairments of long-lived assets, partially offset by $8.5
million gain on the sale of businesses, trademarks and long-lived assets and $10.3 million of environmental and other related costs net of recoveries. 2023
adjustments reflect $185.3 million for non-cash impairments of long-lived assets, $47.1 million of reorganization costs, $5.5 million of costs associated with
divestitures, partially offset by $90.4 million gain on the sale of businesses, trademarks and long-lived assets and $10.4 million of environmental and other
related costs net of recoveries.
Non-GAAP Reconciliations
22 |
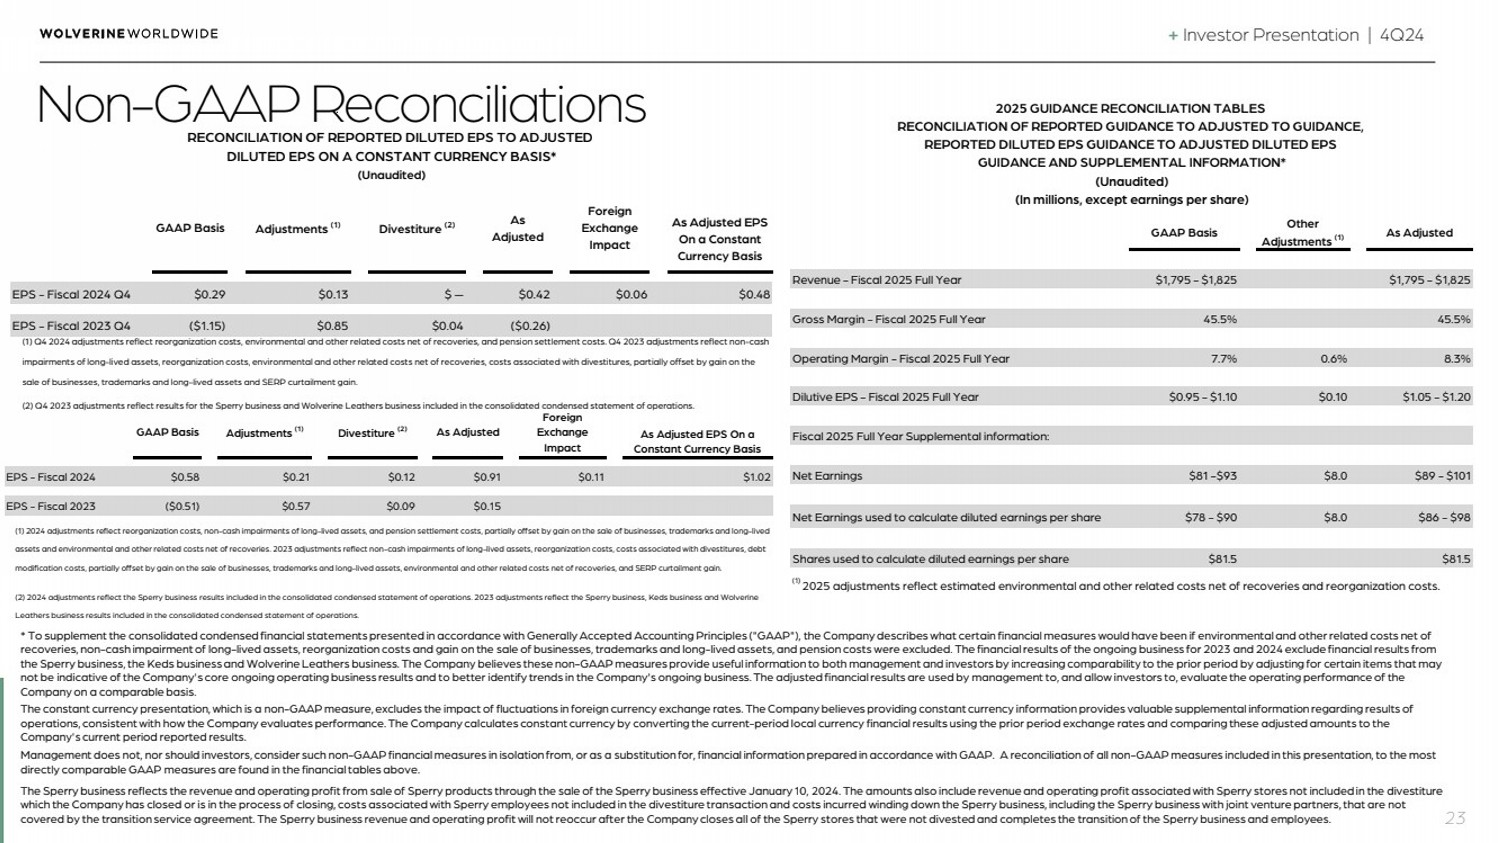
| + Investor Presentation | 4Q24
GAAP Basis
Other
Adjustments (1) As Adjusted
Revenue - Fiscal 2025 Full Year $1,795 - $1,825 $1,795 - $1,825
Gross Margin - Fiscal 2025 Full Year 45.5% 45.5%
Operating Margin - Fiscal 2025 Full Year 7.7% 0.6% 8.3%
Dilutive EPS - Fiscal 2025 Full Year $0.95 - $1.10 $0.10 $1.05 - $1.20
Fiscal 2025 Full Year Supplemental information:
Net Earnings $81 -$93 $8.0 $89 - $101
Net Earnings used to calculate diluted earnings per share $78 - $90 $8.0 $86 - $98
Shares used to calculate diluted earnings per share $81.5 $81.5
(1) 2025 adjustments reflect estimated environmental and other related costs net of recoveries and reorganization costs.
2025 GUIDANCE RECONCILIATION TABLES
RECONCILIATION OF REPORTED GUIDANCE TO ADJUSTED TO GUIDANCE,
REPORTED DILUTED EPS GUIDANCE TO ADJUSTED DILUTED EPS
GUIDANCE AND SUPPLEMENTAL INFORMATION*
(Unaudited)
(In millions, except earnings per share)
As Adjusted EPS On a
Constant Currency Basis
EPS - Fiscal 2024 $0.58 $0.21 $0.12 $0.91 $0.11 $1.02
EPS - Fiscal 2023 ($0.51) $0.57 $0.09 $0.15
As Adjusted
(1) 2024 adjustments reflect reorganization costs, non-cash impairments of long-lived assets, and pension settlement costs, partially offset by gain on the sale of businesses, trademarks and long-lived
assets and environmental and other related costs net of recoveries. 2023 adjustments reflect non-cash impairments of long-lived assets, reorganization costs, costs associated with divestitures, debt
modification costs, partially offset by gain on the sale of businesses, trademarks and long-lived assets, environmental and other related costs net of recoveries, and SERP curtailment gain.
(2) 2024 adjustments reflect the Sperry business results included in the consolidated condensed statement of operations. 2023 adjustments reflect the Sperry business, Keds business and Wolverine
Leathers business results included in the consolidated condensed statement of operations.
GAAP Basis Adjustments (1) Divestiture (2)
Foreign
Exchange
Impact
As Adjusted EPS
On a Constant
Currency Basis
EPS - Fiscal 2024 Q4 $0.29 $0.13 $ — $0.42 $0.06 $0.48
EPS - Fiscal 2023 Q4 ($1.15) $0.85 $0.04 ($0.26)
(1) Q4 2024 adjustments reflect reorganization costs, environmental and other related costs net of recoveries, and pension settlement costs. Q4 2023 adjustments reflect non-cash
impairments of long-lived assets, reorganization costs, environmental and other related costs net of recoveries, costs associated with divestitures, partially offset by gain on the
sale of businesses, trademarks and long-lived assets and SERP curtailment gain.
(2) Q4 2023 adjustments reflect results for the Sperry business and Wolverine Leathers business included in the consolidated condensed statement of operations.
RECONCILIATION OF REPORTED DILUTED EPS TO ADJUSTED
DILUTED EPS ON A CONSTANT CURRENCY BASIS*
(Unaudited)
GAAP Basis Adjustments (1) Divestiture (2) As
Adjusted
Foreign
Exchange
Impact
Non-GAAP Reconciliations
23
* To supplement the consolidated condensed financial statements presented in accordance with Generally Accepted Accounting Principles ("GAAP"), the Company describes what certain financial measures would have been if environmental and other related costs net of
recoveries, non-cash impairment of long-lived assets, reorganization costs and gain on the sale of businesses, trademarks and long-lived assets, and pension costs were excluded. The financial results of the ongoing business for 2023 and 2024 exclude financial results from
the Sperry business, the Keds business and Wolverine Leathers business. The Company believes these non-GAAP measures provide useful information to both management and investors by increasing comparability to the prior period by adjusting for certain items that may
not be indicative of the Company's core ongoing operating business results and to better identify trends in the Company's ongoing business. The adjusted financial results are used by management to, and allow investors to, evaluate the operating performance of the
Company on a comparable basis.
The constant currency presentation, which is a non-GAAP measure, excludes the impact of fluctuations in foreign currency exchange rates. The Company believes providing constant currency information provides valuable supplemental information regarding results of
operations, consistent with how the Company evaluates performance. The Company calculates constant currency by converting the current-period local currency financial results using the prior period exchange rates and comparing these adjusted amounts to the
Company's current period reported results.
Management does not, nor should investors, consider such non-GAAP financial measures in isolation from, or as a substitution for, financial information prepared in accordance with GAAP. A reconciliation of all non-GAAP measures included in this presentation, to the most
directly comparable GAAP measures are found in the financial tables above.
The Sperry business reflects the revenue and operating profit from sale of Sperry products through the sale of the Sperry business effective January 10, 2024. The amounts also include revenue and operating profit associated with Sperry stores not included in the divestiture
which the Company has closed or is in the process of closing, costs associated with Sperry employees not included in the divestiture transaction and costs incurred winding down the Sperry business, including the Sperry business with joint venture partners,that are not
covered by the transition service agreement. The Sperry business revenue and operating profit will not reoccur after the Company closes all of the Sperry stores that were not divested and completes the transition of the Sperry business and employees. |
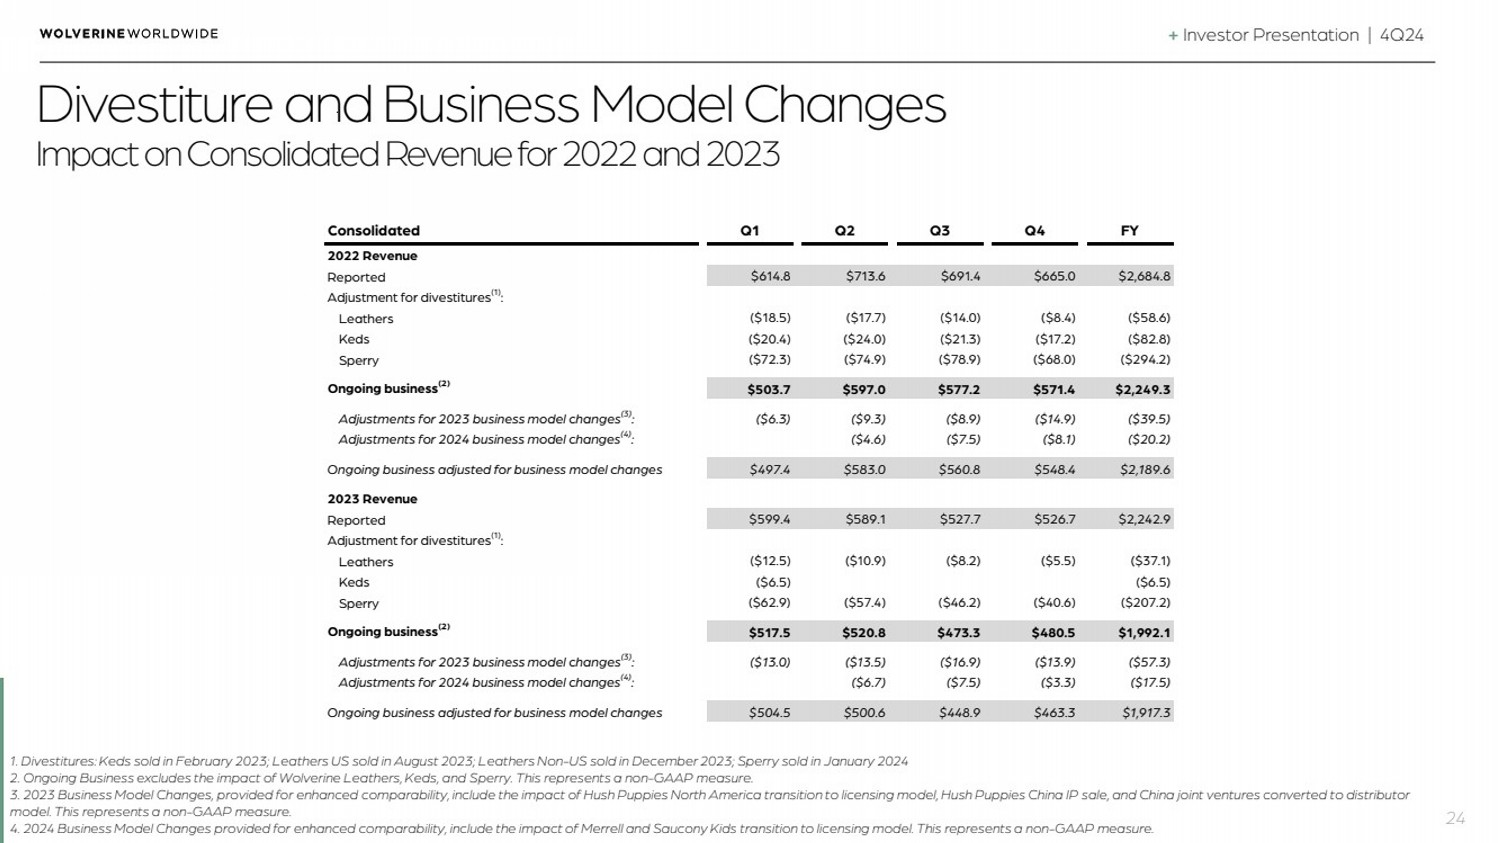
| + Investor Presentation | 4Q24
Divestiture and Business Model Changes
Impact on Consolidated Revenue for 2022 and 2023
24
1. Divestitures: Keds sold in February 2023; Leathers US sold in August 2023; Leathers Non-US sold in December 2023; Sperry sold in January 2024
2. Ongoing Business excludes the impact of Wolverine Leathers, Keds, and Sperry. This represents a non-GAAP measure.
3. 2023 Business Model Changes, provided for enhanced comparability, include the impact of Hush Puppies North America transition to licensing model, Hush Puppies China IP sale, and China joint ventures converted to distributor
model. This represents a non-GAAP measure.
4. 2024 Business Model Changes provided for enhanced comparability, include the impact of Merrell and Saucony Kids transition to licensing model. This represents a non-GAAP measure.
Consolidated Q1 Q2 Q3 Q4 FY
2022 Revenue
Reported $614.8 $713.6 $691.4 $665.0 $2,684.8
Adjustment for divestitures(1):
Leathers ($18.5) ($17.7) ($14.0) ($8.4) ($58.6)
Keds ($20.4) ($24.0) ($21.3) ($17.2) ($82.8)
Sperry ($72.3) ($74.9) ($78.9) ($68.0) ($294.2)
Ongoing business(2) $503.7 $597.0 $577.2 $571.4 $2,249.3
Adjustments for 2023 business model changes(3): ($6.3) ($9.3) ($8.9) ($14.9) ($39.5)
Adjustments for 2024 business model changes(4): ($4.6) ($7.5) ($8.1) ($20.2)
Ongoing business adjusted for business model changes $497.4 $583.0 $560.8 $548.4 $2,189.6
2023 Revenue
Reported $599.4 $589.1 $527.7 $526.7 $2,242.9
Adjustment for divestitures(1):
Leathers ($12.5) ($10.9) ($8.2) ($5.5) ($37.1)
Keds ($6.5) ($6.5)
Sperry ($62.9) ($57.4) ($46.2) ($40.6) ($207.2)
Ongoing business(2) $517.5 $520.8 $473.3 $480.5 $1,992.1
Adjustments for 2023 business model changes(3): ($13.0) ($13.5) ($16.9) ($13.9) ($57.3)
Adjustments for 2024 business model changes(4): ($6.7) ($7.5) ($3.3) ($17.5)
Ongoing business adjusted for business model changes $504.5 $500.6 $448.9 $463.3 $1,917.3 |
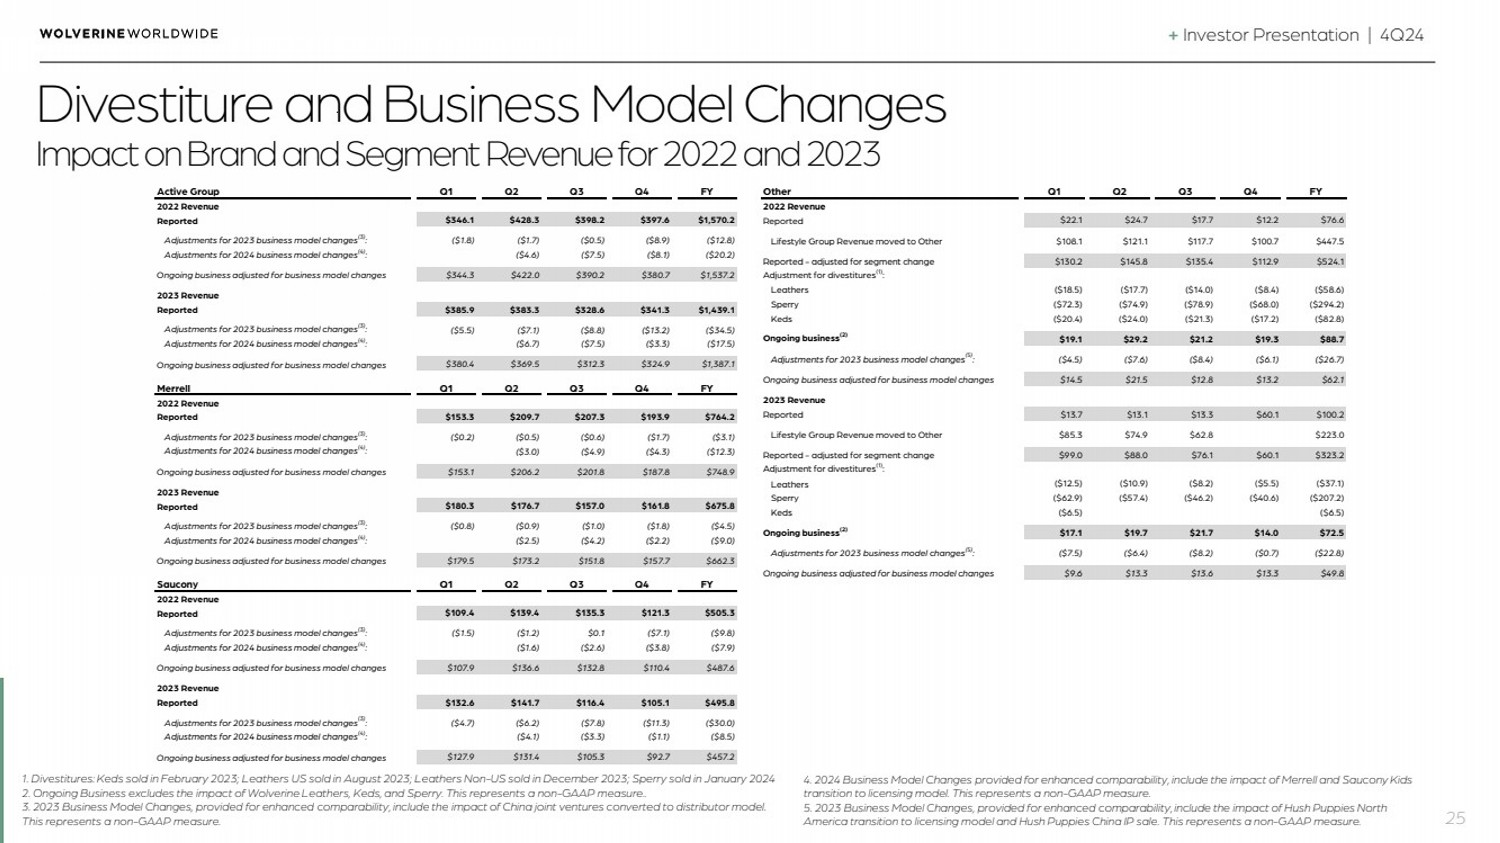
| + Investor Presentation | 4Q24
Divestiture and Business Model Changes
Impact on Brand and Segment Revenue for 2022 and 2023
25
1. Divestitures: Keds sold in February 2023; Leathers US sold in August 2023; Leathers Non-US sold in December 2023; Sperry sold in January 2024
2. Ongoing Business excludes the impact of Wolverine Leathers, Keds, and Sperry. This represents a non-GAAP measure..
3. 2023 Business Model Changes, provided for enhanced comparability, include the impact of China joint ventures converted to distributor model.
This represents a non-GAAP measure.
4. 2024 Business Model Changes provided for enhanced comparability, include the impact of Merrell and Saucony Kids
transition to licensing model. This represents a non-GAAP measure.
5. 2023 Business Model Changes, provided for enhanced comparability, include the impact of Hush Puppies North
America transition to licensing model and Hush Puppies China IP sale. This represents a non-GAAP measure.
Active Group Q1 Q2 Q3 Q4 FY
2022 Revenue
Reported $346.1 $428.3 $398.2 $397.6 $1,570.2
Adjustments for 2023 business model changes(3): ($1.8) ($1.7) ($0.5) ($8.9) ($12.8)
Adjustments for 2024 business model changes(4): ($4.6) ($7.5) ($8.1) ($20.2)
Ongoing business adjusted for business model changes $344.3 $422.0 $390.2 $380.7 $1,537.2
2023 Revenue
Reported $385.9 $383.3 $328.6 $341.3 $1,439.1
Adjustments for 2023 business model changes(3): ($5.5) ($7.1) ($8.8) ($13.2) ($34.5)
Adjustments for 2024 business model changes(4): ($6.7) ($7.5) ($3.3) ($17.5)
Ongoing business adjusted for business model changes $380.4 $369.5 $312.3 $324.9 $1,387.1
Merrell Q1 Q2 Q3 Q4 FY
2022 Revenue
Reported $153.3 $209.7 $207.3 $193.9 $764.2
Adjustments for 2023 business model changes(3): ($0.2) ($0.5) ($0.6) ($1.7) ($3.1)
Adjustments for 2024 business model changes(4): ($3.0) ($4.9) ($4.3) ($12.3)
Ongoing business adjusted for business model changes $153.1 $206.2 $201.8 $187.8 $748.9
2023 Revenue
Reported $180.3 $176.7 $157.0 $161.8 $675.8
Adjustments for 2023 business model changes(3): ($0.8) ($0.9) ($1.0) ($1.8) ($4.5)
Adjustments for 2024 business model changes(4): ($2.5) ($4.2) ($2.2) ($9.0)
Ongoing business adjusted for business model changes $179.5 $173.2 $151.8 $157.7 $662.3
Saucony Q1 Q2 Q3 Q4 FY
2022 Revenue
Reported $109.4 $139.4 $135.3 $121.3 $505.3
Adjustments for 2023 business model changes(3): ($1.5) ($1.2) $0.1 ($7.1) ($9.8)
Adjustments for 2024 business model changes(4): ($1.6) ($2.6) ($3.8) ($7.9)
Ongoing business adjusted for business model changes $107.9 $136.6 $132.8 $110.4 $487.6
2023 Revenue
Reported $132.6 $141.7 $116.4 $105.1 $495.8
Adjustments for 2023 business model changes(3): ($4.7) ($6.2) ($7.8) ($11.3) ($30.0)
Adjustments for 2024 business model changes(4): ($4.1) ($3.3) ($1.1) ($8.5)
Ongoing business adjusted for business model changes $127.9 $131.4 $105.3 $92.7 $457.2
Other Q1 Q2 Q3 Q4 FY
2022 Revenue
Reported $22.1 $24.7 $17.7 $12.2 $76.6
Lifestyle Group Revenue moved to Other $108.1 $121.1 $117.7 $100.7 $447.5
Reported - adjusted for segment change $130.2 $145.8 $135.4 $112.9 $524.1
Adjustment for divestitures(1):
Leathers ($18.5) ($17.7) ($14.0) ($8.4) ($58.6)
Sperry ($72.3) ($74.9) ($78.9) ($68.0) ($294.2)
Keds ($20.4) ($24.0) ($21.3) ($17.2) ($82.8)
Ongoing business(2) $19.1 $29.2 $21.2 $19.3 $88.7
Adjustments for 2023 business model changes(5): ($4.5) ($7.6) ($8.4) ($6.1) ($26.7)
Ongoing business adjusted for business model changes $14.5 $21.5 $12.8 $13.2 $62.1
2023 Revenue
Reported $13.7 $13.1 $13.3 $60.1 $100.2
Lifestyle Group Revenue moved to Other $85.3 $74.9 $62.8 $223.0
Reported - adjusted for segment change $99.0 $88.0 $76.1 $60.1 $323.2
Adjustment for divestitures(1):
Leathers ($12.5) ($10.9) ($8.2) ($5.5) ($37.1)
Sperry ($62.9) ($57.4) ($46.2) ($40.6) ($207.2)
Keds ($6.5) ($6.5)
Ongoing business(2) $17.1 $19.7 $21.7 $14.0 $72.5
Adjustments for 2023 business model changes(5): ($7.5) ($6.4) ($8.2) ($0.7) ($22.8)
Ongoing business adjusted for business model changes $9.6 $13.3 $13.6 $13.3 $49.8 |
| + Investor Presentation | 4Q24
26
investor.relations@wwwinc.com
Investor Relations Contact Information |

| Investor Presentation | Fourth Quarter 2024 |
Cover
|
Feb. 19, 2025 |
| Cover [Abstract] |
|
| Document Type |
8-K/A
|
| Amendment Flag |
true
|
| Amendment Description |
Wolverine World Wide, Inc. is filing this Current Report on Form 8-K/A (this "8-K/A"): (1) To correct a typographical error in the press release attached as Exhibit 99.1 to the Current Report on Form 8-K that the Company filed with the Securities and Exchange Commission on February 19, 2025 (the "Original 8-K"). The error was included in the table under the header "2025 GUIDANCE RECONCILIATION TABLES." The press release attached as Exhibit 99.1 to this 8-K/A corrects this error and is hereby incorporated by reference. The full text of the Original 8-K is included in Item 2.02 below. (2) To include Item 7.01 below. This 8-K/A, Exhibit 99.1 and Exhibit 99.2 shall not be deemed "filed" for purposes of Section 18 of the Securities Exchange Act of 1934, as amended (the "Exchange Act"), or incorporated by reference in any filing under the Securities Act of 1933, as amended (the "Securities Act"), or the Exchange Act, except as shall be expressly set forth by specific reference in such a filing.
|
| Document Period End Date |
Feb. 19, 2025
|
| Entity File Number |
001-06024
|
| Entity Registrant Name |
WOLVERINE
WORLD WIDE, INC.
|
| Entity Central Index Key |
0000110471
|
| Entity Tax Identification Number |
38-1185150
|
| Entity Incorporation, State or Country Code |
DE
|
| Entity Address, Address Line One |
9341
Courtland Drive N.E.
|
| Entity Address, City or Town |
Rockford
|
| Entity Address, State or Province |
MI
|
| Entity Address, Postal Zip Code |
49351
|
| City Area Code |
616
|
| Local Phone Number |
866-5500
|
| Written Communications |
false
|
| Soliciting Material |
false
|
| Pre-commencement Tender Offer |
false
|
| Pre-commencement Issuer Tender Offer |
false
|
| Title of 12(b) Security |
Common Stock, $1 Par Value
|
| Trading Symbol |
WWW
|
| Security Exchange Name |
NYSE
|
| Entity Emerging Growth Company |
false
|
| X |
- DefinitionDescription of changes contained within amended document.
| Name: |
dei_AmendmentDescription |
| Namespace Prefix: |
dei_ |
| Data Type: |
xbrli:stringItemType |
| Balance Type: |
na |
| Period Type: |
duration |
|
| X |
- DefinitionBoolean flag that is true when the XBRL content amends previously-filed or accepted submission.
| Name: |
dei_AmendmentFlag |
| Namespace Prefix: |
dei_ |
| Data Type: |
xbrli:booleanItemType |
| Balance Type: |
na |
| Period Type: |
duration |
|
| X |
- DefinitionFor the EDGAR submission types of Form 8-K: the date of the report, the date of the earliest event reported; for the EDGAR submission types of Form N-1A: the filing date; for all other submission types: the end of the reporting or transition period. The format of the date is YYYY-MM-DD.
| Name: |
dei_DocumentPeriodEndDate |
| Namespace Prefix: |
dei_ |
| Data Type: |
xbrli:dateItemType |
| Balance Type: |
na |
| Period Type: |
duration |
|
| X |
- DefinitionThe type of document being provided (such as 10-K, 10-Q, 485BPOS, etc). The document type is limited to the same value as the supporting SEC submission type, or the word 'Other'.
| Name: |
dei_DocumentType |
| Namespace Prefix: |
dei_ |
| Data Type: |
dei:submissionTypeItemType |
| Balance Type: |
na |
| Period Type: |
duration |
|
| X |
- DefinitionAddress Line 1 such as Attn, Building Name, Street Name
| Name: |
dei_EntityAddressAddressLine1 |
| Namespace Prefix: |
dei_ |
| Data Type: |
xbrli:normalizedStringItemType |
| Balance Type: |
na |
| Period Type: |
duration |
|
| X |
- Definition
+ References
+ Details
| Name: |
dei_EntityAddressCityOrTown |
| Namespace Prefix: |
dei_ |
| Data Type: |
xbrli:normalizedStringItemType |
| Balance Type: |
na |
| Period Type: |
duration |
|
| X |
- DefinitionCode for the postal or zip code
| Name: |
dei_EntityAddressPostalZipCode |
| Namespace Prefix: |
dei_ |
| Data Type: |
xbrli:normalizedStringItemType |
| Balance Type: |
na |
| Period Type: |
duration |
|
| X |
- DefinitionName of the state or province.
| Name: |
dei_EntityAddressStateOrProvince |
| Namespace Prefix: |
dei_ |
| Data Type: |
dei:stateOrProvinceItemType |
| Balance Type: |
na |
| Period Type: |
duration |
|
| X |
- DefinitionA unique 10-digit SEC-issued value to identify entities that have filed disclosures with the SEC. It is commonly abbreviated as CIK. Reference 1: http://www.xbrl.org/2003/role/presentationRef
-Publisher SEC
-Name Exchange Act
-Number 240
-Section 12
-Subsection b-2
| Name: |
dei_EntityCentralIndexKey |
| Namespace Prefix: |
dei_ |
| Data Type: |
dei:centralIndexKeyItemType |
| Balance Type: |
na |
| Period Type: |
duration |
|
| X |
- DefinitionIndicate if registrant meets the emerging growth company criteria. Reference 1: http://www.xbrl.org/2003/role/presentationRef
-Publisher SEC
-Name Exchange Act
-Number 240
-Section 12
-Subsection b-2
| Name: |
dei_EntityEmergingGrowthCompany |
| Namespace Prefix: |
dei_ |
| Data Type: |
xbrli:booleanItemType |
| Balance Type: |
na |
| Period Type: |
duration |
|
| X |
- DefinitionCommission file number. The field allows up to 17 characters. The prefix may contain 1-3 digits, the sequence number may contain 1-8 digits, the optional suffix may contain 1-4 characters, and the fields are separated with a hyphen.
| Name: |
dei_EntityFileNumber |
| Namespace Prefix: |
dei_ |
| Data Type: |
dei:fileNumberItemType |
| Balance Type: |
na |
| Period Type: |
duration |
|
| X |
- DefinitionTwo-character EDGAR code representing the state or country of incorporation.
| Name: |
dei_EntityIncorporationStateCountryCode |
| Namespace Prefix: |
dei_ |
| Data Type: |
dei:edgarStateCountryItemType |
| Balance Type: |
na |
| Period Type: |
duration |
|
| X |
- DefinitionThe exact name of the entity filing the report as specified in its charter, which is required by forms filed with the SEC. Reference 1: http://www.xbrl.org/2003/role/presentationRef
-Publisher SEC
-Name Exchange Act
-Number 240
-Section 12
-Subsection b-2
| Name: |
dei_EntityRegistrantName |
| Namespace Prefix: |
dei_ |
| Data Type: |
xbrli:normalizedStringItemType |
| Balance Type: |
na |
| Period Type: |
duration |
|
| X |
- DefinitionThe Tax Identification Number (TIN), also known as an Employer Identification Number (EIN), is a unique 9-digit value assigned by the IRS. Reference 1: http://www.xbrl.org/2003/role/presentationRef
-Publisher SEC
-Name Exchange Act
-Number 240
-Section 12
-Subsection b-2
| Name: |
dei_EntityTaxIdentificationNumber |
| Namespace Prefix: |
dei_ |
| Data Type: |
dei:employerIdItemType |
| Balance Type: |
na |
| Period Type: |
duration |
|
| X |
- DefinitionLocal phone number for entity.
| Name: |
dei_LocalPhoneNumber |
| Namespace Prefix: |
dei_ |
| Data Type: |
xbrli:normalizedStringItemType |
| Balance Type: |
na |
| Period Type: |
duration |
|
| X |
- DefinitionBoolean flag that is true when the Form 8-K filing is intended to satisfy the filing obligation of the registrant as pre-commencement communications pursuant to Rule 13e-4(c) under the Exchange Act. Reference 1: http://www.xbrl.org/2003/role/presentationRef
-Publisher SEC
-Name Exchange Act
-Number 240
-Section 13e
-Subsection 4c
| Name: |
dei_PreCommencementIssuerTenderOffer |
| Namespace Prefix: |
dei_ |
| Data Type: |
xbrli:booleanItemType |
| Balance Type: |
na |
| Period Type: |
duration |
|
| X |
- DefinitionBoolean flag that is true when the Form 8-K filing is intended to satisfy the filing obligation of the registrant as pre-commencement communications pursuant to Rule 14d-2(b) under the Exchange Act. Reference 1: http://www.xbrl.org/2003/role/presentationRef
-Publisher SEC
-Name Exchange Act
-Number 240
-Section 14d
-Subsection 2b
| Name: |
dei_PreCommencementTenderOffer |
| Namespace Prefix: |
dei_ |
| Data Type: |
xbrli:booleanItemType |
| Balance Type: |
na |
| Period Type: |
duration |
|
| X |
- DefinitionTitle of a 12(b) registered security. Reference 1: http://www.xbrl.org/2003/role/presentationRef
-Publisher SEC
-Name Exchange Act
-Number 240
-Section 12
-Subsection b
| Name: |
dei_Security12bTitle |
| Namespace Prefix: |
dei_ |
| Data Type: |
dei:securityTitleItemType |
| Balance Type: |
na |
| Period Type: |
duration |
|
| X |
- DefinitionName of the Exchange on which a security is registered. Reference 1: http://www.xbrl.org/2003/role/presentationRef
-Publisher SEC
-Name Exchange Act
-Number 240
-Section 12
-Subsection d1-1
| Name: |
dei_SecurityExchangeName |
| Namespace Prefix: |
dei_ |
| Data Type: |
dei:edgarExchangeCodeItemType |
| Balance Type: |
na |
| Period Type: |
duration |
|
| X |
- DefinitionBoolean flag that is true when the Form 8-K filing is intended to satisfy the filing obligation of the registrant as soliciting material pursuant to Rule 14a-12 under the Exchange Act. Reference 1: http://www.xbrl.org/2003/role/presentationRef
-Publisher SEC
-Name Exchange Act
-Section 14a
-Number 240
-Subsection 12
| Name: |
dei_SolicitingMaterial |
| Namespace Prefix: |
dei_ |
| Data Type: |
xbrli:booleanItemType |
| Balance Type: |
na |
| Period Type: |
duration |
|
| X |
- DefinitionTrading symbol of an instrument as listed on an exchange.
| Name: |
dei_TradingSymbol |
| Namespace Prefix: |
dei_ |
| Data Type: |
dei:tradingSymbolItemType |
| Balance Type: |
na |
| Period Type: |
duration |
|
| X |
- DefinitionBoolean flag that is true when the Form 8-K filing is intended to satisfy the filing obligation of the registrant as written communications pursuant to Rule 425 under the Securities Act. Reference 1: http://www.xbrl.org/2003/role/presentationRef
-Publisher SEC
-Name Securities Act
-Number 230
-Section 425
| Name: |
dei_WrittenCommunications |
| Namespace Prefix: |
dei_ |
| Data Type: |
xbrli:booleanItemType |
| Balance Type: |
na |
| Period Type: |
duration |
|
Wolverine World Wide (NYSE:WWW)
Historical Stock Chart
From Jan 2025 to Feb 2025

Wolverine World Wide (NYSE:WWW)
Historical Stock Chart
From Feb 2024 to Feb 2025

