Global Ports Holding PLC (GPH) Trading statement for nine months
to 31 December 2021 11-March-2022 / 07:00 GMT/BST Dissemination of
a Regulatory Announcement that contains inside information
according to REGULATION (EU) No 596/2014 (MAR), transmitted by EQS
Group. The issuer is solely responsible for the content of this
announcement.
-----------------------------------------------------------------------------------------------------------------------
Global Ports Holding Plc
Trading Statement for the nine months to 31 December 2021
Global Ports Holding Plc ("GPH" or "Group"), the world's largest
independent cruise port operator, today issues a trading update for
the period from 1 April to 31 December 2021, which is the first
nine months of its new 2022 reporting period to 31 March 2022.
                                    9 months ended 9 months ended YoY Change 3 months ended 3 months ended
Key Financials1
                                    31-Dec-21      31-Dec-20      (%)        31-Dec-21 (Q3) 31-Dec-20
                                                   Restated8                                Restated8
Total Revenue (USDm)                  107.2          60.5           77%        46.1           14.1
Adjusted Revenue (USDm)2              28.2           10.2           177%       13.4           3.9
Segmental EBITDA (USDm) 4             8.1            (4.3)          n/a        6.0            (0.7)
Adjusted EBITDA (USDm) 6              4.4            (8.8)          n/a        4.9            (3.0)

                                    31-Dec-21      31-Mar-21
Gross Debt (IFRS)                   589.9          548.9          7%
Gross Debt ex IFRS 16 Finance Lease 526.0          483.0          9%
Net Debt ex IFRS 16 Finance Lease   445.1          312.4          42%
Cash and Cash Equivalents           80.9           170.7          -53%
Notes 1. All USD refers to United States Dollar unless otherwise
stated 2. Adjusted revenue is calculated as total revenue excluding
IFRIC-12 construction revenue at Nassau CruisePort 3. Sum of
revenues of consolidated and managed cruise portfolio excluding
IFRIC-12 construction revenue atNassau Cruise Port 4. Segmental
EBITDA is calculated as income/(loss) before tax after adding back:
interest; depreciation;amortisation; unallocated expenses; and
specific adjusting items 5. EBITDA allocated to the Cruise segment
is the sum of EBITDA of consolidated cruise ports and pro-rata
NetProfit of equity-accounted associates La Goulette, Lisbon,
Singapore and Venice and the contribution frommanagement agreements
6. Adjusted EBITDA calculated as Segmental EBITDA less unallocated
(holding company) expenses 7. Passenger numbers refer to
consolidated and managed portfolio consolidation perimeter; hence
it excludesequity accounted associate ports La Goulette, Lisbon,
Singapore and Venice. 8. Comparative information has been restated,
excluding the contribution from Port Akdeniz due to the saleof the
entity in January 2021.
Key Highlights
-- Strong acceleration in cruise activity in the third quarter
of the current financial year
-- The material increase in cruise activity we reported in the
half-year results statement has acceleratedin the third quarter,
with cruise passenger volumes of 1.5 million for the 9M period
ended 31 December 2021
-- GPH welcomed 1.0 million cruise passengers in the 3M period
ended 31 December 2021, the highest level ofcruise passengers in a
quarter since calendar Q1 2020
-- Strong growth in Adjusted Revenue to USD28.2m, up 177% from
the same period last year, with Cruise Revenuerising by 385% from
the same period last year
-- Q3 Adjusted Revenue grew 244% from the same period last year,
with Adjusted Cruise Revenue growing 542%
-- Segmental EBITDA of USD8.1m compares to a loss of USD4.3m for
the same period last year -- Adjusted EBITDA of USD4.4m compared to
an adjusted EBITDA loss of USD8.8m for the same period last
year
                                  9 months ended 9 months ended YoY Change 3 months ended 3 months ended
KPI Highlights1
                                  31-Dec-21      31-Dec-20      (%)        31-Dec-21      31-Dec-20
                                                 Restated8                                Restated8
Passengers (m PAX) 7              1.5            0.04           3760%      1.0            0.03
General & Bulk Cargo ('000 tons)  140.2          25             461%       80.1           6.6
Container Throughput ('000) TEU)  36.4           41.8           -13%       10.5           14.6

Cruise Revenue ex-IFRIC 12 (USDm) 3 21.6           4.5            385%       11.3           1.8
Commercial Revenue (USDm)           6.5            5.7            14%        2.0            2.1
Adjusted Revenue (USDm)2            28.2           10.2           177%       13.4           3.9

Cruise EBITDA (USDm) 5              5.5            (6.3)          n/a        5.2            (1.6)
Commercial EBITDA (USDm)            2.6            1.9            35%        0.8            0.8
Adjusted EBITDA (USDm) 6            4.4            (8.8)          n/a        4.9            (3.0)
Cruise EBITDA Margin (%)          25%            n/a                       45%            n/a
Commercial EBITDA Margin (%)      40%            34%                       40%            39%
Adjusted EBITDA Margin (%)        16%            n/a                       36%            n/a
Cruise
-- The increased activity in the third quarter was the result of
a significant increase in cruise calls inthe period. Fiscal Q3
cruise calls increased by 113% on Q2 and 1559% from the same period
last year on alike-for-like basis
-- Cruise calls in the quarter were still down 32% compared to
the same pre-Covid period in 2019. However,this is a significant
improvement compared to -84% at the half-year stage
-- Cruise revenue for the third quarter was USD9.6m higher than
in the same period last year, at USD11.3m andCruise EBITDA was
USD6.7m higher at USD5.2m, representing a Q3 Cruise EBITDA margin
of 45%
-- Total cruise revenue was USD100.7m for the nine months to 31
December 2021. Excluding the impact ofIFRIC-12 Construction
revenues at Nassau Cruise Port cruise revenue was USD21.6m, a
significant increase on the USD4.5mreported for the nine months to
31 December 2020 -- On-board Covid-19 measures continue to impact
occupancy rates across the industry negatively. Thisimpact is
reflected in passenger volumes, which in Q3 on like-for-like basis
were 42% of the passenger volumesfor the same period in 2019.
Nevertheless, this is a material improvement compared to fiscal
H1-2022, werepassenger volumes were only 12% of the passenger
volumes for the same period in 2019
Commercial
-- Total container volumes (TEUs) fell by 13% and General &
Bulk volumes grew 461%, driven by volumes incertain low margin
cargo items
-- Total commercial revenues rose by 14% to USD6.5m for the nine
months to 31 December 2021 vs USD5.7m for thenine months to 31
December 2020
Balance Sheet
At 31 December 2021, IFRS gross debt was USD589.9m (Ex IFRS-16
Finance Leases Gross Debt: USD526m), compared to gross debt at 31
March 2021 of USD548.9m (Ex IFRS-16 Finance Leases Gross Debt:
USD483.0m). Net debt Ex IFRS-16 finance leases was USD445.1m
compared to USD312.4m as at 31 March 2021. At 31 December 2021, GPH
had cash and cash equivalents of USD80.9m, compared to USD170.6m at
31 March 2021.
The net debt increase of USD132.7m in the period was primarily
driven by (i) capital expenditure of USD83.6m, with USD79.5m of
this spent on our continued investment into the transformation of
Nassau Cruise Port, (ii) the use of the high level of available
cash as of 31 March 2021 as a result of the sale of Port Akdeniz in
January 2021 for the Eurobond refinancing, and (iii) additional
indebtedness at Nassau Cruise Port to finance the investment
commitment there. Net cash from operating activities was a negative
USD11.8m in the period, mainly driven by advance contractor
payments for capital expenditure in Nassau.
Net cash from financing activities was a negative USD98.5m,
reflecting the net impact of our early Eurobond repayment, drawdown
on our new loan facility and an additional USD55.0m of debt
issuance by Nassau Cruise Port as well as USD43.1m of interest paid
in the period. Interest cash payments during the period were
notably higher because the first interest payment date on the May
2020 bond issued by Nassau Cruise Port (current outstanding amount
of USD134.4m) was June 2021. All future interest at Nassau Cruise
Port is to be paid semi-annually.
During the period, GPH entered into a five-year, senior secured
loan agreement for up to USD261.3m with Sixth Street, a leading
global investment firm. The loan agreement provides for two term
loan facilities, an initial five-year term facility of USD186.3m
and an additional five-year growth facility of up to USD75.0m. The
latter will be key to the continued success of our growth strategy.
The first enabled the early repayment in July 2021 of the USD250m
8.125% senior secured Eurobond due November 2021 (together with
proceeds from the sale of Port Akdeniz).
Other developments
Despite the significant impact of Covid-19 on the cruise
industry and our cruise operations, we have continued to deliver on
our strategic growth ambitions. GPH added two more cruise ports to
its port network during the period. A 20-year concession agreement
was signed and operations commenced at Taranto Cruise Port, Italy,
and a 20-year lease agreement for Kalundborg Cruise Port, Denmark,
was also signed. Ravenna Cruise Port, which accounted for less than
1% of our cruise passenger volumes in calendar 2019, exited the
portfolio during the period when the concession agreement came to
an end.
(MORE TO FOLLOW) Dow Jones Newswires
March 11, 2022 02:00 ET (07:00 GMT)
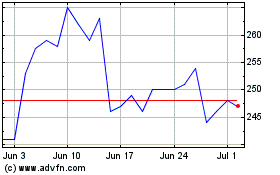
Global Ports (LSE:GPH)
Historical Stock Chart
From Mar 2024 to Apr 2024

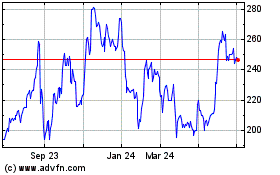
Global Ports (LSE:GPH)
Historical Stock Chart
From Apr 2023 to Apr 2024
