00008504602023FYfalse00008504602023-01-012023-12-3100008504602023-06-30iso4217:USD00008504602024-02-15xbrli:shares00008504602023-12-3100008504602022-12-31iso4217:USDxbrli:shares00008504602022-01-012022-12-3100008504602021-01-012021-12-310000850460us-gaap:CommonStockMember2020-12-310000850460us-gaap:AdditionalPaidInCapitalMember2020-12-310000850460us-gaap:TreasuryStockCommonMember2020-12-310000850460us-gaap:RetainedEarningsMember2020-12-3100008504602020-12-310000850460us-gaap:RetainedEarningsMember2021-01-012021-12-310000850460us-gaap:CommonStockMember2021-01-012021-12-310000850460us-gaap:AdditionalPaidInCapitalMember2021-01-012021-12-310000850460us-gaap:TreasuryStockCommonMember2021-01-012021-12-310000850460us-gaap:CommonStockMember2021-12-310000850460us-gaap:AdditionalPaidInCapitalMember2021-12-310000850460us-gaap:TreasuryStockCommonMember2021-12-310000850460us-gaap:RetainedEarningsMember2021-12-3100008504602021-12-310000850460us-gaap:RetainedEarningsMember2022-01-012022-12-310000850460us-gaap:CommonStockMember2022-01-012022-12-310000850460us-gaap:AdditionalPaidInCapitalMember2022-01-012022-12-310000850460us-gaap:TreasuryStockCommonMember2022-01-012022-12-310000850460us-gaap:CommonStockMember2022-12-310000850460us-gaap:AdditionalPaidInCapitalMember2022-12-310000850460us-gaap:TreasuryStockCommonMember2022-12-310000850460us-gaap:RetainedEarningsMember2022-12-310000850460us-gaap:RetainedEarningsMember2023-01-012023-12-310000850460us-gaap:CommonStockMember2023-01-012023-12-310000850460us-gaap:AdditionalPaidInCapitalMember2023-01-012023-12-310000850460us-gaap:TreasuryStockCommonMember2023-01-012023-12-310000850460us-gaap:CommonStockMember2023-12-310000850460us-gaap:AdditionalPaidInCapitalMember2023-12-310000850460us-gaap:TreasuryStockCommonMember2023-12-310000850460us-gaap:RetainedEarningsMember2023-12-31wire:segment0000850460us-gaap:ShippingAndHandlingMember2023-01-012023-12-310000850460us-gaap:ShippingAndHandlingMember2022-01-012022-12-310000850460us-gaap:ShippingAndHandlingMember2021-01-012021-12-310000850460us-gaap:CustomerConcentrationRiskMemberus-gaap:SalesRevenueNetMember2023-01-012023-12-31wire:customer0000850460us-gaap:BuildingAndBuildingImprovementsMembersrt:MinimumMember2023-12-310000850460us-gaap:BuildingAndBuildingImprovementsMembersrt:MaximumMember2023-12-310000850460us-gaap:MachineryAndEquipmentMembersrt:MinimumMember2023-12-310000850460us-gaap:MachineryAndEquipmentMembersrt:MaximumMember2023-12-310000850460us-gaap:FurnitureAndFixturesMembersrt:MinimumMember2023-12-310000850460us-gaap:FurnitureAndFixturesMembersrt:MaximumMember2023-12-310000850460us-gaap:BuildingMember2023-08-310000850460us-gaap:BuildingMember2023-09-010000850460us-gaap:LandAndLandImprovementsMember2023-12-310000850460us-gaap:LandAndLandImprovementsMember2022-12-310000850460us-gaap:ConstructionInProgressMember2023-12-310000850460us-gaap:ConstructionInProgressMember2022-12-310000850460us-gaap:BuildingAndBuildingImprovementsMember2023-12-310000850460us-gaap:BuildingAndBuildingImprovementsMember2022-12-310000850460us-gaap:MachineryAndEquipmentMember2023-12-310000850460us-gaap:MachineryAndEquipmentMember2022-12-310000850460us-gaap:FurnitureAndFixturesMember2023-12-310000850460us-gaap:FurnitureAndFixturesMember2022-12-3100008504602021-02-092021-02-09wire:bank0000850460wire:CreditAgreementMember2021-02-090000850460wire:CreditAgreementMember2021-02-092021-02-090000850460wire:BloombergShortTermBankYieldIndexMemberwire:CreditAgreementMemberwire:CreditAgreementInterestRateOptionOneMembersrt:MinimumMember2022-10-202022-10-20xbrli:pure0000850460wire:BloombergShortTermBankYieldIndexMemberwire:CreditAgreementMemberwire:CreditAgreementInterestRateOptionOneMembersrt:MaximumMember2022-10-202022-10-200000850460us-gaap:FederalFundsEffectiveSwapRateMemberwire:CreditAgreementMemberwire:CreditAgreementInterestRateOptionTwoMembersrt:MaximumMember2022-10-202022-10-200000850460wire:BloombergShortTermBankYieldIndexMemberwire:CreditAgreementMemberwire:CreditAgreementInterestRateOptionTwoMember2022-10-202022-10-200000850460wire:CreditAgreementMemberwire:CreditAgreementInterestRateOptionTwoMemberus-gaap:BaseRateMembersrt:MinimumMember2022-10-202022-10-200000850460wire:CreditAgreementMemberwire:CreditAgreementInterestRateOptionTwoMemberus-gaap:BaseRateMembersrt:MaximumMember2022-10-202022-10-200000850460wire:CreditAgreementMembersrt:MinimumMember2022-10-202022-10-200000850460wire:CreditAgreementMembersrt:MaximumMember2022-10-202022-10-200000850460us-gaap:RestrictedStockUnitsRSUMember2023-01-012023-12-310000850460us-gaap:RestrictedStockUnitsRSUMember2022-01-012022-12-310000850460us-gaap:RestrictedStockUnitsRSUMember2021-01-012021-12-310000850460wire:EmployeeStockGrantMember2023-01-012023-12-310000850460wire:EmployeeStockGrantMember2022-01-012022-12-310000850460wire:EmployeeStockGrantMember2021-01-012021-12-310000850460us-gaap:EmployeeStockOptionMember2023-01-012023-12-310000850460us-gaap:EmployeeStockOptionMember2022-01-012022-12-310000850460us-gaap:EmployeeStockOptionMember2021-01-012021-12-310000850460us-gaap:StockAppreciationRightsSARSMember2023-01-012023-12-310000850460us-gaap:StockAppreciationRightsSARSMember2022-01-012022-12-310000850460us-gaap:StockAppreciationRightsSARSMember2021-01-012021-12-310000850460us-gaap:RestrictedStockMember2023-01-012023-12-310000850460us-gaap:RestrictedStockMember2022-01-012022-12-310000850460us-gaap:RestrictedStockMember2021-01-012021-12-310000850460us-gaap:RestrictedStockUnitsRSUMember2023-12-310000850460us-gaap:RestrictedStockUnitsRSUMember2022-12-310000850460wire:EmployeeStockGrantMember2023-05-012023-05-31wire:director0000850460wire:EmployeeStockGrantMember2022-05-012022-05-310000850460wire:EmployeeStockGrantMember2022-09-012022-09-300000850460wire:EmployeeStockGrantMember2021-05-012021-05-310000850460us-gaap:StockAppreciationRightsSARSMember2023-12-310000850460us-gaap:StockAppreciationRightsSARSMember2022-12-310000850460us-gaap:RestrictedStockMember2021-01-012023-12-310000850460us-gaap:RestrictedStockMember2023-12-310000850460us-gaap:RestrictedStockMember2022-12-310000850460us-gaap:EmployeeStockOptionMember2023-01-012023-12-310000850460us-gaap:EmployeeStockOptionMember2022-01-012022-12-310000850460us-gaap:EmployeeStockOptionMember2021-01-012021-12-310000850460us-gaap:SubsequentEventMember2024-02-1600008504602023-01-012023-03-3100008504602023-04-012023-06-3000008504602023-07-012023-09-3000008504602023-10-012023-12-3100008504602022-01-012022-03-3100008504602022-04-012022-06-3000008504602022-07-012022-09-3000008504602022-10-012022-12-31
UNITED STATES
SECURITIES AND EXCHANGE COMMISSION
Washington, D.C. 20549
(Mark One) | | | | | |
| ☒ | ANNUAL REPORT PURSUANT TO SECTION 13 OR 15(d) OF THE SECURITIES EXCHANGE ACT OF 1934 |
For the fiscal year ended December 31, 2023
or | | | | | |
| ☐ | TRANSITION REPORT PURSUANT TO SECTION 13 OR 15(d) OF THE SECURITIES EXCHANGE ACT OF 1934 |
For the transition period from to
Commission File Number: 000-20278 | | |
|
ENCORE WIRE CORPORATION (Exact name of registrant as specified in its charter) |
|
| | | | | | | | | | | |
| Delaware | | 75-2274963 |
(State or other jurisdiction of incorporation or organization) | | (I.R.S. Employer Identification No.) |
| | | |
| 1329 Millwood Road | | |
| McKinney, | Texas | | 75069 |
| (Address of principal executive offices) | | (Zip Code) |
Registrant’s telephone number, including area code: (972) 562-9473
Securities registered pursuant to Section 12(b) of the Act: | | | | | | | | |
| Title of each class | Trading Symbol(s) | Name of each exchange on which registered |
| Common Stock, par value $.01 per share | WIRE | The NASDAQ Global Select Market |
Securities registered pursuant to Section 12(g) of the Act: None Indicate by check mark if the registrant is a well-known seasoned issuer, as defined in Rule 405 of the Securities Act. ¨ Yes ý No
Indicate by check mark if the registrant is not required to file reports pursuant to Section 13 or Section 15(d) of the Act. ¨ Yes ý No
Note – Checking the box above will not relieve any registrant required to file reports pursuant to Section 13 or 15(d) of the Exchange Act from their obligations under those Sections.
Indicate by check mark whether the registrant (1) has filed all reports required to be filed by Section 13 or 15(d) of the Securities Exchange Act of 1934 during the preceding 12 months (or for such shorter period that the registrant was required to file such reports), and (2) has been subject to such filing requirements for the past 90 days. ý Yes ¨ No
Indicate by check mark whether the registrant has submitted electronically every Interactive Data File required to be submitted pursuant to Rule 405 of Regulation S-T (§232.405 of this chapter) during the preceding 12 months (or for such shorter period that the registrant was required to submit such files). ý Yes ¨ No
Indicate by check mark whether the registrant is a large accelerated filer, an accelerated filer, a non-accelerated filer, a smaller reporting company, or an emerging growth company. See the definitions of “large accelerated filer,” “accelerated filer,” “smaller reporting company,” and “emerging growth company” in Rule 12b-2 of the Exchange Act. | | | | | | | | | | | | | | |
| Large accelerated filer | | ☒ | Accelerated filer | ☐ |
| | | | |
| Non-accelerated filer | | ☐ | Smaller reporting company | ☐ |
| | | | |
| | | Emerging growth company | ☐ |
| | | | |
| If an emerging growth company, indicate by check mark if the registrant has elected not to use the extended transition period for complying with any new or revised financial accounting standards provided pursuant to Section 13(a) of the Exchange Act. | o |
| Indicate by check mark whether the registrant has filed a report on and attestation to its management’s assessment of the effectiveness of its internal control over financial reporting under Section 404(b) of the Sarbanes-Oxley Act (15 U.S.C. 7262(b)) by the registered public accounting firm that prepared or issued its audit report. | ☒ |
| If securities are registered pursuant to Section 12(b) of the Act, indicate by check mark whether the financial statements of the registrant included in the filing reflect the correction of an error to previously issued financial statements. | o |
| Indicate by check mark whether any of these error corrections are restatements that required a recovery analysis of incentive-based compensation received by any of the registrant’s executive officers during the relevant recovery period pursuant to §240.10D-1(b). | o |
Indicate by check mark whether the registrant is a shell company (as defined in Rule 12b-2 of the Act). ☐ Yes ý No
The aggregate market value of the Common Stock held by non-affiliates of the registrant computed by reference to the price at which the Common Stock was last sold as of the last business day of the registrant’s most recently completed second fiscal quarter was $2,125,052,538 (Note: The aggregate market value of Common Stock held by the Company’s directors, executive officers, immediate family members of such directors and executive officers, 10% or greater stockholders and other stockholders deemed to be affiliates was excluded from the computation of the foregoing amount. The characterization of such persons as “affiliates” should not be construed as an admission that any such person is an affiliate of the Registrant for any other purpose).
Number of shares of Common Stock outstanding as of February 15, 2024: 15,763,916
DOCUMENTS INCORPORATED BY REFERENCE
Listed below are documents, parts of which are incorporated herein by reference, and the part of this report into which the document is incorporated:
(1)Proxy statement for the 2024 annual meeting of stockholders – Part III
ENCORE WIRE CORPORATION
FORM 10-K
FOR THE YEAR ENDED DECEMBER 31, 2023
Table of Contents | | | | | |
| PAGE |
| |
| |
| |
| |
| |
| |
| |
| |
| |
| |
| |
| |
| |
| |
| |
| |
| Item 9C. Disclosure Regarding Foreign Jurisdictions that Prevent Inspections | |
| |
| |
| |
| |
| |
| |
| |
| |
| |
| |
PART I
Item 1. Business.
General
Encore Wire Corporation is a Delaware corporation, incorporated in 1989, with its principal executive office and manufacturing plants located at 1329 Millwood Road, McKinney, Texas 75069. The Company’s telephone number is (972) 562-9473. As used in this annual report, unless otherwise required by the context, the terms “we,” “our,” “Company,” “Encore,” and “Encore Wire” refer to Encore Wire Corporation.
The Company manufactures a broad range of electrical wire and cables, used to distribute power from the transmission grid to the wall outlet or switch. Encore’s diversified product portfolio and low-cost of production positions it exceptionally well to play a key role in the transition to a more sustainable and reliable energy infrastructure. Our products are proudly made in America at our vertically-integrated, single-site, Texas campus.
The Company sells its products through manufacturers’ representatives to wholesale electrical distributors servicing the residential, commercial, and industrial sectors.
Strategy
Encore Wire’s strategy is to combine its industry-leading service model with its world-class operations to meet demand profitability with loyal electrical distributor customers in a high-performance industry. Encore’s customer service, expansive single-campus model, low-cost production, centralized distribution, product innovation, and deep company culture have promoted Encore’s growth and should contribute to its future success.
Customer Service: Customer loyalty has been a key driver of Encore’s success, which it has earned through an intense focus on customer needs, building and maintaining strong relationships, exceeding performance and service expectations with an industry-leading order fill rate, and rapidly handling customer orders, shipments, and inquiries. Encore maintains broad and deep product inventories based on our customers’ needs, and believes that the speed and completeness with which it fills orders are critical to marketing its products.
Single-Campus Model: Encore’s single-site campus is a key competitive advantage. It enables a cohesive culture of collaboration and performance, low-cost manufacturing, distribution and administration efficiencies, speed to manufacture and ship products, exceptional quality and safety programs, manufacturing flexibility and agility, acute cost control, optimized raw material planning and usage, and a resilience to supply chain issues experienced by others in our industry.
Product Innovation: Encore has been a leader in bringing new ideas and innovative products to a “commodity” product line.
Encore pioneered the widespread use of Colored Insulation on feeder sizes of commercial wire, as well as colors on residential (non-metallic) cable. Encore’s colors have become the industry standard and have improved job-site safety, provided handling efficiencies for electrical distributors, and reduced installation times for electrical contractors. Use of colors also enables building inspectors to immediately identify installed wire.
Encore Wire’s patented SmartColor ID® system for metal-clad and armor-clad cables allows for quick and accurate identification of gauge, number of conductors, wire and jacket type.
Our spool-free PullPro® is a lightweight, portable, durable case weighing less than thirty pounds that requires no additional tools for a tangle-free wire pull. With no spools to crack or discard, it improves job-site scrap rates and reduces trash and waste.
We believe our Reel Payoff® is the industry's first self-spinning wooden reel, which allows pulling on or off the pallet with no additional tools.
Additionally, Encore currently has multiple patents and patent-pending innovations that range from process improvements to packaging solutions.
Low-Cost Production: Encore’s low-cost production capability features an efficient plant design and an incentivized work force.
Efficient Plant Design: Encore’s automated wire manufacturing equipment is integrated in an efficient design that reduces material handling, labor and in-process inventory.
Incentivized Work Force: The Company has a long term incentive plan that enhances the motivation of its salaried manufacturing supervisors. The Company also has a comprehensive safety program creating a world-class culture by engaging employees, identifying and eliminating risk, and training employees to be successful. The Company provides a 401(k) retirement savings plan to all employees and a monthly operations incentive plan for hourly employees.
Products
Encore offers an electrical building wire product line that consists primarily of NM-B cable, UF-B cable, THHN/THWN-2, XHHW-2, USE-2, RHH/RHW-2 and other types of wire products, including SEU, SER, Photovoltaic, URD, tray cable, metal-clad and armored cable. All of these products are manufactured with copper or aluminum as the current-carrying component of the conductor. The principal bases for differentiation among stock-keeping units are product type, conductor type, diameter, insulation, length, color, and packaging.
Manufacturing
The efficiency of Encore’s manufacturing facility is a key element of its low-cost production capability. Encore’s wire manufacturing lines have been integrated so that the handling of product is substantially reduced throughout the production process. The manufacturing process for the Company’s various products involves multiple steps, including casting, drawing, stranding, compounding, insulating, cabling, jacketing and armoring.
Encore manufactures and tests all of its products in accordance with the Underwriters Laboratories (UL) standards, a nationally recognized testing and standards agency.
Customers
Encore sells its wire to wholesale electrical distributors throughout the United States. Most distributors supply products to electrical contractors. Encore’s customers are numerous and diversified. Encore has two customers, each of whom slightly exceeds 10% of the Company's total sales. Encore has no customer, the loss of which would have a material adverse effect on the Company.
Encore believes that the speed and completeness with which it fills customers’ orders is crucial to its ability to service demand for its products. The Company also believes that, for a variety of reasons, many customers strive to maintain lean inventories. Because of this trend, the Company seeks to maintain sufficient inventories to satisfy customers’ orders promptly.
Marketing and Distribution
Encore markets its products throughout the United States through independent manufacturers’ representatives.
Encore maintains the majority of its finished product inventory at its service center in McKinney, Texas. In order to provide flexibility in handling customer requests for immediate shipment, additional finished product inventories are maintained at warehouses owned and operated by some of the Company's independent manufacturers’ representatives located strategically across the United States.
Finished goods are typically shipped to customers by trucks operated by common carriers. The decision regarding the carrier to be used is based primarily on availability and cost.
The Company invoices its customers directly for products purchased and pays the manufacturer's representative a commission based on pre-established rates. The Company determines customer credit limits. The Company lowered its reserve for credit losses by $1.3 million and recorded credit losses of $0.05 million in 2023. The company recorded no reserve for credit losses in 2022, but reserved $1.5 million for credit losses in 2021. The manufacturers’ representatives have no discretion to determine prices charged for the Company’s products and all sales are subject to Company approval.
Human Capital
General
The Company fosters a culture for our employees based on the old-fashioned values of service, professionalism and stewardship. We encourage our employees to do the right thing under any circumstances and to conform to our Code of Conduct and Ethics. These values are a key aspect of our human capital retention and they inform our employment and compensation philosophies.
Employees
Encore believes that its hourly employees are highly motivated and that their motivation contributes significantly to Encore’s efficient operation. The Company believes that competitive hourly compensation coupled with sound management practices focuses its employees on maintaining high production standards and product quality.
As of December 31, 2023, Encore had 1,629 employees, 1,350 of whom were paid hourly wages and were primarily engaged in the operation and maintenance of the Company’s manufacturing and warehouse facilities. The Company’s remaining employees were executive, supervisory, administrative, sales and clerical personnel. The Company considers its relations with its employees to be good. The Company has no collective bargaining agreements with any of its employees.
Compensation and Benefits
The Company rewards employees with competitive compensation and benefits packages, including attractive medical plans, a 401(K) retirement savings plan, opportunities for annual bonuses, and, for eligible employees, long-term incentives and a deferred compensation plan. The Company believes that long term incentives, like stock-based compensation, are a critical part of its compensation program and allows the Company to attract and retain talented employees.
Health and Safety
Employee health and safety is a top priority for the Company. The Company is committed to providing a safe and healthy work environment and to conducting its business in a safe and environmentally protective manner. All employees and officers are expected to perform their duties consistent with site specific safety and environmental rules and regulations and site application of Company best practices. The Company understands how the health of its employees impacts not only their work, but their family life, too. The Company offers an Occumed On-Site Clinic with a nurse practitioner for employees and their immediate families. For many, the Occumed On-Site Clinic provides basic health screenings and treatment equal to those at a general practice facility which otherwise might not be possible. The Company also offers a wide range of health and wellness services to assist its employees and their families with making good lifestyle choices.
Diversity and Inclusion
The Company is committed to and values hiring employees with varied personal and professional backgrounds, perspectives and experiences, promoting a culture of diversity and inclusion. The diversity of the Company’s employees is a tremendous asset. The Company is firmly committed to providing equal opportunity in all aspects of employment and will not tolerate acts of discrimination or harassment. The Company is committed to employing and advancing in employment all persons without regard to their race, color, sex, religion, national origin, citizenship, age, gender identity, sexual orientation, marital status, genetic information, veteran status, disability, or other protected categories.
Raw Materials
The principal raw materials used by Encore in manufacturing its products are copper cathode, copper scrap, PVC thermoplastic compounds, XLPE compounds, aluminum, steel, paper, and nylon, all of which are readily available from a number of suppliers. Copper is the principal raw material used by the Company in manufacturing its products, constituting 80.8% of the dollar value of all raw materials used by the Company during 2023. Copper requirements for manufacturing our wire are purchased primarily from miners and commodity brokers at prices determined each month primarily based on the average daily COMEX closing prices for copper for that month, plus a negotiated premium. The Company also purchases raw materials necessary to manufacture various PVC thermoplastic compounds. These raw materials include PVC resin, clay, and plasticizer.
The Company produces copper rod from purchased copper cathode and copper scrap in its own rod fabrication facility. The Company reprocesses copper scrap generated by its operations as well as copper scrap purchased from others. In 2023, the Company’s copper rod fabrication facility manufactured the majority of the Company’s copper rod requirements. The Company purchases aluminum rod from various suppliers for aluminum wire production.
The Company also compounds its own wire jacket and insulation compounds. The process involves the mixture of PVC raw material components to produce the PVC used to insulate the Company’s wire and cable products. The raw materials include PVC resin, clay, and plasticizer. During the last year, the Company’s plastic compounding facility produced the vast majority of the Company’s PVC requirements.
Competition
The electrical wire and cable industry is highly competitive. The Company competes with several companies who manufacture and sell wire and cable products beyond the building wire segment in which the Company competes. The Company’s primary competitors include Southwire Company, LLC, Cerrowire (a Marmon/Berkshire Hathaway company), General Cable (a company of the Prysmian Group) and AFC Cable Systems, Inc. (a part of Atkore International).
For all our products, the Company believes that it is competitive with respect to all relevant factors, including order fill rate, quality, pricing, and breadth of product line.
Compliance with Governmental and Environmental Regulations
The Company is subject to federal, state and local laws covering a wide variety of subject matters, including environmental protection laws and regulations governing the Company’s operations and the use, handling, disposal and remediation of hazardous substances currently or formerly used by the Company. The laws and regulations often impose costly compliance requirements that carry substantial penalties for failure to comply. Changes in environmental laws and regulations occur frequently, and any changes that result in more stringent and costly pollution control or waste handling, storage, transport, disposal, or cleanup requirements could materially and adversely affect our operations and financial position, as well as the wire and cable industry in general. Management believes the Company complies with all such rules including certain environmental permitting and reporting requirements. Historically, compliance with laws and regulations, including environmental regulations, has not had a material impact on the capital expenditures, earnings and competitive position of the Company.
Intellectual Property Matters
From time to time, the Company files patent applications with the United States Patent and Trademark Office. The Company currently owns several patents and pending patent applications. The Company also owns several registered trademarks and pending trademark applications with the U.S. Patent and Trademark Office. The current registrations for the marks will expire on various dates from 2023 to 2031, but each registration can be renewed indefinitely as long as the respective mark continues to be used in commerce and the requisite proof of continued use or renewal application, as applicable, is filed. These trademarks provide source identification for the goods manufactured and sold by the Company and allow the Company to achieve brand recognition within the industry.
Internet Address/SEC Filings
The Company’s Internet address is https://www.encorewire.com. Under the “Investors” section of our website, the Company provides a link to our electronic Securities and Exchange Commission (“SEC”) filings, including our annual report on Form 10-K, our quarterly reports on Form 10-Q, our current reports on Form 8-K, director and officer beneficial ownership reports filed pursuant to Section 16 of the Securities Exchange Act of 1934, as amended, and any amendments to these reports. All such reports are available free of charge and are available as soon as reasonably practicable after the Company files such material with, or furnishes it to, the SEC.
The SEC maintains an Internet site that contains reports, proxy and information statements, and other information regarding issuers that file electronically with the SEC at https://www.sec.gov.
Information about our Executive Officers
Information regarding Encore’s executive officers including their respective ages as of February 16, 2024, is set forth below: | | | | | | | | | | | |
| Name | Age | | Position with Company |
| Daniel L. Jones | 60 | | Chairman of the Board of Directors, President and Chief Executive Officer |
| | | |
| Bret J. Eckert | 57 | | Executive Vice President and Chief Financial Officer |
Mr. Jones has held the office of President and Chief Executive Officer of the Company since February 2006. He performed the duties of the Chief Executive Officer in an interim capacity from May 2005 to February 2006. From May 1998 until February 2005, Mr. Jones was President and Chief Operating Officer of the Company. He previously held the positions of Chief Operating Officer from October 1997 until May 1998, Executive Vice President from May 1997 to October 1997, Vice President-Sales and Marketing from 1992 to May 1997, after serving as Director of Sales since joining the Company in November 1989. He has also served as a member of the Board of Directors since May 1992 and was named Chairman of the Board in 2014.
Mr. Eckert has held the office of Executive Vice President since December 2022. He served as Vice President-Finance, Treasurer, Secretary and Chief Financial Officer of Encore since January 2020. He joined the Company in August 2019 as Vice President-Finance. Prior to joining the Company, Bret served as Executive Managing Director for the Houston office of Riveron Consulting LLC, a business advisory firm, from June 2018 to August 2019. Previously he was Senior Vice President and Chief Financial Officer of Atmos Energy Corporation in Dallas for approximately five years. He spent the first twenty-two years of his career with Ernst & Young LLP where he was a partner for ten years.
All executive officers are elected annually by the Board of Directors to serve until the next annual meeting of the Board or until their respective successors are chosen and qualified.
Item 1A. Risk Factors.
The following are risk factors that could affect the Company’s business, financial results, and results of operations. These risk factors should be carefully considered in evaluating us and our common stock. Any of these risks, many of which are beyond our control, could materially and adversely affect our financial condition, results of operations or cash flows, or cause our actual results to differ materially from those projected in any forward-looking statements contained in this Annual Report on Form 10-K. Before purchasing the Company’s stock, an investor should know that making such an investment involves some risks, including the risks described below. If any of the risks mentioned below or other unknown risks actually occur, the Company’s business, financial condition, or results of operations could be negatively affected. In that case, the trading price of its stock could fluctuate significantly. We may also face other risks and uncertainties that are not presently known, are not currently believed to be material, or are not identified below because they are common to all businesses. Past financial performance may not be a reliable indicator of future performance, and historical trends should not be used to anticipate results or trends in future periods.
Risks Related to Our Business and Industry
Supply and Availability of Raw Materials, Supply Chain Constraints and Profitability Margins
The success of our business depends on our ability to meet customer demand of a commodity product in a highly competitive market, and sourcing an adequate supply of raw materials, including copper, is vital to our business and operations. While the Company generally believes our supply of raw materials is adequate, the Company could experience instances of limited supply of certain raw materials, resulting in extended lead times and higher prices.
Shortages or interruptions (including due to labor or political disputes) in the supply of our raw materials could disrupt our operations, and our business and financial condition could be materially adversely affected by such disruptions. Limitations inherent within our supply chain of certain raw materials, including competitive, governmental, and legal limitations, natural disasters, and other events, could impact costs, and future increases in the costs of these items, including, for example, the adoption of new tariffs by the United States and other countries, and a resurgence of the COVID-19 pandemic could adversely affect our profitability and availability of raw materials. There can be no assurance that future price increases will be successfully passed through to customers or that we will be able to find alternative suppliers.
Product Pricing and Volatility of Copper Market
Price competition for copper electrical wire and cable is significant, and the Company sells its products in accordance with prevailing market prices. Wire and cable prices can, and frequently do, change on a daily basis. This competitive pricing market for wire does not always mirror changes in copper prices, making margins highly volatile. Copper, a commodity product, is the principal raw material used in the Company’s manufacturing operations. The price of copper fluctuates depending on general economic conditions and in relation to supply and demand and other factors, including changes in regulatory, geopolitical, political, social, economic, tax or monetary policies, and it causes monthly variations in the cost of copper purchased by the Company. The SEC allows shares of physically backed copper exchange traded funds (“ETFs”) to be listed and publicly traded. Such funds and other copper ETFs like them hold copper cathode as collateral against their shares. The acquisition of copper cathode by copper ETFs may materially decrease or interrupt the availability of copper for immediate delivery in the United States, which could materially increase the Company’s cost of copper. In addition to rising copper prices and potential supply shortages, we believe that ETFs and similar copper-backed derivative products could lead to increased copper price volatility. While the Company has experienced increased profitability in recent quarters, the Company cannot predict future copper prices or the effect of fluctuations in the costs of copper on the Company’s future operating results and, as a result, cannot predict how long the Company's increased profitability will continue and whether such positive financial trends will be sustained. Consequently, fluctuations in copper prices caused by market forces can significantly affect the Company’s financial results.
Industry Conditions and Cyclicality
The residential, commercial and industrial construction industry, which is the end user of the Company’s products, is cyclical and is affected by a number of factors, including the general condition of the economy, market demand, and changes in interest rates. Industry sales of electrical wire and cable products tend to parallel general construction activity, which includes remodeling. Data on remodeling is not readily available. However, remodeling activity historically trends up when new construction slows down. Construction activity is affected by the ability of our end users to finance projects, which may be severely reduced due to a widespread outbreak of contagious disease, including an epidemic or pandemic such as the COVID-19 pandemic. Residential, commercial and industrial construction could decline if companies and consumers are unable to finance construction projects or if the economy precipitously declines or stalls, which could result in delays or cancellations of capital projects.
Deterioration in the financial condition of the Company’s customers due to industry and economic conditions may result in reduced sales, an inability to collect receivables and payment delays or losses due to a customer’s bankruptcy or insolvency. Although the Company’s bad debt experience has been low in recent years, the Company’s inability to collect receivables may increase the amounts the Company must expense against its bad debt reserve, decreasing the Company’s profitability. A downturn in the residential, commercial or industrial construction industries and general economic conditions may have a material adverse effect on the Company.
Competition
The electrical wire and cable industry is highly competitive. The Company competes with several manufacturers of wire and cable products that have substantially greater resources than the Company does. Some of these competitors are owned and operated by large, diversified companies. The principal elements of competition in the wire and cable industry are, in the opinion of the Company, pricing, product availability and quality and, in some instances, breadth of product line. The Company believes that it is competitive with respect to all of these factors. While the number of manufacturers producing
wire and cable has declined in the past, there can be no assurance that new competitors will not emerge or that existing producers will not employ or improve upon the Company’s manufacturing and marketing strategy.
Risks Related to Our Operations
Operating Results May Fluctuate
Encore’s results of operations may fluctuate as a result of a number of factors, including fluctuation in the demand for and shipments of the Company’s products. Therefore, comparisons of results of operations, including recent periods of increased profitability, have been and will be impacted by the volume of such orders and shipments, and the Company cannot predict if periods of increased profitability will continue in the future. In addition, the Company's operating results could be adversely affected by the following factors, among others, such as variations in the mix of product sales, price changes in response to competitive factors, increases in raw material costs, freight and other significant costs, the loss of key manufacturer’s representatives who sell the Company’s product line, increases in utility costs (particularly electricity and natural gas), various types of insurance coverage, and interruptions in plant operations resulting from the interruption of raw material supplies and other factors. Additionally, our results of operations could be impacted by macro-economic and geopolitical conditions as well as other outside factors, including changes in regulatory, geopolitical, political, social, economic, tax or monetary policies, and other factors.
Reliance on Senior Management
Encore’s future operating results depend, in part, upon the continued service of its senior management, including, Mr. Daniel L. Jones, Chairman, President and Chief Executive Officer, and Mr. Bret J. Eckert, the Company’s Executive Vice President and Chief Financial Officer (neither of whom is bound by an employment agreement). The Company’s future success will depend upon its continuing ability to attract and retain highly qualified managerial and technical personnel. Competition for such personnel is intense, and there can be no assurance that the Company will retain its key managerial and technical employees or that it will be successful in attracting, assimilating or retaining other highly qualified personnel in the future.
Patent and Intellectual Property Disputes
Disagreements about patents and intellectual property rights occur in the wire and cable industry. The unfavorable resolution of a patent or intellectual property dispute could preclude the Company from manufacturing and selling certain products or could require the Company to pay a royalty on the sale of certain products. Patent and intellectual property disputes could also result in substantial legal fees and other costs.
Cybersecurity Breaches and other Disruptions to our Information Technology Systems
The efficient operation of our business is dependent on our information technology systems to process, transmit and store sensitive electronic data, including employee, distributor and customer records, and to manage and support our business operations and manufacturing processes. The secure maintenance of this information is critical to our operations. Despite our security measures, our information technology system may be vulnerable to attacks by hackers or breaches due to errors or malfeasance by employees and others who have access to our system, or other disruptions during the process of upgrading or replacing computer software or hardware, power outages, computer viruses, telecommunication or utility failures or natural disasters. Any such event could compromise our information technology systems, expose our customers, distributors and employees to risks of misuse of confidential information, impair our ability to effectively and timely operate our business and manufacturing processes, and cause other disruptions, which could result in legal claims or proceedings, disrupt our operations and the services we provide to customers, damage our reputation, and cause a loss of confidence in our products and services, any of which could adversely affect our results of operations and competitive position.
Climate Change
Future deterioration of the environment due to climate change or increased severe weather related events associated with climate change could affect both our operations and the operations of our suppliers and customers. Climate change may be associated with extreme weather conditions such as more intense hurricanes, thunderstorms, tornadoes and snow or ice storms, as well as rising sea levels. Additionally, the Company could experience disruptions or limitations to access of water. Our suppliers may face similar challenges, which could impact our supply chain. Demand for our products may be
impacted regionally as local climates adapt to global environmental changes. However, at this time, we are unable to determine the extent to which climate change may lead to increased storm or weather hazards affecting our operations.
Risks Related to Ownership of Our Stock
Common Stock Price May Fluctuate
Future announcements concerning Encore or its competitors or customers, quarterly variations in operating results, announcements of technological innovations, the introduction of new products or changes in product pricing policies by the Company or its competitors, developments regarding proprietary rights, changes in earnings estimates by analysts, or reports regarding the Company or its industry in the financial press or investment advisory publications, among other factors, could cause the market price of the common stock to fluctuate substantially. These fluctuations, as well as general economic, political and market conditions, such as recessions, world events, military conflicts or market or market-sector declines, may materially and adversely affect the market price of the common stock.
Beneficial Ownership of the Company’s Common Stock by a Small Number of Stockholders
A small number of significant stockholders beneficially own greater than 36% of the Company’s outstanding common stock. Depending on stockholder turnout for a stockholder vote, these stockholders, acting together, could be able to control the election of directors and certain matters requiring majority approval by the Company’s stockholders. The interests of this group of stockholders may not always coincide with the Company’s interests or the interests of other stockholders.
In the future, these stockholders could sell large amounts of common stock over relatively short periods of time. The Company cannot predict if, when or in what amounts stockholders may sell any of their shares. Sales of substantial amounts of the Company’s common stock in the public market by existing stockholders or the perception that these sales could occur, may adversely affect the market price of our common stock by creating a public perception of difficulties or problems with the Company’s business.
Future Sales of Common Stock Could Affect the Price of Common Stock
No prediction can be made as to the effect, if any, that future sales of shares or the availability of shares for sale will have on the market price of the common stock prevailing from time to time. Sales of substantial amounts of common stock, or the perception that such sales might occur, could adversely affect prevailing market prices of the common stock.
Risks Related to Laws and Regulations
Environmental Liabilities
The Company is subject to federal, state and local environmental protection laws and regulations governing the Company’s operations and the use, handling, disposal and remediation of hazardous substances currently or formerly used by the Company. A risk of environmental liability is inherent in the Company’s current manufacturing activities in the event of a release or discharge of a hazardous substance generated by the Company. Under certain environmental laws, including the Comprehensive Environmental Response, Compensation and Liability Act, as amended; the Resource Conservation and Recovery Act, as amended; and comparable state statutes and regulations promulgated thereunder, the Company could be held jointly and severally responsible for the remediation of any hazardous substance contamination at the Company’s facilities and at third party waste disposal sites and could also be held liable for any consequences arising out of human exposure to such substances or other environmental damage. We believe that we are in substantial compliance with applicable requirements related to waste handling, and that we hold all necessary and up-to-date permits, registrations and other authorizations to the extent that our operations require them under such laws and regulations. However, there can be no assurance that the costs of complying with environmental, health and safety laws and requirements in the Company’s current operations or the liabilities arising from past releases of, or exposure to, hazardous substances, will not result in future expenditures by the Company that could materially and adversely affect the Company’s financial results, cash flow or financial condition.
Our Targets Related to Sustainability and Emissions Reduction Initiatives, Including our Public Statements and Disclosures Regarding Them, May Expose Us to Numerous Risks
We have developed, and will continue to develop, targets related to our environmental, social, and governance ("ESG") initiatives. Statements in this and other reports we file with the SEC and other public statements related to these initiatives
reflect our current plans and expectations and are not a guarantee the targets will be achieved or achieved on the currently anticipated timeline. Our ability to achieve our ESG targets, including emissions reductions, is subject to numerous factors and conditions, some of which are outside of our control, and failure to achieve our announced targets or comply with ethical, environmental or other standards, including reporting standards, may expose us to government enforcement actions or private litigation and adversely impact our business. Further, our continuing efforts to research, establish, accomplish and accurately report on these targets may create additional operational risks and expenses and expose us to reputational, legal and other risks.
Investor and regulator focus on ESG matters continues to increase. If our ESG initiatives do not meet our investors' or other stakeholders' evolving expectations and standards, investment in our stock may be viewed as less attractive and our reputation, contractual, employment and other business relationships may be adversely impacted.
Regulations Related to Conflict-free Minerals May Force Us to Incur Additional Expenses
In August 2012, the SEC adopted disclosure requirements related to certain minerals sourced from the Democratic Republic of Congo or adjoining countries, as required by Section 1502 of the Dodd-Frank Wall Street Reform and Consumer Protection Act (the “Dodd-Frank Act”). The SEC rules implementing Section 1502 of the Dodd-Frank Act require us to perform due diligence, and report whether “conflict minerals,” which are defined as tin, tantalum, tungsten and gold, necessary to the functionality of a product we purchase originated from the Democratic Republic of Congo or an adjoining country. Since 2014, we have been required to file with the SEC on an annual basis a specialized disclosure report on Form SD regarding such matters. As our supply chain is complex, we may incur significant costs to determine the source and custody of conflict minerals that are used in the manufacture of our products in order to comply with these regulatory requirements in the future. We may also face reputation challenges if we are unable to verify the origins for all conflict minerals used in our products, or if we are unable to conclude that our products are “conflict free.” Over time, conflict minerals reporting requirements may affect the sourcing, price and availability of our products, and may affect the availability and price of conflict minerals that are certified as conflict free. Accordingly, we may incur significant costs as a consequence of regulations related to conflict-free minerals, which may adversely affect our business, financial condition or results of operations.
Risks Related to Taxes
Changes in Tax Laws Could Increase Our Tax Rate and Adversely Affect Our Results of Operations
A change in tax laws is one of many factors that impact the Company’s effective tax rate, and any such change could adversely impact our effective tax rate, financial condition and results of operations.
The Inflation Reduction Act (“IRA”) was enacted on August 16, 2022. The IRA includes provisions imposing a 1% excise tax on share repurchases that occur after December 31, 2022, and introduces a 15% corporate alternative minimum tax on “adjusted financial statement income” of certain large corporations (generally, corporations reporting at least $1 billion of average adjusted pre-tax net income on their consolidated financial statements). Based on application of currently available guidance, the Company does not expect the IRA to have a material adverse impact to its financial statements.
It cannot be predicted whether or when tax laws, rules, regulations or ordinances may be enacted, issued, or amended that could materially and adversely impact our financial position, results of operations, or cash flows.
General Risk Factors
Outbreak of Contagious Disease
Our business and the businesses of our suppliers, distributors and customers could be adversely affected by the effects of a widespread outbreak of contagious diseases, including COVID-19, or any ongoing variants. Any outbreak of contagious diseases, and other adverse public health developments, could cause a disruption in our supply chain, distribution and demand for our products. The duration of any such disruption and the related financial impact from COVID-19, or any ongoing variants, and other epidemics and pandemics cannot be reasonably estimated at this time. Although the effects of the COVID-19 pandemic during 2023 were not as significant as prior years, new variants continued to cause waves of COVID-19 cases around the world. The occurrence or continuation of any of these events could lead to decreased revenues and limit our ability to execute on our business plan, which could adversely affect our business, financial condition and results of operations.
Item 1B. Unresolved Staff Comments.
None.
Item 1C. Cybersecurity.
Cybersecurity Risk Management and Strategy
We have developed and implemented a cybersecurity risk management program intended to protect the confidentiality, integrity, and availability of our critical systems and information.
Our cybersecurity risk management program is aligned to the Company's business strategy. It shares common methodologies, reporting channels and governance processes that apply to the other areas of enterprise risk, including legal, compliance, strategic, operational, and financial risk. Key elements of our cybersecurity risk management program include:
•risk assessments designed to help identify material cybersecurity risks to our critical systems, information, products, services, and our broader enterprise information technology environment;
•a security team principally responsible for managing our cybersecurity risk assessment processes and our response to cybersecurity incidents;
•the use of external service providers, where appropriate, to assess, test or otherwise assist with aspects of our security procedures;
•training and awareness programs for team members that include periodic and ongoing assessments to drive adoption and awareness of cybersecurity processes and procedures;
•a cybersecurity incident response plan that includes procedures for responding to cybersecurity incidents; and
•a third-party risk management process for service providers, suppliers, and vendors.
In the last three fiscal years, the Company has not experienced any material cybersecurity incidents. For a discussion of whether and how any risks from cybersecurity threats, including as a result of any previous cybersecurity incidents, have materially affected or are reasonably likely to materially affect us, including our business strategy, results of operations or financial condition, refer to Item 1A. Risk Factors - "Cybersecurity Breaches and other Disruptions to our Information Technology Systems", which is incorporated by reference into this Item 1C.
Cybersecurity Governance
The Board regularly receives reports from our executive officers and third parties on cybersecurity matters. In addition, the Board receives reports addressing cybersecurity as part of our overall enterprise risk management program and to the extent cybersecurity matters are addressed in regular business updates.
Management is responsible for developing cybersecurity programs, including as may be required by applicable law or regulation. These individuals' expertise in IT and cybersecurity generally has been gained from a combination of education, including relevant degrees and/or certifications, and prior work experience. They are informed by their respective cybersecurity teams about, and monitor, the prevention, detection, mitigation and remediation of cybersecurity incidents as part of the cybersecurity programs described above.
Item 2. Properties.
Encore maintains its corporate office and manufacturing plants in McKinney, Texas, approximately 32 miles north of downtown Dallas. The Company’s facilities are located on a combined site of approximately 460 acres and consist of buildings containing over 3.0 million square feet of floor space. The corporate office, plants and equipment are owned by the Company and are not mortgaged to secure any of the Company’s existing indebtedness. Encore believes that its plants and equipment are suited to its present needs, comply with applicable federal, state and local laws and regulations, and are properly maintained and adequately insured.
Item 3. Legal Proceedings.
For information on the Company’s legal proceedings see Note 10 to the Company’s financial statements included in Item 8 to this report and incorporated herein by reference.
Item 4. Mine Safety Disclosures.
Not applicable.
PART II
Item 5. Market for Registrant’s Common Equity, Related Stockholder Matters and Issuer Purchases of Equity Securities.
The Company’s common stock is traded and quoted on the NASDAQ Stock Market’s Global Select Market under the symbol “WIRE.” As of February 15, 2024, there were 30 holders of record of the Company’s common stock.
The Company currently expects to continue to make periodic cash dividends consistent with its historical practice.
Issuer Purchases of Equity Securities
Note 9 to the Company’s financial statements included in Item 8 to this report is hereby incorporated herein by reference.
The following table provides information relating to our purchases of shares of our common stock during the three months ended December 31, 2023. | | | | | | | | | | | | | | | | | | | | | | | | | | | | | | | | | | | | | | | | | |
| | (a) | | (b) | | (c) | | (d) |
Period | | Total Number of Shares Purchased | | Average Price Paid Per Share | | Total Number of Shares Purchased as Part of Publicly Announced Plans or Programs (1) | | Maximum Number of Shares that May Yet Be Purchased Under the Plans or Programs (1) |
October 1, 2023 – October 31, 2023 | | 476,300 | | | | $ | 178.77 | | | | 476,300 | | | | 813,617 | |
November 1, 2023 – November 30, 2023 | | — | | | | — | | | | — | | | | 813,617 | |
December 1, 2023 – December 31, 2023 | | — | | | | — | | | | — | | | | 813,617 | |
| | 476,300 | | | | $ | 178.77 | | | | 476,300 | | | | |
(1) On November 10, 2006, the Board of Directors approved a stock repurchase program authorizing the Company to repurchase up to an authorized number of shares of its common stock from time to time in the open market or private transactions at the Company's discretion. This authorization originally expired on December 31, 2007, and the Company’s Board of Directors has authorized several increases and annual extensions of this stock repurchase program, most recently in June 2023, authorizing the repurchase of up to 2,000,000 shares of our common stock. As of December 31, 2023, 813,617 shares remained authorized for repurchase through March 31, 2024. Under this program, the Company repurchased 2,661,792 shares of its stock in 2023, 2,055,470 shares in 2022 and 475,557 shares in 2021.
Subsequently, in February 2024, the Board of Directors extended the repurchase authorization for up to 2,000,000 shares of our common stock through March 31, 2025.
Performance Graph
The following graph is not “soliciting material,” is not deemed filed with the SEC, and is not to be incorporated by reference into any of the Company’s filings under the Securities Act of 1933 or the Securities Exchange Act of 1934, as amended, respectively.
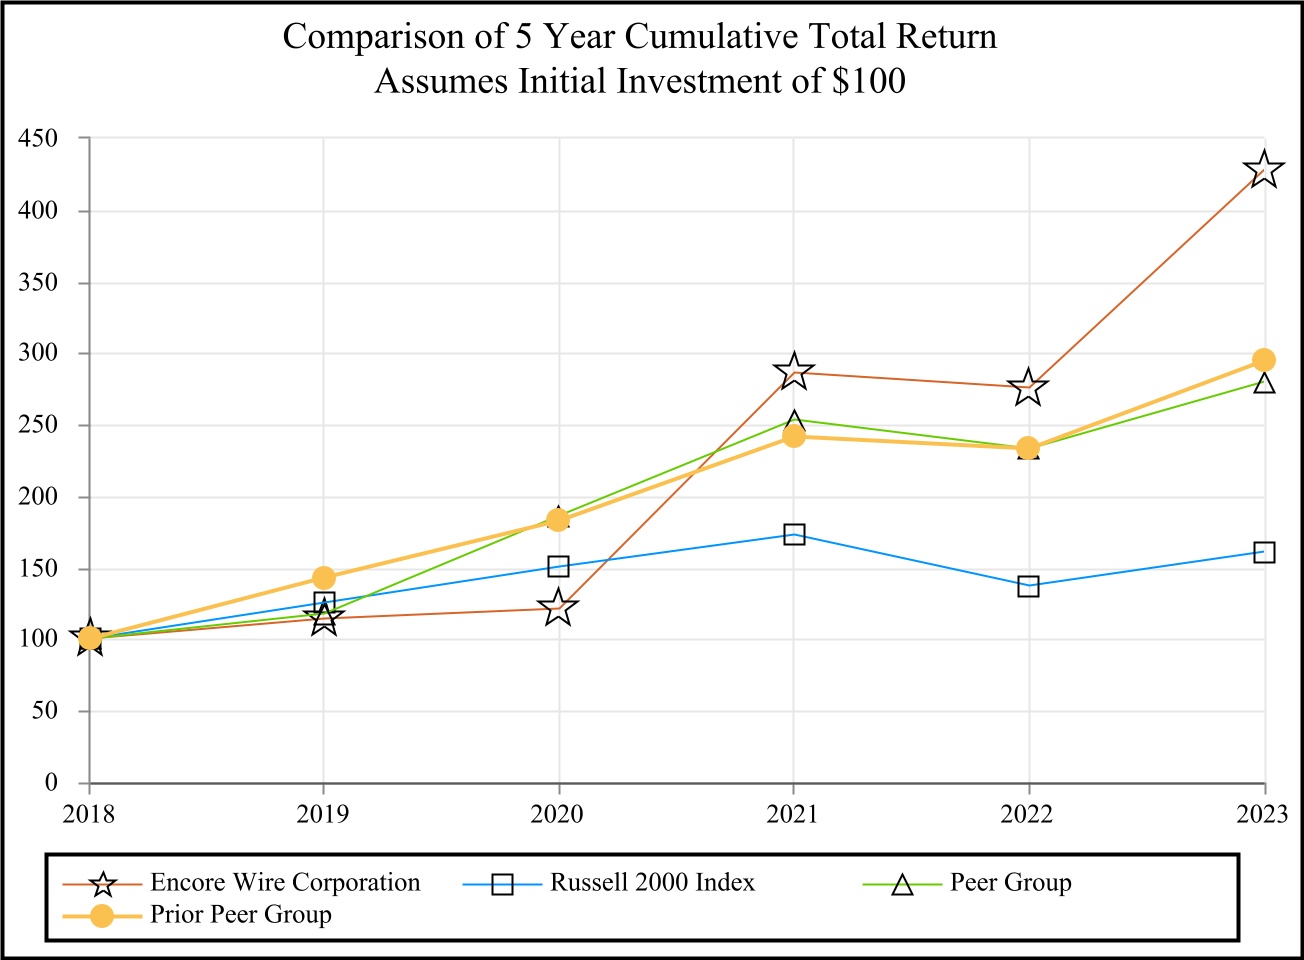
The graph below sets forth the cumulative total stockholder return, which assumes reinvestment of dividends, of a $100 investment in the Company’s common stock, the Russell 2000 Index, the Company’s self-determined peer group for the year ended December 31, 2022 (the “Prior Peer Group”), and the Company’s self-determined peer group for the year ended December 31, 2023 (the “Peer Group”) for the five years ended December 31, 2023.
The Prior Peer Group consisted of Belden Inc., Apogee Enterprises, Inc., Atkore International Group, Inc., Patrick Industries, Inc., Gibraltar Industries, Inc., Nexans S.A., and Prysmian S.P.A. For the year ended December 31, 2023, the Company replaced Nexans S.A. and Prysmian S.P.A, changing its Peer Group to include Barnes Group Inc., Fluor Corporation, Freeport-McMoran Inc., Gates Industrial Corporation Plc, Griffon Corporation, Mueller Industries Inc., Resideo Technologies Inc., Rush Enterprises Inc., Sunrun Inc., and WESCO International Inc. The Company believes that
the updated Peer Group better reflects a broader group of peers with a more comparable median market capitalization who either sell building products or electrical components to the Company’s end-use customers or directly compete with the Company in certain product categories.
| | | | | | | | | | | | | | | | | | | | | | | |
| | As of December 31, |
| Total Return For: | | 2018 | 2019 | 2020 | 2021 | 2022 | 2023 |
| Encore Wire Corporation | | $ | 100.00 | | $ | 114.56 | | $ | 121.13 | | $ | 286.40 | | $ | 275.47 | | $ | 427.90 | |
| Russell 2000 Index | | 100.00 | | 125.52 | | 150.58 | | 172.90 | | 137.56 | | 160.85 | |
| Peer Group | | 100.00 | | 117.54 | | 186.44 | | 253.33 | | 233.11 | | 279.74 | |
| Prior Peer Group | | 100.00 | | 143.07 | | 182.78 | | 241.41 | | 232.86 | | 294.36 | |
| | | | | | | |
| | | | | | | |
| | | | | | | |
| | | | | | | |
| | | | | | | |
| | | | | | | |
| | | | | | | |
| | | | | | | |
| | | | | | | |
| | | | | | | |
| | | | | | | |
| | | | | | | |
Notes
(1)Data presented in the performance graph is complete through December 31, 2023.
(2)The Peer Group is self-determined and consists of the following companies: Barnes Group Inc., Fluor Corporation, Freeport-McMoran Inc., Gates Industrial Corporation Plc, Griffon Corporation, Mueller Industries Inc., Belden Inc., Patrick Industries, Inc., Apogee Enterprises, Inc., Gibraltar Industries, Inc., Atkore Inc., Resideo Technologies Inc., Rush Enterprises Inc., Sunrun Inc., and WESCO International Inc.
(3)The Prior Peer Group is self-determined and consists of the following companies: Belden Inc., Patrick Industries, Inc., Apogee Enterprises, Inc., Gibraltar Industries, Inc., Atkore Inc., Nexans S.A., and
Prysmian S.P.A. The performance graph presented in our Annual Report on Form 10-K for the year ended December 31, 2022, filed with the SEC on February 16, 2023, consisted of this peer group.
(4)Each peer group index uses only the peer group’s performance and excludes the performance of the Company. Each peer group index uses beginning of period market capitalization weighting.
(5)Each data line represents annual index levels derived from compounded daily returns that include all dividends.
(6)The index level for all data lines was set to $100.00 on December 31, 2018.
Item 6. [Reserved].
Item 7. Management’s Discussion and Analysis of Financial Condition and Results of Operations.
Introduction
The following management’s discussion and analysis is intended to provide a better understanding of key factors, drivers and risks regarding the Company and the building wire industry.
Executive Overview
Encore Wire sells a commodity product in a highly competitive market. Management believes that the historical strength of the Company’s growth and earnings is in large part attributable to the following main factors:
•industry-leading order fill rates and responsive customer service;
•single-site, vertically integrated business model;
•deep supplier relationships for key raw materials;
•product innovations and product line expansions based on listening to and understanding customer needs and market trends;
•low cost manufacturing operations, resulting from a state-of-the-art manufacturing complex;
•low distribution and freight costs due in large part to the “one campus” business model;
•a focused management team leading a skilled work force; and
•a team of experienced independent manufacturers’ representatives with strong customer relationships across the United States.
These factors, and others, have allowed Encore Wire to grow from a startup in 1989 to what management believes is one of the largest electric building wire companies in the United States of America. Encore has built a loyal following of customers throughout the United States. These customers have developed a brand preference for Encore Wire in a commodity product line due to the reasons noted above, among others. The Company prides itself on striving to grow sales by expanding its product offerings where profit margins are acceptable. Senior management monitors gross margins daily, frequently extending down to the individual order level. Management strongly believes that this “hands-on” focused approach to the building wire business has been an important factor in the Company's success, and will lead to continued success.
Investment in residential, commercial, and industrial infrastructure drives demand for the Company’s wire and cable products. In 2023, pounds shipped increased 6.7% in copper wire versus 2022. In 2022, pounds shipped increased 7.9% in copper wire versus 2021. In 2021, pounds shipped increased 10.8% in copper wire versus 2020.
General
The Company’s operating results are driven by several key factors, including the volume of product produced and shipped, the cost of copper and other raw materials, the competitive pricing environment in the wire industry and the
resulting influence on gross margins, and the efficiency with which the Company’s plants operate during the period, among others. Price competition for electrical wire and cable is significant and the Company sells its products in accordance with prevailing market prices. Copper, a commodity product, is the principal raw material used by the Company in manufacturing its products. The price of copper fluctuates, depending on general economic conditions, in relation to supply and demand, and other factors, which causes monthly variations in the cost of copper purchased by the Company. Additionally, the SEC allows shares of physically backed copper exchange traded funds (“ETFs”) to be listed and publicly traded. Such funds and other copper ETFs like it hold copper cathode as collateral against their shares. The acquisition of copper cathode by Copper ETFs may materially decrease or interrupt the availability of copper for immediate delivery in the United States, which could materially increase the Company’s cost of copper. In addition to rising copper prices and potential supply shortages, we believe that ETFs and similar copper-backed derivative products could lead to increased price volatility for copper. The Company cannot predict copper prices in the future or the effect of fluctuations in the cost of copper on the Company’s future operating results. Wire prices can, and frequently do change on a daily basis. This competitive pricing market for wire does not always mirror changes in copper prices, making margins highly volatile. Historically, the cost of aluminum has been much lower and less volatile than copper. The tables below highlight the range of closing prices of copper on the COMEX exchange for the periods shown.
COMEX COPPER CLOSING PRICE 2023 | | | | | | | | | | | | | | | | | | | | | | | | | | | | | |
| October
2023 | | November
2023 | | December
2023 | | Quarter Ended
Dec. 31, 2023 | | Year-to-Date
Dec. 31, 2023 |
| High | $ | 3.65 | | | $ | 3.83 | | | $ | 3.94 | | | $ | 3.94 | | | $ | 4.27 | |
| Low | 3.54 | | | 3.58 | | | 3.72 | | | 3.54 | | | 3.54 | |
| Average | 3.60 | | | 3.72 | | | 3.85 | | | 3.72 | | | 3.85 | |
COMEX COPPER CLOSING PRICE 2022 | | | | | | | | | | | | | | | | | | | | | | | | | | | | | |
| | October
2022 | | November
2022 | | December
2022 | | Quarter Ended
Dec. 31, 2022 | | Year-to-Date
Dec. 31, 2022 |
| High | $ | 3.63 | | | $ | 3.95 | | | $ | 3.88 | | | $ | 3.95 | | | $ | 4.93 | |
| Low | 3.36 | | | 3.46 | | | 3.75 | | | 3.36 | | | 3.21 | |
| Average | 3.47 | | | 3.68 | | | 3.82 | | | 3.66 | | | 4.00 | |
COMEX COPPER CLOSING PRICE 2021 | | | | | | | | | | | | | | | | | | | | | | | | | | | | | |
| October
2021 | | November
2021 | | December
2021 | | Quarter Ended
Dec. 31, 2021 | | Year-to-Date
Dec. 31, 2021 |
| High | $ | 4.76 | | | $ | 4.46 | | | $ | 4.47 | | | $ | 4.76 | | | $ | 4.78 | |
| Low | 4.16 | | | 4.27 | | | 4.18 | | | 4.16 | | | 3.54 | |
| Average | 4.45 | | | 4.37 | | | 4.33 | | | 4.38 | | | 4.25 | |
COMEX COPPER CLOSING PRICE 2023 by Quarter | | | | | | | | | | | | | | | | | | | | | | | | | | | | | |
| Quarter Ended
March 31, 2023 | | Quarter Ended
June 30, 2023 | | Quarter Ended
Sept. 30, 2023 | | Quarter Ended
Dec. 31, 2023 | | Year-to-Date
Dec. 31, 2023 |
| High | $ | 4.27 | | | $ | 4.12 | | | $ | 3.99 | | | $ | 3.94 | | | $ | 4.27 | |
| Low | 3.74 | | | 3.55 | | | 3.63 | | | 3.54 | | | 3.54 | |
| Average | 4.08 | | | 3.84 | | | 3.77 | | | 3.72 | | | 3.85 | |
COMEX COPPER CLOSING PRICE 2022 by Quarter | | | | | | | | | | | | | | | | | | | | | | | | | | | | | |
| Quarter Ended
March 31, 2022 | | Quarter Ended
June 30, 2022 | | Quarter Ended
Sept. 30, 2022 | | Quarter Ended
Dec. 31, 2022 | | Year-to-Date
Dec. 31, 2022 |
| High | $ | 4.93 | | | $ | 4.80 | | | $ | 3.71 | | | $ | 3.95 | | | $ | 4.93 | |
| Low | 4.30 | | | 3.71 | | | 3.21 | | | 3.36 | | | 3.21 | |
| Average | 4.55 | | | 4.33 | | | 3.50 | | | 3.66 | | | 4.00 | |
Results of Operations
The following table presents certain items of income and expense as a percentage of net sales for the periods indicated. | | | | | | | | | | | | | | | | | |
| | Year Ended December 31, |
| | 2023 | | 2022 | | 2021 |
| Net sales | 100.0 | % | | 100.0 | % | | 100.0 | % |
| Cost of goods sold: | | | | | |
| Copper | 52.2 | % | | 44.0 | % | | 46.7 | % |
| Other raw materials | 12.5 | % | | 12.0 | % | | 10.5 | % |
| Depreciation | 1.2 | % | | 0.8 | % | | 0.8 | % |
| Labor and overhead | 8.7 | % | | 6.9 | % | | 6.6 | % |
| LIFO adjustment | (0.1) | % | | (0.6) | % | | 1.9 | % |
| | | | | |
| Total cost of goods sold | 74.5 | % | | 63.1 | % | | 66.5 | % |
| | | | | |
| Gross profit | 25.5 | % | | 36.9 | % | | 33.5 | % |
| Selling, general and administrative expenses | 7.9 | % | | 6.5 | % | | 6.5 | % |
| Operating income | 17.6 | % | | 30.4 | % | | 27.0 | % |
| Net interest and other income | 1.3 | % | | 0.3 | % | | — | % |
| | | | | |
| Income before income taxes | 18.9 | % | | 30.7 | % | | 27.0 | % |
| Provision for income taxes | 4.4 | % | | 6.9 | % | | 6.1 | % |
| | | | | |
| Net income | 14.5 | % | | 23.8 | % | | 20.9 | % |
The following discussions and analyses relate to factors that have affected the operating results of the Company for the years ended December 31, 2023, 2022 and 2021. Reference should also be made to the Financial Statements and the related notes included under “Item 8. Financial Statements and Supplementary Data” of this Annual Report. Additional information about results for year end 2021 and certain year-on-year comparisons between 2022 and 2021 can be found in “Management’s Discussion and Analysis of Financial Condition and Results of Operations” in the Company’s Annual Report on Form 10-K for the year ended December 31, 2022.
Net sales for the twelve months ended December 31, 2023 were $2.568 billion compared to $3.018 billion during the same period in 2022 and $2.593 billion during the same period in 2021. Copper unit volume, measured in pounds of copper contained in the wire sold, increased 6.7% in the year ended December 31, 2023 versus the year ended December 31, 2022. The 14.9% decrease in net sales dollars in 2023 versus 2022 was primarily the result of a 12.3% decrease in copper wire sales, driven by a 17.8% decrease in the average selling price of copper wire, partially offset by a 6.7% increase in copper wire pounds shipped. Additionally, aluminum net sales represented 12.9% of net sales for the year ended December 31, 2023 compared to 15.4% for the year ended December 31, 2022. The 16.4% increase in net sales dollars in 2022 versus 2021 was primarily the result of a 7.4% increase in copper wire sales, driven by a 7.9% increase in copper wire pounds shipped, partially offset by a 0.5% decrease in the average selling price of copper wire due to moderate decreases in copper commodity prices in the trailing six months of 2022.
Cost of goods sold was $1.912 billion, or 74.5% of net sales, in 2023 versus $1.905 billion, or 63.1% of net sales, in 2022 and $1.725 billion, or 66.5% of net sales in 2021. Gross profit decreased to $655.9 million, or 25.5% of net sales in 2023, compared to $1.112 billion, or 36.9% of net sales, in 2022 and $867.7 million, or 33.5% of net sales, in 2021.
Gross profit percentage for the twelve months ended December 31, 2023 was 25.5% compared to 36.9% during the same period in 2022 and 33.5% during the same period in 2021. The average selling price of wire per copper pound sold decreased 17.8% in the twelve months ended December 31, 2023 versus the twelve months ended December 31, 2022, while the average cost of copper per pound purchased decreased 3.7%. The overall increase in total volumes shipped, offset by an anticipated decrease in the average sales price during 2023, resulted in the decreased gross profit margin for the full year of 2023 when compared to 2022. The average selling price of wire per copper pound sold decreased 0.5% in the twelve months ended December 31, 2022 versus the twelve months ended December 31, 2021, while the average cost of copper per pound purchased decreased 2.7%.
Net income for the twelve months ended December 31, 2023 was $372.4 million versus $717.8 million in the same period in 2022 and $541.4 million in the same period in 2021. Fully diluted net earnings per common share were $21.62 in the twelve months ended December 31, 2023 versus $36.91 in the same period in 2022 and $26.22 in the same period in 2021.
Inventories consist of the following at December 31 (in thousands): | | | | | | | | | | | | | | | | | |
| 2023 | | 2022 | | 2021 |
| Raw materials | $ | 64,512 | | | $ | 69,567 | | | $ | 54,012 | |
| Work-in-process | 55,921 | | | 42,611 | | | 40,422 | |
| Finished goods | 139,348 | | | 138,943 | | | 123,401 | |
| Total | 259,781 | | | 251,121 | | | 217,835 | |
| Adjust to LIFO cost | (96,102) | | | (97,934) | | | (117,019) | |
| | | | | |
| Inventory | $ | 163,679 | | | $ | 153,187 | | | $ | 100,816 | |
The quantity of total copper inventory on hand in 2023 was consistent with our quantity of total copper inventory on hand in 2022. The other materials category, which includes a large number of raw materials, had quantity and price changes that included increases and decreases in various other materials. This resulted in a last-in, first-out (LIFO) method adjustment decreasing cost of sales by $1.8 million in 2023. We utilize the LIFO method because it results in a better matching of costs and revenues.
The quantity of total copper inventory on hand increased in 2022, compared to 2021. The other materials category, which includes a large number of raw materials, had quantity changes that included increases and decreases in various other materials. This resulted in a LIFO method adjustment decreasing cost of sales by $19.1 million in 2022.
Based on copper and other raw material prices, there were no lower of cost or market (LCM) adjustments necessary in the periods presented above.
Gross profit was $655.9 million, or 25.5% of net sales, in 2023 compared to $1.112 billion, or 36.9% of net sales, in 2022 and $867.7 million, or 33.5% of net sales, in 2021. The changes in gross profit were due to the factors discussed above.
Selling expenses, which are made up of freight and sales commissions, were $115.2 million in 2023, $133.7 million in 2022 and $109.5 million in 2021. Freight costs decreased in 2023 as a result of a decrease in overall freight rates compared to 2022. In 2022, freight costs increased as a result of increased sales volumes and an increase in overall freight rates, as compared to 2021. Commission costs decreased commensurate with the sales dollar decrease. As a percentage of net sales, selling expenses were 4.5% in 2023, 4.4% in 2022, and 4.2% in 2021. General and administrative expenses were $90.6 million in 2023, $63.7 million in 2022 and $57.6 million in 2021. As a percentage of net sales, general and administrative expenses were 3.5% in 2023 versus 2.1% in 2022 and 2.2% in 2021. Accounts receivable write-offs were $45 thousand in 2023 and zero in 2022 and 2021. The Company decreased the reserve for credit losses in 2023 by $1.3 million, did not record a reserve for credit losses in 2022, and increased the reserve by $1.5 million in 2021.
Net interest and other income was $33.3 million in 2023, $9.8 million in 2022 and $0.2 million in 2021. Both the increase in 2023 and 2022 reflect the economic impact of the pandemic and its effect on interest rates during the years and the resulting interest earned.
Our effective tax rate was 23.2% in 2023, 22.4% in 2022 and 22.6% in 2021. The differences between the provisions for income taxes and the income taxes computed using the federal income tax statutory rate are primarily due to state taxes and non-deductible expenses.
As a result of the foregoing factors, the Company’s net income was $372.4 million in 2023, $717.8 million in 2022 and $541.4 million in 2021.
Liquidity and Capital Resources
The following table summarizes the Company’s cash flow activities (in thousands): | | | | | | | | | | | | | | | | | |
| Year Ended December 31, |
| 2023 | | 2022 | | 2021 |
| Net cash provided by operating activities | $ | 455,206 | | | $ | 688,883 | | | $ | 418,418 | |
| Net cash used in investing activities | (164,535) | | | (148,350) | | | (118,155) | |
| Net cash used in financing activities | (460,593) | | | (248,966) | | | (44,396) | |
| Net increase in cash and cash equivalents | $ | (169,922) | | | $ | 291,567 | | | $ | 255,867 | |
| Annual dividends paid | $ | 1,376 | | | $ | 1,548 | | | $ | 1,633 | |
The Company maintains a substantial inventory of finished products to satisfy customers’ prompt delivery requirements. As is customary in the industry, the Company provides payment terms to most of its customers that exceed terms that it receives from its suppliers. In general, the Company’s standard payment terms result in the collection of a significant majority of net sales within approximately 75 days of the date of the invoice. Therefore, the Company’s liquidity needs have generally consisted of working capital necessary to finance receivables and inventory. Capital expenditures have historically been necessary to expand and update the production capacity of the Company’s manufacturing operations. The Company has historically satisfied its liquidity and capital expenditure needs with cash generated from operations and borrowings under its various debt arrangements. We believe that the Company has sufficient liquidity, and will continue to have sufficient liquidity beyond the short-term outlook.
At December 31, 2023 and 2022, the Company had no debt outstanding.
On February 9, 2021, the Company terminated its previous credit agreement and entered into a new Credit Agreement (the “2021 Credit Agreement”) with two banks, Bank of America, N.A., as administrative agent and letter of credit issuer, and Wells Fargo Bank, National Association, as syndication agent. The 2021 Credit Agreement extends through February 9, 2026 and provides for maximum borrowings of $200.0 million. At our request and subject to certain conditions, the commitments under the 2021 Credit Agreement may be increased by a maximum of up to $100.0 million as long as existing or new lenders agree to provide such additional commitments.
The 2021 Credit Agreement contains provisions to replace LIBOR with a replacement rate as described in the 2021 Credit Agreement. On October 20, 2022, the Company entered into the First Amendment to the 2021 Credit Agreement (the “Amended 2021 Credit Agreement”) which replaced LIBOR with BSBY as permitted under the 2021 Credit Agreement. Borrowings under the line of credit bear interest, at the Company’s option, at either (1) BSBY plus a margin that varies from 1.000% to 1.875% depending upon the Leverage Ratio (as defined in the 2021 Credit Agreement), or (2) the base rate (which is the highest of the federal funds rate plus 0.5%, the prime rate, or BSBY plus 1.0%) plus 0% to 0.375% (depending upon the Leverage Ratio). A commitment fee ranging from 0.20% to 0.325% (depending upon the Leverage Ratio) is payable on the unused line of credit. At December 31, 2023, there were no borrowings outstanding under the Amended 2021 Credit Agreement, and letters of credit outstanding in the amount of $0.3 million left $199.7 million of credit available under the Amended 2021 Credit Agreement. Obligations under the Amended 2021 Credit Agreement are the only contractual borrowing obligations or commercial borrowing commitments of the Company.
Obligations under the Amended 2021 Credit Agreement are unsecured and contain customary covenants and events of default. The Company was in compliance with the covenants as of December 31, 2023.
The Company paid interest totaling $0.4 million in 2023, 2022 and 2021, respectively, none of which was capitalized.
On November 10, 2006, the Board of Directors approved a stock repurchase program authorizing the Company to repurchase up to an authorized number of shares of its common stock from time to time in the open market or private transactions at the Company's discretion. This authorization originally expired on December 31, 2007, and the Company’s Board of Directors has authorized several increases and annual extensions of this stock repurchase program, most recently in June 2023, authorizing the repurchase of up to 2,000,000 shares of our common stock. As of December 31, 2023,
813,617 shares remained authorized for repurchase through March 31, 2024. Under this program, the Company repurchased 2,661,792 shares of its stock in 2023, 2,055,470 shares in 2022, and 475,557 shares in 2021.
Subsequently, in February 2024, the Board of Directors extended the repurchase authorization for up to 2,000,000 shares of our common stock through March 31, 2025.
Net cash provided by operations decreased $233.7 million to $455.2 million in 2023 compared to $688.9 million in 2022 and $418.4 million in 2021. The decrease in cash provided by operations of $233.7 million in 2023 versus 2022 was due to several factors. Net income decreased to $372.4 million in 2023 from $717.8 million in 2022. Accounts receivable decreased $22.1 million in 2023 compared to increasing $7.6 million in 2022, resulting in a positive impact to cash flow of $29.7 million. Inventory, net increased $10.5 million in 2023 compared to increasing $52.4 million in 2022, producing a positive impact to cash flow of $41.9 million. Trade accounts payable and accrued liabilities positively impacted cash by $1.1 million in 2023 versus negatively impacting cash by $12.0 million in 2022, a positive swing of $13.1 million. These changes in cash flow were the primary drivers of the $233.7 million decrease in net cash flow provided by operations in 2023 versus 2022.
Net cash provided by operations increased $270.5 million to $688.9 million in 2022 compared to $418.4 million in 2021. The increase in cash provided by operations of $270.5 million in 2022 versus 2021 was due to several factors. Net income increased to $717.8 million in 2022 from $541.4 million in 2021. Accounts receivable increased $7.6 million in 2022 compared to increasing $216.8 million in 2021, resulting in a positive impact to cash flow of $209.2 million. Inventory, net increased $52.4 million in 2022 compared to increasing $8.5 million in 2021, producing a negative impact to cash flow of $43.9 million. Trade accounts payable and accrued liabilities negatively impacted cash by $12.0 million in 2022 versus favorably impacting cash by $66.9 million in 2021, a negative swing of $78.9 million. These changes in cash flow were the primary drivers of the $270.5 million increase in net cash flow provided by operations in 2022 versus 2021.
Net cash used in investing activities was $164.5 million in 2023 versus $148.4 million in 2022 and $118.2 million in 2021. In 2023, capital expenditures were used primarily for the purchase and installation of machinery and equipment throughout the Company. The construction of our new, state of the art, cross-link polyethylene (XLPE) compounding facility, which deepens our vertical integration related to wire and cable insulation, was completed in 2023. In 2022 and 2021, capital expenditures were used primarily for repurposing of our vacated distribution center, the construction of our new service center, and the purchase and installation of machinery and equipment throughout the Company.
The net cash used by financing activities of $460.6 million in 2023 consisted primarily of $460.2 million used to purchase Company stock and dividend payments of $1.4 million, partially offset by $0.9 million proceeds from issuance of Company stock related to employees exercising stock options. The net cash used by financing activities of $249.0 million in 2022 consisted primarily of $247.6 million used to purchase Company stock and dividend payments of $1.5 million, partially offset by $0.2 million proceeds from issuance of Company stock related to employees exercising stock options. The net cash used by financing activities of $44.4 million in 2021 consisted primarily of $43.3 million used to purchase Company stock and dividend payments of $1.6 million, partially offset by $1.1 million proceeds from issuance of Company stock related to employees exercising stock options.
In 2022 we began construction on a new, state of the art, cross-link polyethylene (XLPE) compounding facility to deepen vertical integration related to wire and cable insulation. XLPE insulation is used in many applications including Data Centers, Oil and Gas, Transit, Waste-Water Treatment facilities, Utilities and Wind and Solar applications. The new facility is substantially completed, with start-up and optimization now in progress. Capital spending in 2024 through 2026 will further expand vertical integration in our manufacturing processes to reduce costs as well as modernize select wire manufacturing facilities to increase capacity and efficiency and improve our position as a sustainable and environmentally responsible company. Total capital expenditures were $148.4 million in 2022 and $164.5 million in 2023. Total capital expenditures are expected to range from $130 - $150 million in 2024, $130 - $150 million in 2025, and $100 - $120 million in 2026. These investments are expected to be funded with existing cash reserves and operating cash flows.
As of December 31, 2023, the Company had contractual obligations of $226.0 million, consisting of open purchase orders for major raw material purchases and $65.4 million of purchase orders for capital expenditures.
Critical Accounting Policies and Estimates
Management’s discussion and analysis of its financial condition and results of operations are based upon the Company’s financial statements, which have been prepared in accordance with accounting principles generally accepted in the U.S.
The preparation of these financial statements requires management to make estimates and assumptions that affect the amounts reported in the financial statements and accompanying notes. Actual results could differ from those estimates. See Note 1 to the Financial Statements included under “Item 8. Financial Statements and Supplementary Data” of this annual report. Management believes the following critical accounting policies affect its more significant estimates and assumptions used in the preparation of its financial statements.
Inventories are stated at the lower of cost, using the LIFO method, or market. The Company maintains two inventory pools for LIFO purposes. As permitted by U.S. generally accepted accounting principles, the Company maintains its inventory costs and cost of goods sold on a first-in, first-out (FIFO) basis and makes a monthly adjustment to adjust total inventory and cost of goods sold from FIFO to LIFO. The Company applies the LCM test by comparing the LIFO cost of its raw materials, work-in-process and finished goods inventories to estimated market values, which are based primarily upon the most recent quoted market price of copper and other raw materials and finished wire prices as of the end of each reporting period. The Company performs an LCM calculation quarterly. As of December 31, 2023, no LCM adjustment was required. However, decreases in copper and other material prices could necessitate establishing an LCM reserve in future periods. Additionally, future reductions in the quantity of inventory on hand could cause copper or other raw materials that are carried in inventory at costs different from the cost of copper and other raw materials in the period in which the reduction occurs to be included in costs of goods sold for that period at the different price.
Revenue from the sale of the Company’s products is recognized when goods are shipped to the customer, title and risk of loss are transferred, pricing is fixed or determinable, and collection is reasonably assured. A provision for payment discounts and customer rebates is estimated based upon historical experience and other relevant factors and is recorded within the same period that the revenue is recognized.
The Company has provided an allowance for credit losses on customer receivables based upon estimates of those customers’ inability to make required payments. Such allowance is established and adjusted based upon the makeup of the current receivable portfolio, past bad debt experience, and current market conditions. If the financial condition of our customers was to deteriorate and impair their ability to make payments to the Company, additional allowances for losses might be required in future periods.
Recent Accounting Pronouncements
The Financial Accounting Standards Board (“FASB”) Accounting Standards Codification (“ASC”) is the sole source of authoritative U.S. GAAP, along with the Securities and Exchange Commission ("SEC") and Public Company Accounting Oversight Board (“PCAOB”) issued rules and regulations that apply only to SEC registrants. The FASB issues an Accounting Standard Update (“ASU”) to communicate changes to the codification. The Company considers the applicability and impact of all ASUs. No new standards were adopted in 2023.
Information Regarding Forward-Looking Statements
This report contains various forward-looking statements and information that are based on management’s belief as well as assumptions made by and information currently available to management. Although the Company believes that the expectations reflected in such forward-looking statements are reasonable, it can give no assurance that such expectations will prove to have been correct. Such statements are subject to certain risks, uncertainties and assumptions. Should one or more of these risks or uncertainties materialize, or should underlying assumptions prove incorrect, actual results may vary materially from those expected.
Among the key factors that may have a direct bearing on the Company’s operating results and stock price are:
•fluctuations in the global and national economy;
•the impact of a global pandemic;
•fluctuations in the level of activity in the construction industry, including remodeling;
•demand for the Company’s products;
•the impact of price competition on the Company’s margins;
•fluctuations in the price of copper, aluminum and other key raw materials;
•the loss of key manufacturers’ representatives who sell the Company’s product line;
•fluctuations in utility costs, especially electricity and natural gas, and freight costs;
•fluctuations in insurance costs and the availability of coverage of various types;
•weather related disasters at the Company’s and/or key vendor’s operating facilities;
•stock price fluctuations due to “stock market expectations” and other external variables;
•unforeseen future legal issues and/or government regulatory changes;
•changes in tax laws;
•patent and intellectual property disputes; and
•fluctuations in the Company’s financial position or national banking issues that impede the Company’s ability to obtain reasonable and adequate financing.
This list highlights some of the major factors that could affect the Company’s operations or stock price, but cannot enumerate all the potential issues that management faces on a daily basis, many of which are totally out of management’s control. For further discussion of the factors described herein and their potential effects on the Company, see “Item 1. Business,” “Item 1A. Risk Factors,” “Item 7. Management’s Discussion and Analysis of Financial Condition and Results of Operations” and “Item 7A. Quantitative and Qualitative Disclosures About Market Risk.”
Item 7A. Quantitative and Qualitative Disclosures About Market Risk.
The Company does not engage in metal futures trading or hedging activities and does not enter into derivative financial instrument transactions for trading or other speculative purposes. However, the Company is generally exposed to commodity price and interest rate risks.
Commodity Price Risk
The Company purchases copper cathode primarily from miners and commodity brokers at prices determined each month based on the average daily COMEX closing prices for copper for that month, plus a negotiated premium. As a result, fluctuations in copper prices caused by market forces can significantly affect the Company’s financial results.
Interest Rate Risk
Interest rate risk is attributable to the Company’s long term debt. As of December 31, 2023, the Company was a party to the Amended 2021 Credit Agreement. Amounts outstanding under the 2021 Credit Agreement are payable on February 9, 2026, with interest payments due quarterly. At December 31, 2023, there were no amounts outstanding under the Amended 2021 Credit Agreement. There is an inherent rollover risk for borrowings under the Amended 2021 Credit Agreement as such borrowings mature and are renewed at current market rates. The extent of this risk is not quantifiable or predictable because of the variability of future interest rates and the Company’s future financing requirements.
For further information regarding market risk, see “Item 7. Management’s Discussion and Analysis of Financial Condition and Results of Operations,” and “Item 1A. Risk Factors.”
Item 8. Financial Statements and Supplementary Data.
The financial statements of the Company and the notes thereto appear on the following pages. The Reports of independent registered public accounting firm (PCAOB: 42) also appear on the following pages.
Report of Independent Registered Public Accounting Firm
To the Stockholders and the Board of Directors of Encore Wire Corporation
Opinion on the Financial Statements
We have audited the accompanying balance sheets of Encore Wire Corporation (the Company) as of December 31, 2023 and 2022, the related statements of income, stockholders' equity and cash flows for each of the three years in the period ended December 31, 2023, and the related notes (collectively referred to as the “financial statements”). In our opinion, the financial statements present fairly, in all material respects, the financial position of the Company at December 31, 2023 and 2022, and the results of its operations and its cash flows for each of the three years in the period ended December 31, 2023, in conformity with U.S. generally accepted accounting principles.
We also have audited, in accordance with the standards of the Public Company Accounting Oversight Board (United States) (PCAOB), the Company's internal control over financial reporting as of December 31, 2023, based on criteria established in Internal Control—Integrated Framework issued by the Committee of Sponsoring Organizations of the Treadway Commission (2013 framework), and our report dated February 16, 2024 expressed an unqualified opinion thereon.
Basis for Opinion
These financial statements are the responsibility of the Company's management. Our responsibility is to express an opinion on the Company’s financial statements based on our audits. We are a public accounting firm registered with the PCAOB and are required to be independent with respect to the Company in accordance with the U.S. federal securities laws and the applicable rules and regulations of the Securities and Exchange Commission and the PCAOB.
We conducted our audits in accordance with the standards of the PCAOB. Those standards require that we plan and perform the audit to obtain reasonable assurance about whether the financial statements are free of material misstatement, whether due to error or fraud. Our audits included performing procedures to assess the risks of material misstatement of the financial statements, whether due to error or fraud, and performing procedures that respond to those risks. Such procedures included examining, on a test basis, evidence regarding the amounts and disclosures in the financial statements. Our audits also included evaluating the accounting principles used and significant estimates made by management, as well as evaluating the overall presentation of the financial statements. We believe that our audits provide a reasonable basis for our opinion.
Critical Audit Matter
The critical audit matter communicated below is a matter arising from the current period audit of the financial statements that was communicated or required to be communicated to the audit committee and that: (1) relates to accounts or disclosures that are material to the financial statements and (2) involved our especially challenging, subjective or complex judgments. The communication of the critical audit matter does not alter in any way our opinion on the financial statements, taken as a whole, and we are not, by communicating the critical audit matter below, providing a separate opinion on the critical audit matter or on the account or disclosure to which it relates.
| | | | | | | | |
| | Valuation of inventories |
Description of the Matter | | At December 31, 2023, the Company’s inventory balance was $163.7 million. As discussed in Notes 1 and 2 to the financial statements, inventories are stated at the lower of cost, using the last-in, first-out (LIFO) method, or market. The Company maintains two inventory pools for LIFO purposes. As permitted by U.S. generally accepted accounting principles, the Company maintains its inventory costs and cost of goods sold on a first-in, first-out (FIFO) basis and adjusts total inventory and cost of goods sold from FIFO to LIFO at each month end.
Auditing management’s calculations to adjust the FIFO inventory balances to LIFO was challenging due to the complexities of the manual calculations.
|
How We Addressed the Matter in Our Audit | | We obtained an understanding, evaluated the design and tested the operating effectiveness of controls over the Company’s calculations of the adjustments to convert FIFO inventory balances to LIFO, including controls over management’s review of the manual calculations described above.
To test the LIFO inventory balance, we performed audit procedures that included, among others, assessing methodologies and testing the underlying data used in the Company’s calculations to adjust the FIFO inventory balances to LIFO. We also tested the mathematical accuracy of the Company’s calculations.
|
/s/ Ernst & Young LLP
We have served as the Company’s auditor since 1990.
Dallas, Texas
February 16, 2024
Encore Wire Corporation
Balance Sheets
As of December 31, 2023 and 2022
(In thousands, except share data) | | | | | | | | | | | |
| 2023 | | 2022 |
| Assets | | | |
| Current assets: | | | |
| Cash and cash equivalents | $ | 560,635 | | | $ | 730,557 | |
Accounts receivable, net of allowance of $2,455 and $3,800 | 475,291 | | | 498,762 | |
| Inventories, net | 163,679 | | | 153,187 | |
| Income taxes receivable | 4,769 | | | 15,143 | |
| Prepaid expenses and other | 6,201 | | | 3,992 | |
| Total current assets | 1,210,575 | | | 1,401,641 | |
| Property, plant and equipment, net | 756,863 | | | 616,601 | |
| Other assets | 474 | | | 490 | |
| Total assets | $ | 1,967,912 | | | $ | 2,018,732 | |
| | | |
| Liabilities and Stockholders’ Equity | | | |
| Current liabilities: | | | |
| Trade accounts payable | $ | 80,548 | | | $ | 62,780 | |
| Accrued liabilities | 79,590 | | | 81,381 | |
| | | |
| Total current liabilities | 160,138 | | | 144,161 | |
| Deferred income taxes and other | 60,197 | | | 55,905 | |
| Commitments and contingencies | | | |
| Stockholders’ equity: | | | |
Preferred stock, $.01 par value: | | | |
Authorized shares – 2,000,000; none issued | — | | | — | |
Common stock, $.01 par value: | | | |
Authorized shares – 40,000,000; | | | |
Issued shares – 27,276,834 and 27,139,611 | 273 | | | 271 | |
| Additional paid-in capital | 106,035 | | | 83,622 | |
Treasury stock, at cost – 11,661,524 and 8,999,732 shares | (867,222) | | | (402,639) | |
| Retained earnings | 2,508,491 | | | 2,137,412 | |
| Total stockholders’ equity | 1,747,577 | | | 1,818,666 | |
| Total liabilities and stockholders’ equity | $ | 1,967,912 | | | $ | 2,018,732 | |
See accompanying notes.
Encore Wire Corporation
Statements of Income
For the Years Ended December 31, 2023, 2022 and 2021
(In thousands, except per share data) | | | | | | | | | | | | | | | | | |
| 2023 | | 2022 | | 2021 |
| Net sales | $ | 2,567,722 | | | $ | 3,017,555 | | | $ | 2,592,721 | |
| Cost of goods sold | 1,911,839 | | | 1,905,134 | | | 1,724,975 | |
| Gross profit | 655,883 | | | 1,112,421 | | | 867,746 | |
| | | | | |
| Selling, general and administrative expenses | 204,510 | | | 197,418 | | | 168,543 | |
| Operating income | 451,373 | | | 915,003 | | | 699,203 | |
| | | | | |
| Net interest and other income | 33,268 | | | 9,847 | | | 194 | |
| Income before income taxes | 484,641 | | | 924,850 | | | 699,397 | |
| | | | | |
| Provision for income taxes | 112,242 | | | 207,009 | | | 157,975 | |
| Net income | $ | 372,399 | | | $ | 717,841 | | | $ | 541,422 | |
| Earnings per common and common equivalent share – basic | $ | 22.07 | | | $ | 37.47 | | | $ | 26.49 | |
| Earnings per common and common equivalent share – diluted | $ | 21.62 | | | $ | 36.91 | | | $ | 26.22 | |
| Weighted average common and common equivalent shares outstanding – basic | 16,873 | | | 19,159 | | | 20,439 | |
| Weighted average common and common equivalent shares outstanding – diluted | 17,223 | | | 19,446 | | | 20,649 | |
| Cash dividends declared per share | $ | 0.08 | | | $ | 0.08 | | | $ | 0.08 | |
See accompanying notes.
Encore Wire Corporation
Statements of Stockholders' Equity
(In thousands, except per share data) | | | | | | | | | | | | | | | | | | | | | | | | | | | | | | | | | | | | | | | | | |
| | Common Stock | | Additional Paid-In Capital | | Treasury Stock | | Retained Earnings | | |
| Shares | | Amount | | | Shares | | Amount | Total |
| Balance at January 1, 2021 | 27,025 | | | $ | 270 | | | $ | 67,885 | | | (6,468) | | | $ | (111,718) | | | $ | 881,292 | | | $ | 837,729 | |
| Net income | — | | | — | | | — | | | — | | | — | | | 541,422 | | | 541,422 | |
| Exercise of stock options | 35 | | | 1 | | | 1,083 | | | — | | | — | | | — | | | 1,084 | |
| Stock-based compensation | 23 | | | — | | | 3,785 | | | — | | | — | | | — | | | 3,785 | |
Dividend declared—$0.08 per share | — | | | — | | | — | | | — | | | — | | | (1,635) | | | (1,635) | |
| Purchase of treasury stock | — | | | — | | | — | | | (476) | | | (43,296) | | | — | | | (43,296) | |
| Balance at December 31, 2021 | 27,083 | | | 271 | | | 72,753 | | | (6,944) | | | (155,014) | | | 1,421,079 | | | 1,339,089 | |
| Net income | — | | | — | | | — | | | — | | | — | | | 717,841 | | | 717,841 | |
| Exercise of stock options | 4 | | | — | | | 207 | | | — | | | — | | | — | | | 207 | |
| Stock-based compensation | 52 | | | — | | | 10,662 | | | — | | | — | | | — | | | 10,662 | |
Dividend declared—$0.08 per share | — | | | — | | | — | | | — | | | — | | | (1,508) | | | (1,508) | |
| Purchase of treasury stock | — | | | — | | | — | | | (2,056) | | | (247,625) | | | — | | | (247,625) | |
| Balance at December 31, 2022 | 27,139 | | | 271 | | | 83,622 | | | (9,000) | | | (402,639) | | | 2,137,412 | | | 1,818,666 | |
| Net income | — | | | — | | | — | | | — | | | — | | | 372,399 | | | 372,399 | |
| Exercise of stock options | 22 | | | — | | | 936 | | | — | | | — | | | — | | | 936 | |
| Stock-based compensation | 115 | | | 2 | | | 21,477 | | | — | | | — | | | — | | | 21,479 | |
Dividend declared—$0.08 per share | — | | | — | | | — | | | — | | | — | | | (1,320) | | | (1,320) | |
| Purchase of treasury stock | — | | | — | | | — | | | (2,662) | | | (464,583) | | | — | | | (464,583) | |
| Balance at December 31, 2023 | 27,276 | | | $ | 273 | | | $ | 106,035 | | | (11,662) | | | $ | (867,222) | | | $ | 2,508,491 | | | $ | 1,747,577 | |
See accompanying notes.
Encore Wire Corporation
Statements of Cash Flows
For the Years Ended December 31, 2023, 2022 and 2021
(In thousands) | | | | | | | | | | | | | | | | | |
| 2023 | | 2022 | | 2021 |
| Operating Activities | | | | | |
| Net income | $ | 372,399 | | | $ | 717,841 | | | $ | 541,422 | |
Adjustments to reconcile net income to net cash provided by operating activities: | | | | | |
| Depreciation and amortization | 32,052 | | | 26,232 | | | 23,288 | |
| Deferred income taxes | 4,342 | | | 19,539 | | | 2,264 | |
| Stock-based compensation attributable to equity awards | 21,477 | | | 10,662 | | | 3,786 | |
| Other | 4,163 | | | 1,796 | | | 5,831 | |
| Changes in operating assets and liabilities: | | | | | |
| Accounts receivable | 22,126 | | | (7,636) | | | (216,808) | |
| Inventories | (10,492) | | | (52,371) | | | (8,494) | |
| Other assets | (2,318) | | | (980) | | | (62) | |
| Trade accounts payable and accrued liabilities | 1,083 | | | (12,008) | | | 66,886 | |
| Current income taxes receivable / payable | 10,374 | | | (14,192) | | | 305 | |
| Net cash provided by operating activities | 455,206 | | | 688,883 | | | 418,418 | |
| | | | | |
| Investing Activities | | | | | |
| Purchases of property, plant and equipment | (164,563) | | | (148,350) | | | (118,252) | |
| Proceeds from sale of assets | 28 | | | — | | | 97 | |
| | | | | |
| Net cash used in investing activities | (164,535) | | | (148,350) | | | (118,155) | |
| | | | | |
| Financing Activities | | | | | |
| Deferred financing fees | — | | | — | | | (550) | |
| Purchase of treasury stock | (460,155) | | | (247,625) | | | (43,296) | |
| | | | | |
| | | | | |
| Proceeds from issuance of common stock, net | 938 | | | 207 | | | 1,083 | |
| Dividends paid | (1,376) | | | (1,548) | | | (1,633) | |
| | | | | |
| Net cash used in financing activities | (460,593) | | | (248,966) | | | (44,396) | |
| | | | | |
| Net increase (decrease) in cash and cash equivalents | (169,922) | | | 291,567 | | | 255,867 | |
| Cash and cash equivalents at beginning of period | 730,557 | | | 438,990 | | | 183,123 | |
| Cash and cash equivalents at end of period | $ | 560,635 | | | $ | 730,557 | | | $ | 438,990 | |
See accompanying notes.
Encore Wire Corporation
Notes to Financial Statements
December 31, 2023
1. Significant Accounting Policies
Business
The Company conducts its business in one segment, the manufacture of electric building wire, manufacturing a broad range of electrical wire and cables used to distribute power from the transmission grid to the wall outlet or switch. Encore’s diversified product portfolio and low-cost of production position it exceptionally well to play a key role in the transition to a more sustainable and reliable energy infrastructure. Our products are proudly made in America at our vertically-integrated, single-site, Texas campus. The Company sells its products through manufacturers’ representatives to wholesale electrical distributors servicing the residential, commercial, industrial and renewable energy sectors.
Copper, a commodity product, is the principal raw material used in the Company’s manufacturing operations. The price of copper fluctuates, depending on general economic conditions and in relation to supply and demand and other factors, and has caused monthly variations in the cost of copper purchased by the Company. The Company cannot predict future copper prices or the effect of fluctuations in the cost of copper on the Company’s future operating results.
Basis of Presentation
The Company's financial statements have been prepared in accordance with accounting principles generally accepted in the United States (“U.S. GAAP”).
In March 2020, the World Health Organization declared COVID-19 a global pandemic and recommended containment and mitigation measures worldwide. The Company is unable to predict the impact that COVID-19, or any ongoing variants, may have on our financial position and operating results in future periods. The duration or re-emergence of the outbreak and its long-term impact on our business remain uncertain.
Use of Estimates
The preparation of financial statements in conformity with U.S. GAAP requires management to make estimates and assumptions that affect the amounts reported in the financial statements and accompanying notes. Actual results could differ from those estimates.
Revenue Recognition
Our revenue is derived by fulfilling customer orders for the purchase of our products, which include electrical building wire and cable. We recognize revenue at the point in time that control of the ordered products is transferred to the customer, which is typically upon shipment to the customer from our manufacturing facilities and based on agreed upon shipping terms on the related purchase order. Amounts billed and due from our customers are classified as accounts receivable on the balance sheet and require payment on a short-term basis through standard payment terms.
Revenue is measured as the amount of consideration we expect to receive in exchange for fulfilling product orders. The amount of consideration we expect to receive and revenue we recognize includes estimates for trade payment discounts and customer rebates, which are estimated using historical experience and other relevant factors and is recorded within the same period that the revenue is recognized. We review and update these estimates regularly and the impact of any adjustments are recognized in the period the adjustments are identified. The adjustments resulting from updated estimates of trade payment discounts and customer rebates were not material.
Freight Expenses
The Company classifies shipping and handling costs as a component of selling, general and administrative expenses. Shipping and handling costs were approximately $51.2 million, $58.9 million and $47.2 million for the years ended December 31, 2023, 2022 and 2021, respectively.
Derivatives
The Company may purchase copper and aluminum at current market prices for delivery in future months. These purchases meet the definition of a derivative in Accounting Standards Codification 815, Derivatives and Hedging (ASC
815). These transactions also qualify for the exclusion from derivative accounting as they meet the normal purchase and normal sale criterion in ASC 815.
Fair Value of Financial Instruments
Certain items are required to be measured at fair value on a recurring basis, primarily cash equivalents held in banks. Fair value is defined as the price that would be received to sell an asset or paid to transfer a liability (an exit price) in the principal or most advantageous market for the asset or liability in an orderly transaction between market participants on the measurement date. A three-level hierarchy is followed for disclosure to show the extent and level of judgment used to estimate fair value measurements:
Level 1 – Inputs used to measure fair value are unadjusted quoted prices that are available in active markets for the identical assets or liabilities as of the reporting date.
Level 2 – Inputs used to measure fair value, other than quoted prices included in Level 1, are either directly or indirectly observable as of the reporting date through correlation with market data, including quoted prices for similar assets and liabilities in active markets and quoted prices in markets that are not active. Level 2 also includes assets and liabilities that are valued using models or other pricing methodologies that do not require significant judgment since the input assumptions used in the models, such as interest rates and volatility factors, are corroborated by readily observable data from actively quoted markets for substantially the full term of the financial instrument.
Level 3 – Inputs used to measure fair value are unobservable inputs that are supported by little or no market activity and reflect the use of significant management judgment. These values are generally determined using pricing models for which the assumptions utilize management’s estimates of market participant assumptions.
At December 31, 2023 and 2022, the carrying value of cash and cash equivalents is based on Level 1 measurements.
Concentrations of Credit Risk and Accounts Receivable
Financial instruments that potentially subject the Company to a concentration of credit risk consist principally of cash and cash equivalents and accounts receivable. The Company places its cash and cash equivalents with high credit quality financial institutions.
Accounts receivable represent amounts due from customers, primarily wholesale electrical distributors, related to the sale of the Company’s products. Such receivables are uncollateralized and are generally due from customers located throughout the United States. Encore has two customers, each of whom slightly exceeds 10% of the Company's total sales. The Company establishes an allowance for credit losses based upon the makeup of the current portfolio, past bad debt experience and current market conditions.
| | | | | | | | | | | | | | | | | |
| Allowance for Credit Losses (In Thousands) | 2023 | | 2022 | | 2021 |
| Beginning balance January 1 | $ | 3,800 | | | $ | 3,800 | | | $ | 2,215 | |
| Write-offs of bad debts | (45) | | | — | | | — | |
| Collection of previous write-offs | — | | | — | | | 122 | |
| Adjustment to allowance for credit losses | (1,300) | | | — | | | 1,463 | |
| Ending balance at December 31 | $ | 2,455 | | | $ | 3,800 | | | $ | 3,800 | |
Cash and Cash Equivalents
The Company considers all highly liquid instruments purchased with a maturity of three months or less to be cash equivalents. At December 31, 2023 and 2022, the Company’s cash equivalents consisted of investments in money market accounts with the Company’s banks.
Inventories
Inventories are stated at the lower of cost, using the LIFO method, or market. The Company evaluates the market value of its raw materials, work-in-process and finished goods inventory primarily based upon current raw material and finished goods prices at the end of each period.
Property, Plant, and Equipment
Property, plant and equipment is recorded at cost. Depreciation is recorded on a straight-line method over the estimated useful lives of the respective assets as follows: buildings and improvements, 3 to 45 years; machinery and equipment, 2 to 20 years; and furniture and fixtures, 5 to 20 years. Accelerated cost recovery methods are used for tax purposes. Repairs and maintenance costs are expensed as incurred. In accordance with its policy, the Company reviews the estimated useful lives of its fixed assets on an ongoing basis. This review indicated that the actual lives of its buildings were longer than the estimated useful lives used for depreciation purposes in the Company's financial statements. As a result, effective September 1, 2023, the Company changed some of its estimates of the useful lives of its buildings to better reflect the estimated periods during which these assets will remain in service. The estimated useful lives of some of the buildings that previously averaged 35 years were increased to an average of 45 years. The effect of this change in estimate was not material to the financial statements.
Stock-Based Compensation
Compensation cost for all stock-based compensation expected to vest is measured at fair value on the date of grant and recognized over the related service period. The fair value of stock awards is determined based on the number of shares granted and the quoted price of Encore’s common stock, and the fair value of stock options and stock appreciation rights is estimated on the date of grant using the Black-Scholes model. Such value is recognized as expense over the service period on a straight-line basis. Actual forfeitures are recorded as a cumulative adjustment in the period they occur.
Earnings Per Share
Earnings per common and common equivalent share is computed using the weighted average number of shares of common stock and common stock equivalents outstanding during each period. The dilutive effects of stock awards, which are common stock equivalents, are calculated using the treasury stock method.
Income Taxes
Income taxes are provided for based on the liability method, resulting in deferred income tax assets and liabilities arising due to temporary differences. Temporary differences are differences between the tax basis of assets and liabilities and their reported amounts in the financial statements that will result in taxable or deductible amounts in future years. The effect on deferred income tax assets and liabilities of a change in tax rates is recognized in income in the period the change in rate is enacted.
Comprehensive Income
Comprehensive income is defined as the change in equity of a business enterprise during a period from transactions and other events and circumstances from non-owner sources. There were no differences between comprehensive income and reported income in the periods presented.
Recent Accounting Pronouncements
The Financial Accounting Standards Board (“FASB”) Accounting Standards Codification (“ASC”) is the sole source of authoritative U.S. GAAP, along with the Securities and Exchange Commission ("SEC") and Public Company Accounting Oversight Board (“PCAOB”) issued rules and regulations that apply only to SEC registrants. The FASB issues an Accounting Standard Update (“ASU”) to communicate changes to the codification. The Company considers the applicability and impact of all ASUs. No new standards were adopted in 2023.
2. Inventories
Inventories consist of the following as of December 31: | | | | | | | | | | | |
| In Thousands | 2023 | | 2022 |
| Raw materials | $ | 64,512 | | | $ | 69,567 | |
| Work-in-process | 55,921 | | | 42,611 | |
| Finished goods | 139,348 | | | 138,943 | |
| Total | 259,781 | | | 251,121 | |
| Adjust to LIFO cost | (96,102) | | | (97,934) | |
| | | |
| Inventory, net | $ | 163,679 | | | $ | 153,187 | |
There were no liquidations of inventories that had a material impact on the Company’s results of operations for any period presented.
3. Property, Plant and Equipment, net
Property, plant and equipment consist of the following as of December 31:
| | | | | | | | | | | |
| In Thousands | 2023 | | 2022 |
| Land and land improvements | $ | 90,162 | | | $ | 85,286 | |
| Construction-in-progress | 163,514 | | | 125,809 | |
| Buildings and improvements | 313,691 | | | 232,758 | |
| Machinery and equipment | 478,060 | | | 438,303 | |
| Furniture and fixtures | 17,231 | | | 15,178 | |
| Property, plant and equipment, gross | 1,062,658 | | | 897,334 | |
| Accumulated depreciation | (305,795) | | | (280,733) | |
| Property, plant and equipment, net | $ | 756,863 | | | $ | 616,601 | |
Depreciation expense for the years ended December 31, 2023, 2022 and 2021 was $31.9 million, $26.1 million and $23.2 million, respectively.
4. Accrued Liabilities
Accrued liabilities consist of the following as of December 31: | | | | | | | | | | | |
| In Thousands | 2023 | | 2022 |
| Sales rebates payable | $ | 39,123 | | | $ | 40,909 | |
| Stock Appreciation Rights (SAR) Liability | 22,182 | | | 20,282 | |
| Property taxes payable | 5,827 | | | 5,287 | |
| Accrued salaries | 6,947 | | | 7,616 | |
| Other accrued liabilities | 5,511 | | | 7,287 | |
| Total accrued liabilities | $ | 79,590 | | | $ | 81,381 | |
5. Debt
At December 31, 2023 and 2022, the Company had no debt outstanding.
On February 9, 2021, the Company terminated its previous credit agreement and entered into a new Credit Agreement (the “2021 Credit Agreement”) with two banks, Bank of America, N.A., as administrative agent and letter of credit issuer, and Wells Fargo Bank, National Association, as syndication agent. The 2021 Credit Agreement extends through February 9, 2026 and provides for maximum borrowings of $200.0 million. At our request and subject to certain conditions, the commitments under the 2021 Credit Agreement may be increased by a maximum of up to $100.0 million as long as existing or new lenders agree to provide such additional commitments.
The 2021 Credit Agreement contains provisions to replace LIBOR with a replacement rate as described in the 2021 Credit Agreement. On October 20, 2022, the Company entered into the First Amendment to the 2021 Credit Agreement (the “Amended 2021 Credit Agreement”) which replaced LIBOR with BSBY as permitted under the 2021 Credit Agreement. Borrowings under the line of credit bear interest, at the Company’s option, at either (1) BSBY plus a margin that varies from 1.000% to 1.875% depending upon the Leverage Ratio (as defined in the 2021 Credit Agreement), or (2) the base rate (which is the highest of the federal funds rate plus 0.5%, the prime rate, or BSBY plus 1.0%) plus 0% to 0.375% (depending upon the Leverage Ratio). A commitment fee ranging from 0.20% to 0.325% (depending upon the Leverage Ratio) is payable on the unused line of credit. At December 31, 2023, there were no borrowings outstanding under the Amended 2021 Credit Agreement, and letters of credit outstanding in the amount of $0.3 million left $199.7 million of credit available under the Amended 2021 Credit Agreement. Obligations under the Amended 2021 Credit Agreement are the only contractual borrowing obligations or commercial borrowing commitments of the Company.
Obligations under the Amended 2021 Credit Agreement are unsecured and contain customary covenants and events of default. The Company was in compliance with the covenants as of December 31, 2023.
The Company paid interest totaling $0.4 million in 2023, 2022 and 2021, respectively, none of which was capitalized.
6. Income Taxes
The Inflation Reduction Act (“IRA”) was enacted on August 16, 2022. The IRA includes provisions imposing a 1% excise tax on share repurchases that occur after December 31, 2022, and introduces a 15% corporate alternative minimum tax on “adjusted financial statement income” of certain large corporations (generally, corporations reporting at least $1 billion of average adjusted pre-tax net income on their consolidated financial statements). Based on application of currently available guidance, the Company does not expect the IRA to have a material adverse impact to its financial statements.
The provision for income tax expense is summarized as follows for the years ended December 31: | | | | | | | | | | | | | | | | | |
| In Thousands | 2023 | | 2022 | | 2021 |
| Current: | | | | | |
| Federal | $ | 100,472 | | | $ | 175,090 | | | $ | 143,392 | |
| State | 7,428 | | | 12,379 | | | 12,319 | |
| Deferred: | | | | | |
| Federal | 4,115 | | | 19,797 | | | 2,132 | |
| State | 227 | | | (257) | | | 132 | |
| Total income tax expense | $ | 112,242 | | | $ | 207,009 | | | $ | 157,975 | |
The differences between the provision for income taxes and income taxes computed using the federal income tax rate are as follows for the years ended December 31: | | | | | | | | | | | |
| In Thousands | 2023 | 2022 | 2021 |
| Amount computed using the statutory rate | $ | 101,775 | | $ | 194,218 | | $ | 146,873 | |
| State income taxes, net of federal tax benefit | 6,047 | | 9,576 | | 9,836 | |
| 162(m) disallowance | 5,687 | | 3,244 | | 1,355 | |
| | | |
| | | |
| Other | (1,267) | | (29) | | (89) | |
| Total income tax expense | $ | 112,242 | | $ | 207,009 | | $ | 157,975 | |
The tax effect of each type of temporary difference giving rise to the net deferred tax liability at December 31 is as follows: | | | | | | | | | | | |
| In Thousands | 2023 | | 2022 |
| Depreciation | $ | (65,688) | | | $ | (60,304) | |
| Inventory | (2,462) | | | (2,080) | |
| Allowance for credit losses | 545 | | | 843 | |
| Uniform capitalization rules | 1,110 | | | 574 | |
| Stock-based compensation | 6,170 | | | 4,791 | |
| Other | 343 | | | 536 | |
| Net deferred income tax liability | $ | (59,982) | | | $ | (55,640) | |
The Company's inventory costing method for federal income tax purposes differs from the method allowed by GAAP. Both methods of inventory costing result in the same recovery of inventory. However, the timing of the recovery varies. As of December 31, 2023, the Company's tax inventory exceeds its book inventory, which created a deferred tax liability of $2.5 million.
The Company made income tax payments of $97.7 million in 2023, $201.7 million in 2022 and $155.5 million in 2021.
The Company’s federal income tax returns for the years subsequent to December 31, 2019 remain subject to examination. The Company’s income tax returns in major state income tax jurisdictions remain subject to examination for various periods subsequent to December 31, 2018. The Company has no reserves for uncertain tax positions as of December 31, 2023 and 2022. Interest and penalties resulting from audits by tax authorities have been immaterial and are included in the provision for income taxes in the statements of income.
7. Stock-Based Compensation
Total stock-based compensation expense by type of award was as follows for the years ended December 31: | | | | | | | | | | | | | | | | | |
| In Thousands | 2023 | | 2022 | | 2021 |
| Restricted Stock Units | $ | 20,738 | | | $ | 9,054 | | | $ | 1,889 | |
| Stock grants | 1,018 | | | 724 | | | 489 | |
| Stock options | 21 | | | 289 | | | 435 | |
| Stock appreciation rights (“SARs”) | 23,438 | | | 7,319 | | | 22,188 | |
| Restricted Stock Awards | 986 | | | 1,005 | | | 1,005 | |
| Total stock-based compensation expense | $ | 46,201 | | | $ | 18,391 | | | $ | 26,006 | |
In 2020, the Board of Directors adopted a new incentive plan called the Encore Wire 2020 Long Term Incentive Plan (the “2020 LTIP”) which was approved by the Company’s stockholders at the 2020 Annual Meeting of Stockholders. The 2020 LTIP permits the granting of 1,000,000 securities in the form of options to purchase shares of common stock, stock appreciation rights, restricted common stock, restricted stock units, unrestricted common stock, dividend equivalents, cash awards, or performance awards to non-employee directors, officers and employees of the Company. As of December 31, 2023, 463,550 securities remained available for grant under the 2020 LTIP.
Restricted Stock Units:
Restricted units granted to employees vest ratably over a period of three years from the time the restricted units were granted. During the years ended December 31, 2023, 2022, and 2021 the Company granted 236,800 units, 177,200 units, and 98,600 units respectively, of restricted stock to employees pursuant to the 2020 Long Term Incentive Plan, with weighted grant date fair values of $149.62, $127.58, and $61.92 per unit, respectively. As of December 31, 2023, there was $32.3 million of total unrecognized compensation cost related to unvested units. That cost is expected to be recognized over a weighted-average period of 1.8 years.
The following presents a summary of restricted stock activity for the year ended December 31, 2023: | | | | | | | | |
| | Weighted Average |
| Number of Units | Grant Date Fair Value |
Outstanding at January 1, 2023 | 241,436 | | $ | 109.69 | |
| Granted | 236,800 | | 149.62 | |
| Vested | (91,432) | | 103.97 | |
| Forfeited/Canceled | — | | — | |
Unvested at December 31, 2023 | 386,804 | | $ | 135.49 | |
Stock Grants:
In May 2023, the Company granted 1,250 shares of stock to each of the 5 non-employee directors, with a grant date fair value of $162.93 per share. In May 2022, the Company granted 1,250 shares of stock to 4 non-employee directors with a grant date fair value of $123.45 per share. In September 2022, the Company granted 850 shares of stock to 1 non-employee director with a grant date fair value of $125.37 per share. In May 2021, the Company granted 1,250 shares of stock to each of the 5 non-employee directors, with a grant date fair value of $78.29 per share.
Stock Options:
No stock option awards were granted in 2023, 2022 or 2021. Options vest ratably over a period of five years from the time the options were granted. The maximum term of any option previously granted under the 2010 Stock Option Plan or granted in the future under the 2020 LTIP is ten years. New shares are issued upon the exercise of options.
The following presents a summary of stock option activity for the year ended December 31, 2023: | | | | | | | | | | | | | | | | | | | | | | | |
| Number
of
Shares | | Weighted
Average
Exercise
Price | | Weighted
Average
Remaining
Contractual
Term | | Aggregate
Intrinsic Value
(In Thousands) |
| Outstanding at January 1, 2023 | 275,500 | | | $ | 43.06 | | | | | |
| | | | | | | |
| Exercised | (22,000) | | | 42.53 | | | | | |
| Forfeited/Canceled | — | | | — | | | | | |
| Outstanding at December 31, 2023 | 253,500 | | | $ | 43.10 | | | 2.7 years | | $ | 43,222 | |
| Vested and exercisable at December 31, 2023 | 253,500 | | | $ | 43.10 | | | 2.7 years | | $ | 43,222 | |
During the years ended December 31, 2023, 2022 and 2021, the total intrinsic value of options exercised was $2.9 million, $0.2 million and $3.1 million, respectively. As of December 31, 2023, there was no unrecognized compensation cost related to non-vested stock options.
Stock Appreciation Rights:
In 2014, the Board of Directors adopted a new stock appreciation rights plan called the Encore Wire 2014 Stock Appreciation Rights Plan (the “2014 SARs Plan”). The 2014 SARs Plan permits the grant of SARs that may only be settled in cash to non-executive officers and employees of the Company. SARs granted to employees vest ratably over a period of five years from the time the SARs were granted. The maximum term of any SARs granted under the 2014 SARs Plan is ten years. These awards are classified as liability awards. The liability balances were $22.2 million and $20.3 million at December 31, 2023 and 2022, respectively, and are included in accrued liabilities. Compensation cost for these awards is determined using a fair value method and remeasured at each reporting date until the date of settlement. As of December 31, 2023, a total of 172,008 SARs were outstanding under the 2014 SARs Plan. No SARs were granted subsequent to 2020 as this plan was replaced with a long-term deferred cash compensation plan.
The following presents a summary of SARs activity for the year ended December 31, 2023: | | | | | | | | | | | | | | | | | | | | | | | |
| Cash-settled SARs | | Weighted
Average
Exercise
Price | | Weighted
Average
Remaining
Contractual
Term | | Aggregate
Intrinsic Value
(In Thousands) |
Outstanding at January 1, 2023 | 332,164 | | | $ | 54.18 | | | | | |
| | | | | | | |
| Exercised | (153,556) | | | 52.82 | | | | | |
| Forfeited/Canceled | (6,600) | | | 56.47 | | | | | |
Outstanding at December 31, 2023 | 172,008 | | | $ | 55.31 | | | 5.4 years | | $ | 27,228 | |
Vested and exercisable at December 31, 2023 | 69,608 | | | $ | 53.51 | | | 5.0 years | | $ | 11,143 | |
The fair value of SARs outstanding during the years ended December 31, 2023, 2022 and 2021, are revalued each quarter using a Black-Scholes option pricing model and the following weighted average assumptions: | | | | | | | | | | | | | | | | | |
| Year Ended December 31, |
| 2023 | | 2022 | | 2021 |
| Risk-free interest rate | 5.17 | % | | 4.46 | % | | 0.70 | % |
| Expected dividend yield | 0.04 | % | | 0.06 | % | | 0.06 | % |
| Expected volatility | 32.60 | % | | 44.03 | % | | 38.64 | % |
| Expected lives | 0.6 years | | 1.3 years | | 2.1 years |
The Company bases expected volatilities on historical volatilities of Encore's common stock. The expected life represents the weighted average period of time that options granted are expected to be outstanding giving consideration to vesting periods and management’s consideration of historical exercise patterns. The risk-free rate is based on the U.S. Treasury
yield curve in effect at the time of grant for periods corresponding to the expected life of the option. The expected dividend yield is based on the annualized dividend payment paid on common shares.
During the years ended December 31, 2023, 2022 and 2021, the weighted average fair value of SARs was $159.92, $87.20 and $90.04, respectively, and the total intrinsic value of SARs exercised was $21.5 million, $9.1 million and $5.4 million, respectively. As of December 31, 2023, total unrecognized compensation cost related to non-vested SARs of $5.3 million was expected to be recognized over a weighted average period of 1.0 years.
Restricted Stock Awards:
Restricted shares granted to employees vest ratably over a period of five years from the time the restricted shares were granted. No restricted shares were granted subsequent to 2020. As of December 31, 2023, there was $0.4 million of total unrecognized compensation cost related to unvested shares. That cost is expected to be recognized over a weighted-average period of 0.8 years. The total fair value of shares vested during the year ending December 31, 2023 was $4.4 million.
The following presents a summary of restricted stock activity for the year ended December 31, 2023: | | | | | | | | |
| | Weighted Average |
| Number of Shares | Grant Date Fair Value |
Outstanding at January 1, 2023 | 41,000 | | $ | 57.00 | |
| Granted | — | | — | |
| Vested | (26,000) | | 56.60 | |
| | |
Unvested at December 31, 2023 | 15,000 | | $ | 57.69 | |
8. Earnings Per Share
The following table sets forth certain components of the computation of basic and diluted earnings per share for the years ended December 31: | | | | | | | | | | | | | | | | | |
| In Thousands | 2023 | | 2022 | | 2021 |
| Numerator: | | | | | |
| Net income | $ | 372,399 | | | $ | 717,841 | | | $ | 541,422 | |
| | | | | |
| Denominator: | | | | | |
| Denominator for basic earnings per share – weighted average shares | 16,873 | | | 19,159 | | | 20,439 | |
| | | | | |
| Effect of dilutive securities: | | | | | |
| Employee stock awards | 350 | | | 287 | | | 210 | |
| | | | | |
| Denominator for diluted earnings per share – weighted average shares | 17,223 | | | 19,446 | | | 20,649 | |
Stock options to purchase common stock at exercise prices in excess of the average actual stock price for the period that were anti-dilutive and that were excluded from the determination of diluted earnings per share are as follows: | | | | | | | | | | | | | | | | | |
| In Thousands, Except Per Share Data | 2023 | | 2022 | | 2021 |
| Weighted average anti-dilutive stock options | — | | | — | | | — | |
| | | | | |
| Weighted average exercise price per share | $ | — | | | $ | — | | | $ | — | |
9. Stockholders’ Equity
On November 10, 2006, the Board of Directors approved a stock repurchase program authorizing the Company to repurchase up to an authorized number of shares of its common stock from time to time in the open market or private transactions at the Company's discretion. This authorization originally expired on December 31, 2007, and the Company’s
Board of Directors has authorized several increases and annual extensions of this stock repurchase program, most recently in June 2023, authorizing the repurchase of up to 2,000,000 shares of our common stock. As of December 31, 2023, 813,617 shares remained authorized for repurchase through March 31, 2024. Under this program, the Company repurchased 2,661,792 shares of its stock in 2023, 2,055,470 shares in 2022 and 475,557 shares in 2021.
Subsequently, in February 2024, the Board of Directors extended the repurchase authorization for up to 2,000,000 shares of our common stock through March 31, 2025.
10. Contingencies
There are no material pending proceedings to which the Company is a party or to which any of its property is subject. However, the Company is from time to time involved in litigation, certain other claims and arbitration matters arising in the ordinary course of its business.
11. Encore Wire Corporation 401(k) Profit Sharing Plan
The Company sponsors a 401(k) profit sharing plan (the “Plan”) that permits eligible employees to make self-directed contributions of their compensation, a portion of which is matched by the Company, subject to applicable limitations. At the discretion of its Board of Directors, the Company may, but is not required to, make profit-sharing contributions to the Plan on behalf of its employees. The Company’s matching contributions were $4.3 million, $3.7 million and $3.0 million in 2023, 2022 and 2021, respectively.
12. Quarterly Financial Information (Unaudited)
The following is a summary of the unaudited quarterly financial information for the two years ended December 31, 2023 and 2022 (in thousands, except per share data): | | | | | | | | | | | | | | | | | | | | | | | |
| | Three Months Ended |
| 2023 | March 31 | | June 30 | | September 30 | | December 31 |
| Net sales | $ | 660,492 | | | $ | 636,460 | | | $ | 636,991 | | | $ | 633,779 | |
| Gross profit | 205,085 | | | 166,148 | | | 148,242 | | | 136,408 | |
| Net income | 119,483 | | | 104,741 | | | 82,052 | | | 66,123 | |
| Earnings per common share – basic | 6.60 | | | 6.13 | | | 4.93 | | | 4.21 | |
| Earnings per common share – diluted | 6.50 | | | 6.01 | | | 4.82 | | | 4.10 | |
| | | | | | | | | | | | | | | | | | | | | | | |
| | Three Months Ended |
| 2022 | March 31 | | June 30 | | September 30 | | December 31 |
| Net sales | $ | 723,072 | | | $ | 838,235 | | | $ | 762,363 | | | $ | 693,885 | |
| Gross profit | 243,747 | | | 320,772 | | | 299,447 | | | 248,455 | |
| Net income | 161,531 | | | 210,538 | | | 191,773 | | | 153,998 | |
| Earnings per common share – basic | 8.08 | | | 10.84 | | | 10.11 | | | 8.43 | |
| Earnings per common share – diluted | 7.96 | | | 10.71 | | | 9.97 | | | 8.28 | |
Item 9. Changes in and Disagreements With Accountants on Accounting and Financial Disclosure.
Not applicable.
Item 9A. Controls and Procedures.
Disclosure Controls and Procedures
The Company maintains controls and procedures designed to ensure that information required to be disclosed by it in the reports it files with or submits to the Securities and Exchange Commission (the “SEC”) is recorded, processed, summarized and reported, within the time periods specified in the SEC’s rules and forms and to ensure that information required to be disclosed by the Company in such reports is accumulated and communicated to the Company’s management, including the Chief Executive and Chief Financial Officers, as appropriate to allow timely decisions regarding required disclosure. Based on an evaluation of the Company’s disclosure controls and procedures (as such term is defined in Rules 13a-15(e) and 15d-15(e) under the Securities Exchange Act of 1934, as amended) as of the end of the period covered by this report conducted by the Company’s management, with the participation of the Chief Executive and Chief Financial Officers, the Chief Executive and Chief Financial Officers concluded that the Company’s disclosure controls and procedures were effective to ensure that information required to be disclosed by the Company in the reports it files with or submits to the SEC is recorded, processed, summarized and reported, within the time periods specified in the SEC’s rules and forms and to ensure that information required to be disclosed by the Company in such reports is accumulated and communicated to the Company’s management, including the Chief Executive and Chief Financial Officers, as appropriate to allow timely decisions regarding required disclosure.
Management’s Report on Internal Control over Financial Reporting
Management of the Company is responsible for establishing and maintaining adequate internal control over financial reporting (as defined in Rule 13a-15(f) under the Securities Exchange Act of 1934, as amended) for the Company.
Because of its inherent limitations, internal control over financial reporting may not prevent or detect misstatements. Projections of any evaluation of effectiveness to future periods are subject to the risk that controls may become inadequate because of changes in conditions, or that the degree of compliance with the policies or procedures may deteriorate. All internal control systems, no matter how well designed, have inherent limitations. Therefore, even those systems determined to be effective can provide only reasonable assurance with respect to financial statement preparation and presentation.
Management assessed the effectiveness of the Company’s internal control over financial reporting as of December 31, 2023. In making this assessment, management used the criteria set forth by the Committee of Sponsoring Organizations of the Treadway Commission (COSO) in Internal Control —Integrated Framework (2013 Framework). Based on our assessment, we concluded that, as of December 31, 2023, the Company’s internal control over financial reporting is effective based on those criteria.
Ernst & Young LLP, the independent registered public accounting firm that audited the Company’s financial statements, has also audited the Company’s internal control over financial reporting as of December 31, 2023. Ernst & Young LLP’s attestation report on the Company’s internal control over financial reporting appears directly below.
There have been no changes in the Company’s internal control over financial reporting or in other factors that have materially affected, or are reasonably likely to materially affect, the Company’s internal control over financial reporting during the Company’s last fiscal quarter.
Report of Independent Registered Public Accounting Firm
To the Stockholders and the Board of Directors of Encore Wire Corporation
Opinion on Internal Control Over Financial Reporting
We have audited Encore Wire Corporation’s internal control over financial reporting as of December 31, 2023, based on criteria established in Internal Control—Integrated Framework issued by the Committee of Sponsoring Organizations of the Treadway Commission (2013 framework) (the COSO criteria). In our opinion, Encore Wire Corporation (the Company) maintained, in all material respects, effective internal control over financial reporting as of December 31, 2023, based on the COSO criteria.
We also have audited, in accordance with the standards of the Public Company Accounting Oversight Board (United States) (PCAOB), the balance sheets of the Company as of December 31, 2023 and 2022, the related statements of income, stockholders’ equity and cash flows for each of the three years in the period ended December 31, 2023, and the related notes and our report dated February 16, 2024 expressed an unqualified opinion thereon.
Basis for Opinion
The Company’s management is responsible for maintaining effective internal control over financial reporting and for its assessment of the effectiveness of internal control over financial reporting included in the accompanying Management’s Report on Internal Control over Financial Reporting. Our responsibility is to express an opinion on the Company’s internal control over financial reporting based on our audit. We are a public accounting firm registered with the PCAOB and are required to be independent with respect to the Company in accordance with the U.S. federal securities laws and the applicable rules and regulations of the Securities and Exchange Commission and the PCAOB.
We conducted our audit in accordance with the standards of the PCAOB. Those standards require that we plan and perform the audit to obtain reasonable assurance about whether effective internal control over financial reporting was maintained in all material respects.
Our audit included obtaining an understanding of internal control over financial reporting, assessing the risk that a material weakness exists, testing and evaluating the design and operating effectiveness of internal control based on the assessed risk, and performing such other procedures as we considered necessary in the circumstances. We believe that our audit provides a reasonable basis for our opinion.
Definition and Limitations of Internal Control Over Financial Reporting
A company’s internal control over financial reporting is a process designed to provide reasonable assurance regarding the reliability of financial reporting and the preparation of financial statements for external purposes in accordance with generally accepted accounting principles. A company’s internal control over financial reporting includes those policies and procedures that (1) pertain to the maintenance of records that, in reasonable detail, accurately and fairly reflect the transactions and dispositions of the assets of the company; (2) provide reasonable assurance that transactions are recorded as necessary to permit preparation of financial statements in accordance with generally accepted accounting principles, and that receipts and expenditures of the company are being made only in accordance with authorizations of management and directors of the company; and (3) provide reasonable assurance regarding prevention or timely detection of unauthorized acquisition, use, or disposition of the company’s assets that could have a material effect on the financial statements.
Because of its inherent limitations, internal control over financial reporting may not prevent or detect misstatements. Also, projections of any evaluation of effectiveness to future periods are subject to the risk that controls may become inadequate because of changes in conditions, or that the degree of compliance with the policies or procedures may deteriorate.
/s/ Ernst & Young LLP
Dallas, Texas
February 16, 2024
Item 9B. Other Information.
Rule 10b5-1 Trading Plans
During the quarter and year ended 2023, none of our executive officers or directors adopted or terminated any contract, instruction or written plan for the purchase or sale of our securities that was intended to satisfy the affirmative defense conditions of Rule 10b5-1(c) or any "non-Rule 10b5-1 trading arrangement."
Item 9C. Disclosure Regarding Foreign Jurisdictions that Prevent Inspections.
Not Applicable.
PART III
Item 10. Directors, Executive Officers and Corporate Governance.
The sections entitled “Election of Directors”, “Corporate Governance and Other Board Matters” and, if applicable, “Delinquent Section 16(a) Reports” appearing in the Company’s proxy statement for the annual meeting of stockholders to be held on May 7, 2024 setting forth certain information with respect to the directors of the Company, Section 16(a) reporting obligations of directors and officers, the Company’s audit committee, the Company’s audit committee financial expert and the procedures by which security holders may recommend nominees to the Board of Directors are incorporated herein by reference. Certain information with respect to persons who are or may be deemed to be executive officers of the Company is set forth under the caption “Information about our Executive Officers” in Part I, Item 1 of this report.
In connection with Company’s long-standing commitment to conduct its business in compliance with applicable laws and regulations and in accordance with its ethical principles, the Board of Directors has adopted a Code of Business Conduct and Ethics applicable to all employees, officers, directors, and advisors of the Company. The Code of Business Conduct and Ethics of the Company is available under the “Investors” section of the Company’s website at http://www.encorewire.com, and is incorporated herein by reference. The Company intends to post amendments to or waivers of its Code of Business Conduct and Ethics (to the extent applicable to any officer or director of the Company) at such location on its website.
Item 11. Executive Compensation.
The section entitled “Executive Compensation” appearing in the Company’s proxy statement for the annual meeting of stockholders to be held on May 7, 2024, sets forth certain information with respect to the compensation of management of the Company and compensation committee interlocks and insider participation and is incorporated herein by reference.
Item 12. Security Ownership of Certain Beneficial Owners and Management and Related Stockholder Matters.
The section entitled “Security Ownership of Certain Beneficial Owners, Directors and Executive Officers” appearing in the Company’s proxy statement for the annual meeting of stockholders to be held on May 7, 2024 sets forth certain information with respect to the ownership of the Company’s common stock, and is incorporated herein by reference.
Equity Compensation Plan Information
The following table provides information about the Company’s equity compensation plans as of December 31, 2023. | | | | | | | | | | | | | | | | | | | | |
| Number of securities to be issued upon exercise of outstanding options, warrants and rights | | Weighted-average exercise price of outstanding options, warrants and rights | | Number of securities remaining available for future issuance under equity compensation plans (excluding securities reflected in column (a)) | |
| PLAN CATEGORY | (a) | | (b) | | (c) | |
| Equity compensation plans approved by security holders (1) | 253,500 | | | $ | 43.10 | | (2) | 463,550 | | (3) |
(1) Pursuant to SEC rules and the reporting requirements for this table, we have not included in (a) above 15,000 shares of restricted stock that are issued and outstanding.
(2) Weighted average exercise price of outstanding options excludes time-based restricted stock units.
(3) Represents securities remaining available for issuance under our 2020 Long Term Incentive Plan as of December 31, 2023 that may be granted in the form of unrestricted common stock, restricted common stock, options to purchase shares of common stock, stock appreciation rights, restricted stock units, dividend equivalents, performance awards or other stock-based awards.
Item 13. Certain Relationships and Related Transactions, and Director Independence.
The sections entitled “Executive Compensation — Certain Relationships and Related Transactions” and “Corporate Governance and Other Board Matters — Board Independence” appearing in the Company’s proxy statement for the
annual meeting of stockholders to be held on May 7, 2024 set forth certain information with respect to certain relationships and related transactions, and director independence, and are incorporated herein by reference.
Item 14. Principal Accounting Fees and Services.
The Section entitled “Proposal Three — Ratification of Appointment of Independent Registered Public Accounting Firm” appearing in the Company’s proxy statement for the annual meeting of stockholders to be held on May 7, 2024, sets forth certain information with respect to certain fees paid to accountants, and is incorporated herein by reference.
PART IV
Item 15. Exhibits and Financial Statement Schedules.
The following documents are filed as a part of this report:
(1)Financial Statements included in Item 8 of this Annual Report on Form 10-K; and
(2)Financial statement schedules have been omitted because they are not applicable or the information required therein is included in the financial statements or notes thereto in Item 8 of this Annual Report on Form 10-K.
(3)The exhibits required by Item 601 of Regulation S-K are set forth below:
| | | | | | | | |
| Exhibit Number | | Description |
| | |
| 3.1 | | |
| | |
| 3.2 | | |
| | |
| 4.1 | | Form of certificate for Common Stock (filed as Exhibit 1 to the Company’s registration statement on Form 8-A, filed with the SEC on June 4, 1992 and incorporated herein by reference). |
| | |
| 4.2 | | |
| | |
| 10.1* | | |
| | |
| 10.2* | | |
| | |
| 10.3* | | |
| | |
| 10.4* | | |
| | |
| 10.5* | | |
| | |
| 10.6* | | |
| | |
| 10.7* | | |
| | |
| 10.8* | | |
| | |
| | | | | | | | |
| 10.9* | | |
| | |
| 10.10 | | |
| | |
| 10.11 | | First Amendment to Credit Agreement, by and among the Company, Bank of America, N.A., as administrative agent, swingline lender and letter of credit issuer, Wells Fargo Bank, National Association, as syndication agent and the other lenders parties thereto, dated as of October 20, 2022 (filed as Exhibit 10.1 to the Company’s Current Report on Form 8-K filed with the SEC on October 27, 2022 and incorporated herein by reference). |
| | |
| 10.12* | | |
| | |
| 23.1 | | |
| | |
| 31.1 | | |
| | |
| 31.2 | | |
| | |
| 32.1 | | |
| | |
| 32.2 | | |
| | |
| 97.1 | | |
| | |
| 101.INS | | XBRL Instance Document - the instance document does not appear in the Interactive Data File because its XBRL tags are embedded within the Inline XBRL document. |
| | |
| 101.SCH | | Inline XBRL Taxonomy Extension Schema Document |
| | |
| 101.CAL | | Inline XBRL Taxonomy Extension Calculation Linkbase Document |
| | |
| 101.DEF | | Inline XBRL Taxonomy Extension Definition Document |
| | |
| 101.LAB | | Inline XBRL Taxonomy Extension Label Linkbase Document |
| | |
| 101.PRE | | Inline XBRL Taxonomy Extension Presentation Linkbase Document |
| | |
| 104 | | Cover Page Interactive Data File - formatted as Inline XBRL and contained in Exhibit 101 |
* Management contract or compensatory plan
Item 16. Form 10-K Summary.
None.
SIGNATURES
Pursuant to the requirements of Section 13 or 15(d) of the Securities Exchange Act of 1934, the registrant has duly caused this report to be signed on its behalf by the undersigned, thereunto duly authorized. | | | | | | | | | | | |
| Date: February 16, 2024 | ENCORE WIRE CORPORATION |
| | | |
| By: | | /s/ Daniel L. Jones |
| | | Daniel L. Jones Chairman, President and Chief Executive Officer |
Pursuant to the requirements of the Securities Exchange Act of 1934, this report has been signed below by the following persons on behalf of the registrant and in the capacities and on the dates indicated. | | | | | | | | | | | | | | |
| | | | |
| Signature | | Title | | Date |
| | | | |
| /s/ DANIEL L. JONES | | Chairman, President and Chief Executive Officer (Principal Executive Officer) | | February 16, 2024 |
| Daniel L. Jones | | | |
| | | | |
| /s/ BRET J. ECKERT | | Executive Vice President and Chief Financial Officer
(Principal Financial and Accounting Officer) | | February 16, 2024 |
| Bret J. Eckert | | | |
| | | | |
| /s/ GINA A. NORRIS | | Director | | February 16, 2024 |
| Gina A. Norris | | | | |
| | | | |
| /s/ WILLIAM R. THOMAS | | Director | | February 16, 2024 |
| William R. Thomas | | | | |
| | | | |
| /s/ W. KELVIN WALKER | | Director | | February 16, 2024 |
| W. Kelvin Walker | | | | |
| | | | |
| /s/ SCOTT D. WEAVER | | Director | | February 16, 2024 |
| Scott D. Weaver | | | | |
| | | | |
| /s/ JOHN H. WILSON | | Lead Independent Director | | February 16, 2024 |
| John H. Wilson | | | | |
EXHIBIT 4.2
Description of the Registrant’s Securities
As of February 16, 2024, Encore Wire Corporation (the “Company”) has one class of capital stock registered under Section 12 of the Securities Exchange Act of 1934, as amended (the “Exchange Act”), which is the Company’s common stock, par value $.01 per share (“Common Stock”).
The following description of our capital stock is a summary and does not purport to be complete and is subject to and qualified in its entirety by reference to our Certificate of Incorporation, as amended (“Certificate”), and our Third Amended and Restated Bylaws, as amended (“Bylaws”), each of which are incorporated by reference as an exhibit to the Annual Report on Form 10-K of which this Exhibit 4.2 is a part. We encourage you to read our Certificate, our Bylaws and the applicable provisions of Delaware General Corporation Law (“DGCL”), for additional information.
Authorized and Outstanding Capital Stock
Our authorized capital stock consists of 42,000,000 shares comprised of two classes: (i) 40,000,000 shares of Common Stock, of which 15,763,916 shares are issued and outstanding and (ii) 2,000,000 shares of preferred stock, par value $.01 per share (“Preferred Stock”), of which no shares are issued and outstanding.
Holders of Common Stock have no preemptive rights to purchase or subscribe for securities of the Company, and the Common Stock is not convertible or subject to redemption by the Company. In the event of the dissolution of the Company, holders of Common Stock are entitled to share ratably in all of the assets of the Company remaining, if any, after satisfaction of the debts and liabilities of the Company and any preferential rights of the holders of any outstanding Preferred Stock. The outstanding shares of Common Stock are validly issued, fully paid and non-assessable.
Holders of Common Stock are entitled to receive cash dividends when and as declared by the Board of Directors of the Company out of funds legally available therefor after payment of, or provision for, full dividends (on a cumulative basis, if applicable) on any outstanding shares of Preferred Stock, then outstanding. Future policy with respect to dividends on the Common Stock will be determined by the Board of Directors based upon conditions then existing, including the Company’s earnings and financial condition, capital requirements and other relevant facts.
Listing
Our Common Stock is listed on The NASDAQ Global Select Market under the trading symbol “WIRE.”
Preferred Stock
The Board of Directors, without further action by the stockholders, is authorized to issue up to 2,000,000 shares of Preferred Stock in one or more series and to fix and determine as to any series and all of the relative rights and preferences of shares in such series, including, without limitation preferences, limitations or relative rights with respect to redemption rights, conversion rights, voting rights, dividend rights and preferences on liquidation.
The issuances of Preferred Stock may have the effect of delaying, deferring or preventing a change in control of the Company, making removal of present management of the Company more difficult or
resulting in restrictions upon the payment of dividends and other distributions to the holders of Common Stock. The Company has no present intention to issue any Preferred Stock.
Voting
Holders of Common Stock are entitled to cast one vote for each share held on record on matters submitted to a vote of the stockholders of the Company. Shares of Common Stock do not have cumulative voting rights with respect to the election of directors. Directors are elected by a plurality of the shares of Common Stock represented at the meeting. Approval of any other matter that is submitted to the stockholders requires the affirmative vote of the holders of a majority of the shares of Common Stock represented at the meeting. The holders of a majority of the shares entitled to vote shall constitute a quorum at meetings of stockholders. The foregoing voting rights are subject to any voting rights of any series of Preferred Stock which may be issued in the future. Shares of Preferred Stock may be voting or non-voting and may be entitled to vote as a class or series with respect to certain matters as provided in the resolutions of the Board of Directors establishing such series or in the DGCL.
Anti-Takeover Provisions
The Company is subject to Section 203 of the DGCL which, subject to certain exceptions, prohibits a Delaware corporation from engaging in a business combination (as defined therein) with an “interested stockholder” (defined generally as any person who beneficially owns 15% or more of the outstanding voting stock of the Company or any affiliate or associate of such person) for a period of three years following the date that such stockholder became an interested stockholder, unless (i) prior to such date the board of directors of the corporation approved either the business combination or the transaction which resulted in the stockholder becoming an interested stockholder, (ii) upon consummation of the transaction which resulted in the stockholder becoming an interested stockholder, the interested stockholder owned at least 85% of the voting stock of the corporation outstanding at the time the transaction commenced, excluding for purposes of determining the number of shares outstanding those shares owned (x) by persons who are directors and also officers and (y) by employee stock plans in which the employee participants do not have the right to determine confidentially whether shares held subject to the plan will be tendered in a tender or exchange offer, or (iii) on or subsequent to such date the business combination is approved by the board of directors and authorized at an annual or special meeting of stockholders, and not by written consent, by the affirmative vote of at least 662/3% of the outstanding voting stock which is not owned by the interested stockholder.
EXHIBIT 23.1
Consent of Independent Registered Public Accounting Firm
We consent to the incorporation by reference in the following Registration Statements: | | | | | |
| 1) | Registration Statement (Form S-8 No. 333-238025) pertaining to the Encore Wire Corporation 2020 Long Term Incentive Plan, and |
| |
| 2) | Registration Statement (Forms S-8 Nos. 333-175634 and 333-217798) pertaining to the Encore Wire Corporation 2010 Stock Option Plan; |
of our reports dated February 16, 2024, with respect to the financial statements of Encore Wire Corporation and the effectiveness of internal control over financial reporting of Encore Wire Corporation included in this Annual Report (Form 10-K) of Encore Wire Corporation for the year ended December 31, 2023.
/s/ Ernst & Young LLP
Dallas, Texas
February 16, 2024
EXHIBIT 31.1
CERTIFICATION OF CHIEF EXECUTIVE OFFICER
I, Daniel L. Jones, certify that:
1. I have reviewed this annual report on Form 10-K of Encore Wire Corporation;
2. Based on my knowledge, this report does not contain any untrue statement of a material fact or omit to state a material fact necessary to make the statements made, in light of the circumstances under which such statements were made, not misleading with respect to the period covered by this report;
3. Based on my knowledge, the financial statements, and other financial information included in this report, fairly present in all material respects the financial condition, results of operations and cash flows of the registrant as of, and for, the periods presented in this report;
4. The registrant’s other certifying officer(s) and I are responsible for establishing and maintaining disclosure controls and procedures (as defined in Exchange Act Rules 13a-15(e) and 15d-15(e)) and internal control over financial reporting (as defined in Exchange Act Rules 13a-15(f) and 15d-15(f)) for the registrant and have:
(a)Designed such disclosure controls and procedures, or caused such disclosure controls and procedures to be designed under our supervision, to ensure that material information relating to the registrant, including its consolidated subsidiaries, is made known to us by others within those entities, particularly during the period in which this report is being prepared;
(b)Designed such internal control over financial reporting, or caused such internal control over financial reporting to be designed under our supervision, to provide reasonable assurance regarding the reliability of financial reporting and the preparation of financial statements for external purposes in accordance with generally accepted accounting principles;
(c)Evaluated the effectiveness of the registrant’s disclosure controls and procedures and presented in this report our conclusions about the effectiveness of the disclosure controls and procedures, as of the end of the period covered by this report based on such evaluation; and
(d)Disclosed in this report any change in the registrant’s internal control over financial reporting that occurred during the registrant’s most recent fiscal quarter (the registrant’s fourth fiscal quarter in the case of an annual report) that has materially affected, or is reasonably likely to materially affect, the registrant’s internal control over financial reporting; and
5. The registrant’s other certifying officer(s) and I have disclosed, based on our most recent evaluation of internal control over financial reporting, to the registrant’s auditors and the audit committee of the registrant’s board of directors (or persons performing the equivalent functions):
(a)All significant deficiencies and material weaknesses in the design or operation of internal control over financial reporting which are reasonably likely to adversely affect the registrant’s ability to record, process, summarize and report financial information; and
(b)Any fraud, whether or not material, that involves management or other employees who have a significant role in the registrant’s internal control over financial reporting.
| | | | | | | | | | | |
| Date: February 16, 2024 | By: | | /s/ Daniel L. Jones |
| | | Daniel L. Jones Chairman, President and Chief Executive Officer |
EXHIBIT 31.2
CERTIFICATION OF CHIEF FINANCIAL OFFICER
I, Bret J. Eckert, certify that:
1. I have reviewed this annual report on Form 10-K of Encore Wire Corporation;
2. Based on my knowledge, this report does not contain any untrue statement of a material fact or omit to state a material fact necessary to make the statements made, in light of the circumstances under which such statements were made, not misleading with respect to the period covered by this report;
3. Based on my knowledge, the financial statements, and other financial information included in this report, fairly present in all material respects the financial condition, results of operations and cash flows of the registrant as of, and for, the periods presented in this report;
4. The registrant’s other certifying officer(s) and I are responsible for establishing and maintaining disclosure controls and procedures (as defined in Exchange Act Rules 13a-15(e) and 15d-15(e)) and internal control over financial reporting (as defined in Exchange Act Rules 13a-15(f) and 15d-15(f)) for the registrant and have:
(a)Designed such disclosure controls and procedures, or caused such disclosure controls and procedures to be designed under our supervision, to ensure that material information relating to the registrant, including its consolidated subsidiaries, is made known to us by others within those entities, particularly during the period in which this report is being prepared;
(b)Designed such internal control over financial reporting, or caused such internal control over financial reporting to be designed under our supervision, to provide reasonable assurance regarding the reliability of financial reporting and the preparation of financial statements for external purposes in accordance with generally accepted accounting principles;
(c)Evaluated the effectiveness of the registrant’s disclosure controls and procedures and presented in this report our conclusions about the effectiveness of the disclosure controls and procedures, as of the end of the period covered by this report based on such evaluation; and
(d)Disclosed in this report any change in the registrant’s internal control over financial reporting that occurred during the registrant’s most recent fiscal quarter (the registrant’s fourth fiscal quarter in the case of an annual report) that has materially affected, or is reasonably likely to materially affect, the registrant’s internal control over financial reporting; and
5. The registrant’s other certifying officer(s) and I have disclosed, based on our most recent evaluation of internal control over financial reporting, to the registrant’s auditors and the audit committee of the registrant’s board of directors (or persons performing the equivalent functions):
(a)All significant deficiencies and material weaknesses in the design or operation of internal control over financial reporting which are reasonably likely to adversely affect the registrant’s ability to record, process, summarize and report financial information; and
(b)Any fraud, whether or not material, that involves management or other employees who have a significant role in the registrant’s internal control over financial reporting.
| | | | | | | | | | | |
| Date: February 16, 2024 | By: | | /s/ Bret J. Eckert |
| | | Bret J. Eckert
Executive Vice President and Chief Financial Officer |
EXHIBIT 32.1
Certification Pursuant to 18 U.S.C. Section 1350, as adopted pursuant to Section 906 of
the Sarbanes-Oxley Act of 2002
In connection with the Annual Report of Encore Wire Corporation (the “Company”) on Form 10-K for the annual period ended December 31, 2023, as filed with the Securities Exchange Commission on the date hereof (the “Report”), I, Daniel L. Jones, Chairman, President and Chief Executive Officer of the Company, hereby certify pursuant to 18 U.S.C. Section 1350, as adopted pursuant to Section 906 of the Sarbanes-Oxley Act of 2002, that to my knowledge:
1. The Report fully complies with the requirements of Section 13(a) or 15(d) of the Securities Exchange Act of 1934, as amended; and
2. The information contained in the Report fairly presents, in all material respects, the financial condition and results of operations of the Company.
| | | | | | | | | | | |
| Date: February 16, 2024 | By: | | /s/ Daniel L. Jones |
| | | Daniel L. Jones Chairman, President and Chief Executive Officer |
EXHIBIT 32.2
Certification Pursuant to 18 U.S.C. Section 1350, as adopted pursuant to Section 906 of
the Sarbanes-Oxley Act of 2002
In connection with the Annual Report of Encore Wire Corporation (the “Company”) on Form 10-K for the annual period ended December 31, 2023, as filed with the Securities Exchange Commission on the date hereof (the “Report”), I, Bret J. Eckert, Executive Vice President and Chief Financial Officer of the Company, hereby certify pursuant to 18 U.S.C. Section 1350, as adopted pursuant to Section 906 of the Sarbanes-Oxley Act of 2002, that to my knowledge:
1. The Report fully complies with the requirements of Section 13(a) or 15(d) of the Securities Exchange Act of 1934, as amended; and
2. The information contained in the Report fairly presents, in all material respects, the financial condition and results of operations of the Company.
| | | | | | | | | | | |
| Date: February 16, 2024 | By: | | /s/ Bret J. Eckert |
| | | Bret J. Eckert Executive Vice President and Chief Financial Officer |

ENCORE WIRE CORPORATION Clawback Policy Effective as of November 30, 2023 Section 1. Purpose This Clawback Policy (this “Policy”) has been adopted by the Board of Directors (the “Board”) of Encore Wire Corporation (the “Company”) effective as of November 30, 2023. This Policy is designed to comply with Section 10D of the Securities Exchange Act of 1934 (the “Exchange Act”) and with the NASDAQ Stock Market (“NASDAQ”) Listing Rule 5608 and provides for the recoupment of certain Incentive Compensation (as defined below). Section 2. Administration This Policy shall be administered by the Board or, if so designated by the Board, the Compensation Committee of the Board (the “Committee”), in which case references herein to the Board shall be deemed references to the Committee. Subject to the provisions of this Policy, the Board shall make such determinations and interpretations and take such actions in connection with this Policy as it deems necessary or advisable. All determinations and interpretations made by the Board shall be final, binding and conclusive. Section 3. Definitions i. “Accounting Restatement” means a restatement of the Company’s financial statements due to material noncompliance of the Company with any financial reporting requirement under applicable securities laws, including: (A) a restatement to correct a material error in a previously issued financial statement; or (B) a restatement to correct an immaterial error from a previously issued financial statement that would result in a material misstatement in the current-period financial statement. ii. “Covered Employee” means any current and former Executive Officers, and such other senior executives who may from time to time be deemed subject to the Policy by the Board or Committee. iii. “Excess Incentive Compensation” means the amount of Incentive Compensation received by the Covered Employee that exceeds the amount of Incentive Compensation that would have otherwise been received by the Covered Employee had it been determined based on the results of the Accounting Restatement, computed without regard to any taxes paid. iv. “Executive Officer” shall have the meaning set forth in NASDAQ Listing Rule 5608. v. “Financial Reporting Measures” are measures that are determined and presented in accordance with the accounting principles used in preparing the Company’s financial

statements, whether presented in or outside of the Company’s financial statements, any measure derived wholly or in part from such measures (including non-GAAP measures and other measures, metrics, and ratios that are non-GAAP measures). Stock price and total shareholder return are also financial reporting measures. vi. “Incentive Compensation” means any compensation including, but not limited to: (i) annual bonuses and other short-term and long-term cash incentives; (ii) stock options; (iii) stock appreciation rights; (iv) restricted stock; (v) restricted stock units; (vi) performance shares; and (vii) performance units, in each case, that is granted, earned, or vested based wholly or in part on the attainment of any of the Financial Reporting Measures. vii. “Recovery Period” means the three (3) completed fiscal years immediately preceding the Required Accounting Restatement Date. In addition, the Recovery Period shall include any transition period (that results from a change in the Company’s fiscal year) within or immediately following the aforementioned three (3) completed fiscal years; provided, however, that a transition period between the last day of the Company’s previous fiscal year end and the first of its new fiscal year that comprises a period of nine (9) to twelve (12) months would be deemed a completed fiscal year. viii. “Required Accounting Restatement Date” means the earlier to occur of: (i) the date the Board, a committee of the Board, or the officers or officers of the Company authorized to take such action if the Board is not required, concludes, or reasonably should have concluded, that the Company is required to prepare an Accounting Restatement or (ii) the date a court, regulatory, or other legally authorized body directs to the Company to prepare an Accounting Restatement. Section 4. Persons Subject to this Policy This Policy shall apply to all Incentive Compensation received by a Covered Employee: (i) after beginning service as an Executive Officer; (ii) who served as an Executive Officer during the Recovery Period; and (iii) while the Company has a class of securities listed on a national securities exchange or a national securities association. Notwithstanding the foregoing, the Board may choose to apply this Policy, in its discretion, to Incentive Compensation received by a Covered Person during the Recovery Period even if such person did not serve as an Executive Officer during all or part of the Recovery Period. Section 5. Erroneously Awarded Incentive Compensation and Amount Subject to Clawback. In the event the Company is required to prepare an Accounting Restatement, the amount to be recovered from the Covered Employee shall be the Excess Incentive Compensation paid or awarded to a Covered Employee during the Recovery Period. For purposes of calculating the Excess Incentive Compensation amount, Incentive Compensation will be deemed received in the Company’s fiscal period during which the Financial Reporting Measure specified in the incentive- based compensation award is attained, even if the payment or grant of the Incentive Compensation occurs after the end of that period. Notwithstanding the foregoing, if the Board cannot determine the amount of Excess Incentive Compensation received by the Covered Employee directly from the information in the

Accounting Restatement, the Board will make a determination as to the amount of Excess Incentive Compensation based on a reasonable estimate of the effect of the Accounting Restatement. Section 6. Method of Recoupment The Board shall determine, in its sole discretion, the method of recovering or cancelling, as the case may be, Excess Incentive Compensation, which may include, without limitation, any one or more of the following: i. requiring reimbursement of cash Excess Incentive Compensation previously paid; ii. seeking the recovery of any gain realized on the vesting, exercise, settlement, sale, transfer, or other disposition of any equity or equity-based awards; iii. offsetting the Excess Incentive Compensation from any compensation otherwise owed by the Company to the Covered Employee; iv. cancelling outstanding vested or unvested equity awards; and/or v. taking any other remedial recovery action permitted by law, as determined by the Board. Section 7. Impracticability The Board shall recover any Excess Incentive Compensation in accordance with this Policy unless the Board concludes such recovery would be impracticable, as determined by the Board pursuant to and in accordance with Rule 10D-1 of the Exchange Act and NASDAQ Listing Rule 5608. Section 8. No Indemnification and Liability of Covered Employee The Company shall not indemnify any Covered Employee, directly or indirectly, for any losses that such Covered Employee may incur in connection with the recovery of any compensation set forth in this Policy. If a Covered Employee does not comply with any recoupment pursuant to Section 6 hereof, such Covered Employee shall be liable for, and the Company shall be entitled to recover, any costs, fees and expenses (including, without limitation, any legal fees) incurred by the Company in seeking to effect recoupment pursuant to Section 6 hereof. Section 9. Other Recoupment Rights Any applicable employment agreement, award agreement or other document setting forth the terms and conditions of any compensation covered by this Policy shall be deemed to include the restrictions imposed herein and incorporate this Policy by reference and, in the event of any inconsistency, the terms of this Policy will govern. To the extent that any applicable law or stock market or exchange rules or regulations permit or require recovery of compensation in circumstances in addition to those specified herein, nothing in this Policy will be deemed to limit or restrict the right or obligation of the Company to recover such compensation to the fullest extent permitted or required by such law, rules or regulations.

The Board shall provide notice and seek written acknowledgement of this Policy from each Covered Employee as soon as practicable after the later of (i) the Effective Date and (ii) the date on which the employee is designated as a Covered Officer; provided, however, that failure to obtain such acknowledgement shall have no impact on the enforceability of this Policy. Section 10. Interpretation; Amendment; Termination The Board may amend this Policy from time to time in its discretion and shall amend this Policy as it deems necessary to comply with the regulations adopted by the Securities and Exchange Commission under Section 10D of the Exchange Act and with NASDAQ Listing Rule 5608, or any successor regulations or rules. The Board may terminate this Policy at any time. Section 11. Enforceability If any provision of this Clawback Policy is determined to be unenforceable or invalid under any applicable law, such provision will be applied to the maximum extent permitted by applicable law and shall automatically be deemed amended in a manner consistent with its objectives to the extent necessary to conform to any limitations required under applicable law. Section 12. Successors This Policy shall be binding and enforceable against all Covered Employees and their beneficiaries, heirs, executors, administrators or other legal representatives.
v3.24.0.1
Cover Page - USD ($)
|
12 Months Ended |
|
|
Dec. 31, 2023 |
Feb. 15, 2024 |
Jun. 30, 2023 |
| Cover [Abstract] |
|
|
|
| Document Type |
10-K
|
|
|
| Document Annual Report |
true
|
|
|
| Document Period End Date |
Dec. 31, 2023
|
|
|
| Current Fiscal Year End Date |
--12-31
|
|
|
| Document Transition Report |
false
|
|
|
| Entity File Number |
000-20278
|
|
|
| Entity Registrant Name |
ENCORE WIRE CORPORATION
|
|
|
| Entity Incorporation, State or Country Code |
DE
|
|
|
| Entity Tax Identification Number |
75-2274963
|
|
|
| Entity Address, Address Line One |
1329 Millwood Road
|
|
|
| Entity Address, City or Town |
McKinney,
|
|
|
| Entity Address, State or Province |
TX
|
|
|
| Entity Address, Postal Zip Code |
75069
|
|
|
| City Area Code |
972
|
|
|
| Local Phone Number |
562-9473
|
|
|
| Title of 12(b) Security |
Common Stock, par value $.01 per share
|
|
|
| Trading Symbol |
WIRE
|
|
|
| Security Exchange Name |
NASDAQ
|
|
|
| Entity Well-known Seasoned Issuer |
No
|
|
|
| Entity Voluntary Filers |
No
|
|
|
| Entity Current Reporting Status |
Yes
|
|
|
| Entity Interactive Data Current |
Yes
|
|
|
| Entity Filer Category |
Large Accelerated Filer
|
|
|
| Entity Small Business |
false
|
|
|
| Entity Emerging Growth Company |
false
|
|
|
| ICFR Auditor Attestation Flag |
true
|
|
|
| Document Financial Statement Error Correction [Flag] |
false
|
|
|
| Entity Shell Company |
false
|
|
|
| Entity Public Float |
|
|
$ 2,125,052,538
|
| Entity Common Stock, Shares Outstanding |
|
15,763,916
|
|
| Documents Incorporated by Reference |
Listed below are documents, parts of which are incorporated herein by reference, and the part of this report into which the document is incorporated: (1)Proxy statement for the 2024 annual meeting of stockholders – Part III
|
|
|
| Entity Central Index Key |
0000850460
|
|
|
| Document Fiscal Year Focus |
2023
|
|
|
| Document Fiscal Period Focus |
FY
|
|
|
| Amendment Flag |
false
|
|
|
| X |
- DefinitionBoolean flag that is true when the XBRL content amends previously-filed or accepted submission.
| Name: |
dei_AmendmentFlag |
| Namespace Prefix: |
dei_ |
| Data Type: |
xbrli:booleanItemType |
| Balance Type: |
na |
| Period Type: |
duration |
|
| X |
- DefinitionEnd date of current fiscal year in the format --MM-DD.
| Name: |
dei_CurrentFiscalYearEndDate |
| Namespace Prefix: |
dei_ |
| Data Type: |
xbrli:gMonthDayItemType |
| Balance Type: |
na |
| Period Type: |
duration |
|
| X |
- DefinitionBoolean flag that is true only for a form used as an annual report. Reference 1: http://www.xbrl.org/2003/role/presentationRef
-Publisher SEC
-Name Form 10-K
-Number 249
-Section 310
Reference 2: http://www.xbrl.org/2003/role/presentationRef
-Publisher SEC
-Name Form 20-F
-Number 249
-Section 220
-Subsection f
Reference 3: http://www.xbrl.org/2003/role/presentationRef
-Publisher SEC
-Name Form 40-F
-Number 249
-Section 240
-Subsection f
| Name: |
dei_DocumentAnnualReport |
| Namespace Prefix: |
dei_ |
| Data Type: |
xbrli:booleanItemType |
| Balance Type: |
na |
| Period Type: |
duration |
|
| X |
- DefinitionIndicates whether any of the financial statement period in the filing include a restatement due to error correction. Reference 1: http://www.xbrl.org/2003/role/presentationRef
-Publisher SEC
-Name Regulation S-K
-Number 229
-Section 402
-Subsection w
Reference 2: http://www.xbrl.org/2003/role/presentationRef
-Publisher SEC
-Name Form 10-K
-Number 249
-Section 310
Reference 3: http://www.xbrl.org/2003/role/presentationRef
-Publisher SEC
-Name Form 20-F
-Number 249
-Section 220
-Subsection f
Reference 4: http://www.xbrl.org/2003/role/presentationRef
-Publisher SEC
-Name Form 40-F
-Number 249
-Section 240
-Subsection f
| Name: |
dei_DocumentFinStmtErrorCorrectionFlag |
| Namespace Prefix: |
dei_ |
| Data Type: |
xbrli:booleanItemType |
| Balance Type: |
na |
| Period Type: |
duration |
|
| X |
- DefinitionFiscal period values are FY, Q1, Q2, and Q3. 1st, 2nd and 3rd quarter 10-Q or 10-QT statements have value Q1, Q2, and Q3 respectively, with 10-K, 10-KT or other fiscal year statements having FY.
| Name: |
dei_DocumentFiscalPeriodFocus |
| Namespace Prefix: |
dei_ |
| Data Type: |
dei:fiscalPeriodItemType |
| Balance Type: |
na |
| Period Type: |
duration |
|
| X |
- DefinitionThis is focus fiscal year of the document report in YYYY format. For a 2006 annual report, which may also provide financial information from prior periods, fiscal 2006 should be given as the fiscal year focus. Example: 2006.
| Name: |
dei_DocumentFiscalYearFocus |
| Namespace Prefix: |
dei_ |
| Data Type: |
xbrli:gYearItemType |
| Balance Type: |
na |
| Period Type: |
duration |
|
| X |
- DefinitionFor the EDGAR submission types of Form 8-K: the date of the report, the date of the earliest event reported; for the EDGAR submission types of Form N-1A: the filing date; for all other submission types: the end of the reporting or transition period. The format of the date is YYYY-MM-DD.
| Name: |
dei_DocumentPeriodEndDate |
| Namespace Prefix: |
dei_ |
| Data Type: |
xbrli:dateItemType |
| Balance Type: |
na |
| Period Type: |
duration |
|
| X |
- DefinitionBoolean flag that is true only for a form used as a transition report. Reference 1: http://www.xbrl.org/2003/role/presentationRef
-Publisher SEC
-Name Forms 10-K, 10-Q, 20-F
-Number 240
-Section 13
-Subsection a-1
| Name: |
dei_DocumentTransitionReport |
| Namespace Prefix: |
dei_ |
| Data Type: |
xbrli:booleanItemType |
| Balance Type: |
na |
| Period Type: |
duration |
|
| X |
- DefinitionThe type of document being provided (such as 10-K, 10-Q, 485BPOS, etc). The document type is limited to the same value as the supporting SEC submission type, or the word 'Other'.
| Name: |
dei_DocumentType |
| Namespace Prefix: |
dei_ |
| Data Type: |
dei:submissionTypeItemType |
| Balance Type: |
na |
| Period Type: |
duration |
|
| X |
- DefinitionDocuments incorporated by reference. Reference 1: http://www.xbrl.org/2003/role/presentationRef
-Publisher SEC
-Name Exchange Act
-Number 240
-Section 12
-Subsection b-23
| Name: |
dei_DocumentsIncorporatedByReferenceTextBlock |
| Namespace Prefix: |
dei_ |
| Data Type: |
dtr-types:textBlockItemType |
| Balance Type: |
na |
| Period Type: |
duration |
|
| X |
- DefinitionAddress Line 1 such as Attn, Building Name, Street Name
| Name: |
dei_EntityAddressAddressLine1 |
| Namespace Prefix: |
dei_ |
| Data Type: |
xbrli:normalizedStringItemType |
| Balance Type: |
na |
| Period Type: |
duration |
|
| X |
- Definition
+ References
+ Details
| Name: |
dei_EntityAddressCityOrTown |
| Namespace Prefix: |
dei_ |
| Data Type: |
xbrli:normalizedStringItemType |
| Balance Type: |
na |
| Period Type: |
duration |
|
| X |
- DefinitionCode for the postal or zip code
| Name: |
dei_EntityAddressPostalZipCode |
| Namespace Prefix: |
dei_ |
| Data Type: |
xbrli:normalizedStringItemType |
| Balance Type: |
na |
| Period Type: |
duration |
|
| X |
- DefinitionName of the state or province.
| Name: |
dei_EntityAddressStateOrProvince |
| Namespace Prefix: |
dei_ |
| Data Type: |
dei:stateOrProvinceItemType |
| Balance Type: |
na |
| Period Type: |
duration |
|
| X |
- DefinitionA unique 10-digit SEC-issued value to identify entities that have filed disclosures with the SEC. It is commonly abbreviated as CIK. Reference 1: http://www.xbrl.org/2003/role/presentationRef
-Publisher SEC
-Name Exchange Act
-Number 240
-Section 12
-Subsection b-2
| Name: |
dei_EntityCentralIndexKey |
| Namespace Prefix: |
dei_ |
| Data Type: |
dei:centralIndexKeyItemType |
| Balance Type: |
na |
| Period Type: |
duration |
|
| X |
- DefinitionIndicate number of shares or other units outstanding of each of registrant's classes of capital or common stock or other ownership interests, if and as stated on cover of related periodic report. Where multiple classes or units exist define each class/interest by adding class of stock items such as Common Class A [Member], Common Class B [Member] or Partnership Interest [Member] onto the Instrument [Domain] of the Entity Listings, Instrument.
| Name: |
dei_EntityCommonStockSharesOutstanding |
| Namespace Prefix: |
dei_ |
| Data Type: |
xbrli:sharesItemType |
| Balance Type: |
na |
| Period Type: |
instant |
|
| X |
- DefinitionIndicate 'Yes' or 'No' whether registrants (1) have filed all reports required to be filed by Section 13 or 15(d) of the Securities Exchange Act of 1934 during the preceding 12 months (or for such shorter period that registrants were required to file such reports), and (2) have been subject to such filing requirements for the past 90 days. This information should be based on the registrant's current or most recent filing containing the related disclosure.
| Name: |
dei_EntityCurrentReportingStatus |
| Namespace Prefix: |
dei_ |
| Data Type: |
dei:yesNoItemType |
| Balance Type: |
na |
| Period Type: |
duration |
|
| X |
- DefinitionIndicate if registrant meets the emerging growth company criteria. Reference 1: http://www.xbrl.org/2003/role/presentationRef
-Publisher SEC
-Name Exchange Act
-Number 240
-Section 12
-Subsection b-2
| Name: |
dei_EntityEmergingGrowthCompany |
| Namespace Prefix: |
dei_ |
| Data Type: |
xbrli:booleanItemType |
| Balance Type: |
na |
| Period Type: |
duration |
|
| X |
- DefinitionCommission file number. The field allows up to 17 characters. The prefix may contain 1-3 digits, the sequence number may contain 1-8 digits, the optional suffix may contain 1-4 characters, and the fields are separated with a hyphen.
| Name: |
dei_EntityFileNumber |
| Namespace Prefix: |
dei_ |
| Data Type: |
dei:fileNumberItemType |
| Balance Type: |
na |
| Period Type: |
duration |
|
| X |
- DefinitionIndicate whether the registrant is one of the following: Large Accelerated Filer, Accelerated Filer, Non-accelerated Filer. Definitions of these categories are stated in Rule 12b-2 of the Exchange Act. This information should be based on the registrant's current or most recent filing containing the related disclosure. Reference 1: http://www.xbrl.org/2003/role/presentationRef
-Publisher SEC
-Name Exchange Act
-Number 240
-Section 12
-Subsection b-2
| Name: |
dei_EntityFilerCategory |
| Namespace Prefix: |
dei_ |
| Data Type: |
dei:filerCategoryItemType |
| Balance Type: |
na |
| Period Type: |
duration |
|
| X |
- DefinitionTwo-character EDGAR code representing the state or country of incorporation.
| Name: |
dei_EntityIncorporationStateCountryCode |
| Namespace Prefix: |
dei_ |
| Data Type: |
dei:edgarStateCountryItemType |
| Balance Type: |
na |
| Period Type: |
duration |
|
| X |
- DefinitionBoolean flag that is true when the registrant has submitted electronically every Interactive Data File required to be submitted pursuant to Rule 405 of Regulation S-T during the preceding 12 months (or for such shorter period that the registrant was required to submit such files). Reference 1: http://www.xbrl.org/2003/role/presentationRef
-Publisher SEC
-Name Regulation S-T
-Number 232
-Section 405
| Name: |
dei_EntityInteractiveDataCurrent |
| Namespace Prefix: |
dei_ |
| Data Type: |
dei:yesNoItemType |
| Balance Type: |
na |
| Period Type: |
duration |
|
| X |
- DefinitionThe aggregate market value of the voting and non-voting common equity held by non-affiliates computed by reference to the price at which the common equity was last sold, or the average bid and asked price of such common equity, as of the last business day of the registrant's most recently completed second fiscal quarter.
| Name: |
dei_EntityPublicFloat |
| Namespace Prefix: |
dei_ |
| Data Type: |
xbrli:monetaryItemType |
| Balance Type: |
credit |
| Period Type: |
instant |
|
| X |
- DefinitionThe exact name of the entity filing the report as specified in its charter, which is required by forms filed with the SEC. Reference 1: http://www.xbrl.org/2003/role/presentationRef
-Publisher SEC
-Name Exchange Act
-Number 240
-Section 12
-Subsection b-2
| Name: |
dei_EntityRegistrantName |
| Namespace Prefix: |
dei_ |
| Data Type: |
xbrli:normalizedStringItemType |
| Balance Type: |
na |
| Period Type: |
duration |
|
| X |
- DefinitionBoolean flag that is true when the registrant is a shell company as defined in Rule 12b-2 of the Exchange Act. Reference 1: http://www.xbrl.org/2003/role/presentationRef
-Publisher SEC
-Name Exchange Act
-Number 240
-Section 12
-Subsection b-2
| Name: |
dei_EntityShellCompany |
| Namespace Prefix: |
dei_ |
| Data Type: |
xbrli:booleanItemType |
| Balance Type: |
na |
| Period Type: |
duration |
|
| X |
- DefinitionIndicates that the company is a Smaller Reporting Company (SRC). Reference 1: http://www.xbrl.org/2003/role/presentationRef
-Publisher SEC
-Name Exchange Act
-Number 240
-Section 12
-Subsection b-2
| Name: |
dei_EntitySmallBusiness |
| Namespace Prefix: |
dei_ |
| Data Type: |
xbrli:booleanItemType |
| Balance Type: |
na |
| Period Type: |
duration |
|
| X |
- DefinitionThe Tax Identification Number (TIN), also known as an Employer Identification Number (EIN), is a unique 9-digit value assigned by the IRS. Reference 1: http://www.xbrl.org/2003/role/presentationRef
-Publisher SEC
-Name Exchange Act
-Number 240
-Section 12
-Subsection b-2
| Name: |
dei_EntityTaxIdentificationNumber |
| Namespace Prefix: |
dei_ |
| Data Type: |
dei:employerIdItemType |
| Balance Type: |
na |
| Period Type: |
duration |
|
| X |
- DefinitionIndicate 'Yes' or 'No' if the registrant is not required to file reports pursuant to Section 13 or Section 15(d) of the Act.
| Name: |
dei_EntityVoluntaryFilers |
| Namespace Prefix: |
dei_ |
| Data Type: |
dei:yesNoItemType |
| Balance Type: |
na |
| Period Type: |
duration |
|
| X |
- DefinitionIndicate 'Yes' or 'No' if the registrant is a well-known seasoned issuer, as defined in Rule 405 of the Securities Act. Is used on Form Type: 10-K, 10-Q, 8-K, 20-F, 6-K, 10-K/A, 10-Q/A, 20-F/A, 6-K/A, N-CSR, N-Q, N-1A. Reference 1: http://www.xbrl.org/2003/role/presentationRef
-Publisher SEC
-Name Securities Act
-Number 230
-Section 405
| Name: |
dei_EntityWellKnownSeasonedIssuer |
| Namespace Prefix: |
dei_ |
| Data Type: |
dei:yesNoItemType |
| Balance Type: |
na |
| Period Type: |
duration |
|
| X |
- ReferencesReference 1: http://www.xbrl.org/2003/role/presentationRef
-Publisher SEC
-Name Form 10-K
-Number 249
-Section 310
Reference 2: http://www.xbrl.org/2003/role/presentationRef
-Publisher SEC
-Name Form 20-F
-Number 249
-Section 220
-Subsection f
Reference 3: http://www.xbrl.org/2003/role/presentationRef
-Publisher SEC
-Name Form 40-F
-Number 249
-Section 240
-Subsection f
| Name: |
dei_IcfrAuditorAttestationFlag |
| Namespace Prefix: |
dei_ |
| Data Type: |
xbrli:booleanItemType |
| Balance Type: |
na |
| Period Type: |
duration |
|
| X |
- DefinitionLocal phone number for entity.
| Name: |
dei_LocalPhoneNumber |
| Namespace Prefix: |
dei_ |
| Data Type: |
xbrli:normalizedStringItemType |
| Balance Type: |
na |
| Period Type: |
duration |
|
| X |
- DefinitionTitle of a 12(b) registered security. Reference 1: http://www.xbrl.org/2003/role/presentationRef
-Publisher SEC
-Name Exchange Act
-Number 240
-Section 12
-Subsection b
| Name: |
dei_Security12bTitle |
| Namespace Prefix: |
dei_ |
| Data Type: |
dei:securityTitleItemType |
| Balance Type: |
na |
| Period Type: |
duration |
|
| X |
- DefinitionName of the Exchange on which a security is registered. Reference 1: http://www.xbrl.org/2003/role/presentationRef
-Publisher SEC
-Name Exchange Act
-Number 240
-Section 12
-Subsection d1-1
| Name: |
dei_SecurityExchangeName |
| Namespace Prefix: |
dei_ |
| Data Type: |
dei:edgarExchangeCodeItemType |
| Balance Type: |
na |
| Period Type: |
duration |
|
| X |
- DefinitionTrading symbol of an instrument as listed on an exchange.
| Name: |
dei_TradingSymbol |
| Namespace Prefix: |
dei_ |
| Data Type: |
dei:tradingSymbolItemType |
| Balance Type: |
na |
| Period Type: |
duration |
|
v3.24.0.1
| X |
- DefinitionPCAOB issued Audit Firm Identifier Reference 1: http://www.xbrl.org/2003/role/presentationRef
-Publisher SEC
-Name Form 10-K
-Number 249
-Section 310
Reference 2: http://www.xbrl.org/2003/role/presentationRef
-Publisher SEC
-Name Form 20-F
-Number 249
-Section 220
-Subsection f
Reference 3: http://www.xbrl.org/2003/role/presentationRef
-Publisher SEC
-Name Form 40-F
-Number 249
-Section 240
-Subsection f
| Name: |
dei_AuditorFirmId |
| Namespace Prefix: |
dei_ |
| Data Type: |
dei:nonemptySequenceNumberItemType |
| Balance Type: |
na |
| Period Type: |
duration |
|
| X |
- ReferencesReference 1: http://www.xbrl.org/2003/role/presentationRef
-Publisher SEC
-Name Form 10-K
-Number 249
-Section 310
Reference 2: http://www.xbrl.org/2003/role/presentationRef
-Publisher SEC
-Name Form 20-F
-Number 249
-Section 220
-Subsection f
Reference 3: http://www.xbrl.org/2003/role/presentationRef
-Publisher SEC
-Name Form 40-F
-Number 249
-Section 240
-Subsection f
| Name: |
dei_AuditorLocation |
| Namespace Prefix: |
dei_ |
| Data Type: |
dei:internationalNameItemType |
| Balance Type: |
na |
| Period Type: |
duration |
|
| X |
- ReferencesReference 1: http://www.xbrl.org/2003/role/presentationRef
-Publisher SEC
-Name Form 10-K
-Number 249
-Section 310
Reference 2: http://www.xbrl.org/2003/role/presentationRef
-Publisher SEC
-Name Form 20-F
-Number 249
-Section 220
-Subsection f
Reference 3: http://www.xbrl.org/2003/role/presentationRef
-Publisher SEC
-Name Form 40-F
-Number 249
-Section 240
-Subsection f
| Name: |
dei_AuditorName |
| Namespace Prefix: |
dei_ |
| Data Type: |
dei:internationalNameItemType |
| Balance Type: |
na |
| Period Type: |
duration |
|
v3.24.0.1
Balance Sheets - USD ($)
$ in Thousands |
Dec. 31, 2023 |
Dec. 31, 2022 |
| Current assets: |
|
|
| Cash and cash equivalents |
$ 560,635
|
$ 730,557
|
| Accounts receivable, net of allowance of $2,455 and $3,800 |
475,291
|
498,762
|
| Inventories, net |
163,679
|
153,187
|
| Income taxes receivable |
4,769
|
15,143
|
| Prepaid expenses and other |
6,201
|
3,992
|
| Total current assets |
1,210,575
|
1,401,641
|
| Property, plant and equipment, net |
756,863
|
616,601
|
| Other assets |
474
|
490
|
| Total assets |
1,967,912
|
2,018,732
|
| Current liabilities: |
|
|
| Trade accounts payable |
80,548
|
62,780
|
| Accrued liabilities |
79,590
|
81,381
|
| Total current liabilities |
160,138
|
144,161
|
| Deferred income taxes and other |
60,197
|
55,905
|
| Commitments and contingencies |
|
|
| Stockholders’ equity: |
|
|
| Preferred stock value |
0
|
0
|
| Common stock value |
273
|
271
|
| Additional paid-in capital |
106,035
|
83,622
|
| Treasury stock, at cost – 11,661,524 and 8,999,732 shares |
(867,222)
|
(402,639)
|
| Retained earnings |
2,508,491
|
2,137,412
|
| Total stockholders’ equity |
1,747,577
|
1,818,666
|
| Total liabilities and stockholders’ equity |
$ 1,967,912
|
$ 2,018,732
|
| X |
- DefinitionCarrying value as of the balance sheet date of obligations incurred (and for which invoices have typically been received) and payable to vendors for goods and services received that are used in an entity's business. Used to reflect the current portion of the liabilities (due within one year or within the normal operating cycle if longer). Reference 1: http://fasb.org/us-gaap/role/ref/legacyRef
-Name Accounting Standards Codification
-Topic 210
-SubTopic 10
-Section S99
-Paragraph 1
-Subparagraph (SX 210.5-02.19(a))
-Publisher FASB
-URI https://asc.fasb.org//1943274/2147480566/210-10-S99-1
Reference 2: http://fasb.org/us-gaap/role/ref/legacyRef
-Name Accounting Standards Codification
-Topic 210
-SubTopic 10
-Section 45
-Paragraph 8
-Publisher FASB
-URI https://asc.fasb.org//1943274/2147483467/210-10-45-8
| Name: |
us-gaap_AccountsPayableTradeCurrent |
| Namespace Prefix: |
us-gaap_ |
| Data Type: |
xbrli:monetaryItemType |
| Balance Type: |
credit |
| Period Type: |
instant |
|
| X |
- DefinitionAmount, after allowance for credit loss, of right to consideration from customer for product sold and service rendered in normal course of business, classified as current. Reference 1: http://www.xbrl.org/2003/role/disclosureRef
-Topic 310
-SubTopic 10
-Name Accounting Standards Codification
-Section 45
-Paragraph 2
-Publisher FASB
-URI https://asc.fasb.org//1943274/2147481990/310-10-45-2
Reference 2: http://www.xbrl.org/2003/role/disclosureRef
-Topic 310
-SubTopic 10
-Name Accounting Standards Codification
-Section 45
-Paragraph 9
-Publisher FASB
-URI https://asc.fasb.org//1943274/2147481990/310-10-45-9
| Name: |
us-gaap_AccountsReceivableNetCurrent |
| Namespace Prefix: |
us-gaap_ |
| Data Type: |
xbrli:monetaryItemType |
| Balance Type: |
debit |
| Period Type: |
instant |
|
| X |
- DefinitionCarrying value as of the balance sheet date of obligations incurred and payable, pertaining to costs that are statutory in nature, are incurred on contractual obligations, or accumulate over time and for which invoices have not yet been received or will not be rendered. Examples include taxes, interest, rent and utilities. Used to reflect the current portion of the liabilities (due within one year or within the normal operating cycle if longer). Reference 1: http://fasb.org/us-gaap/role/ref/legacyRef
-Name Accounting Standards Codification
-Topic 210
-SubTopic 10
-Section S99
-Paragraph 1
-Subparagraph (SX 210.5-02.20)
-Publisher FASB
-URI https://asc.fasb.org//1943274/2147480566/210-10-S99-1
| Name: |
us-gaap_AccruedLiabilitiesCurrent |
| Namespace Prefix: |
us-gaap_ |
| Data Type: |
xbrli:monetaryItemType |
| Balance Type: |
credit |
| Period Type: |
instant |
|
| X |
- DefinitionValue received from shareholders in common stock-related transactions that are in excess of par value or stated value and amounts received from other stock-related transactions. Includes only common stock transactions (excludes preferred stock transactions). May be called contributed capital, capital in excess of par, capital surplus, or paid-in capital. Reference 1: http://fasb.org/us-gaap/role/ref/legacyRef
-Topic 210
-SubTopic 10
-Name Accounting Standards Codification
-Section S99
-Paragraph 1
-Subparagraph (SX 210.5-02(30)(a)(1))
-Publisher FASB
-URI https://asc.fasb.org//1943274/2147480566/210-10-S99-1
| Name: |
us-gaap_AdditionalPaidInCapitalCommonStock |
| Namespace Prefix: |
us-gaap_ |
| Data Type: |
xbrli:monetaryItemType |
| Balance Type: |
credit |
| Period Type: |
instant |
|
| X |
- DefinitionSum of the carrying amounts as of the balance sheet date of all assets that are recognized. Assets are probable future economic benefits obtained or controlled by an entity as a result of past transactions or events. Reference 1: http://www.xbrl.org/2003/role/disclosureRef
-Topic 810
-SubTopic 10
-Name Accounting Standards Codification
-Section 50
-Paragraph 3
-Subparagraph (bb)
-Publisher FASB
-URI https://asc.fasb.org//1943274/2147481203/810-10-50-3
Reference 2: http://www.xbrl.org/2003/role/disclosureRef
-Topic 810
-SubTopic 10
-Name Accounting Standards Codification
-Section 45
-Paragraph 25
-Subparagraph (a)
-Publisher FASB
-URI https://asc.fasb.org//1943274/2147481231/810-10-45-25
Reference 3: http://www.xbrl.org/2003/role/disclosureRef
-Topic 235
-SubTopic 10
-Name Accounting Standards Codification
-Section S99
-Paragraph 1
-Subparagraph (SX 210.4-08(g)(1)(ii))
-Publisher FASB
-URI https://asc.fasb.org//1943274/2147480678/235-10-S99-1
Reference 4: http://www.xbrl.org/2003/role/disclosureRef
-Topic 323
-SubTopic 10
-Name Accounting Standards Codification
-Section 50
-Paragraph 3
-Subparagraph (c)
-Publisher FASB
-URI https://asc.fasb.org//1943274/2147481687/323-10-50-3
Reference 5: http://www.xbrl.org/2003/role/disclosureRef
-Topic 825
-SubTopic 10
-Name Accounting Standards Codification
-Section 50
-Paragraph 28
-Subparagraph (f)
-Publisher FASB
-URI https://asc.fasb.org//1943274/2147482907/825-10-50-28
Reference 6: http://www.xbrl.org/2003/role/exampleRef
-Topic 852
-SubTopic 10
-Name Accounting Standards Codification
-Section 55
-Paragraph 10
-Publisher FASB
-URI https://asc.fasb.org//1943274/2147481372/852-10-55-10
Reference 7: http://www.xbrl.org/2003/role/exampleRef
-Topic 946
-SubTopic 830
-Name Accounting Standards Codification
-Section 55
-Paragraph 12
-Publisher FASB
-URI https://asc.fasb.org//1943274/2147480167/946-830-55-12
Reference 8: http://www.xbrl.org/2003/role/disclosureRef
-Topic 944
-SubTopic 210
-Name Accounting Standards Codification
-Section S99
-Paragraph 1
-Subparagraph (SX 210.7-03(a)(12))
-Publisher FASB
-URI https://asc.fasb.org//1943274/2147479440/944-210-S99-1
Reference 9: http://www.xbrl.org/2003/role/disclosureRef
-Topic 280
-SubTopic 10
-Name Accounting Standards Codification
-Section 50
-Paragraph 22
-Publisher FASB
-URI https://asc.fasb.org//1943274/2147482810/280-10-50-22
Reference 10: http://www.xbrl.org/2003/role/disclosureRef
-Topic 946
-SubTopic 210
-Name Accounting Standards Codification
-Section S99
-Paragraph 1
-Subparagraph (SX 210.6-04(8))
-Publisher FASB
-URI https://asc.fasb.org//1943274/2147479617/946-210-S99-1
Reference 11: http://www.xbrl.org/2003/role/disclosureRef
-Topic 210
-SubTopic 10
-Name Accounting Standards Codification
-Section S99
-Paragraph 1
-Subparagraph (SX 210.5-02(18))
-Publisher FASB
-URI https://asc.fasb.org//1943274/2147480566/210-10-S99-1
Reference 12: http://www.xbrl.org/2003/role/disclosureRef
-Topic 470
-SubTopic 10
-Name Accounting Standards Codification
-Section S99
-Paragraph 1A
-Subparagraph (SX 210.13-01(a)(4)(i))
-Publisher FASB
-URI https://asc.fasb.org//1943274/2147480097/470-10-S99-1A
Reference 13: http://www.xbrl.org/2009/role/commonPracticeRef
-Topic 470
-SubTopic 10
-Name Accounting Standards Codification
-Section S99
-Paragraph 1A
-Subparagraph (SX 210.13-01(a)(4)(ii))
-Publisher FASB
-URI https://asc.fasb.org//1943274/2147480097/470-10-S99-1A
Reference 14: http://www.xbrl.org/2009/role/commonPracticeRef
-Topic 470
-SubTopic 10
-Name Accounting Standards Codification
-Section S99
-Paragraph 1A
-Subparagraph (SX 210.13-01(a)(4)(iii))
-Publisher FASB
-URI https://asc.fasb.org//1943274/2147480097/470-10-S99-1A
Reference 15: http://www.xbrl.org/2003/role/disclosureRef
-Topic 470
-SubTopic 10
-Name Accounting Standards Codification
-Section S99
-Paragraph 1A
-Subparagraph (SX 210.13-01(a)(4)(iii)(A))
-Publisher FASB
-URI https://asc.fasb.org//1943274/2147480097/470-10-S99-1A
Reference 16: http://www.xbrl.org/2003/role/disclosureRef
-Topic 470
-SubTopic 10
-Name Accounting Standards Codification
-Section S99
-Paragraph 1A
-Subparagraph (SX 210.13-01(a)(4)(iv))
-Publisher FASB
-URI https://asc.fasb.org//1943274/2147480097/470-10-S99-1A
Reference 17: http://www.xbrl.org/2003/role/disclosureRef
-Topic 470
-SubTopic 10
-Name Accounting Standards Codification
-Section S99
-Paragraph 1A
-Subparagraph (SX 210.13-01(a)(5))
-Publisher FASB
-URI https://asc.fasb.org//1943274/2147480097/470-10-S99-1A
Reference 18: http://www.xbrl.org/2003/role/disclosureRef
-Topic 470
-SubTopic 10
-Name Accounting Standards Codification
-Section S99
-Paragraph 1B
-Subparagraph (SX 210.13-02(a)(4)(i))
-Publisher FASB
-URI https://asc.fasb.org//1943274/2147480097/470-10-S99-1B
Reference 19: http://www.xbrl.org/2003/role/disclosureRef
-Topic 470
-SubTopic 10
-Name Accounting Standards Codification
-Section S99
-Paragraph 1B
-Subparagraph (SX 210.13-02(a)(4)(iii)(A))
-Publisher FASB
-URI https://asc.fasb.org//1943274/2147480097/470-10-S99-1B
Reference 20: http://www.xbrl.org/2003/role/disclosureRef
-Topic 470
-SubTopic 10
-Name Accounting Standards Codification
-Section S99
-Paragraph 1B
-Subparagraph (SX 210.13-02(a)(4)(iii)(B))
-Publisher FASB
-URI https://asc.fasb.org//1943274/2147480097/470-10-S99-1B
Reference 21: http://www.xbrl.org/2003/role/disclosureRef
-Topic 470
-SubTopic 10
-Name Accounting Standards Codification
-Section S99
-Paragraph 1B
-Subparagraph (SX 210.13-02(a)(4)(iv))
-Publisher FASB
-URI https://asc.fasb.org//1943274/2147480097/470-10-S99-1B
Reference 22: http://www.xbrl.org/2003/role/disclosureRef
-Topic 470
-SubTopic 10
-Name Accounting Standards Codification
-Section S99
-Paragraph 1B
-Subparagraph (SX 210.13-02(a)(5))
-Publisher FASB
-URI https://asc.fasb.org//1943274/2147480097/470-10-S99-1B
Reference 23: http://www.xbrl.org/2009/role/commonPracticeRef
-Topic 852
-SubTopic 10
-Name Accounting Standards Codification
-Section 50
-Paragraph 7
-Subparagraph (a)
-Publisher FASB
-URI https://asc.fasb.org//1943274/2147481404/852-10-50-7
Reference 24: http://www.xbrl.org/2003/role/disclosureRef
-Topic 280
-SubTopic 10
-Name Accounting Standards Codification
-Section 50
-Paragraph 30
-Subparagraph (c)
-Publisher FASB
-URI https://asc.fasb.org//1943274/2147482810/280-10-50-30
Reference 25: http://www.xbrl.org/2003/role/disclosureRef
-Topic 280
-SubTopic 10
-Name Accounting Standards Codification
-Section 50
-Paragraph 32
-Subparagraph (d)
-Publisher FASB
-URI https://asc.fasb.org//1943274/2147482810/280-10-50-32
Reference 26: http://fasb.org/us-gaap/role/ref/legacyRef
-Topic 942
-SubTopic 210
-Name Accounting Standards Codification
-Section S99
-Paragraph 1
-Subparagraph (SX 210.9-03(11))
-Publisher FASB
-URI https://asc.fasb.org//1943274/2147479853/942-210-S99-1
| Name: |
us-gaap_Assets |
| Namespace Prefix: |
us-gaap_ |
| Data Type: |
xbrli:monetaryItemType |
| Balance Type: |
debit |
| Period Type: |
instant |
|
| X |
- DefinitionSum of the carrying amounts as of the balance sheet date of all assets that are expected to be realized in cash, sold, or consumed within one year (or the normal operating cycle, if longer). Assets are probable future economic benefits obtained or controlled by an entity as a result of past transactions or events. Reference 1: http://www.xbrl.org/2003/role/disclosureRef
-Topic 810
-SubTopic 10
-Name Accounting Standards Codification
-Section 50
-Paragraph 3
-Subparagraph (bb)
-Publisher FASB
-URI https://asc.fasb.org//1943274/2147481203/810-10-50-3
Reference 2: http://www.xbrl.org/2003/role/disclosureRef
-Topic 810
-SubTopic 10
-Name Accounting Standards Codification
-Section 45
-Paragraph 25
-Subparagraph (a)
-Publisher FASB
-URI https://asc.fasb.org//1943274/2147481231/810-10-45-25
Reference 3: http://www.xbrl.org/2003/role/disclosureRef
-Topic 235
-SubTopic 10
-Name Accounting Standards Codification
-Section S99
-Paragraph 1
-Subparagraph (SX 210.4-08(g)(1)(ii))
-Publisher FASB
-URI https://asc.fasb.org//1943274/2147480678/235-10-S99-1
Reference 4: http://www.xbrl.org/2003/role/disclosureRef
-Topic 323
-SubTopic 10
-Name Accounting Standards Codification
-Section 50
-Paragraph 3
-Subparagraph (c)
-Publisher FASB
-URI https://asc.fasb.org//1943274/2147481687/323-10-50-3
Reference 5: http://www.xbrl.org/2003/role/disclosureRef
-Topic 825
-SubTopic 10
-Name Accounting Standards Codification
-Section 50
-Paragraph 28
-Subparagraph (f)
-Publisher FASB
-URI https://asc.fasb.org//1943274/2147482907/825-10-50-28
Reference 6: http://www.xbrl.org/2003/role/exampleRef
-Topic 852
-SubTopic 10
-Name Accounting Standards Codification
-Section 55
-Paragraph 10
-Publisher FASB
-URI https://asc.fasb.org//1943274/2147481372/852-10-55-10
Reference 7: http://www.xbrl.org/2003/role/disclosureRef
-Topic 210
-SubTopic 10
-Name Accounting Standards Codification
-Section 45
-Paragraph 1
-Publisher FASB
-URI https://asc.fasb.org//1943274/2147483467/210-10-45-1
Reference 8: http://www.xbrl.org/2003/role/disclosureRef
-Topic 210
-SubTopic 10
-Name Accounting Standards Codification
-Section S99
-Paragraph 1
-Subparagraph (SX 210.5-02(9))
-Publisher FASB
-URI https://asc.fasb.org//1943274/2147480566/210-10-S99-1
Reference 9: http://www.xbrl.org/2003/role/disclosureRef
-Topic 470
-SubTopic 10
-Name Accounting Standards Codification
-Section S99
-Paragraph 1A
-Subparagraph (SX 210.13-01(a)(4)(i))
-Publisher FASB
-URI https://asc.fasb.org//1943274/2147480097/470-10-S99-1A
Reference 10: http://www.xbrl.org/2009/role/commonPracticeRef
-Topic 470
-SubTopic 10
-Name Accounting Standards Codification
-Section S99
-Paragraph 1A
-Subparagraph (SX 210.13-01(a)(4)(ii))
-Publisher FASB
-URI https://asc.fasb.org//1943274/2147480097/470-10-S99-1A
Reference 11: http://www.xbrl.org/2009/role/commonPracticeRef
-Topic 470
-SubTopic 10
-Name Accounting Standards Codification
-Section S99
-Paragraph 1A
-Subparagraph (SX 210.13-01(a)(4)(iii))
-Publisher FASB
-URI https://asc.fasb.org//1943274/2147480097/470-10-S99-1A
Reference 12: http://www.xbrl.org/2003/role/disclosureRef
-Topic 470
-SubTopic 10
-Name Accounting Standards Codification
-Section S99
-Paragraph 1A
-Subparagraph (SX 210.13-01(a)(4)(iii)(A))
-Publisher FASB
-URI https://asc.fasb.org//1943274/2147480097/470-10-S99-1A
Reference 13: http://www.xbrl.org/2003/role/disclosureRef
-Topic 470
-SubTopic 10
-Name Accounting Standards Codification
-Section S99
-Paragraph 1A
-Subparagraph (SX 210.13-01(a)(4)(iv))
-Publisher FASB
-URI https://asc.fasb.org//1943274/2147480097/470-10-S99-1A
Reference 14: http://www.xbrl.org/2003/role/disclosureRef
-Topic 470
-SubTopic 10
-Name Accounting Standards Codification
-Section S99
-Paragraph 1A
-Subparagraph (SX 210.13-01(a)(5))
-Publisher FASB
-URI https://asc.fasb.org//1943274/2147480097/470-10-S99-1A
Reference 15: http://www.xbrl.org/2003/role/disclosureRef
-Topic 470
-SubTopic 10
-Name Accounting Standards Codification
-Section S99
-Paragraph 1B
-Subparagraph (SX 210.13-02(a)(4)(i))
-Publisher FASB
-URI https://asc.fasb.org//1943274/2147480097/470-10-S99-1B
Reference 16: http://www.xbrl.org/2003/role/disclosureRef
-Topic 470
-SubTopic 10
-Name Accounting Standards Codification
-Section S99
-Paragraph 1B
-Subparagraph (SX 210.13-02(a)(4)(iii)(A))
-Publisher FASB
-URI https://asc.fasb.org//1943274/2147480097/470-10-S99-1B
Reference 17: http://www.xbrl.org/2003/role/disclosureRef
-Topic 470
-SubTopic 10
-Name Accounting Standards Codification
-Section S99
-Paragraph 1B
-Subparagraph (SX 210.13-02(a)(4)(iii)(B))
-Publisher FASB
-URI https://asc.fasb.org//1943274/2147480097/470-10-S99-1B
Reference 18: http://www.xbrl.org/2003/role/disclosureRef
-Topic 470
-SubTopic 10
-Name Accounting Standards Codification
-Section S99
-Paragraph 1B
-Subparagraph (SX 210.13-02(a)(4)(iv))
-Publisher FASB
-URI https://asc.fasb.org//1943274/2147480097/470-10-S99-1B
Reference 19: http://www.xbrl.org/2003/role/disclosureRef
-Topic 470
-SubTopic 10
-Name Accounting Standards Codification
-Section S99
-Paragraph 1B
-Subparagraph (SX 210.13-02(a)(5))
-Publisher FASB
-URI https://asc.fasb.org//1943274/2147480097/470-10-S99-1B
Reference 20: http://www.xbrl.org/2009/role/commonPracticeRef
-Topic 852
-SubTopic 10
-Name Accounting Standards Codification
-Section 50
-Paragraph 7
-Subparagraph (a)
-Publisher FASB
-URI https://asc.fasb.org//1943274/2147481404/852-10-50-7
| Name: |
us-gaap_AssetsCurrent |
| Namespace Prefix: |
us-gaap_ |
| Data Type: |
xbrli:monetaryItemType |
| Balance Type: |
debit |
| Period Type: |
instant |
|
| X |
- References
+ Details
| Name: |
us-gaap_AssetsCurrentAbstract |
| Namespace Prefix: |
us-gaap_ |
| Data Type: |
xbrli:stringItemType |
| Balance Type: |
na |
| Period Type: |
duration |
|
| X |
- DefinitionAmount of currency on hand as well as demand deposits with banks or financial institutions. Includes other kinds of accounts that have the general characteristics of demand deposits. Also includes short-term, highly liquid investments that are both readily convertible to known amounts of cash and so near their maturity that they present insignificant risk of changes in value because of changes in interest rates. Excludes cash and cash equivalents within disposal group and discontinued operation. Reference 1: http://www.xbrl.org/2003/role/disclosureRef
-Topic 210
-SubTopic 10
-Name Accounting Standards Codification
-Section S99
-Paragraph 1
-Subparagraph (SX 210.5-02(1))
-Publisher FASB
-URI https://asc.fasb.org//1943274/2147480566/210-10-S99-1
Reference 2: http://www.xbrl.org/2003/role/exampleRef
-Topic 210
-SubTopic 10
-Name Accounting Standards Codification
-Section 45
-Paragraph 1
-Subparagraph (a)
-Publisher FASB
-URI https://asc.fasb.org//1943274/2147483467/210-10-45-1
Reference 3: http://fasb.org/us-gaap/role/ref/legacyRef
-Name Accounting Standards Codification
-Topic 230
-SubTopic 10
-Section 45
-Paragraph 4
-Publisher FASB
-URI https://asc.fasb.org//1943274/2147482740/230-10-45-4
| Name: |
us-gaap_CashAndCashEquivalentsAtCarryingValue |
| Namespace Prefix: |
us-gaap_ |
| Data Type: |
xbrli:monetaryItemType |
| Balance Type: |
debit |
| Period Type: |
instant |
|
| X |
- DefinitionRepresents the caption on the face of the balance sheet to indicate that the entity has entered into (1) purchase or supply arrangements that will require expending a portion of its resources to meet the terms thereof, and (2) is exposed to potential losses or, less frequently, gains, arising from (a) possible claims against a company's resources due to future performance under contract terms, and (b) possible losses or likely gains from uncertainties that will ultimately be resolved when one or more future events that are deemed likely to occur do occur or fail to occur. Reference 1: http://www.xbrl.org/2003/role/disclosureRef
-Topic 944
-SubTopic 210
-Name Accounting Standards Codification
-Section S99
-Paragraph 1
-Subparagraph (SX 210.7-03(a)(19))
-Publisher FASB
-URI https://asc.fasb.org//1943274/2147479440/944-210-S99-1
Reference 2: http://www.xbrl.org/2003/role/disclosureRef
-Topic 946
-SubTopic 210
-Name Accounting Standards Codification
-Section S99
-Paragraph 1
-Subparagraph (SX 210.6-04(15))
-Publisher FASB
-URI https://asc.fasb.org//1943274/2147479617/946-210-S99-1
Reference 3: http://fasb.org/us-gaap/role/ref/legacyRef
-Name Accounting Standards Codification
-Topic 942
-SubTopic 210
-Section S99
-Paragraph 1
-Subparagraph (SX 210.9-03.17)
-Publisher FASB
-URI https://asc.fasb.org//1943274/2147479853/942-210-S99-1
Reference 4: http://fasb.org/us-gaap/role/ref/legacyRef
-Name Accounting Standards Codification
-Topic 210
-SubTopic 10
-Section S99
-Paragraph 1
-Subparagraph (SX 210.5-02.25)
-Publisher FASB
-URI https://asc.fasb.org//1943274/2147480566/210-10-S99-1
| Name: |
us-gaap_CommitmentsAndContingencies |
| Namespace Prefix: |
us-gaap_ |
| Data Type: |
xbrli:monetaryItemType |
| Balance Type: |
credit |
| Period Type: |
instant |
|
| X |
- DefinitionAggregate par or stated value of issued nonredeemable common stock (or common stock redeemable solely at the option of the issuer). This item includes treasury stock repurchased by the entity. Note: elements for number of nonredeemable common shares, par value and other disclosure concepts are in another section within stockholders' equity. Reference 1: http://www.xbrl.org/2003/role/exampleRef
-Topic 852
-SubTopic 10
-Name Accounting Standards Codification
-Section 55
-Paragraph 10
-Publisher FASB
-URI https://asc.fasb.org//1943274/2147481372/852-10-55-10
Reference 2: http://www.xbrl.org/2003/role/disclosureRef
-Topic 944
-SubTopic 210
-Name Accounting Standards Codification
-Section S99
-Paragraph 1
-Subparagraph (SX 210.7-03(a)(22))
-Publisher FASB
-URI https://asc.fasb.org//1943274/2147479440/944-210-S99-1
Reference 3: http://fasb.org/us-gaap/role/ref/legacyRef
-Topic 210
-SubTopic 10
-Name Accounting Standards Codification
-Section S99
-Paragraph 1
-Subparagraph (SX 210.5-02(29))
-Publisher FASB
-URI https://asc.fasb.org//1943274/2147480566/210-10-S99-1
| Name: |
us-gaap_CommonStockValue |
| Namespace Prefix: |
us-gaap_ |
| Data Type: |
xbrli:monetaryItemType |
| Balance Type: |
credit |
| Period Type: |
instant |
|
| X |
- DefinitionAmount after valuation and LIFO reserves of inventory expected to be sold, or consumed within one year or operating cycle, if longer. Reference 1: http://www.xbrl.org/2003/role/exampleRef
-Topic 852
-SubTopic 10
-Name Accounting Standards Codification
-Section 55
-Paragraph 10
-Publisher FASB
-URI https://asc.fasb.org//1943274/2147481372/852-10-55-10
Reference 2: http://www.xbrl.org/2003/role/exampleRef
-Topic 210
-SubTopic 10
-Name Accounting Standards Codification
-Section 45
-Paragraph 1
-Subparagraph (b)
-Publisher FASB
-URI https://asc.fasb.org//1943274/2147483467/210-10-45-1
Reference 3: http://www.xbrl.org/2003/role/disclosureRef
-Topic 210
-SubTopic 10
-Name Accounting Standards Codification
-Section S99
-Paragraph 1
-Subparagraph (SX 210.5-02(6))
-Publisher FASB
-URI https://asc.fasb.org//1943274/2147480566/210-10-S99-1
| Name: |
us-gaap_InventoryNet |
| Namespace Prefix: |
us-gaap_ |
| Data Type: |
xbrli:monetaryItemType |
| Balance Type: |
debit |
| Period Type: |
instant |
|
| X |
- DefinitionAmount of liabilities and equity items, including the portion of equity attributable to noncontrolling interests, if any. Reference 1: http://www.xbrl.org/2003/role/exampleRef
-Topic 852
-SubTopic 10
-Name Accounting Standards Codification
-Section 55
-Paragraph 10
-Publisher FASB
-URI https://asc.fasb.org//1943274/2147481372/852-10-55-10
Reference 2: http://www.xbrl.org/2003/role/disclosureRef
-Topic 944
-SubTopic 210
-Name Accounting Standards Codification
-Section S99
-Paragraph 1
-Subparagraph (SX 210.7-03(a)(25))
-Publisher FASB
-URI https://asc.fasb.org//1943274/2147479440/944-210-S99-1
Reference 3: http://www.xbrl.org/2009/role/commonPracticeRef
-Topic 235
-SubTopic 10
-Name Accounting Standards Codification
-Section S99
-Paragraph 1
-Subparagraph (SX 210.4-08(g)(1)(ii))
-Publisher FASB
-URI https://asc.fasb.org//1943274/2147480678/235-10-S99-1
Reference 4: http://www.xbrl.org/2009/role/commonPracticeRef
-Topic 323
-SubTopic 10
-Name Accounting Standards Codification
-Section 50
-Paragraph 3
-Subparagraph (c)
-Publisher FASB
-URI https://asc.fasb.org//1943274/2147481687/323-10-50-3
Reference 5: http://www.xbrl.org/2009/role/commonPracticeRef
-Topic 825
-SubTopic 10
-Name Accounting Standards Codification
-Section 50
-Paragraph 28
-Subparagraph (f)
-Publisher FASB
-URI https://asc.fasb.org//1943274/2147482907/825-10-50-28
Reference 6: http://fasb.org/us-gaap/role/ref/legacyRef
-Topic 942
-SubTopic 210
-Name Accounting Standards Codification
-Section S99
-Paragraph 1
-Subparagraph (SX 210.9-03(23))
-Publisher FASB
-URI https://asc.fasb.org//1943274/2147479853/942-210-S99-1
Reference 7: http://fasb.org/us-gaap/role/ref/legacyRef
-Topic 210
-SubTopic 10
-Name Accounting Standards Codification
-Section S99
-Paragraph 1
-Subparagraph (SX 210.5-02(32))
-Publisher FASB
-URI https://asc.fasb.org//1943274/2147480566/210-10-S99-1
| Name: |
us-gaap_LiabilitiesAndStockholdersEquity |
| Namespace Prefix: |
us-gaap_ |
| Data Type: |
xbrli:monetaryItemType |
| Balance Type: |
credit |
| Period Type: |
instant |
|
| X |
- DefinitionTotal obligations incurred as part of normal operations that are expected to be paid during the following twelve months or within one business cycle, if longer. Reference 1: http://www.xbrl.org/2003/role/disclosureRef
-Topic 810
-SubTopic 10
-Name Accounting Standards Codification
-Section 50
-Paragraph 3
-Subparagraph (c)
-Publisher FASB
-URI https://asc.fasb.org//1943274/2147481203/810-10-50-3
Reference 2: http://www.xbrl.org/2003/role/disclosureRef
-Topic 810
-SubTopic 10
-Name Accounting Standards Codification
-Section 45
-Paragraph 25
-Subparagraph (b)
-Publisher FASB
-URI https://asc.fasb.org//1943274/2147481231/810-10-45-25
Reference 3: http://www.xbrl.org/2003/role/disclosureRef
-Topic 810
-SubTopic 10
-Name Accounting Standards Codification
-Section 50
-Paragraph 3
-Subparagraph (bb)
-Publisher FASB
-URI https://asc.fasb.org//1943274/2147481203/810-10-50-3
Reference 4: http://www.xbrl.org/2003/role/disclosureRef
-Topic 235
-SubTopic 10
-Name Accounting Standards Codification
-Section S99
-Paragraph 1
-Subparagraph (SX 210.4-08(g)(1)(ii))
-Publisher FASB
-URI https://asc.fasb.org//1943274/2147480678/235-10-S99-1
Reference 5: http://www.xbrl.org/2003/role/disclosureRef
-Topic 323
-SubTopic 10
-Name Accounting Standards Codification
-Section 50
-Paragraph 3
-Subparagraph (c)
-Publisher FASB
-URI https://asc.fasb.org//1943274/2147481687/323-10-50-3
Reference 6: http://www.xbrl.org/2003/role/disclosureRef
-Topic 825
-SubTopic 10
-Name Accounting Standards Codification
-Section 50
-Paragraph 28
-Subparagraph (f)
-Publisher FASB
-URI https://asc.fasb.org//1943274/2147482907/825-10-50-28
Reference 7: http://www.xbrl.org/2003/role/exampleRef
-Topic 852
-SubTopic 10
-Name Accounting Standards Codification
-Section 55
-Paragraph 10
-Publisher FASB
-URI https://asc.fasb.org//1943274/2147481372/852-10-55-10
Reference 8: http://www.xbrl.org/2003/role/disclosureRef
-Topic 210
-SubTopic 10
-Name Accounting Standards Codification
-Section 45
-Paragraph 5
-Publisher FASB
-URI https://asc.fasb.org//1943274/2147483467/210-10-45-5
Reference 9: http://www.xbrl.org/2003/role/disclosureRef
-Topic 470
-SubTopic 10
-Name Accounting Standards Codification
-Section S99
-Paragraph 1A
-Subparagraph (SX 210.13-01(a)(4)(i))
-Publisher FASB
-URI https://asc.fasb.org//1943274/2147480097/470-10-S99-1A
Reference 10: http://www.xbrl.org/2009/role/commonPracticeRef
-Topic 470
-SubTopic 10
-Name Accounting Standards Codification
-Section S99
-Paragraph 1A
-Subparagraph (SX 210.13-01(a)(4)(ii))
-Publisher FASB
-URI https://asc.fasb.org//1943274/2147480097/470-10-S99-1A
Reference 11: http://www.xbrl.org/2003/role/disclosureRef
-Topic 470
-SubTopic 10
-Name Accounting Standards Codification
-Section S99
-Paragraph 1A
-Subparagraph (SX 210.13-01(a)(4)(iii)(A))
-Publisher FASB
-URI https://asc.fasb.org//1943274/2147480097/470-10-S99-1A
Reference 12: http://www.xbrl.org/2003/role/disclosureRef
-Topic 470
-SubTopic 10
-Name Accounting Standards Codification
-Section S99
-Paragraph 1A
-Subparagraph (SX 210.13-01(a)(4)(iv))
-Publisher FASB
-URI https://asc.fasb.org//1943274/2147480097/470-10-S99-1A
Reference 13: http://www.xbrl.org/2003/role/disclosureRef
-Topic 470
-SubTopic 10
-Name Accounting Standards Codification
-Section S99
-Paragraph 1A
-Subparagraph (SX 210.13-01(a)(5))
-Publisher FASB
-URI https://asc.fasb.org//1943274/2147480097/470-10-S99-1A
Reference 14: http://www.xbrl.org/2003/role/disclosureRef
-Topic 470
-SubTopic 10
-Name Accounting Standards Codification
-Section S99
-Paragraph 1B
-Subparagraph (SX 210.13-02(a)(4)(i))
-Publisher FASB
-URI https://asc.fasb.org//1943274/2147480097/470-10-S99-1B
Reference 15: http://www.xbrl.org/2003/role/disclosureRef
-Topic 470
-SubTopic 10
-Name Accounting Standards Codification
-Section S99
-Paragraph 1B
-Subparagraph (SX 210.13-02(a)(4)(iii)(A))
-Publisher FASB
-URI https://asc.fasb.org//1943274/2147480097/470-10-S99-1B
Reference 16: http://www.xbrl.org/2003/role/disclosureRef
-Topic 470
-SubTopic 10
-Name Accounting Standards Codification
-Section S99
-Paragraph 1B
-Subparagraph (SX 210.13-02(a)(4)(iii)(B))
-Publisher FASB
-URI https://asc.fasb.org//1943274/2147480097/470-10-S99-1B
Reference 17: http://www.xbrl.org/2003/role/disclosureRef
-Topic 470
-SubTopic 10
-Name Accounting Standards Codification
-Section S99
-Paragraph 1B
-Subparagraph (SX 210.13-02(a)(4)(iv))
-Publisher FASB
-URI https://asc.fasb.org//1943274/2147480097/470-10-S99-1B
Reference 18: http://www.xbrl.org/2003/role/disclosureRef
-Topic 470
-SubTopic 10
-Name Accounting Standards Codification
-Section S99
-Paragraph 1B
-Subparagraph (SX 210.13-02(a)(5))
-Publisher FASB
-URI https://asc.fasb.org//1943274/2147480097/470-10-S99-1B
Reference 19: http://www.xbrl.org/2009/role/commonPracticeRef
-Topic 852
-SubTopic 10
-Name Accounting Standards Codification
-Section 50
-Paragraph 7
-Subparagraph (a)
-Publisher FASB
-URI https://asc.fasb.org//1943274/2147481404/852-10-50-7
Reference 20: http://www.xbrl.org/2009/role/commonPracticeRef
-Topic 852
-SubTopic 10
-Name Accounting Standards Codification
-Section 50
-Paragraph 7
-Subparagraph (b)
-Publisher FASB
-URI https://asc.fasb.org//1943274/2147481404/852-10-50-7
Reference 21: http://fasb.org/us-gaap/role/ref/legacyRef
-Name Accounting Standards Codification
-Topic 210
-SubTopic 10
-Section S99
-Paragraph 1
-Subparagraph (SX 210.5-02.21)
-Publisher FASB
-URI https://asc.fasb.org//1943274/2147480566/210-10-S99-1
| Name: |
us-gaap_LiabilitiesCurrent |
| Namespace Prefix: |
us-gaap_ |
| Data Type: |
xbrli:monetaryItemType |
| Balance Type: |
credit |
| Period Type: |
instant |
|
| X |
- References
+ Details
| Name: |
us-gaap_LiabilitiesCurrentAbstract |
| Namespace Prefix: |
us-gaap_ |
| Data Type: |
xbrli:stringItemType |
| Balance Type: |
na |
| Period Type: |
duration |
|
| X |
- DefinitionAmount of noncurrent assets classified as other. Reference 1: http://www.xbrl.org/2003/role/disclosureRef
-Topic 210
-SubTopic 10
-Name Accounting Standards Codification
-Section S99
-Paragraph 1
-Subparagraph (SX 210.5-02(17))
-Publisher FASB
-URI https://asc.fasb.org//1943274/2147480566/210-10-S99-1
| Name: |
us-gaap_OtherAssetsNoncurrent |
| Namespace Prefix: |
us-gaap_ |
| Data Type: |
xbrli:monetaryItemType |
| Balance Type: |
debit |
| Period Type: |
instant |
|
| X |
- DefinitionAggregate par or stated value of issued nonredeemable preferred stock (or preferred stock redeemable solely at the option of the issuer). This item includes treasury stock repurchased by the entity. Note: elements for number of nonredeemable preferred shares, par value and other disclosure concepts are in another section within stockholders' equity. Reference 1: http://www.xbrl.org/2003/role/exampleRef
-Topic 852
-SubTopic 10
-Name Accounting Standards Codification
-Section 55
-Paragraph 10
-Publisher FASB
-URI https://asc.fasb.org//1943274/2147481372/852-10-55-10
Reference 2: http://www.xbrl.org/2003/role/disclosureRef
-Topic 944
-SubTopic 210
-Name Accounting Standards Codification
-Section S99
-Paragraph 1
-Subparagraph (SX 210.7-03(a)(21))
-Publisher FASB
-URI https://asc.fasb.org//1943274/2147479440/944-210-S99-1
Reference 3: http://fasb.org/us-gaap/role/ref/legacyRef
-Topic 210
-SubTopic 10
-Name Accounting Standards Codification
-Section S99
-Paragraph 1
-Subparagraph (SX 210.5-02(28))
-Publisher FASB
-URI https://asc.fasb.org//1943274/2147480566/210-10-S99-1
| Name: |
us-gaap_PreferredStockValue |
| Namespace Prefix: |
us-gaap_ |
| Data Type: |
xbrli:monetaryItemType |
| Balance Type: |
credit |
| Period Type: |
instant |
|
| X |
- DefinitionAmount of asset related to consideration paid in advance for costs that provide economic benefits in future periods, and amount of other assets that are expected to be realized or consumed within one year or the normal operating cycle, if longer. Reference 1: http://www.xbrl.org/2009/role/commonPracticeRef
-Topic 210
-SubTopic 10
-Name Accounting Standards Codification
-Section S99
-Paragraph 1
-Subparagraph (SX 210.5-02(9))
-Publisher FASB
-URI https://asc.fasb.org//1943274/2147480566/210-10-S99-1
| Name: |
us-gaap_PrepaidExpenseAndOtherAssetsCurrent |
| Namespace Prefix: |
us-gaap_ |
| Data Type: |
xbrli:monetaryItemType |
| Balance Type: |
debit |
| Period Type: |
instant |
|
| X |
- DefinitionAmount after accumulated depreciation, depletion and amortization of physical assets used in the normal conduct of business to produce goods and services and not intended for resale. Examples include, but are not limited to, land, buildings, machinery and equipment, office equipment, and furniture and fixtures. Reference 1: http://fasb.org/us-gaap/role/ref/legacyRef
-Name Accounting Standards Codification
-Section 50
-Paragraph 1
-SubTopic 10
-Topic 360
-Publisher FASB
-URI https://asc.fasb.org//1943274/2147482099/360-10-50-1
Reference 2: http://www.xbrl.org/2003/role/exampleRef
-Topic 852
-SubTopic 10
-Name Accounting Standards Codification
-Section 55
-Paragraph 10
-Publisher FASB
-URI https://asc.fasb.org//1943274/2147481372/852-10-55-10
Reference 3: http://www.xbrl.org/2003/role/disclosureRef
-Topic 944
-SubTopic 210
-Name Accounting Standards Codification
-Section S99
-Paragraph 1
-Subparagraph (SX 210.7-03(a)(8))
-Publisher FASB
-URI https://asc.fasb.org//1943274/2147479440/944-210-S99-1
Reference 4: http://www.xbrl.org/2003/role/disclosureRef
-Topic 942
-SubTopic 360
-Name Accounting Standards Codification
-Section 50
-Paragraph 1
-Publisher FASB
-URI https://asc.fasb.org//1943274/2147480842/942-360-50-1
| Name: |
us-gaap_PropertyPlantAndEquipmentNet |
| Namespace Prefix: |
us-gaap_ |
| Data Type: |
xbrli:monetaryItemType |
| Balance Type: |
debit |
| Period Type: |
instant |
|
| X |
- DefinitionAmount of accumulated undistributed earnings (deficit). Reference 1: http://www.xbrl.org/2003/role/exampleRef
-Topic 852
-SubTopic 10
-Name Accounting Standards Codification
-Section 55
-Paragraph 10
-Publisher FASB
-URI https://asc.fasb.org//1943274/2147481372/852-10-55-10
Reference 2: http://www.xbrl.org/2003/role/disclosureRef
-Topic 944
-SubTopic 40
-Name Accounting Standards Codification
-Section 65
-Paragraph 2
-Subparagraph (g)(2)(i)
-Publisher FASB
-URI https://asc.fasb.org//1943274/2147480016/944-40-65-2
Reference 3: http://www.xbrl.org/2003/role/disclosureRef
-Topic 944
-SubTopic 40
-Name Accounting Standards Codification
-Section 65
-Paragraph 2
-Subparagraph (h)(2)
-Publisher FASB
-URI https://asc.fasb.org//1943274/2147480016/944-40-65-2
Reference 4: http://www.xbrl.org/2003/role/disclosureRef
-Topic 946
-SubTopic 20
-Name Accounting Standards Codification
-Section 50
-Paragraph 11
-Publisher FASB
-URI https://asc.fasb.org//1943274/2147480990/946-20-50-11
Reference 5: http://www.xbrl.org/2003/role/disclosureRef
-Topic 944
-SubTopic 210
-Name Accounting Standards Codification
-Section S99
-Paragraph 1
-Subparagraph (SX 210.7-03(a)(23)(a)(4))
-Publisher FASB
-URI https://asc.fasb.org//1943274/2147479440/944-210-S99-1
Reference 6: http://www.xbrl.org/2003/role/disclosureRef
-Topic 946
-SubTopic 210
-Name Accounting Standards Codification
-Section S99
-Paragraph 1
-Subparagraph (SX 210.6-04(17))
-Publisher FASB
-URI https://asc.fasb.org//1943274/2147479617/946-210-S99-1
Reference 7: http://fasb.org/us-gaap/role/ref/legacyRef
-Topic 505
-SubTopic 10
-Name Accounting Standards Codification
-Section S99
-Paragraph 1
-Subparagraph (SX 210.3-04)
-Publisher FASB
-URI https://asc.fasb.org//1943274/2147480008/505-10-S99-1
Reference 8: http://fasb.org/us-gaap/role/ref/legacyRef
-Topic 210
-SubTopic 10
-Name Accounting Standards Codification
-Section S99
-Paragraph 1
-Subparagraph (SX 210.5-02(30)(a)(3))
-Publisher FASB
-URI https://asc.fasb.org//1943274/2147480566/210-10-S99-1
| Name: |
us-gaap_RetainedEarningsAccumulatedDeficit |
| Namespace Prefix: |
us-gaap_ |
| Data Type: |
xbrli:monetaryItemType |
| Balance Type: |
credit |
| Period Type: |
instant |
|
| X |
- DefinitionAmount of equity (deficit) attributable to parent. Excludes temporary equity and equity attributable to noncontrolling interest. Reference 1: http://www.xbrl.org/2003/role/exampleRef
-Topic 852
-SubTopic 10
-Name Accounting Standards Codification
-Section 55
-Paragraph 10
-Publisher FASB
-URI https://asc.fasb.org//1943274/2147481372/852-10-55-10
Reference 2: http://www.xbrl.org/2003/role/exampleRef
-Topic 946
-SubTopic 830
-Name Accounting Standards Codification
-Section 55
-Paragraph 12
-Publisher FASB
-URI https://asc.fasb.org//1943274/2147480167/946-830-55-12
Reference 3: http://www.xbrl.org/2003/role/disclosureRef
-Topic 946
-SubTopic 210
-Name Accounting Standards Codification
-Section S99
-Paragraph 1
-Subparagraph (SX 210.6-04(19))
-Publisher FASB
-URI https://asc.fasb.org//1943274/2147479617/946-210-S99-1
Reference 4: http://www.xbrl.org/2003/role/disclosureRef
-Topic 946
-SubTopic 210
-Name Accounting Standards Codification
-Section S99
-Paragraph 2
-Subparagraph (SX 210.6-05(4))
-Publisher FASB
-URI https://asc.fasb.org//1943274/2147479617/946-210-S99-2
Reference 5: http://www.xbrl.org/2009/role/commonPracticeRef
-Topic 946
-SubTopic 220
-Name Accounting Standards Codification
-Section S99
-Paragraph 3
-Subparagraph (SX 210.6-09(4)(b))
-Publisher FASB
-URI https://asc.fasb.org//1943274/2147483575/946-220-S99-3
Reference 6: http://www.xbrl.org/2003/role/disclosureRef
-Topic 946
-SubTopic 220
-Name Accounting Standards Codification
-Section S99
-Paragraph 3
-Subparagraph (SX 210.6-09(6))
-Publisher FASB
-URI https://asc.fasb.org//1943274/2147483575/946-220-S99-3
Reference 7: http://www.xbrl.org/2003/role/disclosureRef
-Topic 946
-SubTopic 220
-Name Accounting Standards Codification
-Section S99
-Paragraph 3
-Subparagraph (SX 210.6-09(7))
-Publisher FASB
-URI https://asc.fasb.org//1943274/2147483575/946-220-S99-3
Reference 8: http://www.xbrl.org/2009/role/commonPracticeRef
-Topic 235
-SubTopic 10
-Name Accounting Standards Codification
-Section S99
-Paragraph 1
-Subparagraph (SX 210.4-08(g)(1)(ii))
-Publisher FASB
-URI https://asc.fasb.org//1943274/2147480678/235-10-S99-1
Reference 9: http://www.xbrl.org/2009/role/commonPracticeRef
-Topic 323
-SubTopic 10
-Name Accounting Standards Codification
-Section 50
-Paragraph 3
-Subparagraph (c)
-Publisher FASB
-URI https://asc.fasb.org//1943274/2147481687/323-10-50-3
Reference 10: http://www.xbrl.org/2009/role/commonPracticeRef
-Topic 825
-SubTopic 10
-Name Accounting Standards Codification
-Section 50
-Paragraph 28
-Subparagraph (f)
-Publisher FASB
-URI https://asc.fasb.org//1943274/2147482907/825-10-50-28
Reference 11: http://fasb.org/us-gaap/role/ref/legacyRef
-Topic 210
-SubTopic 10
-Name Accounting Standards Codification
-Section S99
-Paragraph 1
-Subparagraph (SX 210.5-02(29))
-Publisher FASB
-URI https://asc.fasb.org//1943274/2147480566/210-10-S99-1
Reference 12: http://fasb.org/us-gaap/role/ref/legacyRef
-Topic 210
-SubTopic 10
-Name Accounting Standards Codification
-Section S99
-Paragraph 1
-Subparagraph (SX 210.5-02(31))
-Publisher FASB
-URI https://asc.fasb.org//1943274/2147480566/210-10-S99-1
Reference 13: http://fasb.org/us-gaap/role/ref/legacyRef
-Topic 210
-SubTopic 10
-Name Accounting Standards Codification
-Section S99
-Paragraph 1
-Subparagraph (SX 210.5-02(30))
-Publisher FASB
-URI https://asc.fasb.org//1943274/2147480566/210-10-S99-1
Reference 14: http://fasb.org/us-gaap/role/ref/legacyRef
-Topic 310
-SubTopic 10
-Name Accounting Standards Codification
-Section S99
-Paragraph 2
-Subparagraph (SAB Topic 4.E)
-Publisher FASB
-URI https://asc.fasb.org//1943274/2147480418/310-10-S99-2
| Name: |
us-gaap_StockholdersEquity |
| Namespace Prefix: |
us-gaap_ |
| Data Type: |
xbrli:monetaryItemType |
| Balance Type: |
credit |
| Period Type: |
instant |
|
| X |
- References
+ Details
| Name: |
us-gaap_StockholdersEquityAbstract |
| Namespace Prefix: |
us-gaap_ |
| Data Type: |
xbrli:stringItemType |
| Balance Type: |
na |
| Period Type: |
duration |
|
| X |
- DefinitionAmount allocated to previously issued common shares repurchased by the issuing entity and held in treasury. Reference 1: http://fasb.org/us-gaap/role/ref/legacyRef
-Name Accounting Standards Codification
-Topic 505
-SubTopic 30
-Section 50
-Paragraph 4
-Publisher FASB
-URI https://asc.fasb.org//1943274/2147481520/505-30-50-4
Reference 2: http://fasb.org/us-gaap/role/ref/legacyRef
-Name Accounting Standards Codification
-Topic 505
-SubTopic 30
-Section 45
-Paragraph 1
-Publisher FASB
-URI https://asc.fasb.org//1943274/2147481549/505-30-45-1
Reference 3: http://fasb.org/us-gaap/role/ref/legacyRef
-Name Accounting Standards Codification
-Topic 210
-SubTopic 10
-Section S99
-Paragraph 1
-Subparagraph (SX 210.5-02.30)
-Publisher FASB
-URI https://asc.fasb.org//1943274/2147480566/210-10-S99-1
| Name: |
us-gaap_TreasuryStockCommonValue |
| Namespace Prefix: |
us-gaap_ |
| Data Type: |
xbrli:monetaryItemType |
| Balance Type: |
debit |
| Period Type: |
instant |
|
v3.24.0.1
Balance Sheets (Parenthetical) - USD ($)
$ in Thousands |
Dec. 31, 2023 |
Dec. 31, 2022 |
| Statement of Financial Position [Abstract] |
|
|
| Allowance for accounts receivable |
$ 2,455
|
$ 3,800
|
| Preferred stock, par value (in usd per share) |
$ 0.01
|
$ 0.01
|
| Preferred stock, shares authorized (in shares) |
2,000,000
|
2,000,000
|
| Preferred stock, shares issued (in shares) |
0
|
0
|
| Common stock, par value (in usd per share) |
$ 0.01
|
$ 0.01
|
| Common stock, shares authorized (in shares) |
40,000,000
|
40,000,000
|
| Common stock, shares issued (in shares) |
27,276,834
|
27,139,611
|
| Treasury stock (in shares) |
11,661,524
|
8,999,732
|
| X |
- DefinitionAmount of allowance for credit loss on accounts receivable, classified as current. Reference 1: http://www.xbrl.org/2003/role/disclosureRef
-Topic 210
-SubTopic 10
-Name Accounting Standards Codification
-Section S99
-Paragraph 1
-Subparagraph (SX 210.5-02(4))
-Publisher FASB
-URI https://asc.fasb.org//1943274/2147480566/210-10-S99-1
Reference 2: http://www.xbrl.org/2003/role/disclosureRef
-Topic 326
-SubTopic 20
-Name Accounting Standards Codification
-Section 45
-Paragraph 1
-Publisher FASB
-URI https://asc.fasb.org//1943274/2147479344/326-20-45-1
Reference 3: http://www.xbrl.org/2003/role/disclosureRef
-Topic 310
-SubTopic 10
-Name Accounting Standards Codification
-Section 50
-Paragraph 4
-Publisher FASB
-URI https://asc.fasb.org//1943274/2147481962/310-10-50-4
| Name: |
us-gaap_AllowanceForDoubtfulAccountsReceivableCurrent |
| Namespace Prefix: |
us-gaap_ |
| Data Type: |
xbrli:monetaryItemType |
| Balance Type: |
credit |
| Period Type: |
instant |
|
| X |
- DefinitionFace amount or stated value per share of common stock. Reference 1: http://fasb.org/us-gaap/role/ref/legacyRef
-Topic 210
-SubTopic 10
-Name Accounting Standards Codification
-Section S99
-Paragraph 1
-Subparagraph (SX 210.5-02(29))
-Publisher FASB
-URI https://asc.fasb.org//1943274/2147480566/210-10-S99-1
| Name: |
us-gaap_CommonStockParOrStatedValuePerShare |
| Namespace Prefix: |
us-gaap_ |
| Data Type: |
dtr-types:perShareItemType |
| Balance Type: |
na |
| Period Type: |
instant |
|
| X |
- DefinitionThe maximum number of common shares permitted to be issued by an entity's charter and bylaws. Reference 1: http://www.xbrl.org/2003/role/disclosureRef
-Topic 946
-SubTopic 210
-Name Accounting Standards Codification
-Section S99
-Paragraph 1
-Subparagraph (SX 210.6-04(16)(a))
-Publisher FASB
-URI https://asc.fasb.org//1943274/2147479617/946-210-S99-1
Reference 2: http://fasb.org/us-gaap/role/ref/legacyRef
-Topic 210
-SubTopic 10
-Name Accounting Standards Codification
-Section S99
-Paragraph 1
-Subparagraph (SX 210.5-02(29))
-Publisher FASB
-URI https://asc.fasb.org//1943274/2147480566/210-10-S99-1
| Name: |
us-gaap_CommonStockSharesAuthorized |
| Namespace Prefix: |
us-gaap_ |
| Data Type: |
xbrli:sharesItemType |
| Balance Type: |
na |
| Period Type: |
instant |
|
| X |
- DefinitionTotal number of common shares of an entity that have been sold or granted to shareholders (includes common shares that were issued, repurchased and remain in the treasury). These shares represent capital invested by the firm's shareholders and owners, and may be all or only a portion of the number of shares authorized. Shares issued include shares outstanding and shares held in the treasury. Reference 1: http://fasb.org/us-gaap/role/ref/legacyRef
-Topic 210
-SubTopic 10
-Name Accounting Standards Codification
-Section S99
-Paragraph 1
-Subparagraph (SX 210.5-02(29))
-Publisher FASB
-URI https://asc.fasb.org//1943274/2147480566/210-10-S99-1
| Name: |
us-gaap_CommonStockSharesIssued |
| Namespace Prefix: |
us-gaap_ |
| Data Type: |
xbrli:sharesItemType |
| Balance Type: |
na |
| Period Type: |
instant |
|
| X |
- DefinitionFace amount or stated value per share of preferred stock nonredeemable or redeemable solely at the option of the issuer. Reference 1: http://www.xbrl.org/2003/role/disclosureRef
-Topic 505
-SubTopic 10
-Name Accounting Standards Codification
-Section 50
-Paragraph 13
-Subparagraph (a)
-Publisher FASB
-URI https://asc.fasb.org//1943274/2147481112/505-10-50-13
Reference 2: http://fasb.org/us-gaap/role/ref/legacyRef
-Topic 210
-SubTopic 10
-Name Accounting Standards Codification
-Section S99
-Paragraph 1
-Subparagraph (SX 210.5-02(28))
-Publisher FASB
-URI https://asc.fasb.org//1943274/2147480566/210-10-S99-1
| Name: |
us-gaap_PreferredStockParOrStatedValuePerShare |
| Namespace Prefix: |
us-gaap_ |
| Data Type: |
dtr-types:perShareItemType |
| Balance Type: |
na |
| Period Type: |
instant |
|
| X |
- DefinitionThe maximum number of nonredeemable preferred shares (or preferred stock redeemable solely at the option of the issuer) permitted to be issued by an entity's charter and bylaws. Reference 1: http://www.xbrl.org/2003/role/disclosureRef
-Topic 946
-SubTopic 210
-Name Accounting Standards Codification
-Section S99
-Paragraph 1
-Subparagraph (SX 210.6-04(16)(a))
-Publisher FASB
-URI https://asc.fasb.org//1943274/2147479617/946-210-S99-1
Reference 2: http://fasb.org/us-gaap/role/ref/legacyRef
-Topic 210
-SubTopic 10
-Name Accounting Standards Codification
-Section S99
-Paragraph 1
-Subparagraph (SX 210.5-02(28))
-Publisher FASB
-URI https://asc.fasb.org//1943274/2147480566/210-10-S99-1
| Name: |
us-gaap_PreferredStockSharesAuthorized |
| Namespace Prefix: |
us-gaap_ |
| Data Type: |
xbrli:sharesItemType |
| Balance Type: |
na |
| Period Type: |
instant |
|
| X |
- DefinitionTotal number of nonredeemable preferred shares (or preferred stock redeemable solely at the option of the issuer) issued to shareholders (includes related preferred shares that were issued, repurchased, and remain in the treasury). May be all or portion of the number of preferred shares authorized. Excludes preferred shares that are classified as debt. Reference 1: http://www.xbrl.org/2003/role/disclosureRef
-Topic 505
-SubTopic 10
-Name Accounting Standards Codification
-Section 50
-Paragraph 13
-Subparagraph (a)
-Publisher FASB
-URI https://asc.fasb.org//1943274/2147481112/505-10-50-13
Reference 2: http://fasb.org/us-gaap/role/ref/legacyRef
-Topic 210
-SubTopic 10
-Name Accounting Standards Codification
-Section S99
-Paragraph 1
-Subparagraph (SX 210.5-02(28))
-Publisher FASB
-URI https://asc.fasb.org//1943274/2147480566/210-10-S99-1
| Name: |
us-gaap_PreferredStockSharesIssued |
| Namespace Prefix: |
us-gaap_ |
| Data Type: |
xbrli:sharesItemType |
| Balance Type: |
na |
| Period Type: |
instant |
|
| X |
- References
+ Details
| Name: |
us-gaap_StatementOfFinancialPositionAbstract |
| Namespace Prefix: |
us-gaap_ |
| Data Type: |
xbrli:stringItemType |
| Balance Type: |
na |
| Period Type: |
duration |
|
| X |
- DefinitionNumber of previously issued common shares repurchased by the issuing entity and held in treasury. Reference 1: http://fasb.org/us-gaap/role/ref/legacyRef
-Name Accounting Standards Codification
-Topic 505
-SubTopic 30
-Section 45
-Paragraph 1
-Publisher FASB
-URI https://asc.fasb.org//1943274/2147481549/505-30-45-1
| Name: |
us-gaap_TreasuryStockCommonShares |
| Namespace Prefix: |
us-gaap_ |
| Data Type: |
xbrli:sharesItemType |
| Balance Type: |
na |
| Period Type: |
instant |
|
v3.24.0.1
Statements of Income - USD ($)
shares in Thousands, $ in Thousands |
12 Months Ended |
Dec. 31, 2023 |
Dec. 31, 2022 |
Dec. 31, 2021 |
| Income Statement [Abstract] |
|
|
|
| Net sales |
$ 2,567,722
|
$ 3,017,555
|
$ 2,592,721
|
| Cost of goods sold |
1,911,839
|
1,905,134
|
1,724,975
|
| Gross profit |
655,883
|
1,112,421
|
867,746
|
| Selling, general and administrative expenses |
204,510
|
197,418
|
168,543
|
| Operating income |
451,373
|
915,003
|
699,203
|
| Net interest and other income |
33,268
|
9,847
|
194
|
| Income before income taxes |
484,641
|
924,850
|
699,397
|
| Provision for income taxes |
112,242
|
207,009
|
157,975
|
| Net income |
$ 372,399
|
$ 717,841
|
$ 541,422
|
| Earnings per common and common equivalent share - basic (in usd per share) |
$ 22.07
|
$ 37.47
|
$ 26.49
|
| Earnings per common and common equivalent share - diluted (in usd per share) |
$ 21.62
|
$ 36.91
|
$ 26.22
|
| Weighted average common and common equivalent shares outstanding – basic (in shares) |
16,873
|
19,159
|
20,439
|
| Weighted average common and common equivalent shares outstanding – diluted (in shares) |
17,223
|
19,446
|
20,649
|
| Cash dividends declared per share (in usd per share) |
$ 0.08
|
$ 0.08
|
$ 0.08
|
| X |
- DefinitionAggregate dividends declared during the period for each share of common stock outstanding. Reference 1: http://fasb.org/us-gaap/role/ref/legacyRef
-Topic 505
-SubTopic 10
-Name Accounting Standards Codification
-Section S99
-Paragraph 1
-Subparagraph (SX 210.3-04)
-Publisher FASB
-URI https://asc.fasb.org//1943274/2147480008/505-10-S99-1
| Name: |
us-gaap_CommonStockDividendsPerShareDeclared |
| Namespace Prefix: |
us-gaap_ |
| Data Type: |
dtr-types:perShareItemType |
| Balance Type: |
na |
| Period Type: |
duration |
|
| X |
- DefinitionThe aggregate costs related to goods produced and sold and services rendered by an entity during the reporting period. This excludes costs incurred during the reporting period related to financial services rendered and other revenue generating activities. Reference 1: http://www.xbrl.org/2003/role/disclosureRef
-Topic 924
-SubTopic 10
-Name Accounting Standards Codification
-Section S99
-Paragraph 1
-Subparagraph (SAB Topic 11.L)
-Publisher FASB
-URI https://asc.fasb.org//1943274/2147479941/924-10-S99-1
Reference 2: http://fasb.org/us-gaap/role/ref/legacyRef
-Topic 220
-SubTopic 10
-Name Accounting Standards Codification
-Section S99
-Paragraph 2
-Subparagraph (SX 210.5-03.2(a),(d))
-Publisher FASB
-URI https://asc.fasb.org//1943274/2147483621/220-10-S99-2
| Name: |
us-gaap_CostOfGoodsAndServicesSold |
| Namespace Prefix: |
us-gaap_ |
| Data Type: |
xbrli:monetaryItemType |
| Balance Type: |
debit |
| Period Type: |
duration |
|
| X |
- DefinitionThe amount of net income (loss) for the period per each share of common stock or unit outstanding during the reporting period. Reference 1: http://www.xbrl.org/2003/role/disclosureRef
-Topic 250
-SubTopic 10
-Name Accounting Standards Codification
-Section 50
-Paragraph 3
-Publisher FASB
-URI https://asc.fasb.org//1943274/2147483443/250-10-50-3
Reference 2: http://www.xbrl.org/2003/role/disclosureRef
-Topic 260
-SubTopic 10
-Name Accounting Standards Codification
-Section 55
-Paragraph 15
-Publisher FASB
-URI https://asc.fasb.org//1943274/2147482635/260-10-55-15
Reference 3: http://www.xbrl.org/2003/role/disclosureRef
-Topic 815
-SubTopic 40
-Name Accounting Standards Codification
-Section 65
-Paragraph 1
-Subparagraph (e)(4)
-Publisher FASB
-URI https://asc.fasb.org//1943274/2147480175/815-40-65-1
Reference 4: http://www.xbrl.org/2003/role/disclosureRef
-Topic 815
-SubTopic 40
-Name Accounting Standards Codification
-Section 65
-Paragraph 1
-Subparagraph (f)
-Publisher FASB
-URI https://asc.fasb.org//1943274/2147480175/815-40-65-1
Reference 5: http://www.xbrl.org/2003/role/disclosureRef
-Topic 250
-SubTopic 10
-Name Accounting Standards Codification
-Section 50
-Paragraph 11
-Subparagraph (a)
-Publisher FASB
-URI https://asc.fasb.org//1943274/2147483443/250-10-50-11
Reference 6: http://www.xbrl.org/2003/role/disclosureRef
-Topic 250
-SubTopic 10
-Name Accounting Standards Codification
-Section 50
-Paragraph 11
-Subparagraph (b)
-Publisher FASB
-URI https://asc.fasb.org//1943274/2147483443/250-10-50-11
Reference 7: http://www.xbrl.org/2003/role/disclosureRef
-Topic 250
-SubTopic 10
-Name Accounting Standards Codification
-Section 50
-Paragraph 7
-Subparagraph (a)
-Publisher FASB
-URI https://asc.fasb.org//1943274/2147483443/250-10-50-7
Reference 8: http://www.xbrl.org/2003/role/disclosureRef
-Topic 260
-SubTopic 10
-Name Accounting Standards Codification
-Section 45
-Paragraph 2
-Publisher FASB
-URI https://asc.fasb.org//1943274/2147482689/260-10-45-2
Reference 9: http://www.xbrl.org/2003/role/disclosureRef
-Topic 260
-SubTopic 10
-Name Accounting Standards Codification
-Section 45
-Paragraph 60B
-Subparagraph (d)
-Publisher FASB
-URI https://asc.fasb.org//1943274/2147482689/260-10-45-60B
Reference 10: http://www.xbrl.org/2003/role/disclosureRef
-Topic 250
-SubTopic 10
-Name Accounting Standards Codification
-Section 50
-Paragraph 4
-Publisher FASB
-URI https://asc.fasb.org//1943274/2147483443/250-10-50-4
Reference 11: http://www.xbrl.org/2003/role/disclosureRef
-Topic 260
-SubTopic 10
-Name Accounting Standards Codification
-Section 50
-Paragraph 1
-Subparagraph (a)
-Publisher FASB
-URI https://asc.fasb.org//1943274/2147482662/260-10-50-1
Reference 12: http://www.xbrl.org/2003/role/disclosureRef
-Topic 260
-SubTopic 10
-Name Accounting Standards Codification
-Section 45
-Paragraph 10
-Publisher FASB
-URI https://asc.fasb.org//1943274/2147482689/260-10-45-10
Reference 13: http://www.xbrl.org/2003/role/disclosureRef
-Topic 220
-SubTopic 10
-Name Accounting Standards Codification
-Section S99
-Paragraph 2
-Subparagraph (SX 210.5-03(25))
-Publisher FASB
-URI https://asc.fasb.org//1943274/2147483621/220-10-S99-2
Reference 14: http://www.xbrl.org/2003/role/disclosureRef
-Topic 942
-SubTopic 220
-Name Accounting Standards Codification
-Section S99
-Paragraph 1
-Subparagraph (SX 210.9-04(27))
-Publisher FASB
-URI https://asc.fasb.org//1943274/2147483589/942-220-S99-1
Reference 15: http://www.xbrl.org/2003/role/disclosureRef
-Topic 944
-SubTopic 220
-Name Accounting Standards Codification
-Section S99
-Paragraph 1
-Subparagraph (SX 210.7-04(23))
-Publisher FASB
-URI https://asc.fasb.org//1943274/2147483586/944-220-S99-1
Reference 16: http://www.xbrl.org/2003/role/exampleRef
-Topic 260
-SubTopic 10
-Name Accounting Standards Codification
-Section 55
-Paragraph 52
-Publisher FASB
-URI https://asc.fasb.org//1943274/2147482635/260-10-55-52
Reference 17: http://www.xbrl.org/2003/role/disclosureRef
-Topic 260
-SubTopic 10
-Name Accounting Standards Codification
-Section 45
-Paragraph 7
-Publisher FASB
-URI https://asc.fasb.org//1943274/2147482689/260-10-45-7
| Name: |
us-gaap_EarningsPerShareBasic |
| Namespace Prefix: |
us-gaap_ |
| Data Type: |
dtr-types:perShareItemType |
| Balance Type: |
na |
| Period Type: |
duration |
|
| X |
- DefinitionThe amount of net income (loss) for the period available to each share of common stock or common unit outstanding during the reporting period and to each share or unit that would have been outstanding assuming the issuance of common shares or units for all dilutive potential common shares or units outstanding during the reporting period. Reference 1: http://www.xbrl.org/2003/role/disclosureRef
-Topic 250
-SubTopic 10
-Name Accounting Standards Codification
-Section 50
-Paragraph 3
-Publisher FASB
-URI https://asc.fasb.org//1943274/2147483443/250-10-50-3
Reference 2: http://www.xbrl.org/2003/role/disclosureRef
-Topic 260
-SubTopic 10
-Name Accounting Standards Codification
-Section 55
-Paragraph 15
-Publisher FASB
-URI https://asc.fasb.org//1943274/2147482635/260-10-55-15
Reference 3: http://www.xbrl.org/2003/role/disclosureRef
-Topic 815
-SubTopic 40
-Name Accounting Standards Codification
-Section 65
-Paragraph 1
-Subparagraph (e)(4)
-Publisher FASB
-URI https://asc.fasb.org//1943274/2147480175/815-40-65-1
Reference 4: http://www.xbrl.org/2003/role/disclosureRef
-Topic 815
-SubTopic 40
-Name Accounting Standards Codification
-Section 65
-Paragraph 1
-Subparagraph (f)
-Publisher FASB
-URI https://asc.fasb.org//1943274/2147480175/815-40-65-1
Reference 5: http://www.xbrl.org/2003/role/disclosureRef
-Topic 250
-SubTopic 10
-Name Accounting Standards Codification
-Section 50
-Paragraph 11
-Subparagraph (a)
-Publisher FASB
-URI https://asc.fasb.org//1943274/2147483443/250-10-50-11
Reference 6: http://www.xbrl.org/2003/role/disclosureRef
-Topic 250
-SubTopic 10
-Name Accounting Standards Codification
-Section 50
-Paragraph 11
-Subparagraph (b)
-Publisher FASB
-URI https://asc.fasb.org//1943274/2147483443/250-10-50-11
Reference 7: http://www.xbrl.org/2003/role/disclosureRef
-Topic 250
-SubTopic 10
-Name Accounting Standards Codification
-Section 50
-Paragraph 7
-Subparagraph (a)
-Publisher FASB
-URI https://asc.fasb.org//1943274/2147483443/250-10-50-7
Reference 8: http://www.xbrl.org/2003/role/disclosureRef
-Topic 260
-SubTopic 10
-Name Accounting Standards Codification
-Section 45
-Paragraph 2
-Publisher FASB
-URI https://asc.fasb.org//1943274/2147482689/260-10-45-2
Reference 9: http://www.xbrl.org/2003/role/disclosureRef
-Topic 260
-SubTopic 10
-Name Accounting Standards Codification
-Section 45
-Paragraph 60B
-Subparagraph (d)
-Publisher FASB
-URI https://asc.fasb.org//1943274/2147482689/260-10-45-60B
Reference 10: http://www.xbrl.org/2003/role/disclosureRef
-Topic 250
-SubTopic 10
-Name Accounting Standards Codification
-Section 50
-Paragraph 4
-Publisher FASB
-URI https://asc.fasb.org//1943274/2147483443/250-10-50-4
Reference 11: http://www.xbrl.org/2003/role/disclosureRef
-Topic 260
-SubTopic 10
-Name Accounting Standards Codification
-Section 50
-Paragraph 1
-Subparagraph (a)
-Publisher FASB
-URI https://asc.fasb.org//1943274/2147482662/260-10-50-1
Reference 12: http://www.xbrl.org/2003/role/disclosureRef
-Topic 220
-SubTopic 10
-Name Accounting Standards Codification
-Section S99
-Paragraph 2
-Subparagraph (SX 210.5-03(25))
-Publisher FASB
-URI https://asc.fasb.org//1943274/2147483621/220-10-S99-2
Reference 13: http://www.xbrl.org/2003/role/disclosureRef
-Topic 942
-SubTopic 220
-Name Accounting Standards Codification
-Section S99
-Paragraph 1
-Subparagraph (SX 210.9-04(27))
-Publisher FASB
-URI https://asc.fasb.org//1943274/2147483589/942-220-S99-1
Reference 14: http://www.xbrl.org/2003/role/disclosureRef
-Topic 944
-SubTopic 220
-Name Accounting Standards Codification
-Section S99
-Paragraph 1
-Subparagraph (SX 210.7-04(23))
-Publisher FASB
-URI https://asc.fasb.org//1943274/2147483586/944-220-S99-1
Reference 15: http://www.xbrl.org/2003/role/exampleRef
-Topic 260
-SubTopic 10
-Name Accounting Standards Codification
-Section 55
-Paragraph 52
-Publisher FASB
-URI https://asc.fasb.org//1943274/2147482635/260-10-55-52
Reference 16: http://www.xbrl.org/2003/role/disclosureRef
-Topic 260
-SubTopic 10
-Name Accounting Standards Codification
-Section 45
-Paragraph 7
-Publisher FASB
-URI https://asc.fasb.org//1943274/2147482689/260-10-45-7
| Name: |
us-gaap_EarningsPerShareDiluted |
| Namespace Prefix: |
us-gaap_ |
| Data Type: |
dtr-types:perShareItemType |
| Balance Type: |
na |
| Period Type: |
duration |
|
| X |
- DefinitionAggregate revenue less cost of goods and services sold or operating expenses directly attributable to the revenue generation activity. Reference 1: http://www.xbrl.org/2003/role/disclosureRef
-Topic 235
-SubTopic 10
-Name Accounting Standards Codification
-Section S99
-Paragraph 1
-Subparagraph (SX 210.4-08(g)(1)(ii))
-Publisher FASB
-URI https://asc.fasb.org//1943274/2147480678/235-10-S99-1
Reference 2: http://www.xbrl.org/2003/role/disclosureRef
-Topic 323
-SubTopic 10
-Name Accounting Standards Codification
-Section 50
-Paragraph 3
-Subparagraph (c)
-Publisher FASB
-URI https://asc.fasb.org//1943274/2147481687/323-10-50-3
Reference 3: http://www.xbrl.org/2003/role/disclosureRef
-Topic 825
-SubTopic 10
-Name Accounting Standards Codification
-Section 50
-Paragraph 28
-Subparagraph (f)
-Publisher FASB
-URI https://asc.fasb.org//1943274/2147482907/825-10-50-28
Reference 4: http://www.xbrl.org/2003/role/disclosureRef
-Topic 280
-SubTopic 10
-Name Accounting Standards Codification
-Section 50
-Paragraph 22
-Publisher FASB
-URI https://asc.fasb.org//1943274/2147482810/280-10-50-22
Reference 5: http://www.xbrl.org/2003/role/disclosureRef
-Topic 470
-SubTopic 10
-Name Accounting Standards Codification
-Section S99
-Paragraph 1A
-Subparagraph (SX 210.13-01(a)(4)(i))
-Publisher FASB
-URI https://asc.fasb.org//1943274/2147480097/470-10-S99-1A
Reference 6: http://www.xbrl.org/2009/role/commonPracticeRef
-Topic 470
-SubTopic 10
-Name Accounting Standards Codification
-Section S99
-Paragraph 1A
-Subparagraph (SX 210.13-01(a)(4)(ii))
-Publisher FASB
-URI https://asc.fasb.org//1943274/2147480097/470-10-S99-1A
Reference 7: http://www.xbrl.org/2003/role/disclosureRef
-Topic 470
-SubTopic 10
-Name Accounting Standards Codification
-Section S99
-Paragraph 1A
-Subparagraph (SX 210.13-01(a)(4)(iii)(A))
-Publisher FASB
-URI https://asc.fasb.org//1943274/2147480097/470-10-S99-1A
Reference 8: http://www.xbrl.org/2003/role/disclosureRef
-Topic 470
-SubTopic 10
-Name Accounting Standards Codification
-Section S99
-Paragraph 1A
-Subparagraph (SX 210.13-01(a)(4)(iv))
-Publisher FASB
-URI https://asc.fasb.org//1943274/2147480097/470-10-S99-1A
Reference 9: http://www.xbrl.org/2003/role/disclosureRef
-Topic 470
-SubTopic 10
-Name Accounting Standards Codification
-Section S99
-Paragraph 1A
-Subparagraph (SX 210.13-01(a)(5))
-Publisher FASB
-URI https://asc.fasb.org//1943274/2147480097/470-10-S99-1A
Reference 10: http://www.xbrl.org/2003/role/disclosureRef
-Topic 470
-SubTopic 10
-Name Accounting Standards Codification
-Section S99
-Paragraph 1B
-Subparagraph (SX 210.13-02(a)(4)(i))
-Publisher FASB
-URI https://asc.fasb.org//1943274/2147480097/470-10-S99-1B
Reference 11: http://www.xbrl.org/2003/role/disclosureRef
-Topic 470
-SubTopic 10
-Name Accounting Standards Codification
-Section S99
-Paragraph 1B
-Subparagraph (SX 210.13-02(a)(4)(iii)(A))
-Publisher FASB
-URI https://asc.fasb.org//1943274/2147480097/470-10-S99-1B
Reference 12: http://www.xbrl.org/2003/role/disclosureRef
-Topic 470
-SubTopic 10
-Name Accounting Standards Codification
-Section S99
-Paragraph 1B
-Subparagraph (SX 210.13-02(a)(4)(iii)(B))
-Publisher FASB
-URI https://asc.fasb.org//1943274/2147480097/470-10-S99-1B
Reference 13: http://www.xbrl.org/2003/role/disclosureRef
-Topic 470
-SubTopic 10
-Name Accounting Standards Codification
-Section S99
-Paragraph 1B
-Subparagraph (SX 210.13-02(a)(4)(iv))
-Publisher FASB
-URI https://asc.fasb.org//1943274/2147480097/470-10-S99-1B
Reference 14: http://www.xbrl.org/2003/role/disclosureRef
-Topic 470
-SubTopic 10
-Name Accounting Standards Codification
-Section S99
-Paragraph 1B
-Subparagraph (SX 210.13-02(a)(5))
-Publisher FASB
-URI https://asc.fasb.org//1943274/2147480097/470-10-S99-1B
Reference 15: http://www.xbrl.org/2003/role/disclosureRef
-Topic 280
-SubTopic 10
-Name Accounting Standards Codification
-Section 50
-Paragraph 30
-Subparagraph (b)
-Publisher FASB
-URI https://asc.fasb.org//1943274/2147482810/280-10-50-30
Reference 16: http://www.xbrl.org/2003/role/disclosureRef
-Topic 280
-SubTopic 10
-Name Accounting Standards Codification
-Section 50
-Paragraph 32
-Subparagraph (f)
-Publisher FASB
-URI https://asc.fasb.org//1943274/2147482810/280-10-50-32
Reference 17: http://www.xbrl.org/2003/role/exampleRef
-Topic 280
-SubTopic 10
-Name Accounting Standards Codification
-Section 50
-Paragraph 31
-Publisher FASB
-URI https://asc.fasb.org//1943274/2147482810/280-10-50-31
Reference 18: http://www.xbrl.org/2003/role/disclosureRef
-Topic 280
-SubTopic 10
-Name Accounting Standards Codification
-Section 50
-Paragraph 32
-Subparagraph (c)
-Publisher FASB
-URI https://asc.fasb.org//1943274/2147482810/280-10-50-32
Reference 19: http://fasb.org/us-gaap/role/ref/legacyRef
-Topic 220
-SubTopic 10
-Name Accounting Standards Codification
-Section S99
-Paragraph 2
-Subparagraph (SX 210.5-03.1,2)
-Publisher FASB
-URI https://asc.fasb.org//1943274/2147483621/220-10-S99-2
| Name: |
us-gaap_GrossProfit |
| Namespace Prefix: |
us-gaap_ |
| Data Type: |
xbrli:monetaryItemType |
| Balance Type: |
credit |
| Period Type: |
duration |
|
| X |
- References
+ Details
| Name: |
us-gaap_IncomeStatementAbstract |
| Namespace Prefix: |
us-gaap_ |
| Data Type: |
xbrli:stringItemType |
| Balance Type: |
na |
| Period Type: |
duration |
|
| X |
- DefinitionThe portion of profit or loss for the period, net of income taxes, which is attributable to the parent. Reference 1: http://www.xbrl.org/2003/role/disclosureRef
-Topic 235
-SubTopic 10
-Name Accounting Standards Codification
-Section S99
-Paragraph 1
-Subparagraph (SX 210.4-08(g)(1)(ii))
-Publisher FASB
-URI https://asc.fasb.org//1943274/2147480678/235-10-S99-1
Reference 2: http://www.xbrl.org/2003/role/disclosureRef
-Topic 323
-SubTopic 10
-Name Accounting Standards Codification
-Section 50
-Paragraph 3
-Subparagraph (c)
-Publisher FASB
-URI https://asc.fasb.org//1943274/2147481687/323-10-50-3
Reference 3: http://www.xbrl.org/2003/role/disclosureRef
-Topic 825
-SubTopic 10
-Name Accounting Standards Codification
-Section 50
-Paragraph 28
-Subparagraph (f)
-Publisher FASB
-URI https://asc.fasb.org//1943274/2147482907/825-10-50-28
Reference 4: http://www.xbrl.org/2003/role/disclosureRef
-Topic 220
-SubTopic 10
-Name Accounting Standards Codification
-Section 50
-Paragraph 6
-Publisher FASB
-URI https://asc.fasb.org//1943274/2147482765/220-10-50-6
Reference 5: http://www.xbrl.org/2003/role/disclosureRef
-Topic 250
-SubTopic 10
-Name Accounting Standards Codification
-Section 50
-Paragraph 3
-Publisher FASB
-URI https://asc.fasb.org//1943274/2147483443/250-10-50-3
Reference 6: http://www.xbrl.org/2003/role/disclosureRef
-Topic 250
-SubTopic 10
-Name Accounting Standards Codification
-Section 50
-Paragraph 1
-Subparagraph (b)(2)
-Publisher FASB
-URI https://asc.fasb.org//1943274/2147483443/250-10-50-1
Reference 7: http://www.xbrl.org/2003/role/disclosureRef
-Topic 815
-SubTopic 40
-Name Accounting Standards Codification
-Section 65
-Paragraph 1
-Subparagraph (f)
-Publisher FASB
-URI https://asc.fasb.org//1943274/2147480175/815-40-65-1
Reference 8: http://www.xbrl.org/2003/role/disclosureRef
-Topic 250
-SubTopic 10
-Name Accounting Standards Codification
-Section 50
-Paragraph 8
-Publisher FASB
-URI https://asc.fasb.org//1943274/2147483443/250-10-50-8
Reference 9: http://www.xbrl.org/2003/role/disclosureRef
-Topic 250
-SubTopic 10
-Name Accounting Standards Codification
-Section 50
-Paragraph 9
-Publisher FASB
-URI https://asc.fasb.org//1943274/2147483443/250-10-50-9
Reference 10: http://www.xbrl.org/2003/role/disclosureRef
-Topic 250
-SubTopic 10
-Name Accounting Standards Codification
-Section 50
-Paragraph 11
-Subparagraph (a)
-Publisher FASB
-URI https://asc.fasb.org//1943274/2147483443/250-10-50-11
Reference 11: http://www.xbrl.org/2003/role/disclosureRef
-Topic 250
-SubTopic 10
-Name Accounting Standards Codification
-Section 50
-Paragraph 11
-Subparagraph (b)
-Publisher FASB
-URI https://asc.fasb.org//1943274/2147483443/250-10-50-11
Reference 12: http://www.xbrl.org/2003/role/disclosureRef
-Topic 250
-SubTopic 10
-Name Accounting Standards Codification
-Section 50
-Paragraph 4
-Publisher FASB
-URI https://asc.fasb.org//1943274/2147483443/250-10-50-4
Reference 13: http://www.xbrl.org/2003/role/exampleRef
-Topic 946
-SubTopic 830
-Name Accounting Standards Codification
-Section 55
-Paragraph 10
-Publisher FASB
-URI https://asc.fasb.org//1943274/2147480167/946-830-55-10
Reference 14: http://www.xbrl.org/2003/role/disclosureRef
-Topic 946
-SubTopic 220
-Name Accounting Standards Codification
-Section 45
-Paragraph 7
-Publisher FASB
-URI https://asc.fasb.org//1943274/2147483581/946-220-45-7
Reference 15: http://www.xbrl.org/2003/role/disclosureRef
-Topic 944
-SubTopic 220
-Name Accounting Standards Codification
-Section S99
-Paragraph 1
-Subparagraph (SX 210.7-04(18))
-Publisher FASB
-URI https://asc.fasb.org//1943274/2147483586/944-220-S99-1
Reference 16: http://www.xbrl.org/2003/role/disclosureRef
-Topic 280
-SubTopic 10
-Name Accounting Standards Codification
-Section 50
-Paragraph 22
-Publisher FASB
-URI https://asc.fasb.org//1943274/2147482810/280-10-50-22
Reference 17: http://www.xbrl.org/2003/role/disclosureRef
-Topic 946
-SubTopic 220
-Name Accounting Standards Codification
-Section S99
-Paragraph 1
-Subparagraph (SX 210.6-07(9))
-Publisher FASB
-URI https://asc.fasb.org//1943274/2147483575/946-220-S99-1
Reference 18: http://www.xbrl.org/2003/role/disclosureRef
-Topic 946
-SubTopic 220
-Name Accounting Standards Codification
-Section S99
-Paragraph 3
-Subparagraph (SX 210.6-09(1)(d))
-Publisher FASB
-URI https://asc.fasb.org//1943274/2147483575/946-220-S99-3
Reference 19: http://www.xbrl.org/2003/role/disclosureRef
-Topic 470
-SubTopic 10
-Name Accounting Standards Codification
-Section S99
-Paragraph 1A
-Subparagraph (SX 210.13-01(a)(4)(i))
-Publisher FASB
-URI https://asc.fasb.org//1943274/2147480097/470-10-S99-1A
Reference 20: http://www.xbrl.org/2009/role/commonPracticeRef
-Topic 470
-SubTopic 10
-Name Accounting Standards Codification
-Section S99
-Paragraph 1A
-Subparagraph (SX 210.13-01(a)(4)(ii))
-Publisher FASB
-URI https://asc.fasb.org//1943274/2147480097/470-10-S99-1A
Reference 21: http://www.xbrl.org/2003/role/disclosureRef
-Topic 470
-SubTopic 10
-Name Accounting Standards Codification
-Section S99
-Paragraph 1A
-Subparagraph (SX 210.13-01(a)(4)(iii)(A))
-Publisher FASB
-URI https://asc.fasb.org//1943274/2147480097/470-10-S99-1A
Reference 22: http://www.xbrl.org/2003/role/disclosureRef
-Topic 470
-SubTopic 10
-Name Accounting Standards Codification
-Section S99
-Paragraph 1A
-Subparagraph (SX 210.13-01(a)(4)(iv))
-Publisher FASB
-URI https://asc.fasb.org//1943274/2147480097/470-10-S99-1A
Reference 23: http://www.xbrl.org/2003/role/disclosureRef
-Topic 470
-SubTopic 10
-Name Accounting Standards Codification
-Section S99
-Paragraph 1A
-Subparagraph (SX 210.13-01(a)(5))
-Publisher FASB
-URI https://asc.fasb.org//1943274/2147480097/470-10-S99-1A
Reference 24: http://www.xbrl.org/2003/role/disclosureRef
-Topic 470
-SubTopic 10
-Name Accounting Standards Codification
-Section S99
-Paragraph 1B
-Subparagraph (SX 210.13-02(a)(4)(i))
-Publisher FASB
-URI https://asc.fasb.org//1943274/2147480097/470-10-S99-1B
Reference 25: http://www.xbrl.org/2003/role/disclosureRef
-Topic 470
-SubTopic 10
-Name Accounting Standards Codification
-Section S99
-Paragraph 1B
-Subparagraph (SX 210.13-02(a)(4)(iii)(A))
-Publisher FASB
-URI https://asc.fasb.org//1943274/2147480097/470-10-S99-1B
Reference 26: http://www.xbrl.org/2003/role/disclosureRef
-Topic 470
-SubTopic 10
-Name Accounting Standards Codification
-Section S99
-Paragraph 1B
-Subparagraph (SX 210.13-02(a)(4)(iii)(B))
-Publisher FASB
-URI https://asc.fasb.org//1943274/2147480097/470-10-S99-1B
Reference 27: http://www.xbrl.org/2003/role/disclosureRef
-Topic 470
-SubTopic 10
-Name Accounting Standards Codification
-Section S99
-Paragraph 1B
-Subparagraph (SX 210.13-02(a)(4)(iv))
-Publisher FASB
-URI https://asc.fasb.org//1943274/2147480097/470-10-S99-1B
Reference 28: http://www.xbrl.org/2003/role/disclosureRef
-Topic 470
-SubTopic 10
-Name Accounting Standards Codification
-Section S99
-Paragraph 1B
-Subparagraph (SX 210.13-02(a)(5))
-Publisher FASB
-URI https://asc.fasb.org//1943274/2147480097/470-10-S99-1B
Reference 29: http://www.xbrl.org/2003/role/disclosureRef
-Topic 280
-SubTopic 10
-Name Accounting Standards Codification
-Section 50
-Paragraph 30
-Subparagraph (b)
-Publisher FASB
-URI https://asc.fasb.org//1943274/2147482810/280-10-50-30
Reference 30: http://www.xbrl.org/2003/role/disclosureRef
-Topic 280
-SubTopic 10
-Name Accounting Standards Codification
-Section 50
-Paragraph 32
-Subparagraph (f)
-Publisher FASB
-URI https://asc.fasb.org//1943274/2147482810/280-10-50-32
Reference 31: http://www.xbrl.org/2003/role/disclosureRef
-Topic 260
-SubTopic 10
-Name Accounting Standards Codification
-Section 45
-Paragraph 60B
-Subparagraph (a)
-Publisher FASB
-URI https://asc.fasb.org//1943274/2147482689/260-10-45-60B
Reference 32: http://www.xbrl.org/2003/role/exampleRef
-Topic 280
-SubTopic 10
-Name Accounting Standards Codification
-Section 50
-Paragraph 31
-Publisher FASB
-URI https://asc.fasb.org//1943274/2147482810/280-10-50-31
Reference 33: http://www.xbrl.org/2003/role/disclosureRef
-Topic 280
-SubTopic 10
-Name Accounting Standards Codification
-Section 50
-Paragraph 32
-Subparagraph (c)
-Publisher FASB
-URI https://asc.fasb.org//1943274/2147482810/280-10-50-32
Reference 34: http://www.xbrl.org/2003/role/disclosureRef
-Topic 205
-SubTopic 20
-Name Accounting Standards Codification
-Section 50
-Paragraph 7
-Publisher FASB
-URI https://asc.fasb.org//1943274/2147483499/205-20-50-7
Reference 35: http://fasb.org/us-gaap/role/ref/legacyRef
-Topic 230
-SubTopic 10
-Name Accounting Standards Codification
-Section 45
-Paragraph 28
-Publisher FASB
-URI https://asc.fasb.org//1943274/2147482740/230-10-45-28
Reference 36: http://www.xbrl.org/2003/role/disclosureRef
-Topic 220
-SubTopic 10
-Name Accounting Standards Codification
-Section 45
-Paragraph 1A
-Subparagraph (a)
-Publisher FASB
-URI https://asc.fasb.org//1943274/2147482790/220-10-45-1A
Reference 37: http://www.xbrl.org/2003/role/disclosureRef
-Topic 220
-SubTopic 10
-Name Accounting Standards Codification
-Section 45
-Paragraph 1B
-Subparagraph (a)
-Publisher FASB
-URI https://asc.fasb.org//1943274/2147482790/220-10-45-1B
Reference 38: http://fasb.org/us-gaap/role/ref/legacyRef
-Topic 220
-SubTopic 10
-Name Accounting Standards Codification
-Section S99
-Paragraph 2
-Subparagraph (SX 210.5-03(20))
-Publisher FASB
-URI https://asc.fasb.org//1943274/2147483621/220-10-S99-2
Reference 39: http://fasb.org/us-gaap/role/ref/legacyRef
-Topic 942
-SubTopic 220
-Name Accounting Standards Codification
-Section S99
-Paragraph 1
-Subparagraph (SX 210.9-04(22))
-Publisher FASB
-URI https://asc.fasb.org//1943274/2147483589/942-220-S99-1
| Name: |
us-gaap_NetIncomeLoss |
| Namespace Prefix: |
us-gaap_ |
| Data Type: |
xbrli:monetaryItemType |
| Balance Type: |
credit |
| Period Type: |
duration |
|
| X |
- DefinitionThe aggregate amount of income or expense from ancillary business-related activities (that is to say, excluding major activities considered part of the normal operations of the business). Reference 1: http://fasb.org/us-gaap/role/ref/legacyRef
-Topic 220
-SubTopic 10
-Name Accounting Standards Codification
-Section S99
-Paragraph 2
-Subparagraph (SX 210.5-03.7)
-Publisher FASB
-URI https://asc.fasb.org//1943274/2147483621/220-10-S99-2
| Name: |
us-gaap_NonoperatingIncomeExpense |
| Namespace Prefix: |
us-gaap_ |
| Data Type: |
xbrli:monetaryItemType |
| Balance Type: |
credit |
| Period Type: |
duration |
|
| X |
- DefinitionThe net result for the period of deducting operating expenses from operating revenues. Reference 1: http://www.xbrl.org/2003/role/disclosureRef
-Topic 280
-SubTopic 10
-Name Accounting Standards Codification
-Section 50
-Paragraph 22
-Publisher FASB
-URI https://asc.fasb.org//1943274/2147482810/280-10-50-22
Reference 2: http://www.xbrl.org/2003/role/disclosureRef
-Topic 280
-SubTopic 10
-Name Accounting Standards Codification
-Section 50
-Paragraph 30
-Subparagraph (b)
-Publisher FASB
-URI https://asc.fasb.org//1943274/2147482810/280-10-50-30
Reference 3: http://www.xbrl.org/2003/role/disclosureRef
-Topic 280
-SubTopic 10
-Name Accounting Standards Codification
-Section 50
-Paragraph 32
-Subparagraph (f)
-Publisher FASB
-URI https://asc.fasb.org//1943274/2147482810/280-10-50-32
Reference 4: http://www.xbrl.org/2003/role/exampleRef
-Topic 280
-SubTopic 10
-Name Accounting Standards Codification
-Section 50
-Paragraph 31
-Publisher FASB
-URI https://asc.fasb.org//1943274/2147482810/280-10-50-31
Reference 5: http://www.xbrl.org/2003/role/disclosureRef
-Topic 280
-SubTopic 10
-Name Accounting Standards Codification
-Section 50
-Paragraph 32
-Subparagraph (c)
-Publisher FASB
-URI https://asc.fasb.org//1943274/2147482810/280-10-50-32
| Name: |
us-gaap_OperatingIncomeLoss |
| Namespace Prefix: |
us-gaap_ |
| Data Type: |
xbrli:monetaryItemType |
| Balance Type: |
credit |
| Period Type: |
duration |
|
| X |
- DefinitionAmount, excluding tax collected from customer, of revenue from satisfaction of performance obligation by transferring promised good or service to customer. Tax collected from customer is tax assessed by governmental authority that is both imposed on and concurrent with specific revenue-producing transaction, including, but not limited to, sales, use, value added and excise. Reference 1: http://www.xbrl.org/2003/role/disclosureRef
-Topic 924
-SubTopic 10
-Name Accounting Standards Codification
-Section S99
-Paragraph 1
-Subparagraph (SAB Topic 11.L)
-Publisher FASB
-URI https://asc.fasb.org//1943274/2147479941/924-10-S99-1
Reference 2: http://www.xbrl.org/2003/role/disclosureRef
-Topic 606
-SubTopic 10
-Name Accounting Standards Codification
-Section 50
-Paragraph 5
-Publisher FASB
-URI https://asc.fasb.org//1943274/2147479806/606-10-50-5
Reference 3: http://www.xbrl.org/2003/role/disclosureRef
-Topic 280
-SubTopic 10
-Name Accounting Standards Codification
-Section 50
-Paragraph 30
-Subparagraph (a)
-Publisher FASB
-URI https://asc.fasb.org//1943274/2147482810/280-10-50-30
Reference 4: http://www.xbrl.org/2003/role/disclosureRef
-Topic 280
-SubTopic 10
-Name Accounting Standards Codification
-Section 50
-Paragraph 42
-Publisher FASB
-URI https://asc.fasb.org//1943274/2147482810/280-10-50-42
Reference 5: http://www.xbrl.org/2003/role/disclosureRef
-Topic 280
-SubTopic 10
-Name Accounting Standards Codification
-Section 50
-Paragraph 22
-Subparagraph (b)
-Publisher FASB
-URI https://asc.fasb.org//1943274/2147482810/280-10-50-22
Reference 6: http://www.xbrl.org/2003/role/disclosureRef
-Topic 280
-SubTopic 10
-Name Accounting Standards Codification
-Section 50
-Paragraph 32
-Subparagraph (b)
-Publisher FASB
-URI https://asc.fasb.org//1943274/2147482810/280-10-50-32
Reference 7: http://www.xbrl.org/2003/role/disclosureRef
-Topic 280
-SubTopic 10
-Name Accounting Standards Codification
-Section 50
-Paragraph 40
-Publisher FASB
-URI https://asc.fasb.org//1943274/2147482810/280-10-50-40
Reference 8: http://www.xbrl.org/2003/role/disclosureRef
-Topic 280
-SubTopic 10
-Name Accounting Standards Codification
-Section 50
-Paragraph 22
-Subparagraph (a)
-Publisher FASB
-URI https://asc.fasb.org//1943274/2147482810/280-10-50-22
Reference 9: http://www.xbrl.org/2003/role/disclosureRef
-Topic 280
-SubTopic 10
-Name Accounting Standards Codification
-Section 50
-Paragraph 32
-Subparagraph (a)
-Publisher FASB
-URI https://asc.fasb.org//1943274/2147482810/280-10-50-32
Reference 10: http://www.xbrl.org/2003/role/disclosureRef
-Topic 280
-SubTopic 10
-Name Accounting Standards Codification
-Section 50
-Paragraph 41
-Subparagraph (a)
-Publisher FASB
-URI https://asc.fasb.org//1943274/2147482810/280-10-50-41
Reference 11: http://www.xbrl.org/2003/role/disclosureRef
-Topic 606
-SubTopic 10
-Name Accounting Standards Codification
-Section 50
-Paragraph 4
-Subparagraph (a)
-Publisher FASB
-URI https://asc.fasb.org//1943274/2147479806/606-10-50-4
| Name: |
us-gaap_RevenueFromContractWithCustomerExcludingAssessedTax |
| Namespace Prefix: |
us-gaap_ |
| Data Type: |
xbrli:monetaryItemType |
| Balance Type: |
credit |
| Period Type: |
duration |
|
| X |
- DefinitionThe aggregate total costs related to selling a firm's product and services, as well as all other general and administrative expenses. Direct selling expenses (for example, credit, warranty, and advertising) are expenses that can be directly linked to the sale of specific products. Indirect selling expenses are expenses that cannot be directly linked to the sale of specific products, for example telephone expenses, Internet, and postal charges. General and administrative expenses include salaries of non-sales personnel, rent, utilities, communication, etc. Reference 1: http://fasb.org/us-gaap/role/ref/legacyRef
-Topic 220
-SubTopic 10
-Name Accounting Standards Codification
-Section S99
-Paragraph 2
-Subparagraph (SX 210.5-03.4)
-Publisher FASB
-URI https://asc.fasb.org//1943274/2147483621/220-10-S99-2
| Name: |
us-gaap_SellingGeneralAndAdministrativeExpense |
| Namespace Prefix: |
us-gaap_ |
| Data Type: |
xbrli:monetaryItemType |
| Balance Type: |
debit |
| Period Type: |
duration |
|
| X |
- DefinitionThe average number of shares or units issued and outstanding that are used in calculating diluted EPS or earnings per unit (EPU), determined based on the timing of issuance of shares or units in the period. Reference 1: http://www.xbrl.org/2003/role/disclosureRef
-Topic 260
-SubTopic 10
-Name Accounting Standards Codification
-Section 50
-Paragraph 1
-Subparagraph (a)
-Publisher FASB
-URI https://asc.fasb.org//1943274/2147482662/260-10-50-1
Reference 2: http://www.xbrl.org/2003/role/disclosureRef
-Topic 260
-SubTopic 10
-Name Accounting Standards Codification
-Section 45
-Paragraph 16
-Publisher FASB
-URI https://asc.fasb.org//1943274/2147482689/260-10-45-16
| Name: |
us-gaap_WeightedAverageNumberOfDilutedSharesOutstanding |
| Namespace Prefix: |
us-gaap_ |
| Data Type: |
xbrli:sharesItemType |
| Balance Type: |
na |
| Period Type: |
duration |
|
| X |
- DefinitionNumber of [basic] shares or units, after adjustment for contingently issuable shares or units and other shares or units not deemed outstanding, determined by relating the portion of time within a reporting period that common shares or units have been outstanding to the total time in that period. Reference 1: http://www.xbrl.org/2003/role/disclosureRef
-Topic 260
-SubTopic 10
-Name Accounting Standards Codification
-Section 50
-Paragraph 1
-Subparagraph (a)
-Publisher FASB
-URI https://asc.fasb.org//1943274/2147482662/260-10-50-1
Reference 2: http://www.xbrl.org/2003/role/disclosureRef
-Topic 260
-SubTopic 10
-Name Accounting Standards Codification
-Section 45
-Paragraph 10
-Publisher FASB
-URI https://asc.fasb.org//1943274/2147482689/260-10-45-10
| Name: |
us-gaap_WeightedAverageNumberOfSharesOutstandingBasic |
| Namespace Prefix: |
us-gaap_ |
| Data Type: |
xbrli:sharesItemType |
| Balance Type: |
na |
| Period Type: |
duration |
|
v3.24.0.1
Statements of Stockholders' Equity - USD ($)
$ in Thousands |
Total |
Common Stock |
Additional Paid-In Capital |
Treasury Stock |
Retained Earnings |
| Beginning balance (in shares) at Dec. 31, 2020 |
|
27,025,000
|
|
|
|
| Beginning balance at Dec. 31, 2020 |
$ 837,729
|
$ 270
|
$ 67,885
|
$ (111,718)
|
$ 881,292
|
| Beginning balance, treasury shares (in shares) at Dec. 31, 2020 |
|
|
|
(6,468,000)
|
|
| Increase (Decrease) in Stockholders' Equity [Roll Forward] |
|
|
|
|
|
| Net income |
541,422
|
|
|
|
541,422
|
| Exercise of stock options (in shares) |
|
35,000
|
|
|
|
| Exercise of stock options |
1,084
|
$ 1
|
1,083
|
|
|
| Stock-based compensation (in shares) |
|
23,000
|
|
|
|
| Stock-based compensation |
3,785
|
|
3,785
|
|
|
| Dividend declared—$0.08 per share |
$ (1,635)
|
|
|
|
(1,635)
|
| Purchase of treasury stock (in shares) |
(475,557)
|
|
|
(476,000)
|
|
| Purchase of treasury stock |
$ (43,296)
|
|
|
$ (43,296)
|
|
| Ending balance (in shares) at Dec. 31, 2021 |
|
27,083,000
|
|
|
|
| Ending balance at Dec. 31, 2021 |
1,339,089
|
$ 271
|
72,753
|
$ (155,014)
|
1,421,079
|
| Ending balance, treasury shares (in shares) at Dec. 31, 2021 |
|
|
|
(6,944,000)
|
|
| Increase (Decrease) in Stockholders' Equity [Roll Forward] |
|
|
|
|
|
| Net income |
717,841
|
|
|
|
717,841
|
| Exercise of stock options (in shares) |
|
4,000
|
|
|
|
| Exercise of stock options |
207
|
|
207
|
|
|
| Stock-based compensation (in shares) |
|
52,000
|
|
|
|
| Stock-based compensation |
10,662
|
|
10,662
|
|
|
| Dividend declared—$0.08 per share |
$ (1,508)
|
|
|
|
(1,508)
|
| Purchase of treasury stock (in shares) |
(2,055,470)
|
|
|
(2,056,000)
|
|
| Purchase of treasury stock |
$ (247,625)
|
|
|
$ (247,625)
|
|
| Ending balance (in shares) at Dec. 31, 2022 |
|
27,139,000
|
|
|
|
| Ending balance at Dec. 31, 2022 |
$ 1,818,666
|
$ 271
|
83,622
|
$ (402,639)
|
2,137,412
|
| Ending balance, treasury shares (in shares) at Dec. 31, 2022 |
(8,999,732)
|
|
|
(9,000,000)
|
|
| Increase (Decrease) in Stockholders' Equity [Roll Forward] |
|
|
|
|
|
| Net income |
$ 372,399
|
|
|
|
372,399
|
| Exercise of stock options (in shares) |
22,000
|
22,000
|
|
|
|
| Exercise of stock options |
$ 936
|
|
936
|
|
|
| Stock-based compensation (in shares) |
|
115,000
|
|
|
|
| Stock-based compensation |
21,479
|
$ 2
|
21,477
|
|
|
| Dividend declared—$0.08 per share |
$ (1,320)
|
|
|
|
(1,320)
|
| Purchase of treasury stock (in shares) |
(2,661,792)
|
|
|
(2,662,000)
|
|
| Purchase of treasury stock |
$ (464,583)
|
|
|
$ (464,583)
|
|
| Ending balance (in shares) at Dec. 31, 2023 |
|
27,276,000
|
|
|
|
| Ending balance at Dec. 31, 2023 |
$ 1,747,577
|
$ 273
|
$ 106,035
|
$ (867,222)
|
$ 2,508,491
|
| Ending balance, treasury shares (in shares) at Dec. 31, 2023 |
(11,661,524)
|
|
|
(11,662,000)
|
|
| X |
- DefinitionAmount of increase to additional paid-in capital (APIC) for recognition of cost for option under share-based payment arrangement.
| Name: |
us-gaap_AdjustmentsToAdditionalPaidInCapitalShareBasedCompensationStockOptionsRequisiteServicePeriodRecognition |
| Namespace Prefix: |
us-gaap_ |
| Data Type: |
xbrli:monetaryItemType |
| Balance Type: |
credit |
| Period Type: |
duration |
|
| X |
- DefinitionNumber of shares of common stock outstanding. Common stock represent the ownership interest in a corporation. Reference 1: http://fasb.org/us-gaap/role/ref/legacyRef
-Name Accounting Standards Codification
-Section 50
-Paragraph 2
-SubTopic 10
-Topic 505
-Publisher FASB
-URI https://asc.fasb.org//1943274/2147481112/505-10-50-2
Reference 2: http://www.xbrl.org/2003/role/disclosureRef
-Topic 946
-SubTopic 210
-Name Accounting Standards Codification
-Section S99
-Paragraph 2
-Subparagraph (SX 210.6-05(4))
-Publisher FASB
-URI https://asc.fasb.org//1943274/2147479617/946-210-S99-2
Reference 3: http://www.xbrl.org/2009/role/commonPracticeRef
-Topic 946
-SubTopic 220
-Name Accounting Standards Codification
-Section S99
-Paragraph 3
-Subparagraph (SX 210.6-09(4)(b))
-Publisher FASB
-URI https://asc.fasb.org//1943274/2147483575/946-220-S99-3
Reference 4: http://www.xbrl.org/2003/role/disclosureRef
-Topic 946
-SubTopic 210
-Name Accounting Standards Codification
-Section S99
-Paragraph 1
-Subparagraph (SX 210.6-04(16)(a))
-Publisher FASB
-URI https://asc.fasb.org//1943274/2147479617/946-210-S99-1
Reference 5: http://www.xbrl.org/2009/role/commonPracticeRef
-Topic 946
-SubTopic 220
-Name Accounting Standards Codification
-Section S99
-Paragraph 3
-Subparagraph (SX 210.6-09(7))
-Publisher FASB
-URI https://asc.fasb.org//1943274/2147483575/946-220-S99-3
Reference 6: http://fasb.org/us-gaap/role/ref/legacyRef
-Topic 210
-SubTopic 10
-Name Accounting Standards Codification
-Section S99
-Paragraph 1
-Subparagraph (SX 210.5-02(29))
-Publisher FASB
-URI https://asc.fasb.org//1943274/2147480566/210-10-S99-1
| Name: |
us-gaap_CommonStockSharesOutstanding |
| Namespace Prefix: |
us-gaap_ |
| Data Type: |
xbrli:sharesItemType |
| Balance Type: |
na |
| Period Type: |
instant |
|
| X |
- DefinitionAmount of paid and unpaid common stock dividends declared with the form of settlement in cash. Reference 1: http://fasb.org/us-gaap/role/ref/legacyRef
-Topic 505
-SubTopic 10
-Name Accounting Standards Codification
-Section S99
-Paragraph 1
-Subparagraph (SX 210.3-04)
-Publisher FASB
-URI https://asc.fasb.org//1943274/2147480008/505-10-S99-1
| Name: |
us-gaap_DividendsCommonStockCash |
| Namespace Prefix: |
us-gaap_ |
| Data Type: |
xbrli:monetaryItemType |
| Balance Type: |
debit |
| Period Type: |
duration |
|
| X |
- DefinitionA roll forward is a reconciliation of a concept from the beginning of a period to the end of a period.
| Name: |
us-gaap_IncreaseDecreaseInStockholdersEquityRollForward |
| Namespace Prefix: |
us-gaap_ |
| Data Type: |
xbrli:stringItemType |
| Balance Type: |
na |
| Period Type: |
duration |
|
| X |
- DefinitionThe portion of profit or loss for the period, net of income taxes, which is attributable to the parent. Reference 1: http://www.xbrl.org/2003/role/disclosureRef
-Topic 235
-SubTopic 10
-Name Accounting Standards Codification
-Section S99
-Paragraph 1
-Subparagraph (SX 210.4-08(g)(1)(ii))
-Publisher FASB
-URI https://asc.fasb.org//1943274/2147480678/235-10-S99-1
Reference 2: http://www.xbrl.org/2003/role/disclosureRef
-Topic 323
-SubTopic 10
-Name Accounting Standards Codification
-Section 50
-Paragraph 3
-Subparagraph (c)
-Publisher FASB
-URI https://asc.fasb.org//1943274/2147481687/323-10-50-3
Reference 3: http://www.xbrl.org/2003/role/disclosureRef
-Topic 825
-SubTopic 10
-Name Accounting Standards Codification
-Section 50
-Paragraph 28
-Subparagraph (f)
-Publisher FASB
-URI https://asc.fasb.org//1943274/2147482907/825-10-50-28
Reference 4: http://www.xbrl.org/2003/role/disclosureRef
-Topic 220
-SubTopic 10
-Name Accounting Standards Codification
-Section 50
-Paragraph 6
-Publisher FASB
-URI https://asc.fasb.org//1943274/2147482765/220-10-50-6
Reference 5: http://www.xbrl.org/2003/role/disclosureRef
-Topic 250
-SubTopic 10
-Name Accounting Standards Codification
-Section 50
-Paragraph 3
-Publisher FASB
-URI https://asc.fasb.org//1943274/2147483443/250-10-50-3
Reference 6: http://www.xbrl.org/2003/role/disclosureRef
-Topic 250
-SubTopic 10
-Name Accounting Standards Codification
-Section 50
-Paragraph 1
-Subparagraph (b)(2)
-Publisher FASB
-URI https://asc.fasb.org//1943274/2147483443/250-10-50-1
Reference 7: http://www.xbrl.org/2003/role/disclosureRef
-Topic 815
-SubTopic 40
-Name Accounting Standards Codification
-Section 65
-Paragraph 1
-Subparagraph (f)
-Publisher FASB
-URI https://asc.fasb.org//1943274/2147480175/815-40-65-1
Reference 8: http://www.xbrl.org/2003/role/disclosureRef
-Topic 250
-SubTopic 10
-Name Accounting Standards Codification
-Section 50
-Paragraph 8
-Publisher FASB
-URI https://asc.fasb.org//1943274/2147483443/250-10-50-8
Reference 9: http://www.xbrl.org/2003/role/disclosureRef
-Topic 250
-SubTopic 10
-Name Accounting Standards Codification
-Section 50
-Paragraph 9
-Publisher FASB
-URI https://asc.fasb.org//1943274/2147483443/250-10-50-9
Reference 10: http://www.xbrl.org/2003/role/disclosureRef
-Topic 250
-SubTopic 10
-Name Accounting Standards Codification
-Section 50
-Paragraph 11
-Subparagraph (a)
-Publisher FASB
-URI https://asc.fasb.org//1943274/2147483443/250-10-50-11
Reference 11: http://www.xbrl.org/2003/role/disclosureRef
-Topic 250
-SubTopic 10
-Name Accounting Standards Codification
-Section 50
-Paragraph 11
-Subparagraph (b)
-Publisher FASB
-URI https://asc.fasb.org//1943274/2147483443/250-10-50-11
Reference 12: http://www.xbrl.org/2003/role/disclosureRef
-Topic 250
-SubTopic 10
-Name Accounting Standards Codification
-Section 50
-Paragraph 4
-Publisher FASB
-URI https://asc.fasb.org//1943274/2147483443/250-10-50-4
Reference 13: http://www.xbrl.org/2003/role/exampleRef
-Topic 946
-SubTopic 830
-Name Accounting Standards Codification
-Section 55
-Paragraph 10
-Publisher FASB
-URI https://asc.fasb.org//1943274/2147480167/946-830-55-10
Reference 14: http://www.xbrl.org/2003/role/disclosureRef
-Topic 946
-SubTopic 220
-Name Accounting Standards Codification
-Section 45
-Paragraph 7
-Publisher FASB
-URI https://asc.fasb.org//1943274/2147483581/946-220-45-7
Reference 15: http://www.xbrl.org/2003/role/disclosureRef
-Topic 944
-SubTopic 220
-Name Accounting Standards Codification
-Section S99
-Paragraph 1
-Subparagraph (SX 210.7-04(18))
-Publisher FASB
-URI https://asc.fasb.org//1943274/2147483586/944-220-S99-1
Reference 16: http://www.xbrl.org/2003/role/disclosureRef
-Topic 280
-SubTopic 10
-Name Accounting Standards Codification
-Section 50
-Paragraph 22
-Publisher FASB
-URI https://asc.fasb.org//1943274/2147482810/280-10-50-22
Reference 17: http://www.xbrl.org/2003/role/disclosureRef
-Topic 946
-SubTopic 220
-Name Accounting Standards Codification
-Section S99
-Paragraph 1
-Subparagraph (SX 210.6-07(9))
-Publisher FASB
-URI https://asc.fasb.org//1943274/2147483575/946-220-S99-1
Reference 18: http://www.xbrl.org/2003/role/disclosureRef
-Topic 946
-SubTopic 220
-Name Accounting Standards Codification
-Section S99
-Paragraph 3
-Subparagraph (SX 210.6-09(1)(d))
-Publisher FASB
-URI https://asc.fasb.org//1943274/2147483575/946-220-S99-3
Reference 19: http://www.xbrl.org/2003/role/disclosureRef
-Topic 470
-SubTopic 10
-Name Accounting Standards Codification
-Section S99
-Paragraph 1A
-Subparagraph (SX 210.13-01(a)(4)(i))
-Publisher FASB
-URI https://asc.fasb.org//1943274/2147480097/470-10-S99-1A
Reference 20: http://www.xbrl.org/2009/role/commonPracticeRef
-Topic 470
-SubTopic 10
-Name Accounting Standards Codification
-Section S99
-Paragraph 1A
-Subparagraph (SX 210.13-01(a)(4)(ii))
-Publisher FASB
-URI https://asc.fasb.org//1943274/2147480097/470-10-S99-1A
Reference 21: http://www.xbrl.org/2003/role/disclosureRef
-Topic 470
-SubTopic 10
-Name Accounting Standards Codification
-Section S99
-Paragraph 1A
-Subparagraph (SX 210.13-01(a)(4)(iii)(A))
-Publisher FASB
-URI https://asc.fasb.org//1943274/2147480097/470-10-S99-1A
Reference 22: http://www.xbrl.org/2003/role/disclosureRef
-Topic 470
-SubTopic 10
-Name Accounting Standards Codification
-Section S99
-Paragraph 1A
-Subparagraph (SX 210.13-01(a)(4)(iv))
-Publisher FASB
-URI https://asc.fasb.org//1943274/2147480097/470-10-S99-1A
Reference 23: http://www.xbrl.org/2003/role/disclosureRef
-Topic 470
-SubTopic 10
-Name Accounting Standards Codification
-Section S99
-Paragraph 1A
-Subparagraph (SX 210.13-01(a)(5))
-Publisher FASB
-URI https://asc.fasb.org//1943274/2147480097/470-10-S99-1A
Reference 24: http://www.xbrl.org/2003/role/disclosureRef
-Topic 470
-SubTopic 10
-Name Accounting Standards Codification
-Section S99
-Paragraph 1B
-Subparagraph (SX 210.13-02(a)(4)(i))
-Publisher FASB
-URI https://asc.fasb.org//1943274/2147480097/470-10-S99-1B
Reference 25: http://www.xbrl.org/2003/role/disclosureRef
-Topic 470
-SubTopic 10
-Name Accounting Standards Codification
-Section S99
-Paragraph 1B
-Subparagraph (SX 210.13-02(a)(4)(iii)(A))
-Publisher FASB
-URI https://asc.fasb.org//1943274/2147480097/470-10-S99-1B
Reference 26: http://www.xbrl.org/2003/role/disclosureRef
-Topic 470
-SubTopic 10
-Name Accounting Standards Codification
-Section S99
-Paragraph 1B
-Subparagraph (SX 210.13-02(a)(4)(iii)(B))
-Publisher FASB
-URI https://asc.fasb.org//1943274/2147480097/470-10-S99-1B
Reference 27: http://www.xbrl.org/2003/role/disclosureRef
-Topic 470
-SubTopic 10
-Name Accounting Standards Codification
-Section S99
-Paragraph 1B
-Subparagraph (SX 210.13-02(a)(4)(iv))
-Publisher FASB
-URI https://asc.fasb.org//1943274/2147480097/470-10-S99-1B
Reference 28: http://www.xbrl.org/2003/role/disclosureRef
-Topic 470
-SubTopic 10
-Name Accounting Standards Codification
-Section S99
-Paragraph 1B
-Subparagraph (SX 210.13-02(a)(5))
-Publisher FASB
-URI https://asc.fasb.org//1943274/2147480097/470-10-S99-1B
Reference 29: http://www.xbrl.org/2003/role/disclosureRef
-Topic 280
-SubTopic 10
-Name Accounting Standards Codification
-Section 50
-Paragraph 30
-Subparagraph (b)
-Publisher FASB
-URI https://asc.fasb.org//1943274/2147482810/280-10-50-30
Reference 30: http://www.xbrl.org/2003/role/disclosureRef
-Topic 280
-SubTopic 10
-Name Accounting Standards Codification
-Section 50
-Paragraph 32
-Subparagraph (f)
-Publisher FASB
-URI https://asc.fasb.org//1943274/2147482810/280-10-50-32
Reference 31: http://www.xbrl.org/2003/role/disclosureRef
-Topic 260
-SubTopic 10
-Name Accounting Standards Codification
-Section 45
-Paragraph 60B
-Subparagraph (a)
-Publisher FASB
-URI https://asc.fasb.org//1943274/2147482689/260-10-45-60B
Reference 32: http://www.xbrl.org/2003/role/exampleRef
-Topic 280
-SubTopic 10
-Name Accounting Standards Codification
-Section 50
-Paragraph 31
-Publisher FASB
-URI https://asc.fasb.org//1943274/2147482810/280-10-50-31
Reference 33: http://www.xbrl.org/2003/role/disclosureRef
-Topic 280
-SubTopic 10
-Name Accounting Standards Codification
-Section 50
-Paragraph 32
-Subparagraph (c)
-Publisher FASB
-URI https://asc.fasb.org//1943274/2147482810/280-10-50-32
Reference 34: http://www.xbrl.org/2003/role/disclosureRef
-Topic 205
-SubTopic 20
-Name Accounting Standards Codification
-Section 50
-Paragraph 7
-Publisher FASB
-URI https://asc.fasb.org//1943274/2147483499/205-20-50-7
Reference 35: http://fasb.org/us-gaap/role/ref/legacyRef
-Topic 230
-SubTopic 10
-Name Accounting Standards Codification
-Section 45
-Paragraph 28
-Publisher FASB
-URI https://asc.fasb.org//1943274/2147482740/230-10-45-28
Reference 36: http://www.xbrl.org/2003/role/disclosureRef
-Topic 220
-SubTopic 10
-Name Accounting Standards Codification
-Section 45
-Paragraph 1A
-Subparagraph (a)
-Publisher FASB
-URI https://asc.fasb.org//1943274/2147482790/220-10-45-1A
Reference 37: http://www.xbrl.org/2003/role/disclosureRef
-Topic 220
-SubTopic 10
-Name Accounting Standards Codification
-Section 45
-Paragraph 1B
-Subparagraph (a)
-Publisher FASB
-URI https://asc.fasb.org//1943274/2147482790/220-10-45-1B
Reference 38: http://fasb.org/us-gaap/role/ref/legacyRef
-Topic 220
-SubTopic 10
-Name Accounting Standards Codification
-Section S99
-Paragraph 2
-Subparagraph (SX 210.5-03(20))
-Publisher FASB
-URI https://asc.fasb.org//1943274/2147483621/220-10-S99-2
Reference 39: http://fasb.org/us-gaap/role/ref/legacyRef
-Topic 942
-SubTopic 220
-Name Accounting Standards Codification
-Section S99
-Paragraph 1
-Subparagraph (SX 210.9-04(22))
-Publisher FASB
-URI https://asc.fasb.org//1943274/2147483589/942-220-S99-1
| Name: |
us-gaap_NetIncomeLoss |
| Namespace Prefix: |
us-gaap_ |
| Data Type: |
xbrli:monetaryItemType |
| Balance Type: |
credit |
| Period Type: |
duration |
|
| X |
- DefinitionNumber, before forfeiture, of shares issued under share-based payment arrangement. Excludes employee stock ownership plan (ESOP).
| Name: |
us-gaap_StockIssuedDuringPeriodSharesShareBasedCompensationGross |
| Namespace Prefix: |
us-gaap_ |
| Data Type: |
xbrli:sharesItemType |
| Balance Type: |
na |
| Period Type: |
duration |
|
| X |
- DefinitionNumber of share options (or share units) exercised during the current period. Reference 1: http://fasb.org/us-gaap/role/ref/legacyRef
-Name Accounting Standards Codification
-Section 50
-Paragraph 2
-SubTopic 10
-Topic 505
-Publisher FASB
-URI https://asc.fasb.org//1943274/2147481112/505-10-50-2
Reference 2: http://www.xbrl.org/2003/role/disclosureRef
-Topic 718
-SubTopic 10
-Name Accounting Standards Codification
-Section 50
-Paragraph 2
-Subparagraph (c)(1)(iv)(02)
-Publisher FASB
-URI https://asc.fasb.org//1943274/2147480429/718-10-50-2
Reference 3: http://fasb.org/us-gaap/role/ref/legacyRef
-Topic 210
-SubTopic 10
-Name Accounting Standards Codification
-Section S99
-Paragraph 1
-Subparagraph (SX 210.5-02(28))
-Publisher FASB
-URI https://asc.fasb.org//1943274/2147480566/210-10-S99-1
Reference 4: http://fasb.org/us-gaap/role/ref/legacyRef
-Topic 505
-SubTopic 10
-Name Accounting Standards Codification
-Section S99
-Paragraph 1
-Subparagraph (SX 210.3-04)
-Publisher FASB
-URI https://asc.fasb.org//1943274/2147480008/505-10-S99-1
Reference 5: http://fasb.org/us-gaap/role/ref/legacyRef
-Topic 210
-SubTopic 10
-Name Accounting Standards Codification
-Section S99
-Paragraph 1
-Subparagraph (SX 210.5-02(29))
-Publisher FASB
-URI https://asc.fasb.org//1943274/2147480566/210-10-S99-1
| Name: |
us-gaap_StockIssuedDuringPeriodSharesStockOptionsExercised |
| Namespace Prefix: |
us-gaap_ |
| Data Type: |
xbrli:sharesItemType |
| Balance Type: |
na |
| Period Type: |
duration |
|
| X |
- DefinitionValue of stock issued as a result of the exercise of stock options. Reference 1: http://fasb.org/us-gaap/role/ref/legacyRef
-Name Accounting Standards Codification
-Section 50
-Paragraph 2
-SubTopic 10
-Topic 505
-Publisher FASB
-URI https://asc.fasb.org//1943274/2147481112/505-10-50-2
Reference 2: http://fasb.org/us-gaap/role/ref/legacyRef
-Topic 505
-SubTopic 10
-Name Accounting Standards Codification
-Section S99
-Paragraph 1
-Subparagraph (SX 210.3-04)
-Publisher FASB
-URI https://asc.fasb.org//1943274/2147480008/505-10-S99-1
Reference 3: http://fasb.org/us-gaap/role/ref/legacyRef
-Name Accounting Standards Codification
-Topic 210
-SubTopic 10
-Section S99
-Paragraph 1
-Subparagraph (SX 210.5-02.29-31)
-Publisher FASB
-URI https://asc.fasb.org//1943274/2147480566/210-10-S99-1
| Name: |
us-gaap_StockIssuedDuringPeriodValueStockOptionsExercised |
| Namespace Prefix: |
us-gaap_ |
| Data Type: |
xbrli:monetaryItemType |
| Balance Type: |
credit |
| Period Type: |
duration |
|
| X |
- DefinitionAmount of equity (deficit) attributable to parent. Excludes temporary equity and equity attributable to noncontrolling interest. Reference 1: http://www.xbrl.org/2003/role/exampleRef
-Topic 852
-SubTopic 10
-Name Accounting Standards Codification
-Section 55
-Paragraph 10
-Publisher FASB
-URI https://asc.fasb.org//1943274/2147481372/852-10-55-10
Reference 2: http://www.xbrl.org/2003/role/exampleRef
-Topic 946
-SubTopic 830
-Name Accounting Standards Codification
-Section 55
-Paragraph 12
-Publisher FASB
-URI https://asc.fasb.org//1943274/2147480167/946-830-55-12
Reference 3: http://www.xbrl.org/2003/role/disclosureRef
-Topic 946
-SubTopic 210
-Name Accounting Standards Codification
-Section S99
-Paragraph 1
-Subparagraph (SX 210.6-04(19))
-Publisher FASB
-URI https://asc.fasb.org//1943274/2147479617/946-210-S99-1
Reference 4: http://www.xbrl.org/2003/role/disclosureRef
-Topic 946
-SubTopic 210
-Name Accounting Standards Codification
-Section S99
-Paragraph 2
-Subparagraph (SX 210.6-05(4))
-Publisher FASB
-URI https://asc.fasb.org//1943274/2147479617/946-210-S99-2
Reference 5: http://www.xbrl.org/2009/role/commonPracticeRef
-Topic 946
-SubTopic 220
-Name Accounting Standards Codification
-Section S99
-Paragraph 3
-Subparagraph (SX 210.6-09(4)(b))
-Publisher FASB
-URI https://asc.fasb.org//1943274/2147483575/946-220-S99-3
Reference 6: http://www.xbrl.org/2003/role/disclosureRef
-Topic 946
-SubTopic 220
-Name Accounting Standards Codification
-Section S99
-Paragraph 3
-Subparagraph (SX 210.6-09(6))
-Publisher FASB
-URI https://asc.fasb.org//1943274/2147483575/946-220-S99-3
Reference 7: http://www.xbrl.org/2003/role/disclosureRef
-Topic 946
-SubTopic 220
-Name Accounting Standards Codification
-Section S99
-Paragraph 3
-Subparagraph (SX 210.6-09(7))
-Publisher FASB
-URI https://asc.fasb.org//1943274/2147483575/946-220-S99-3
Reference 8: http://www.xbrl.org/2009/role/commonPracticeRef
-Topic 235
-SubTopic 10
-Name Accounting Standards Codification
-Section S99
-Paragraph 1
-Subparagraph (SX 210.4-08(g)(1)(ii))
-Publisher FASB
-URI https://asc.fasb.org//1943274/2147480678/235-10-S99-1
Reference 9: http://www.xbrl.org/2009/role/commonPracticeRef
-Topic 323
-SubTopic 10
-Name Accounting Standards Codification
-Section 50
-Paragraph 3
-Subparagraph (c)
-Publisher FASB
-URI https://asc.fasb.org//1943274/2147481687/323-10-50-3
Reference 10: http://www.xbrl.org/2009/role/commonPracticeRef
-Topic 825
-SubTopic 10
-Name Accounting Standards Codification
-Section 50
-Paragraph 28
-Subparagraph (f)
-Publisher FASB
-URI https://asc.fasb.org//1943274/2147482907/825-10-50-28
Reference 11: http://fasb.org/us-gaap/role/ref/legacyRef
-Topic 210
-SubTopic 10
-Name Accounting Standards Codification
-Section S99
-Paragraph 1
-Subparagraph (SX 210.5-02(29))
-Publisher FASB
-URI https://asc.fasb.org//1943274/2147480566/210-10-S99-1
Reference 12: http://fasb.org/us-gaap/role/ref/legacyRef
-Topic 210
-SubTopic 10
-Name Accounting Standards Codification
-Section S99
-Paragraph 1
-Subparagraph (SX 210.5-02(31))
-Publisher FASB
-URI https://asc.fasb.org//1943274/2147480566/210-10-S99-1
Reference 13: http://fasb.org/us-gaap/role/ref/legacyRef
-Topic 210
-SubTopic 10
-Name Accounting Standards Codification
-Section S99
-Paragraph 1
-Subparagraph (SX 210.5-02(30))
-Publisher FASB
-URI https://asc.fasb.org//1943274/2147480566/210-10-S99-1
Reference 14: http://fasb.org/us-gaap/role/ref/legacyRef
-Topic 310
-SubTopic 10
-Name Accounting Standards Codification
-Section S99
-Paragraph 2
-Subparagraph (SAB Topic 4.E)
-Publisher FASB
-URI https://asc.fasb.org//1943274/2147480418/310-10-S99-2
| Name: |
us-gaap_StockholdersEquity |
| Namespace Prefix: |
us-gaap_ |
| Data Type: |
xbrli:monetaryItemType |
| Balance Type: |
credit |
| Period Type: |
instant |
|
| X |
- DefinitionNumber of previously issued common shares repurchased by the issuing entity and held in treasury. Reference 1: http://fasb.org/us-gaap/role/ref/legacyRef
-Name Accounting Standards Codification
-Topic 505
-SubTopic 30
-Section 45
-Paragraph 1
-Publisher FASB
-URI https://asc.fasb.org//1943274/2147481549/505-30-45-1
| Name: |
us-gaap_TreasuryStockCommonShares |
| Namespace Prefix: |
us-gaap_ |
| Data Type: |
xbrli:sharesItemType |
| Balance Type: |
na |
| Period Type: |
instant |
|
| X |
- DefinitionNumber of shares that have been repurchased during the period and are being held in treasury. Reference 1: http://fasb.org/us-gaap/role/ref/legacyRef
-Name Accounting Standards Codification
-Section 50
-Paragraph 2
-SubTopic 10
-Topic 505
-Publisher FASB
-URI https://asc.fasb.org//1943274/2147481112/505-10-50-2
Reference 2: http://fasb.org/us-gaap/role/ref/legacyRef
-Topic 505
-SubTopic 10
-Name Accounting Standards Codification
-Section S99
-Paragraph 1
-Subparagraph (SX 210.3-04)
-Publisher FASB
-URI https://asc.fasb.org//1943274/2147480008/505-10-S99-1
Reference 3: http://fasb.org/us-gaap/role/ref/legacyRef
-Topic 210
-SubTopic 10
-Name Accounting Standards Codification
-Section S99
-Paragraph 1
-Subparagraph (SX 210.5-02(29))
-Publisher FASB
-URI https://asc.fasb.org//1943274/2147480566/210-10-S99-1
| Name: |
us-gaap_TreasuryStockSharesAcquired |
| Namespace Prefix: |
us-gaap_ |
| Data Type: |
xbrli:sharesItemType |
| Balance Type: |
na |
| Period Type: |
duration |
|
| X |
- DefinitionEquity impact of the cost of common and preferred stock that were repurchased during the period. Recorded using the cost method. Reference 1: http://fasb.org/us-gaap/role/ref/legacyRef
-Name Accounting Standards Codification
-Section 50
-Paragraph 2
-SubTopic 10
-Topic 505
-Publisher FASB
-URI https://asc.fasb.org//1943274/2147481112/505-10-50-2
Reference 2: http://fasb.org/us-gaap/role/ref/legacyRef
-Topic 505
-SubTopic 10
-Name Accounting Standards Codification
-Section S99
-Paragraph 1
-Subparagraph (SX 210.3-04)
-Publisher FASB
-URI https://asc.fasb.org//1943274/2147480008/505-10-S99-1
Reference 3: http://fasb.org/us-gaap/role/ref/legacyRef
-Name Accounting Standards Codification
-Topic 505
-SubTopic 30
-Section 45
-Paragraph 1
-Publisher FASB
-URI https://asc.fasb.org//1943274/2147481549/505-30-45-1
| Name: |
us-gaap_TreasuryStockValueAcquiredCostMethod |
| Namespace Prefix: |
us-gaap_ |
| Data Type: |
xbrli:monetaryItemType |
| Balance Type: |
debit |
| Period Type: |
duration |
|
v3.24.0.1
| X |
- DefinitionAggregate dividends declared during the period for each share of common stock outstanding. Reference 1: http://fasb.org/us-gaap/role/ref/legacyRef
-Topic 505
-SubTopic 10
-Name Accounting Standards Codification
-Section S99
-Paragraph 1
-Subparagraph (SX 210.3-04)
-Publisher FASB
-URI https://asc.fasb.org//1943274/2147480008/505-10-S99-1
| Name: |
us-gaap_CommonStockDividendsPerShareDeclared |
| Namespace Prefix: |
us-gaap_ |
| Data Type: |
dtr-types:perShareItemType |
| Balance Type: |
na |
| Period Type: |
duration |
|
| X |
- References
+ Details
| Name: |
us-gaap_StatementOfStockholdersEquityAbstract |
| Namespace Prefix: |
us-gaap_ |
| Data Type: |
xbrli:stringItemType |
| Balance Type: |
na |
| Period Type: |
duration |
|
v3.24.0.1
Statements of Cash Flows - USD ($)
$ in Thousands |
12 Months Ended |
Dec. 31, 2023 |
Dec. 31, 2022 |
Dec. 31, 2021 |
| Operating Activities |
|
|
|
| Net income |
$ 372,399
|
$ 717,841
|
$ 541,422
|
| Adjustments to reconcile net income to net cash provided by operating activities: |
|
|
|
| Depreciation and amortization |
32,052
|
26,232
|
23,288
|
| Deferred income taxes |
4,342
|
19,539
|
2,264
|
| Stock-based compensation attributable to equity awards |
21,477
|
10,662
|
3,786
|
| Other |
4,163
|
1,796
|
5,831
|
| Changes in operating assets and liabilities: |
|
|
|
| Accounts receivable |
22,126
|
(7,636)
|
(216,808)
|
| Inventories |
(10,492)
|
(52,371)
|
(8,494)
|
| Other assets |
(2,318)
|
(980)
|
(62)
|
| Trade accounts payable and accrued liabilities |
1,083
|
(12,008)
|
66,886
|
| Current income taxes receivable / payable |
10,374
|
(14,192)
|
305
|
| Net cash provided by operating activities |
455,206
|
688,883
|
418,418
|
| Investing Activities |
|
|
|
| Purchases of property, plant and equipment |
(164,563)
|
(148,350)
|
(118,252)
|
| Proceeds from sale of assets |
28
|
0
|
97
|
| Net cash used in investing activities |
(164,535)
|
(148,350)
|
(118,155)
|
| Financing Activities |
|
|
|
| Deferred financing fees |
0
|
0
|
(550)
|
| Purchase of treasury stock |
(460,155)
|
(247,625)
|
(43,296)
|
| Proceeds from issuance of common stock, net |
938
|
207
|
1,083
|
| Dividends paid |
(1,376)
|
(1,548)
|
(1,633)
|
| Net cash used in financing activities |
(460,593)
|
(248,966)
|
(44,396)
|
| Net increase (decrease) in cash and cash equivalents |
(169,922)
|
291,567
|
255,867
|
| Cash and cash equivalents at beginning of period |
730,557
|
438,990
|
183,123
|
| Cash and cash equivalents at end of period |
$ 560,635
|
$ 730,557
|
$ 438,990
|
| X |
- References
+ Details
| Name: |
us-gaap_AdjustmentsToReconcileNetIncomeLossToCashProvidedByUsedInOperatingActivitiesAbstract |
| Namespace Prefix: |
us-gaap_ |
| Data Type: |
xbrli:stringItemType |
| Balance Type: |
na |
| Period Type: |
duration |
|
| X |
- DefinitionAmount of cash and cash equivalents, and cash and cash equivalents restricted to withdrawal or usage. Excludes amount for disposal group and discontinued operations. Cash includes, but is not limited to, currency on hand, demand deposits with banks or financial institutions, and other accounts with general characteristics of demand deposits. Cash equivalents include, but are not limited to, short-term, highly liquid investments that are both readily convertible to known amounts of cash and so near their maturity that they present insignificant risk of changes in value because of changes in interest rates. Reference 1: http://www.xbrl.org/2003/role/disclosureRef
-Topic 230
-SubTopic 10
-Name Accounting Standards Codification
-Section 50
-Paragraph 8
-Publisher FASB
-URI https://asc.fasb.org//1943274/2147482913/230-10-50-8
Reference 2: http://fasb.org/us-gaap/role/ref/legacyRef
-Topic 230
-SubTopic 10
-Name Accounting Standards Codification
-Section 45
-Paragraph 24
-Publisher FASB
-URI https://asc.fasb.org//1943274/2147482740/230-10-45-24
Reference 3: http://fasb.org/us-gaap/role/ref/legacyRef
-Name Accounting Standards Codification
-Topic 230
-SubTopic 10
-Section 45
-Paragraph 4
-Publisher FASB
-URI https://asc.fasb.org//1943274/2147482740/230-10-45-4
| Name: |
us-gaap_CashCashEquivalentsRestrictedCashAndRestrictedCashEquivalents |
| Namespace Prefix: |
us-gaap_ |
| Data Type: |
xbrli:monetaryItemType |
| Balance Type: |
debit |
| Period Type: |
instant |
|
| X |
- DefinitionAmount of increase (decrease) in cash, cash equivalents, and cash and cash equivalents restricted to withdrawal or usage; including effect from exchange rate change. Cash includes, but is not limited to, currency on hand, demand deposits with banks or financial institutions, and other accounts with general characteristics of demand deposits. Cash equivalents include, but are not limited to, short-term, highly liquid investments that are both readily convertible to known amounts of cash and so near their maturity that they present insignificant risk of changes in value because of changes in interest rates. Reference 1: http://fasb.org/us-gaap/role/ref/legacyRef
-Topic 230
-SubTopic 10
-Name Accounting Standards Codification
-Section 45
-Paragraph 24
-Publisher FASB
-URI https://asc.fasb.org//1943274/2147482740/230-10-45-24
Reference 2: http://fasb.org/us-gaap/role/ref/legacyRef
-Name Accounting Standards Codification
-Section 45
-Paragraph 1
-SubTopic 230
-Topic 830
-Publisher FASB
-URI https://asc.fasb.org//1943274/2147481877/830-230-45-1
| Name: |
us-gaap_CashCashEquivalentsRestrictedCashAndRestrictedCashEquivalentsPeriodIncreaseDecreaseIncludingExchangeRateEffect |
| Namespace Prefix: |
us-gaap_ |
| Data Type: |
xbrli:monetaryItemType |
| Balance Type: |
debit |
| Period Type: |
duration |
|
| X |
- DefinitionThe aggregate expense recognized in the current period that allocates the cost of tangible assets, intangible assets, or depleting assets to periods that benefit from use of the assets. Reference 1: http://fasb.org/us-gaap/role/ref/legacyRef
-Name Accounting Standards Codification
-Section 45
-Paragraph 28
-Subparagraph (b)
-SubTopic 10
-Topic 230
-Publisher FASB
-URI https://asc.fasb.org//1943274/2147482740/230-10-45-28
Reference 2: http://www.xbrl.org/2003/role/disclosureRef
-Topic 280
-SubTopic 10
-Name Accounting Standards Codification
-Section 50
-Paragraph 22
-Subparagraph (e)
-Publisher FASB
-URI https://asc.fasb.org//1943274/2147482810/280-10-50-22
| Name: |
us-gaap_DepreciationDepletionAndAmortization |
| Namespace Prefix: |
us-gaap_ |
| Data Type: |
xbrli:monetaryItemType |
| Balance Type: |
debit |
| Period Type: |
duration |
|
| X |
- DefinitionThe increase (decrease) during the reporting period in the amounts payable to vendors for goods and services received and the amount of obligations and expenses incurred but not paid. Reference 1: http://fasb.org/us-gaap/role/ref/legacyRef
-Name Accounting Standards Codification
-Section 45
-Paragraph 28
-Subparagraph (a)
-SubTopic 10
-Topic 230
-Publisher FASB
-URI https://asc.fasb.org//1943274/2147482740/230-10-45-28
| Name: |
us-gaap_IncreaseDecreaseInAccountsPayableAndAccruedLiabilities |
| Namespace Prefix: |
us-gaap_ |
| Data Type: |
xbrli:monetaryItemType |
| Balance Type: |
debit |
| Period Type: |
duration |
|
| X |
- DefinitionThe increase (decrease) during the reporting period in amount due within one year (or one business cycle) from customers for the credit sale of goods and services. Reference 1: http://fasb.org/us-gaap/role/ref/legacyRef
-Name Accounting Standards Codification
-Section 45
-Paragraph 28
-Subparagraph (a)
-SubTopic 10
-Topic 230
-Publisher FASB
-URI https://asc.fasb.org//1943274/2147482740/230-10-45-28
| Name: |
us-gaap_IncreaseDecreaseInAccountsReceivable |
| Namespace Prefix: |
us-gaap_ |
| Data Type: |
xbrli:monetaryItemType |
| Balance Type: |
credit |
| Period Type: |
duration |
|
| X |
- DefinitionThe increase (decrease) during the reporting period in the aggregate value of all inventory held by the reporting entity, associated with underlying transactions that are classified as operating activities. Reference 1: http://fasb.org/us-gaap/role/ref/legacyRef
-Name Accounting Standards Codification
-Section 45
-Paragraph 28
-Subparagraph (a)
-SubTopic 10
-Topic 230
-Publisher FASB
-URI https://asc.fasb.org//1943274/2147482740/230-10-45-28
| Name: |
us-gaap_IncreaseDecreaseInInventories |
| Namespace Prefix: |
us-gaap_ |
| Data Type: |
xbrli:monetaryItemType |
| Balance Type: |
credit |
| Period Type: |
duration |
|
| X |
- References
+ Details
| Name: |
us-gaap_IncreaseDecreaseInOperatingCapitalAbstract |
| Namespace Prefix: |
us-gaap_ |
| Data Type: |
xbrli:stringItemType |
| Balance Type: |
na |
| Period Type: |
duration |
|
| X |
- DefinitionAmount of increase (decrease) in operating assets after deduction of operating liabilities classified as other. Reference 1: http://fasb.org/us-gaap/role/ref/legacyRef
-Name Accounting Standards Codification
-Section 45
-Paragraph 28
-Subparagraph (a)
-SubTopic 10
-Topic 230
-Publisher FASB
-URI https://asc.fasb.org//1943274/2147482740/230-10-45-28
| Name: |
us-gaap_IncreaseDecreaseInOtherOperatingCapitalNet |
| Namespace Prefix: |
us-gaap_ |
| Data Type: |
xbrli:monetaryItemType |
| Balance Type: |
credit |
| Period Type: |
duration |
|
| X |
- DefinitionAmount of cash inflow (outflow) from financing activities, including discontinued operations. Financing activity cash flows include obtaining resources from owners and providing them with a return on, and a return of, their investment; borrowing money and repaying amounts borrowed, or settling the obligation; and obtaining and paying for other resources obtained from creditors on long-term credit. Reference 1: http://www.xbrl.org/2003/role/disclosureRef
-Topic 230
-SubTopic 10
-Name Accounting Standards Codification
-Section 45
-Paragraph 24
-Publisher FASB
-URI https://asc.fasb.org//1943274/2147482740/230-10-45-24
| Name: |
us-gaap_NetCashProvidedByUsedInFinancingActivities |
| Namespace Prefix: |
us-gaap_ |
| Data Type: |
xbrli:monetaryItemType |
| Balance Type: |
debit |
| Period Type: |
duration |
|
| X |
- References
+ Details
| Name: |
us-gaap_NetCashProvidedByUsedInFinancingActivitiesAbstract |
| Namespace Prefix: |
us-gaap_ |
| Data Type: |
xbrli:stringItemType |
| Balance Type: |
na |
| Period Type: |
duration |
|
| X |
- DefinitionAmount of cash inflow (outflow) from investing activities, including discontinued operations. Investing activity cash flows include making and collecting loans and acquiring and disposing of debt or equity instruments and property, plant, and equipment and other productive assets. Reference 1: http://www.xbrl.org/2003/role/disclosureRef
-Topic 230
-SubTopic 10
-Name Accounting Standards Codification
-Section 45
-Paragraph 24
-Publisher FASB
-URI https://asc.fasb.org//1943274/2147482740/230-10-45-24
| Name: |
us-gaap_NetCashProvidedByUsedInInvestingActivities |
| Namespace Prefix: |
us-gaap_ |
| Data Type: |
xbrli:monetaryItemType |
| Balance Type: |
debit |
| Period Type: |
duration |
|
| X |
- References
+ Details
| Name: |
us-gaap_NetCashProvidedByUsedInInvestingActivitiesAbstract |
| Namespace Prefix: |
us-gaap_ |
| Data Type: |
xbrli:stringItemType |
| Balance Type: |
na |
| Period Type: |
duration |
|
| X |
- DefinitionAmount of cash inflow (outflow) from operating activities, including discontinued operations. Operating activity cash flows include transactions, adjustments, and changes in value not defined as investing or financing activities. Reference 1: http://fasb.org/us-gaap/role/ref/legacyRef
-Topic 230
-SubTopic 10
-Name Accounting Standards Codification
-Section 45
-Paragraph 28
-Publisher FASB
-URI https://asc.fasb.org//1943274/2147482740/230-10-45-28
Reference 2: http://fasb.org/us-gaap/role/ref/legacyRef
-Topic 230
-SubTopic 10
-Name Accounting Standards Codification
-Section 45
-Paragraph 24
-Publisher FASB
-URI https://asc.fasb.org//1943274/2147482740/230-10-45-24
Reference 3: http://fasb.org/us-gaap/role/ref/legacyRef
-Topic 230
-SubTopic 10
-Name Accounting Standards Codification
-Section 45
-Paragraph 25
-Publisher FASB
-URI https://asc.fasb.org//1943274/2147482740/230-10-45-25
| Name: |
us-gaap_NetCashProvidedByUsedInOperatingActivities |
| Namespace Prefix: |
us-gaap_ |
| Data Type: |
xbrli:monetaryItemType |
| Balance Type: |
na |
| Period Type: |
duration |
|
| X |
- References
+ Details
| Name: |
us-gaap_NetCashProvidedByUsedInOperatingActivitiesAbstract |
| Namespace Prefix: |
us-gaap_ |
| Data Type: |
xbrli:stringItemType |
| Balance Type: |
na |
| Period Type: |
duration |
|
| X |
- DefinitionThe portion of profit or loss for the period, net of income taxes, which is attributable to the parent. Reference 1: http://www.xbrl.org/2003/role/disclosureRef
-Topic 235
-SubTopic 10
-Name Accounting Standards Codification
-Section S99
-Paragraph 1
-Subparagraph (SX 210.4-08(g)(1)(ii))
-Publisher FASB
-URI https://asc.fasb.org//1943274/2147480678/235-10-S99-1
Reference 2: http://www.xbrl.org/2003/role/disclosureRef
-Topic 323
-SubTopic 10
-Name Accounting Standards Codification
-Section 50
-Paragraph 3
-Subparagraph (c)
-Publisher FASB
-URI https://asc.fasb.org//1943274/2147481687/323-10-50-3
Reference 3: http://www.xbrl.org/2003/role/disclosureRef
-Topic 825
-SubTopic 10
-Name Accounting Standards Codification
-Section 50
-Paragraph 28
-Subparagraph (f)
-Publisher FASB
-URI https://asc.fasb.org//1943274/2147482907/825-10-50-28
Reference 4: http://www.xbrl.org/2003/role/disclosureRef
-Topic 220
-SubTopic 10
-Name Accounting Standards Codification
-Section 50
-Paragraph 6
-Publisher FASB
-URI https://asc.fasb.org//1943274/2147482765/220-10-50-6
Reference 5: http://www.xbrl.org/2003/role/disclosureRef
-Topic 250
-SubTopic 10
-Name Accounting Standards Codification
-Section 50
-Paragraph 3
-Publisher FASB
-URI https://asc.fasb.org//1943274/2147483443/250-10-50-3
Reference 6: http://www.xbrl.org/2003/role/disclosureRef
-Topic 250
-SubTopic 10
-Name Accounting Standards Codification
-Section 50
-Paragraph 1
-Subparagraph (b)(2)
-Publisher FASB
-URI https://asc.fasb.org//1943274/2147483443/250-10-50-1
Reference 7: http://www.xbrl.org/2003/role/disclosureRef
-Topic 815
-SubTopic 40
-Name Accounting Standards Codification
-Section 65
-Paragraph 1
-Subparagraph (f)
-Publisher FASB
-URI https://asc.fasb.org//1943274/2147480175/815-40-65-1
Reference 8: http://www.xbrl.org/2003/role/disclosureRef
-Topic 250
-SubTopic 10
-Name Accounting Standards Codification
-Section 50
-Paragraph 8
-Publisher FASB
-URI https://asc.fasb.org//1943274/2147483443/250-10-50-8
Reference 9: http://www.xbrl.org/2003/role/disclosureRef
-Topic 250
-SubTopic 10
-Name Accounting Standards Codification
-Section 50
-Paragraph 9
-Publisher FASB
-URI https://asc.fasb.org//1943274/2147483443/250-10-50-9
Reference 10: http://www.xbrl.org/2003/role/disclosureRef
-Topic 250
-SubTopic 10
-Name Accounting Standards Codification
-Section 50
-Paragraph 11
-Subparagraph (a)
-Publisher FASB
-URI https://asc.fasb.org//1943274/2147483443/250-10-50-11
Reference 11: http://www.xbrl.org/2003/role/disclosureRef
-Topic 250
-SubTopic 10
-Name Accounting Standards Codification
-Section 50
-Paragraph 11
-Subparagraph (b)
-Publisher FASB
-URI https://asc.fasb.org//1943274/2147483443/250-10-50-11
Reference 12: http://www.xbrl.org/2003/role/disclosureRef
-Topic 250
-SubTopic 10
-Name Accounting Standards Codification
-Section 50
-Paragraph 4
-Publisher FASB
-URI https://asc.fasb.org//1943274/2147483443/250-10-50-4
Reference 13: http://www.xbrl.org/2003/role/exampleRef
-Topic 946
-SubTopic 830
-Name Accounting Standards Codification
-Section 55
-Paragraph 10
-Publisher FASB
-URI https://asc.fasb.org//1943274/2147480167/946-830-55-10
Reference 14: http://www.xbrl.org/2003/role/disclosureRef
-Topic 946
-SubTopic 220
-Name Accounting Standards Codification
-Section 45
-Paragraph 7
-Publisher FASB
-URI https://asc.fasb.org//1943274/2147483581/946-220-45-7
Reference 15: http://www.xbrl.org/2003/role/disclosureRef
-Topic 944
-SubTopic 220
-Name Accounting Standards Codification
-Section S99
-Paragraph 1
-Subparagraph (SX 210.7-04(18))
-Publisher FASB
-URI https://asc.fasb.org//1943274/2147483586/944-220-S99-1
Reference 16: http://www.xbrl.org/2003/role/disclosureRef
-Topic 280
-SubTopic 10
-Name Accounting Standards Codification
-Section 50
-Paragraph 22
-Publisher FASB
-URI https://asc.fasb.org//1943274/2147482810/280-10-50-22
Reference 17: http://www.xbrl.org/2003/role/disclosureRef
-Topic 946
-SubTopic 220
-Name Accounting Standards Codification
-Section S99
-Paragraph 1
-Subparagraph (SX 210.6-07(9))
-Publisher FASB
-URI https://asc.fasb.org//1943274/2147483575/946-220-S99-1
Reference 18: http://www.xbrl.org/2003/role/disclosureRef
-Topic 946
-SubTopic 220
-Name Accounting Standards Codification
-Section S99
-Paragraph 3
-Subparagraph (SX 210.6-09(1)(d))
-Publisher FASB
-URI https://asc.fasb.org//1943274/2147483575/946-220-S99-3
Reference 19: http://www.xbrl.org/2003/role/disclosureRef
-Topic 470
-SubTopic 10
-Name Accounting Standards Codification
-Section S99
-Paragraph 1A
-Subparagraph (SX 210.13-01(a)(4)(i))
-Publisher FASB
-URI https://asc.fasb.org//1943274/2147480097/470-10-S99-1A
Reference 20: http://www.xbrl.org/2009/role/commonPracticeRef
-Topic 470
-SubTopic 10
-Name Accounting Standards Codification
-Section S99
-Paragraph 1A
-Subparagraph (SX 210.13-01(a)(4)(ii))
-Publisher FASB
-URI https://asc.fasb.org//1943274/2147480097/470-10-S99-1A
Reference 21: http://www.xbrl.org/2003/role/disclosureRef
-Topic 470
-SubTopic 10
-Name Accounting Standards Codification
-Section S99
-Paragraph 1A
-Subparagraph (SX 210.13-01(a)(4)(iii)(A))
-Publisher FASB
-URI https://asc.fasb.org//1943274/2147480097/470-10-S99-1A
Reference 22: http://www.xbrl.org/2003/role/disclosureRef
-Topic 470
-SubTopic 10
-Name Accounting Standards Codification
-Section S99
-Paragraph 1A
-Subparagraph (SX 210.13-01(a)(4)(iv))
-Publisher FASB
-URI https://asc.fasb.org//1943274/2147480097/470-10-S99-1A
Reference 23: http://www.xbrl.org/2003/role/disclosureRef
-Topic 470
-SubTopic 10
-Name Accounting Standards Codification
-Section S99
-Paragraph 1A
-Subparagraph (SX 210.13-01(a)(5))
-Publisher FASB
-URI https://asc.fasb.org//1943274/2147480097/470-10-S99-1A
Reference 24: http://www.xbrl.org/2003/role/disclosureRef
-Topic 470
-SubTopic 10
-Name Accounting Standards Codification
-Section S99
-Paragraph 1B
-Subparagraph (SX 210.13-02(a)(4)(i))
-Publisher FASB
-URI https://asc.fasb.org//1943274/2147480097/470-10-S99-1B
Reference 25: http://www.xbrl.org/2003/role/disclosureRef
-Topic 470
-SubTopic 10
-Name Accounting Standards Codification
-Section S99
-Paragraph 1B
-Subparagraph (SX 210.13-02(a)(4)(iii)(A))
-Publisher FASB
-URI https://asc.fasb.org//1943274/2147480097/470-10-S99-1B
Reference 26: http://www.xbrl.org/2003/role/disclosureRef
-Topic 470
-SubTopic 10
-Name Accounting Standards Codification
-Section S99
-Paragraph 1B
-Subparagraph (SX 210.13-02(a)(4)(iii)(B))
-Publisher FASB
-URI https://asc.fasb.org//1943274/2147480097/470-10-S99-1B
Reference 27: http://www.xbrl.org/2003/role/disclosureRef
-Topic 470
-SubTopic 10
-Name Accounting Standards Codification
-Section S99
-Paragraph 1B
-Subparagraph (SX 210.13-02(a)(4)(iv))
-Publisher FASB
-URI https://asc.fasb.org//1943274/2147480097/470-10-S99-1B
Reference 28: http://www.xbrl.org/2003/role/disclosureRef
-Topic 470
-SubTopic 10
-Name Accounting Standards Codification
-Section S99
-Paragraph 1B
-Subparagraph (SX 210.13-02(a)(5))
-Publisher FASB
-URI https://asc.fasb.org//1943274/2147480097/470-10-S99-1B
Reference 29: http://www.xbrl.org/2003/role/disclosureRef
-Topic 280
-SubTopic 10
-Name Accounting Standards Codification
-Section 50
-Paragraph 30
-Subparagraph (b)
-Publisher FASB
-URI https://asc.fasb.org//1943274/2147482810/280-10-50-30
Reference 30: http://www.xbrl.org/2003/role/disclosureRef
-Topic 280
-SubTopic 10
-Name Accounting Standards Codification
-Section 50
-Paragraph 32
-Subparagraph (f)
-Publisher FASB
-URI https://asc.fasb.org//1943274/2147482810/280-10-50-32
Reference 31: http://www.xbrl.org/2003/role/disclosureRef
-Topic 260
-SubTopic 10
-Name Accounting Standards Codification
-Section 45
-Paragraph 60B
-Subparagraph (a)
-Publisher FASB
-URI https://asc.fasb.org//1943274/2147482689/260-10-45-60B
Reference 32: http://www.xbrl.org/2003/role/exampleRef
-Topic 280
-SubTopic 10
-Name Accounting Standards Codification
-Section 50
-Paragraph 31
-Publisher FASB
-URI https://asc.fasb.org//1943274/2147482810/280-10-50-31
Reference 33: http://www.xbrl.org/2003/role/disclosureRef
-Topic 280
-SubTopic 10
-Name Accounting Standards Codification
-Section 50
-Paragraph 32
-Subparagraph (c)
-Publisher FASB
-URI https://asc.fasb.org//1943274/2147482810/280-10-50-32
Reference 34: http://www.xbrl.org/2003/role/disclosureRef
-Topic 205
-SubTopic 20
-Name Accounting Standards Codification
-Section 50
-Paragraph 7
-Publisher FASB
-URI https://asc.fasb.org//1943274/2147483499/205-20-50-7
Reference 35: http://fasb.org/us-gaap/role/ref/legacyRef
-Topic 230
-SubTopic 10
-Name Accounting Standards Codification
-Section 45
-Paragraph 28
-Publisher FASB
-URI https://asc.fasb.org//1943274/2147482740/230-10-45-28
Reference 36: http://www.xbrl.org/2003/role/disclosureRef
-Topic 220
-SubTopic 10
-Name Accounting Standards Codification
-Section 45
-Paragraph 1A
-Subparagraph (a)
-Publisher FASB
-URI https://asc.fasb.org//1943274/2147482790/220-10-45-1A
Reference 37: http://www.xbrl.org/2003/role/disclosureRef
-Topic 220
-SubTopic 10
-Name Accounting Standards Codification
-Section 45
-Paragraph 1B
-Subparagraph (a)
-Publisher FASB
-URI https://asc.fasb.org//1943274/2147482790/220-10-45-1B
Reference 38: http://fasb.org/us-gaap/role/ref/legacyRef
-Topic 220
-SubTopic 10
-Name Accounting Standards Codification
-Section S99
-Paragraph 2
-Subparagraph (SX 210.5-03(20))
-Publisher FASB
-URI https://asc.fasb.org//1943274/2147483621/220-10-S99-2
Reference 39: http://fasb.org/us-gaap/role/ref/legacyRef
-Topic 942
-SubTopic 220
-Name Accounting Standards Codification
-Section S99
-Paragraph 1
-Subparagraph (SX 210.9-04(22))
-Publisher FASB
-URI https://asc.fasb.org//1943274/2147483589/942-220-S99-1
| Name: |
us-gaap_NetIncomeLoss |
| Namespace Prefix: |
us-gaap_ |
| Data Type: |
xbrli:monetaryItemType |
| Balance Type: |
credit |
| Period Type: |
duration |
|
| X |
- DefinitionAmount of income (expense) included in net income that results in no cash inflow (outflow), classified as other. Reference 1: http://fasb.org/us-gaap/role/ref/legacyRef
-Topic 230
-SubTopic 10
-Name Accounting Standards Codification
-Section 45
-Paragraph 28
-Publisher FASB
-URI https://asc.fasb.org//1943274/2147482740/230-10-45-28
| Name: |
us-gaap_OtherNoncashIncomeExpense |
| Namespace Prefix: |
us-gaap_ |
| Data Type: |
xbrli:monetaryItemType |
| Balance Type: |
credit |
| Period Type: |
duration |
|
| X |
- DefinitionThe cash outflow to reacquire common stock during the period. Reference 1: http://fasb.org/us-gaap/role/ref/legacyRef
-Name Accounting Standards Codification
-Topic 230
-SubTopic 10
-Section 45
-Paragraph 15
-Subparagraph (a)
-Publisher FASB
-URI https://asc.fasb.org//1943274/2147482740/230-10-45-15
| Name: |
us-gaap_PaymentsForRepurchaseOfCommonStock |
| Namespace Prefix: |
us-gaap_ |
| Data Type: |
xbrli:monetaryItemType |
| Balance Type: |
credit |
| Period Type: |
duration |
|
| X |
- DefinitionCash outflow in the form of capital distributions and dividends to common shareholders, preferred shareholders and noncontrolling interests. Reference 1: http://fasb.org/us-gaap/role/ref/legacyRef
-Name Accounting Standards Codification
-Topic 230
-SubTopic 10
-Section 45
-Paragraph 15
-Subparagraph (a)
-Publisher FASB
-URI https://asc.fasb.org//1943274/2147482740/230-10-45-15
| Name: |
us-gaap_PaymentsOfDividends |
| Namespace Prefix: |
us-gaap_ |
| Data Type: |
xbrli:monetaryItemType |
| Balance Type: |
credit |
| Period Type: |
duration |
|
| X |
- DefinitionThe cash outflow for loan and debt issuance costs. Reference 1: http://fasb.org/us-gaap/role/ref/legacyRef
-Name Accounting Standards Codification
-Topic 230
-SubTopic 10
-Section 45
-Paragraph 15
-Publisher FASB
-URI https://asc.fasb.org//1943274/2147482740/230-10-45-15
| Name: |
us-gaap_PaymentsOfFinancingCosts |
| Namespace Prefix: |
us-gaap_ |
| Data Type: |
xbrli:monetaryItemType |
| Balance Type: |
credit |
| Period Type: |
duration |
|
| X |
- DefinitionThe cash outflow associated with the acquisition of long-lived, physical assets that are used in the normal conduct of business to produce goods and services and not intended for resale; includes cash outflows to pay for construction of self-constructed assets. Reference 1: http://fasb.org/us-gaap/role/ref/legacyRef
-Topic 230
-SubTopic 10
-Name Accounting Standards Codification
-Section 45
-Paragraph 13
-Subparagraph (c)
-Publisher FASB
-URI https://asc.fasb.org//1943274/2147482740/230-10-45-13
| Name: |
us-gaap_PaymentsToAcquirePropertyPlantAndEquipment |
| Namespace Prefix: |
us-gaap_ |
| Data Type: |
xbrli:monetaryItemType |
| Balance Type: |
credit |
| Period Type: |
duration |
|
| X |
- DefinitionThe cash inflow from the additional capital contribution to the entity. Reference 1: http://fasb.org/us-gaap/role/ref/legacyRef
-Name Accounting Standards Codification
-Section 45
-Paragraph 14
-Subparagraph (a)
-SubTopic 10
-Topic 230
-Publisher FASB
-URI https://asc.fasb.org//1943274/2147482740/230-10-45-14
| Name: |
us-gaap_ProceedsFromIssuanceOfCommonStock |
| Namespace Prefix: |
us-gaap_ |
| Data Type: |
xbrli:monetaryItemType |
| Balance Type: |
debit |
| Period Type: |
duration |
|
| X |
- DefinitionThe cash inflow from the sale of property, plant and equipment (capital expenditures), software, and other intangible assets. Reference 1: http://fasb.org/us-gaap/role/ref/legacyRef
-Topic 230
-SubTopic 10
-Name Accounting Standards Codification
-Section 45
-Paragraph 12
-Subparagraph (c)
-Publisher FASB
-URI https://asc.fasb.org//1943274/2147482740/230-10-45-12
| Name: |
us-gaap_ProceedsFromSaleOfProductiveAssets |
| Namespace Prefix: |
us-gaap_ |
| Data Type: |
xbrli:monetaryItemType |
| Balance Type: |
debit |
| Period Type: |
duration |
|
| X |
- DefinitionAmount of noncash expense for share-based payment arrangement. Reference 1: http://fasb.org/us-gaap/role/ref/legacyRef
-Name Accounting Standards Codification
-Section 45
-Paragraph 28
-Subparagraph (a)
-SubTopic 10
-Topic 230
-Publisher FASB
-URI https://asc.fasb.org//1943274/2147482740/230-10-45-28
| Name: |
us-gaap_ShareBasedCompensation |
| Namespace Prefix: |
us-gaap_ |
| Data Type: |
xbrli:monetaryItemType |
| Balance Type: |
debit |
| Period Type: |
duration |
|
v3.24.0.1
Significant Accounting Policies
|
12 Months Ended |
Dec. 31, 2023 |
|---|
| Accounting Policies [Abstract] |
|
| Significant Accounting Policies |
Significant Accounting Policies Business The Company conducts its business in one segment, the manufacture of electric building wire, manufacturing a broad range of electrical wire and cables used to distribute power from the transmission grid to the wall outlet or switch. Encore’s diversified product portfolio and low-cost of production position it exceptionally well to play a key role in the transition to a more sustainable and reliable energy infrastructure. Our products are proudly made in America at our vertically-integrated, single-site, Texas campus. The Company sells its products through manufacturers’ representatives to wholesale electrical distributors servicing the residential, commercial, industrial and renewable energy sectors. Copper, a commodity product, is the principal raw material used in the Company’s manufacturing operations. The price of copper fluctuates, depending on general economic conditions and in relation to supply and demand and other factors, and has caused monthly variations in the cost of copper purchased by the Company. The Company cannot predict future copper prices or the effect of fluctuations in the cost of copper on the Company’s future operating results. Basis of Presentation The Company's financial statements have been prepared in accordance with accounting principles generally accepted in the United States (“U.S. GAAP”). In March 2020, the World Health Organization declared COVID-19 a global pandemic and recommended containment and mitigation measures worldwide. The Company is unable to predict the impact that COVID-19, or any ongoing variants, may have on our financial position and operating results in future periods. The duration or re-emergence of the outbreak and its long-term impact on our business remain uncertain. Use of Estimates The preparation of financial statements in conformity with U.S. GAAP requires management to make estimates and assumptions that affect the amounts reported in the financial statements and accompanying notes. Actual results could differ from those estimates. Revenue Recognition Our revenue is derived by fulfilling customer orders for the purchase of our products, which include electrical building wire and cable. We recognize revenue at the point in time that control of the ordered products is transferred to the customer, which is typically upon shipment to the customer from our manufacturing facilities and based on agreed upon shipping terms on the related purchase order. Amounts billed and due from our customers are classified as accounts receivable on the balance sheet and require payment on a short-term basis through standard payment terms. Revenue is measured as the amount of consideration we expect to receive in exchange for fulfilling product orders. The amount of consideration we expect to receive and revenue we recognize includes estimates for trade payment discounts and customer rebates, which are estimated using historical experience and other relevant factors and is recorded within the same period that the revenue is recognized. We review and update these estimates regularly and the impact of any adjustments are recognized in the period the adjustments are identified. The adjustments resulting from updated estimates of trade payment discounts and customer rebates were not material. Freight Expenses The Company classifies shipping and handling costs as a component of selling, general and administrative expenses. Shipping and handling costs were approximately $51.2 million, $58.9 million and $47.2 million for the years ended December 31, 2023, 2022 and 2021, respectively. Derivatives The Company may purchase copper and aluminum at current market prices for delivery in future months. These purchases meet the definition of a derivative in Accounting Standards Codification 815, Derivatives and Hedging (ASC 815). These transactions also qualify for the exclusion from derivative accounting as they meet the normal purchase and normal sale criterion in ASC 815. Fair Value of Financial Instruments Certain items are required to be measured at fair value on a recurring basis, primarily cash equivalents held in banks. Fair value is defined as the price that would be received to sell an asset or paid to transfer a liability (an exit price) in the principal or most advantageous market for the asset or liability in an orderly transaction between market participants on the measurement date. A three-level hierarchy is followed for disclosure to show the extent and level of judgment used to estimate fair value measurements: Level 1 – Inputs used to measure fair value are unadjusted quoted prices that are available in active markets for the identical assets or liabilities as of the reporting date. Level 2 – Inputs used to measure fair value, other than quoted prices included in Level 1, are either directly or indirectly observable as of the reporting date through correlation with market data, including quoted prices for similar assets and liabilities in active markets and quoted prices in markets that are not active. Level 2 also includes assets and liabilities that are valued using models or other pricing methodologies that do not require significant judgment since the input assumptions used in the models, such as interest rates and volatility factors, are corroborated by readily observable data from actively quoted markets for substantially the full term of the financial instrument. Level 3 – Inputs used to measure fair value are unobservable inputs that are supported by little or no market activity and reflect the use of significant management judgment. These values are generally determined using pricing models for which the assumptions utilize management’s estimates of market participant assumptions. At December 31, 2023 and 2022, the carrying value of cash and cash equivalents is based on Level 1 measurements. Concentrations of Credit Risk and Accounts Receivable Financial instruments that potentially subject the Company to a concentration of credit risk consist principally of cash and cash equivalents and accounts receivable. The Company places its cash and cash equivalents with high credit quality financial institutions. Accounts receivable represent amounts due from customers, primarily wholesale electrical distributors, related to the sale of the Company’s products. Such receivables are uncollateralized and are generally due from customers located throughout the United States. Encore has two customers, each of whom slightly exceeds 10% of the Company's total sales. The Company establishes an allowance for credit losses based upon the makeup of the current portfolio, past bad debt experience and current market conditions. | | | | | | | | | | | | | | | | | | | Allowance for Credit Losses (In Thousands) | 2023 | | 2022 | | 2021 | | Beginning balance January 1 | $ | 3,800 | | | $ | 3,800 | | | $ | 2,215 | | | Write-offs of bad debts | (45) | | | — | | | — | | | Collection of previous write-offs | — | | | — | | | 122 | | | Adjustment to allowance for credit losses | (1,300) | | | — | | | 1,463 | | | Ending balance at December 31 | $ | 2,455 | | | $ | 3,800 | | | $ | 3,800 | |
Cash and Cash Equivalents The Company considers all highly liquid instruments purchased with a maturity of three months or less to be cash equivalents. At December 31, 2023 and 2022, the Company’s cash equivalents consisted of investments in money market accounts with the Company’s banks. Inventories Inventories are stated at the lower of cost, using the LIFO method, or market. The Company evaluates the market value of its raw materials, work-in-process and finished goods inventory primarily based upon current raw material and finished goods prices at the end of each period. Property, Plant, and Equipment Property, plant and equipment is recorded at cost. Depreciation is recorded on a straight-line method over the estimated useful lives of the respective assets as follows: buildings and improvements, 3 to 45 years; machinery and equipment, 2 to 20 years; and furniture and fixtures, 5 to 20 years. Accelerated cost recovery methods are used for tax purposes. Repairs and maintenance costs are expensed as incurred. In accordance with its policy, the Company reviews the estimated useful lives of its fixed assets on an ongoing basis. This review indicated that the actual lives of its buildings were longer than the estimated useful lives used for depreciation purposes in the Company's financial statements. As a result, effective September 1, 2023, the Company changed some of its estimates of the useful lives of its buildings to better reflect the estimated periods during which these assets will remain in service. The estimated useful lives of some of the buildings that previously averaged 35 years were increased to an average of 45 years. The effect of this change in estimate was not material to the financial statements. Stock-Based Compensation Compensation cost for all stock-based compensation expected to vest is measured at fair value on the date of grant and recognized over the related service period. The fair value of stock awards is determined based on the number of shares granted and the quoted price of Encore’s common stock, and the fair value of stock options and stock appreciation rights is estimated on the date of grant using the Black-Scholes model. Such value is recognized as expense over the service period on a straight-line basis. Actual forfeitures are recorded as a cumulative adjustment in the period they occur. Earnings Per Share Earnings per common and common equivalent share is computed using the weighted average number of shares of common stock and common stock equivalents outstanding during each period. The dilutive effects of stock awards, which are common stock equivalents, are calculated using the treasury stock method. Income Taxes Income taxes are provided for based on the liability method, resulting in deferred income tax assets and liabilities arising due to temporary differences. Temporary differences are differences between the tax basis of assets and liabilities and their reported amounts in the financial statements that will result in taxable or deductible amounts in future years. The effect on deferred income tax assets and liabilities of a change in tax rates is recognized in income in the period the change in rate is enacted. Comprehensive Income Comprehensive income is defined as the change in equity of a business enterprise during a period from transactions and other events and circumstances from non-owner sources. There were no differences between comprehensive income and reported income in the periods presented. Recent Accounting Pronouncements The Financial Accounting Standards Board (“FASB”) Accounting Standards Codification (“ASC”) is the sole source of authoritative U.S. GAAP, along with the Securities and Exchange Commission ("SEC") and Public Company Accounting Oversight Board (“PCAOB”) issued rules and regulations that apply only to SEC registrants. The FASB issues an Accounting Standard Update (“ASU”) to communicate changes to the codification. The Company considers the applicability and impact of all ASUs. No new standards were adopted in 2023.
|
| X |
- References
+ Details
| Name: |
us-gaap_AccountingPoliciesAbstract |
| Namespace Prefix: |
us-gaap_ |
| Data Type: |
xbrli:stringItemType |
| Balance Type: |
na |
| Period Type: |
duration |
|
| X |
- DefinitionThe entire disclosure for the basis of presentation and significant accounting policies concepts. Basis of presentation describes the underlying basis used to prepare the financial statements (for example, US Generally Accepted Accounting Principles, Other Comprehensive Basis of Accounting, IFRS). Accounting policies describe all significant accounting policies of the reporting entity. Reference 1: http://fasb.org/us-gaap/role/ref/legacyRef
-Topic 235
-Name Accounting Standards Codification
-Publisher FASB
-URI https://asc.fasb.org//235/tableOfContent
| Name: |
us-gaap_BasisOfPresentationAndSignificantAccountingPoliciesTextBlock |
| Namespace Prefix: |
us-gaap_ |
| Data Type: |
dtr-types:textBlockItemType |
| Balance Type: |
na |
| Period Type: |
duration |
|
v3.24.0.1
Inventories
|
12 Months Ended |
Dec. 31, 2023 |
|---|
| Inventory Disclosure [Abstract] |
|
| Inventories |
InventoriesInventories consist of the following as of December 31: | | | | | | | | | | | | | In Thousands | 2023 | | 2022 | | Raw materials | $ | 64,512 | | | $ | 69,567 | | | Work-in-process | 55,921 | | | 42,611 | | | Finished goods | 139,348 | | | 138,943 | | | Total | 259,781 | | | 251,121 | | | Adjust to LIFO cost | (96,102) | | | (97,934) | | | | | | | Inventory, net | $ | 163,679 | | | $ | 153,187 | |
There were no liquidations of inventories that had a material impact on the Company’s results of operations for any period presented.
|
| X |
- References
+ Details
| Name: |
us-gaap_InventoryDisclosureAbstract |
| Namespace Prefix: |
us-gaap_ |
| Data Type: |
xbrli:stringItemType |
| Balance Type: |
na |
| Period Type: |
duration |
|
| X |
- DefinitionThe entire disclosure for inventory. Includes, but is not limited to, the basis of stating inventory, the method of determining inventory cost, the classes of inventory, and the nature of the cost elements included in inventory. Reference 1: http://www.xbrl.org/2003/role/disclosureRef
-Topic 330
-Name Accounting Standards Codification
-Publisher FASB
-URI https://asc.fasb.org//330/tableOfContent
| Name: |
us-gaap_InventoryDisclosureTextBlock |
| Namespace Prefix: |
us-gaap_ |
| Data Type: |
dtr-types:textBlockItemType |
| Balance Type: |
na |
| Period Type: |
duration |
|
v3.24.0.1
Property, Plant and Equipment, net
|
12 Months Ended |
Dec. 31, 2023 |
|---|
| Property, Plant and Equipment [Abstract] |
|
| Property, Plant and Equipment, net |
Property, Plant and Equipment, net Property, plant and equipment consist of the following as of December 31: | | | | | | | | | | | | | In Thousands | 2023 | | 2022 | | Land and land improvements | $ | 90,162 | | | $ | 85,286 | | | Construction-in-progress | 163,514 | | | 125,809 | | | Buildings and improvements | 313,691 | | | 232,758 | | | Machinery and equipment | 478,060 | | | 438,303 | | | Furniture and fixtures | 17,231 | | | 15,178 | | | Property, plant and equipment, gross | 1,062,658 | | | 897,334 | | | Accumulated depreciation | (305,795) | | | (280,733) | | | Property, plant and equipment, net | $ | 756,863 | | | $ | 616,601 | |
Depreciation expense for the years ended December 31, 2023, 2022 and 2021 was $31.9 million, $26.1 million and $23.2 million, respectively.
|
| X |
- References
+ Details
| Name: |
us-gaap_PropertyPlantAndEquipmentAbstract |
| Namespace Prefix: |
us-gaap_ |
| Data Type: |
xbrli:stringItemType |
| Balance Type: |
na |
| Period Type: |
duration |
|
| X |
- DefinitionThe entire disclosure for long-lived, physical asset used in normal conduct of business and not intended for resale. Includes, but is not limited to, work of art, historical treasure, and similar asset classified as collections. Reference 1: http://fasb.org/us-gaap/role/ref/legacyRef
-Topic 360
-Name Accounting Standards Codification
-Publisher FASB
-URI https://asc.fasb.org//360/tableOfContent
Reference 2: http://www.xbrl.org/2003/role/disclosureRef
-Name Accounting Standards Codification
-Section 50
-Paragraph 6
-SubTopic 360
-Topic 958
-Publisher FASB
-URI https://asc.fasb.org//1943274/2147480321/958-360-50-6
Reference 3: http://www.xbrl.org/2003/role/disclosureRef
-Name Accounting Standards Codification
-Section 50
-Paragraph 1
-Subparagraph (d)
-SubTopic 360
-Topic 958
-Publisher FASB
-URI https://asc.fasb.org//1943274/2147480321/958-360-50-1
Reference 4: http://www.xbrl.org/2003/role/disclosureRef
-Name Accounting Standards Codification
-Section 50
-Paragraph 7
-SubTopic 360
-Topic 958
-Publisher FASB
-URI https://asc.fasb.org//1943274/2147480321/958-360-50-7
| Name: |
us-gaap_PropertyPlantAndEquipmentDisclosureTextBlock |
| Namespace Prefix: |
us-gaap_ |
| Data Type: |
dtr-types:textBlockItemType |
| Balance Type: |
na |
| Period Type: |
duration |
|
v3.24.0.1
Accrued Liabilities
|
12 Months Ended |
Dec. 31, 2023 |
|---|
| Accrued Liabilities, Current [Abstract] |
|
| Accrued Liabilities |
Accrued LiabilitiesAccrued liabilities consist of the following as of December 31: | | | | | | | | | | | | | In Thousands | 2023 | | 2022 | | Sales rebates payable | $ | 39,123 | | | $ | 40,909 | | | Stock Appreciation Rights (SAR) Liability | 22,182 | | | 20,282 | | | Property taxes payable | 5,827 | | | 5,287 | | | Accrued salaries | 6,947 | | | 7,616 | | | Other accrued liabilities | 5,511 | | | 7,287 | | | Total accrued liabilities | $ | 79,590 | | | $ | 81,381 | |
|
| X |
- DefinitionThe entire disclosure for accounts payable and accrued liabilities at the end of the reporting period. Reference 1: http://fasb.org/us-gaap/role/ref/legacyRef
-Name Accounting Standards Codification
-Topic 210
-SubTopic 10
-Section S99
-Paragraph 1
-Subparagraph (SX 210.5-02.19(a),20,24)
-Publisher FASB
-URI https://asc.fasb.org//1943274/2147480566/210-10-S99-1
| Name: |
us-gaap_AccountsPayableAndAccruedLiabilitiesDisclosureTextBlock |
| Namespace Prefix: |
us-gaap_ |
| Data Type: |
dtr-types:textBlockItemType |
| Balance Type: |
na |
| Period Type: |
duration |
|
| X |
- References
+ Details
| Name: |
us-gaap_AccruedLiabilitiesCurrentAbstract |
| Namespace Prefix: |
us-gaap_ |
| Data Type: |
xbrli:stringItemType |
| Balance Type: |
na |
| Period Type: |
duration |
|
v3.24.0.1
Debt
|
12 Months Ended |
Dec. 31, 2023 |
|---|
| Debt Disclosure [Abstract] |
|
| Debt |
Debt At December 31, 2023 and 2022, the Company had no debt outstanding. On February 9, 2021, the Company terminated its previous credit agreement and entered into a new Credit Agreement (the “2021 Credit Agreement”) with two banks, Bank of America, N.A., as administrative agent and letter of credit issuer, and Wells Fargo Bank, National Association, as syndication agent. The 2021 Credit Agreement extends through February 9, 2026 and provides for maximum borrowings of $200.0 million. At our request and subject to certain conditions, the commitments under the 2021 Credit Agreement may be increased by a maximum of up to $100.0 million as long as existing or new lenders agree to provide such additional commitments. The 2021 Credit Agreement contains provisions to replace LIBOR with a replacement rate as described in the 2021 Credit Agreement. On October 20, 2022, the Company entered into the First Amendment to the 2021 Credit Agreement (the “Amended 2021 Credit Agreement”) which replaced LIBOR with BSBY as permitted under the 2021 Credit Agreement. Borrowings under the line of credit bear interest, at the Company’s option, at either (1) BSBY plus a margin that varies from 1.000% to 1.875% depending upon the Leverage Ratio (as defined in the 2021 Credit Agreement), or (2) the base rate (which is the highest of the federal funds rate plus 0.5%, the prime rate, or BSBY plus 1.0%) plus 0% to 0.375% (depending upon the Leverage Ratio). A commitment fee ranging from 0.20% to 0.325% (depending upon the Leverage Ratio) is payable on the unused line of credit. At December 31, 2023, there were no borrowings outstanding under the Amended 2021 Credit Agreement, and letters of credit outstanding in the amount of $0.3 million left $199.7 million of credit available under the Amended 2021 Credit Agreement. Obligations under the Amended 2021 Credit Agreement are the only contractual borrowing obligations or commercial borrowing commitments of the Company. Obligations under the Amended 2021 Credit Agreement are unsecured and contain customary covenants and events of default. The Company was in compliance with the covenants as of December 31, 2023. The Company paid interest totaling $0.4 million in 2023, 2022 and 2021, respectively, none of which was capitalized
|
| X |
- References
+ Details
| Name: |
us-gaap_DebtDisclosureAbstract |
| Namespace Prefix: |
us-gaap_ |
| Data Type: |
xbrli:stringItemType |
| Balance Type: |
na |
| Period Type: |
duration |
|
| X |
- DefinitionThe entire disclosure for information about short-term and long-term debt arrangements, which includes amounts of borrowings under each line of credit, note payable, commercial paper issue, bonds indenture, debenture issue, own-share lending arrangements and any other contractual agreement to repay funds, and about the underlying arrangements, rationale for a classification as long-term, including repayment terms, interest rates, collateral provided, restrictions on use of assets and activities, whether or not in compliance with debt covenants, and other matters important to users of the financial statements, such as the effects of refinancing and noncompliance with debt covenants. Reference 1: http://www.xbrl.org/2003/role/disclosureRef
-Topic 470
-SubTopic 20
-Name Accounting Standards Codification
-Section 50
-Paragraph 1B
-Subparagraph (h)
-Publisher FASB
-URI https://asc.fasb.org//1943274/2147481139/470-20-50-1B
Reference 2: http://www.xbrl.org/2003/role/disclosureRef
-Topic 235
-SubTopic 10
-Name Accounting Standards Codification
-Section S99
-Paragraph 1
-Subparagraph (SX 210.4-08(c))
-Publisher FASB
-URI https://asc.fasb.org//1943274/2147480678/235-10-S99-1
Reference 3: http://fasb.org/us-gaap/role/ref/legacyRef
-Topic 470
-Name Accounting Standards Codification
-Publisher FASB
-URI https://asc.fasb.org//470/tableOfContent
Reference 4: http://www.xbrl.org/2003/role/disclosureRef
-Topic 470
-SubTopic 20
-Name Accounting Standards Codification
-Section 50
-Paragraph 1B
-Publisher FASB
-URI https://asc.fasb.org//1943274/2147481139/470-20-50-1B
Reference 5: http://www.xbrl.org/2003/role/disclosureRef
-Topic 470
-SubTopic 20
-Name Accounting Standards Codification
-Section 50
-Paragraph 1B
-Subparagraph (g)
-Publisher FASB
-URI https://asc.fasb.org//1943274/2147481139/470-20-50-1B
Reference 6: http://www.xbrl.org/2003/role/disclosureRef
-Topic 470
-SubTopic 20
-Name Accounting Standards Codification
-Section 50
-Paragraph 1B
-Subparagraph (i)
-Publisher FASB
-URI https://asc.fasb.org//1943274/2147481139/470-20-50-1B
Reference 7: http://www.xbrl.org/2003/role/disclosureRef
-Topic 470
-SubTopic 20
-Name Accounting Standards Codification
-Section 50
-Paragraph 1C
-Subparagraph (a)
-Publisher FASB
-URI https://asc.fasb.org//1943274/2147481139/470-20-50-1C
Reference 8: http://www.xbrl.org/2003/role/disclosureRef
-Topic 470
-SubTopic 20
-Name Accounting Standards Codification
-Section 50
-Paragraph 1C
-Subparagraph (b)
-Publisher FASB
-URI https://asc.fasb.org//1943274/2147481139/470-20-50-1C
Reference 9: http://www.xbrl.org/2003/role/disclosureRef
-Topic 470
-SubTopic 20
-Name Accounting Standards Codification
-Section 50
-Paragraph 1C
-Subparagraph (c)
-Publisher FASB
-URI https://asc.fasb.org//1943274/2147481139/470-20-50-1C
Reference 10: http://www.xbrl.org/2003/role/disclosureRef
-Topic 470
-SubTopic 20
-Name Accounting Standards Codification
-Section 50
-Paragraph 1E
-Subparagraph (b)
-Publisher FASB
-URI https://asc.fasb.org//1943274/2147481139/470-20-50-1E
Reference 11: http://www.xbrl.org/2003/role/disclosureRef
-Topic 470
-SubTopic 20
-Name Accounting Standards Codification
-Section 50
-Paragraph 1I
-Subparagraph (a)
-Publisher FASB
-URI https://asc.fasb.org//1943274/2147481139/470-20-50-1I
Reference 12: http://www.xbrl.org/2003/role/disclosureRef
-Topic 470
-SubTopic 20
-Name Accounting Standards Codification
-Section 50
-Paragraph 1I
-Subparagraph (b)
-Publisher FASB
-URI https://asc.fasb.org//1943274/2147481139/470-20-50-1I
Reference 13: http://www.xbrl.org/2003/role/disclosureRef
-Topic 470
-SubTopic 20
-Name Accounting Standards Codification
-Section 50
-Paragraph 1I
-Subparagraph (d)
-Publisher FASB
-URI https://asc.fasb.org//1943274/2147481139/470-20-50-1I
| Name: |
us-gaap_DebtDisclosureTextBlock |
| Namespace Prefix: |
us-gaap_ |
| Data Type: |
dtr-types:textBlockItemType |
| Balance Type: |
na |
| Period Type: |
duration |
|
v3.24.0.1
Income Taxes
|
12 Months Ended |
Dec. 31, 2023 |
|---|
| Income Tax Disclosure [Abstract] |
|
| Income Taxes |
Income Taxes The Inflation Reduction Act (“IRA”) was enacted on August 16, 2022. The IRA includes provisions imposing a 1% excise tax on share repurchases that occur after December 31, 2022, and introduces a 15% corporate alternative minimum tax on “adjusted financial statement income” of certain large corporations (generally, corporations reporting at least $1 billion of average adjusted pre-tax net income on their consolidated financial statements). Based on application of currently available guidance, the Company does not expect the IRA to have a material adverse impact to its financial statements. The provision for income tax expense is summarized as follows for the years ended December 31: | | | | | | | | | | | | | | | | | | | In Thousands | 2023 | | 2022 | | 2021 | | Current: | | | | | | | Federal | $ | 100,472 | | | $ | 175,090 | | | $ | 143,392 | | | State | 7,428 | | | 12,379 | | | 12,319 | | | Deferred: | | | | | | | Federal | 4,115 | | | 19,797 | | | 2,132 | | | State | 227 | | | (257) | | | 132 | | | Total income tax expense | $ | 112,242 | | | $ | 207,009 | | | $ | 157,975 | |
The differences between the provision for income taxes and income taxes computed using the federal income tax rate are as follows for the years ended December 31: | | | | | | | | | | | | | In Thousands | 2023 | 2022 | 2021 | | Amount computed using the statutory rate | $ | 101,775 | | $ | 194,218 | | $ | 146,873 | | | State income taxes, net of federal tax benefit | 6,047 | | 9,576 | | 9,836 | | | 162(m) disallowance | 5,687 | | 3,244 | | 1,355 | | | | | | | | | | | Other | (1,267) | | (29) | | (89) | | | Total income tax expense | $ | 112,242 | | $ | 207,009 | | $ | 157,975 | |
The tax effect of each type of temporary difference giving rise to the net deferred tax liability at December 31 is as follows: | | | | | | | | | | | | | In Thousands | 2023 | | 2022 | | Depreciation | $ | (65,688) | | | $ | (60,304) | | | Inventory | (2,462) | | | (2,080) | | | Allowance for credit losses | 545 | | | 843 | | | Uniform capitalization rules | 1,110 | | | 574 | | | Stock-based compensation | 6,170 | | | 4,791 | | | Other | 343 | | | 536 | | | Net deferred income tax liability | $ | (59,982) | | | $ | (55,640) | |
The Company's inventory costing method for federal income tax purposes differs from the method allowed by GAAP. Both methods of inventory costing result in the same recovery of inventory. However, the timing of the recovery varies. As of December 31, 2023, the Company's tax inventory exceeds its book inventory, which created a deferred tax liability of $2.5 million. The Company made income tax payments of $97.7 million in 2023, $201.7 million in 2022 and $155.5 million in 2021. The Company’s federal income tax returns for the years subsequent to December 31, 2019 remain subject to examination. The Company’s income tax returns in major state income tax jurisdictions remain subject to examination for various periods subsequent to December 31, 2018. The Company has no reserves for uncertain tax positions as of December 31, 2023 and 2022. Interest and penalties resulting from audits by tax authorities have been immaterial and are included in the provision for income taxes in the statements of income.
|
| X |
- DefinitionThe entire disclosure for income taxes. Disclosures may include net deferred tax liability or asset recognized in an enterprise's statement of financial position, net change during the year in the total valuation allowance, approximate tax effect of each type of temporary difference and carryforward that gives rise to a significant portion of deferred tax liabilities and deferred tax assets, utilization of a tax carryback, and tax uncertainties information. Reference 1: http://www.xbrl.org/2003/role/disclosureRef
-Topic 946
-SubTopic 20
-Name Accounting Standards Codification
-Section 50
-Paragraph 13
-Publisher FASB
-URI https://asc.fasb.org//1943274/2147480990/946-20-50-13
Reference 2: http://www.xbrl.org/2003/role/disclosureRef
-Topic 235
-SubTopic 10
-Name Accounting Standards Codification
-Section S99
-Paragraph 1
-Subparagraph (SX 210.4-08(h)(2))
-Publisher FASB
-URI https://asc.fasb.org//1943274/2147480678/235-10-S99-1
Reference 3: http://www.xbrl.org/2003/role/disclosureRef
-Topic 740
-Name Accounting Standards Codification
-Publisher FASB
-URI https://asc.fasb.org//740/tableOfContent
Reference 4: http://www.xbrl.org/2003/role/disclosureRef
-Topic 740
-SubTopic 10
-Name Accounting Standards Codification
-Section 50
-Paragraph 14
-Publisher FASB
-URI https://asc.fasb.org//1943274/2147482685/740-10-50-14
Reference 5: http://www.xbrl.org/2003/role/disclosureRef
-Topic 740
-SubTopic 10
-Name Accounting Standards Codification
-Section 50
-Paragraph 21
-Publisher FASB
-URI https://asc.fasb.org//1943274/2147482685/740-10-50-21
Reference 6: http://www.xbrl.org/2003/role/disclosureRef
-Topic 740
-SubTopic 270
-Name Accounting Standards Codification
-Section 50
-Paragraph 1
-Publisher FASB
-URI https://asc.fasb.org//1943274/2147482526/740-270-50-1
Reference 7: http://www.xbrl.org/2003/role/disclosureRef
-Topic 740
-SubTopic 10
-Name Accounting Standards Codification
-Section 50
-Paragraph 17
-Subparagraph (b)
-Publisher FASB
-URI https://asc.fasb.org//1943274/2147482685/740-10-50-17
Reference 8: http://www.xbrl.org/2003/role/disclosureRef
-Topic 740
-SubTopic 10
-Name Accounting Standards Codification
-Section S99
-Paragraph 1
-Subparagraph (SAB TOPIC 6.I.5.Q1)
-Publisher FASB
-URI https://asc.fasb.org//1943274/2147479360/740-10-S99-1
Reference 9: http://www.xbrl.org/2003/role/disclosureRef
-Topic 740
-SubTopic 10
-Name Accounting Standards Codification
-Section S99
-Paragraph 2
-Subparagraph (SAB Topic 11.C)
-Publisher FASB
-URI https://asc.fasb.org//1943274/2147479360/740-10-S99-2
Reference 10: http://www.xbrl.org/2003/role/disclosureRef
-Topic 740
-SubTopic 30
-Name Accounting Standards Codification
-Section 50
-Paragraph 2
-Subparagraph (a)
-Publisher FASB
-URI https://asc.fasb.org//1943274/2147482603/740-30-50-2
| Name: |
us-gaap_IncomeTaxDisclosureTextBlock |
| Namespace Prefix: |
us-gaap_ |
| Data Type: |
dtr-types:textBlockItemType |
| Balance Type: |
na |
| Period Type: |
duration |
|
v3.24.0.1
Stock-Based Compensation
|
12 Months Ended |
Dec. 31, 2023 |
|---|
| Share-Based Payment Arrangement [Abstract] |
|
| Stock-Based Compensation |
Stock-Based CompensationTotal stock-based compensation expense by type of award was as follows for the years ended December 31: | | | | | | | | | | | | | | | | | | | In Thousands | 2023 | | 2022 | | 2021 | | Restricted Stock Units | $ | 20,738 | | | $ | 9,054 | | | $ | 1,889 | | | Stock grants | 1,018 | | | 724 | | | 489 | | | Stock options | 21 | | | 289 | | | 435 | | | Stock appreciation rights (“SARs”) | 23,438 | | | 7,319 | | | 22,188 | | | Restricted Stock Awards | 986 | | | 1,005 | | | 1,005 | | | Total stock-based compensation expense | $ | 46,201 | | | $ | 18,391 | | | $ | 26,006 | |
In 2020, the Board of Directors adopted a new incentive plan called the Encore Wire 2020 Long Term Incentive Plan (the “2020 LTIP”) which was approved by the Company’s stockholders at the 2020 Annual Meeting of Stockholders. The 2020 LTIP permits the granting of 1,000,000 securities in the form of options to purchase shares of common stock, stock appreciation rights, restricted common stock, restricted stock units, unrestricted common stock, dividend equivalents, cash awards, or performance awards to non-employee directors, officers and employees of the Company. As of December 31, 2023, 463,550 securities remained available for grant under the 2020 LTIP. Restricted Stock Units: Restricted units granted to employees vest ratably over a period of three years from the time the restricted units were granted. During the years ended December 31, 2023, 2022, and 2021 the Company granted 236,800 units, 177,200 units, and 98,600 units respectively, of restricted stock to employees pursuant to the 2020 Long Term Incentive Plan, with weighted grant date fair values of $149.62, $127.58, and $61.92 per unit, respectively. As of December 31, 2023, there was $32.3 million of total unrecognized compensation cost related to unvested units. That cost is expected to be recognized over a weighted-average period of 1.8 years. The following presents a summary of restricted stock activity for the year ended December 31, 2023: | | | | | | | | | | | Weighted Average | | Number of Units | Grant Date Fair Value | Outstanding at January 1, 2023 | 241,436 | | $ | 109.69 | | | Granted | 236,800 | | 149.62 | | | Vested | (91,432) | | 103.97 | | | Forfeited/Canceled | — | | — | | Unvested at December 31, 2023 | 386,804 | | $ | 135.49 | |
Stock Grants: In May 2023, the Company granted 1,250 shares of stock to each of the 5 non-employee directors, with a grant date fair value of $162.93 per share. In May 2022, the Company granted 1,250 shares of stock to 4 non-employee directors with a grant date fair value of $123.45 per share. In September 2022, the Company granted 850 shares of stock to 1 non-employee director with a grant date fair value of $125.37 per share. In May 2021, the Company granted 1,250 shares of stock to each of the 5 non-employee directors, with a grant date fair value of $78.29 per share. Stock Options: No stock option awards were granted in 2023, 2022 or 2021. Options vest ratably over a period of five years from the time the options were granted. The maximum term of any option previously granted under the 2010 Stock Option Plan or granted in the future under the 2020 LTIP is ten years. New shares are issued upon the exercise of options. The following presents a summary of stock option activity for the year ended December 31, 2023: | | | | | | | | | | | | | | | | | | | | | | | | | Number
of
Shares | | Weighted
Average
Exercise
Price | | Weighted
Average
Remaining
Contractual
Term | | Aggregate
Intrinsic Value
(In Thousands) | | Outstanding at January 1, 2023 | 275,500 | | | $ | 43.06 | | | | | | | | | | | | | | | Exercised | (22,000) | | | 42.53 | | | | | | | Forfeited/Canceled | — | | | — | | | | | | | Outstanding at December 31, 2023 | 253,500 | | | $ | 43.10 | | | 2.7 years | | $ | 43,222 | | | Vested and exercisable at December 31, 2023 | 253,500 | | | $ | 43.10 | | | 2.7 years | | $ | 43,222 | |
During the years ended December 31, 2023, 2022 and 2021, the total intrinsic value of options exercised was $2.9 million, $0.2 million and $3.1 million, respectively. As of December 31, 2023, there was no unrecognized compensation cost related to non-vested stock options. Stock Appreciation Rights: In 2014, the Board of Directors adopted a new stock appreciation rights plan called the Encore Wire 2014 Stock Appreciation Rights Plan (the “2014 SARs Plan”). The 2014 SARs Plan permits the grant of SARs that may only be settled in cash to non-executive officers and employees of the Company. SARs granted to employees vest ratably over a period of five years from the time the SARs were granted. The maximum term of any SARs granted under the 2014 SARs Plan is ten years. These awards are classified as liability awards. The liability balances were $22.2 million and $20.3 million at December 31, 2023 and 2022, respectively, and are included in accrued liabilities. Compensation cost for these awards is determined using a fair value method and remeasured at each reporting date until the date of settlement. As of December 31, 2023, a total of 172,008 SARs were outstanding under the 2014 SARs Plan. No SARs were granted subsequent to 2020 as this plan was replaced with a long-term deferred cash compensation plan. The following presents a summary of SARs activity for the year ended December 31, 2023: | | | | | | | | | | | | | | | | | | | | | | | | | Cash-settled SARs | | Weighted
Average
Exercise
Price | | Weighted
Average
Remaining
Contractual
Term | | Aggregate
Intrinsic Value
(In Thousands) | Outstanding at January 1, 2023 | 332,164 | | | $ | 54.18 | | | | | | | | | | | | | | | Exercised | (153,556) | | | 52.82 | | | | | | | Forfeited/Canceled | (6,600) | | | 56.47 | | | | | | Outstanding at December 31, 2023 | 172,008 | | | $ | 55.31 | | | 5.4 years | | $ | 27,228 | | Vested and exercisable at December 31, 2023 | 69,608 | | | $ | 53.51 | | | 5.0 years | | $ | 11,143 | |
The fair value of SARs outstanding during the years ended December 31, 2023, 2022 and 2021, are revalued each quarter using a Black-Scholes option pricing model and the following weighted average assumptions: | | | | | | | | | | | | | | | | | | | Year Ended December 31, | | 2023 | | 2022 | | 2021 | | Risk-free interest rate | 5.17 | % | | 4.46 | % | | 0.70 | % | | Expected dividend yield | 0.04 | % | | 0.06 | % | | 0.06 | % | | Expected volatility | 32.60 | % | | 44.03 | % | | 38.64 | % | | Expected lives | 0.6 years | | 1.3 years | | 2.1 years |
The Company bases expected volatilities on historical volatilities of Encore's common stock. The expected life represents the weighted average period of time that options granted are expected to be outstanding giving consideration to vesting periods and management’s consideration of historical exercise patterns. The risk-free rate is based on the U.S. Treasury yield curve in effect at the time of grant for periods corresponding to the expected life of the option. The expected dividend yield is based on the annualized dividend payment paid on common shares. During the years ended December 31, 2023, 2022 and 2021, the weighted average fair value of SARs was $159.92, $87.20 and $90.04, respectively, and the total intrinsic value of SARs exercised was $21.5 million, $9.1 million and $5.4 million, respectively. As of December 31, 2023, total unrecognized compensation cost related to non-vested SARs of $5.3 million was expected to be recognized over a weighted average period of 1.0 years. Restricted Stock Awards: Restricted shares granted to employees vest ratably over a period of five years from the time the restricted shares were granted. No restricted shares were granted subsequent to 2020. As of December 31, 2023, there was $0.4 million of total unrecognized compensation cost related to unvested shares. That cost is expected to be recognized over a weighted-average period of 0.8 years. The total fair value of shares vested during the year ending December 31, 2023 was $4.4 million. The following presents a summary of restricted stock activity for the year ended December 31, 2023: | | | | | | | | | | | Weighted Average | | Number of Shares | Grant Date Fair Value | Outstanding at January 1, 2023 | 41,000 | | $ | 57.00 | | | Granted | — | | — | | | Vested | (26,000) | | 56.60 | | | | | Unvested at December 31, 2023 | 15,000 | | $ | 57.69 | |
|
| X |
- DefinitionThe entire disclosure for share-based payment arrangement. Reference 1: http://www.xbrl.org/2003/role/exampleRef
-Topic 718
-SubTopic 10
-Name Accounting Standards Codification
-Section 50
-Paragraph 2
-Subparagraph (a)(1)
-Publisher FASB
-URI https://asc.fasb.org//1943274/2147480429/718-10-50-2
Reference 2: http://www.xbrl.org/2003/role/disclosureRef
-Topic 718
-Name Accounting Standards Codification
-Publisher FASB
-URI https://asc.fasb.org//718/tableOfContent
Reference 3: http://www.xbrl.org/2003/role/disclosureRef
-Topic 718
-SubTopic 10
-Name Accounting Standards Codification
-Section 50
-Paragraph 2
-Subparagraph (a)
-Publisher FASB
-URI https://asc.fasb.org//1943274/2147480429/718-10-50-2
Reference 4: http://www.xbrl.org/2003/role/disclosureRef
-Topic 718
-SubTopic 10
-Name Accounting Standards Codification
-Section 50
-Paragraph 2
-Subparagraph (h)(2)
-Publisher FASB
-URI https://asc.fasb.org//1943274/2147480429/718-10-50-2
Reference 5: http://www.xbrl.org/2003/role/disclosureRef
-Topic 718
-SubTopic 10
-Name Accounting Standards Codification
-Section 50
-Paragraph 2
-Subparagraph (h)(2)(i)
-Publisher FASB
-URI https://asc.fasb.org//1943274/2147480429/718-10-50-2
Reference 6: http://www.xbrl.org/2003/role/disclosureRef
-Topic 718
-SubTopic 10
-Name Accounting Standards Codification
-Section 50
-Paragraph 2
-Subparagraph (l)
-Publisher FASB
-URI https://asc.fasb.org//1943274/2147480429/718-10-50-2
| Name: |
us-gaap_DisclosureOfCompensationRelatedCostsShareBasedPaymentsTextBlock |
| Namespace Prefix: |
us-gaap_ |
| Data Type: |
dtr-types:textBlockItemType |
| Balance Type: |
na |
| Period Type: |
duration |
|
v3.24.0.1
Earnings Per Share
|
12 Months Ended |
Dec. 31, 2023 |
|---|
| Earnings Per Share [Abstract] |
|
| Earnings Per Share |
Earnings Per ShareThe following table sets forth certain components of the computation of basic and diluted earnings per share for the years ended December 31: | | | | | | | | | | | | | | | | | | | In Thousands | 2023 | | 2022 | | 2021 | | Numerator: | | | | | | | Net income | $ | 372,399 | | | $ | 717,841 | | | $ | 541,422 | | | | | | | | | Denominator: | | | | | | | Denominator for basic earnings per share – weighted average shares | 16,873 | | | 19,159 | | | 20,439 | | | | | | | | | Effect of dilutive securities: | | | | | | | Employee stock awards | 350 | | | 287 | | | 210 | | | | | | | | | Denominator for diluted earnings per share – weighted average shares | 17,223 | | | 19,446 | | | 20,649 | |
Stock options to purchase common stock at exercise prices in excess of the average actual stock price for the period that were anti-dilutive and that were excluded from the determination of diluted earnings per share are as follows: | | | | | | | | | | | | | | | | | | | In Thousands, Except Per Share Data | 2023 | | 2022 | | 2021 | | Weighted average anti-dilutive stock options | — | | | — | | | — | | | | | | | | | Weighted average exercise price per share | $ | — | | | $ | — | | | $ | — | |
|
| X |
- References
+ Details
| Name: |
us-gaap_EarningsPerShareAbstract |
| Namespace Prefix: |
us-gaap_ |
| Data Type: |
xbrli:stringItemType |
| Balance Type: |
na |
| Period Type: |
duration |
|
| X |
- DefinitionThe entire disclosure for earnings per share. Reference 1: http://www.xbrl.org/2003/role/disclosureRef
-Topic 260
-SubTopic 10
-Name Accounting Standards Codification
-Section 50
-Paragraph 1
-Subparagraph (c)
-Publisher FASB
-URI https://asc.fasb.org//1943274/2147482662/260-10-50-1
Reference 2: http://www.xbrl.org/2003/role/disclosureRef
-Topic 260
-Name Accounting Standards Codification
-Publisher FASB
-URI https://asc.fasb.org//260/tableOfContent
Reference 3: http://www.xbrl.org/2003/role/disclosureRef
-Topic 260
-SubTopic 10
-Name Accounting Standards Codification
-Section 50
-Paragraph 2
-Publisher FASB
-URI https://asc.fasb.org//1943274/2147482662/260-10-50-2
Reference 4: http://www.xbrl.org/2003/role/disclosureRef
-Topic 260
-SubTopic 10
-Name Accounting Standards Codification
-Section 50
-Paragraph 3
-Publisher FASB
-URI https://asc.fasb.org//1943274/2147482662/260-10-50-3
| Name: |
us-gaap_EarningsPerShareTextBlock |
| Namespace Prefix: |
us-gaap_ |
| Data Type: |
dtr-types:textBlockItemType |
| Balance Type: |
na |
| Period Type: |
duration |
|
v3.24.0.1
Stockholders' Equity
|
12 Months Ended |
Dec. 31, 2023 |
|---|
| Equity [Abstract] |
|
| Stockholders' Equity |
Stockholders’ Equity On November 10, 2006, the Board of Directors approved a stock repurchase program authorizing the Company to repurchase up to an authorized number of shares of its common stock from time to time in the open market or private transactions at the Company's discretion. This authorization originally expired on December 31, 2007, and the Company’s Board of Directors has authorized several increases and annual extensions of this stock repurchase program, most recently in June 2023, authorizing the repurchase of up to 2,000,000 shares of our common stock. As of December 31, 2023, 813,617 shares remained authorized for repurchase through March 31, 2024. Under this program, the Company repurchased 2,661,792 shares of its stock in 2023, 2,055,470 shares in 2022 and 475,557 shares in 2021. Subsequently, in February 2024, the Board of Directors extended the repurchase authorization for up to 2,000,000 shares of our common stock through March 31, 2025.
|
| X |
- References
+ Details
| Name: |
us-gaap_EquityAbstract |
| Namespace Prefix: |
us-gaap_ |
| Data Type: |
xbrli:stringItemType |
| Balance Type: |
na |
| Period Type: |
duration |
|
| X |
- DefinitionThe entire disclosure for equity. Reference 1: http://www.xbrl.org/2003/role/disclosureRef
-Topic 505
-SubTopic 10
-Name Accounting Standards Codification
-Section 50
-Paragraph 13
-Subparagraph (b)
-Publisher FASB
-URI https://asc.fasb.org//1943274/2147481112/505-10-50-13
Reference 2: http://www.xbrl.org/2003/role/disclosureRef
-Topic 505
-SubTopic 10
-Name Accounting Standards Codification
-Section 50
-Paragraph 13
-Subparagraph (h)
-Publisher FASB
-URI https://asc.fasb.org//1943274/2147481112/505-10-50-13
Reference 3: http://www.xbrl.org/2003/role/disclosureRef
-Topic 505
-SubTopic 10
-Name Accounting Standards Codification
-Section 50
-Paragraph 14
-Subparagraph (b)
-Publisher FASB
-URI https://asc.fasb.org//1943274/2147481112/505-10-50-14
Reference 4: http://www.xbrl.org/2003/role/disclosureRef
-Topic 946
-SubTopic 235
-Name Accounting Standards Codification
-Section 50
-Paragraph 2
-Subparagraph (a)
-Publisher FASB
-URI https://asc.fasb.org//1943274/2147481062/946-235-50-2
Reference 5: http://www.xbrl.org/2003/role/disclosureRef
-Topic 946
-SubTopic 235
-Name Accounting Standards Codification
-Section 50
-Paragraph 2
-Subparagraph (d)
-Publisher FASB
-URI https://asc.fasb.org//1943274/2147481062/946-235-50-2
Reference 6: http://www.xbrl.org/2003/role/disclosureRef
-Topic 946
-SubTopic 505
-Name Accounting Standards Codification
-Section 50
-Paragraph 6
-Publisher FASB
-URI https://asc.fasb.org//1943274/2147481004/946-505-50-6
Reference 7: http://www.xbrl.org/2003/role/disclosureRef
-Topic 815
-SubTopic 40
-Name Accounting Standards Codification
-Section 50
-Paragraph 6
-Subparagraph (a)
-Publisher FASB
-URI https://asc.fasb.org//1943274/2147480237/815-40-50-6
Reference 8: http://www.xbrl.org/2003/role/disclosureRef
-Topic 505
-SubTopic 10
-Name Accounting Standards Codification
-Section S99
-Paragraph 1
-Subparagraph (SX 210.3-04)
-Publisher FASB
-URI https://asc.fasb.org//1943274/2147480008/505-10-S99-1
Reference 9: http://www.xbrl.org/2003/role/disclosureRef
-Topic 235
-SubTopic 10
-Name Accounting Standards Codification
-Section S99
-Paragraph 1
-Subparagraph (SX 210.4-08(e)(1))
-Publisher FASB
-URI https://asc.fasb.org//1943274/2147480678/235-10-S99-1
Reference 10: http://fasb.org/us-gaap/role/ref/legacyRef
-Topic 505
-Name Accounting Standards Codification
-Publisher FASB
-URI https://asc.fasb.org//505/tableOfContent
Reference 11: http://www.xbrl.org/2003/role/disclosureRef
-Topic 505
-SubTopic 10
-Name Accounting Standards Codification
-Section 50
-Paragraph 13
-Publisher FASB
-URI https://asc.fasb.org//1943274/2147481112/505-10-50-13
Reference 12: http://www.xbrl.org/2003/role/disclosureRef
-Topic 505
-SubTopic 10
-Name Accounting Standards Codification
-Section 50
-Paragraph 13
-Subparagraph (g)
-Publisher FASB
-URI https://asc.fasb.org//1943274/2147481112/505-10-50-13
Reference 13: http://www.xbrl.org/2003/role/disclosureRef
-Topic 505
-SubTopic 10
-Name Accounting Standards Codification
-Section 50
-Paragraph 13
-Subparagraph (i)
-Publisher FASB
-URI https://asc.fasb.org//1943274/2147481112/505-10-50-13
Reference 14: http://www.xbrl.org/2003/role/disclosureRef
-Topic 505
-SubTopic 10
-Name Accounting Standards Codification
-Section 50
-Paragraph 14
-Subparagraph (a)
-Publisher FASB
-URI https://asc.fasb.org//1943274/2147481112/505-10-50-14
Reference 15: http://www.xbrl.org/2003/role/disclosureRef
-Topic 505
-SubTopic 10
-Name Accounting Standards Codification
-Section 50
-Paragraph 14
-Subparagraph (c)
-Publisher FASB
-URI https://asc.fasb.org//1943274/2147481112/505-10-50-14
Reference 16: http://www.xbrl.org/2003/role/disclosureRef
-Topic 505
-SubTopic 10
-Name Accounting Standards Codification
-Section 50
-Paragraph 16
-Subparagraph (b)
-Publisher FASB
-URI https://asc.fasb.org//1943274/2147481112/505-10-50-16
Reference 17: http://www.xbrl.org/2003/role/disclosureRef
-Topic 505
-SubTopic 10
-Name Accounting Standards Codification
-Section 50
-Paragraph 18
-Subparagraph (a)
-Publisher FASB
-URI https://asc.fasb.org//1943274/2147481112/505-10-50-18
Reference 18: http://www.xbrl.org/2003/role/disclosureRef
-Topic 505
-SubTopic 10
-Name Accounting Standards Codification
-Section 50
-Paragraph 18
-Subparagraph (b)
-Publisher FASB
-URI https://asc.fasb.org//1943274/2147481112/505-10-50-18
Reference 19: http://www.xbrl.org/2003/role/disclosureRef
-Topic 505
-SubTopic 10
-Name Accounting Standards Codification
-Section 50
-Paragraph 18
-Subparagraph (d)
-Publisher FASB
-URI https://asc.fasb.org//1943274/2147481112/505-10-50-18
| Name: |
us-gaap_StockholdersEquityNoteDisclosureTextBlock |
| Namespace Prefix: |
us-gaap_ |
| Data Type: |
dtr-types:textBlockItemType |
| Balance Type: |
na |
| Period Type: |
duration |
|
v3.24.0.1
Contingencies
|
12 Months Ended |
Dec. 31, 2023 |
|---|
| Commitments and Contingencies Disclosure [Abstract] |
|
| Contingencies |
ContingenciesThere are no material pending proceedings to which the Company is a party or to which any of its property is subject. However, the Company is from time to time involved in litigation, certain other claims and arbitration matters arising in the ordinary course of its business.
|
| X |
- References
+ Details
| Name: |
us-gaap_CommitmentsAndContingenciesDisclosureAbstract |
| Namespace Prefix: |
us-gaap_ |
| Data Type: |
xbrli:stringItemType |
| Balance Type: |
na |
| Period Type: |
duration |
|
| X |
- DefinitionThe entire disclosure for commitments and contingencies. Reference 1: http://www.xbrl.org/2003/role/disclosureRef
-Topic 440
-SubTopic 10
-Name Accounting Standards Codification
-Section 50
-Paragraph 4
-Subparagraph (a)
-Publisher FASB
-URI https://asc.fasb.org//1943274/2147482648/440-10-50-4
Reference 2: http://www.xbrl.org/2009/role/commonPracticeRef
-Topic 450
-Name Accounting Standards Codification
-Publisher FASB
-URI https://asc.fasb.org//450/tableOfContent
Reference 3: http://www.xbrl.org/2003/role/disclosureRef
-Topic 954
-SubTopic 440
-Name Accounting Standards Codification
-Section 50
-Paragraph 1
-Subparagraph (a)
-Publisher FASB
-URI https://asc.fasb.org//1943274/2147480327/954-440-50-1
Reference 4: http://www.xbrl.org/2003/role/disclosureRef
-Topic 440
-SubTopic 10
-Name Accounting Standards Codification
-Section 50
-Paragraph 4
-Subparagraph (c)
-Publisher FASB
-URI https://asc.fasb.org//1943274/2147482648/440-10-50-4
Reference 5: http://fasb.org/us-gaap/role/ref/legacyRef
-Topic 440
-Name Accounting Standards Codification
-Publisher FASB
-URI https://asc.fasb.org//440/tableOfContent
| Name: |
us-gaap_CommitmentsAndContingenciesDisclosureTextBlock |
| Namespace Prefix: |
us-gaap_ |
| Data Type: |
dtr-types:textBlockItemType |
| Balance Type: |
na |
| Period Type: |
duration |
|
v3.24.0.1
Encore Wire Corporation 401(k) Profit Sharing Plan
|
12 Months Ended |
Dec. 31, 2023 |
|---|
| Retirement Benefits [Abstract] |
|
| Encore Wire Corporation 401(k) Profit Sharing Plan |
Encore Wire Corporation 401(k) Profit Sharing PlanThe Company sponsors a 401(k) profit sharing plan (the “Plan”) that permits eligible employees to make self-directed contributions of their compensation, a portion of which is matched by the Company, subject to applicable limitations. At the discretion of its Board of Directors, the Company may, but is not required to, make profit-sharing contributions to the Plan on behalf of its employees. The Company’s matching contributions were $4.3 million, $3.7 million and $3.0 million in 2023, 2022 and 2021, respectively.
|
| X |
- References
+ Details
| Name: |
us-gaap_CompensationAndRetirementDisclosureAbstract |
| Namespace Prefix: |
us-gaap_ |
| Data Type: |
xbrli:stringItemType |
| Balance Type: |
na |
| Period Type: |
duration |
|
| X |
- DefinitionThe entire disclosure for retirement benefits. Reference 1: http://www.xbrl.org/2003/role/disclosureRef
-Topic 715
-SubTopic 70
-Name Accounting Standards Codification
-Section 50
-Paragraph 1
-Publisher FASB
-URI https://asc.fasb.org//1943274/2147480794/715-70-50-1
Reference 2: http://www.xbrl.org/2003/role/exampleRef
-Topic 715
-SubTopic 20
-Name Accounting Standards Codification
-Section 55
-Paragraph 17
-Publisher FASB
-URI https://asc.fasb.org//1943274/2147480482/715-20-55-17
Reference 3: http://www.xbrl.org/2003/role/disclosureRef
-Topic 715
-SubTopic 20
-Name Accounting Standards Codification
-Section 50
-Paragraph 1
-Subparagraph (d)(iv)(03)
-Publisher FASB
-URI https://asc.fasb.org//1943274/2147480506/715-20-50-1
Reference 4: http://www.xbrl.org/2003/role/disclosureRef
-Topic 715
-SubTopic 20
-Name Accounting Standards Codification
-Section 50
-Paragraph 1
-Subparagraph (d)(i)
-Publisher FASB
-URI https://asc.fasb.org//1943274/2147480506/715-20-50-1
Reference 5: http://www.xbrl.org/2003/role/disclosureRef
-Topic 715
-SubTopic 20
-Name Accounting Standards Codification
-Section 50
-Paragraph 1
-Subparagraph (q)
-Publisher FASB
-URI https://asc.fasb.org//1943274/2147480506/715-20-50-1
Reference 6: http://www.xbrl.org/2003/role/disclosureRef
-Topic 715
-SubTopic 20
-Name Accounting Standards Codification
-Section 50
-Paragraph 1
-Subparagraph (l)
-Publisher FASB
-URI https://asc.fasb.org//1943274/2147480506/715-20-50-1
Reference 7: http://www.xbrl.org/2003/role/disclosureRef
-Topic 715
-Name Accounting Standards Codification
-Publisher FASB
-URI https://asc.fasb.org//715/tableOfContent
Reference 8: http://www.xbrl.org/2003/role/disclosureRef
-Topic 715
-SubTopic 20
-Name Accounting Standards Codification
-Section 50
-Paragraph 1
-Subparagraph (d)(iii)
-Publisher FASB
-URI https://asc.fasb.org//1943274/2147480506/715-20-50-1
Reference 9: http://www.xbrl.org/2003/role/disclosureRef
-Topic 715
-SubTopic 20
-Name Accounting Standards Codification
-Section 50
-Paragraph 1
-Subparagraph (o)
-Publisher FASB
-URI https://asc.fasb.org//1943274/2147480506/715-20-50-1
Reference 10: http://www.xbrl.org/2003/role/disclosureRef
-Topic 715
-SubTopic 20
-Name Accounting Standards Codification
-Section 50
-Paragraph 1
-Subparagraph (p)
-Publisher FASB
-URI https://asc.fasb.org//1943274/2147480506/715-20-50-1
Reference 11: http://www.xbrl.org/2003/role/disclosureRef
-Topic 715
-SubTopic 20
-Name Accounting Standards Codification
-Section 50
-Paragraph 1
-Subparagraph (r)(1)
-Publisher FASB
-URI https://asc.fasb.org//1943274/2147480506/715-20-50-1
Reference 12: http://www.xbrl.org/2003/role/disclosureRef
-Topic 715
-SubTopic 20
-Name Accounting Standards Codification
-Section 50
-Paragraph 1
-Subparagraph (r)(2)
-Publisher FASB
-URI https://asc.fasb.org//1943274/2147480506/715-20-50-1
Reference 13: http://www.xbrl.org/2003/role/disclosureRef
-Topic 715
-SubTopic 20
-Name Accounting Standards Codification
-Section S99
-Paragraph 2
-Publisher FASB
-URI https://asc.fasb.org//1943274/2147480126/715-20-S99-2
Reference 14: http://www.xbrl.org/2003/role/disclosureRef
-Topic 715
-SubTopic 60
-Name Accounting Standards Codification
-Section 50
-Paragraph 3
-Subparagraph (c)
-Publisher FASB
-URI https://asc.fasb.org//1943274/2147480266/715-60-50-3
| Name: |
us-gaap_PensionAndOtherPostretirementBenefitsDisclosureTextBlock |
| Namespace Prefix: |
us-gaap_ |
| Data Type: |
dtr-types:textBlockItemType |
| Balance Type: |
na |
| Period Type: |
duration |
|
v3.24.0.1
Quarterly Financial Information (Unaudited)
|
12 Months Ended |
Dec. 31, 2023 |
|---|
| Quarterly Financial Information Disclosure [Abstract] |
|
| Quarterly Financial Information (Unaudited) |
Quarterly Financial Information (Unaudited)The following is a summary of the unaudited quarterly financial information for the two years ended December 31, 2023 and 2022 (in thousands, except per share data): | | | | | | | | | | | | | | | | | | | | | | | | | | Three Months Ended | | 2023 | March 31 | | June 30 | | September 30 | | December 31 | | Net sales | $ | 660,492 | | | $ | 636,460 | | | $ | 636,991 | | | $ | 633,779 | | | Gross profit | 205,085 | | | 166,148 | | | 148,242 | | | 136,408 | | | Net income | 119,483 | | | 104,741 | | | 82,052 | | | 66,123 | | | Earnings per common share – basic | 6.60 | | | 6.13 | | | 4.93 | | | 4.21 | | | Earnings per common share – diluted | 6.50 | | | 6.01 | | | 4.82 | | | 4.10 | |
| | | | | | | | | | | | | | | | | | | | | | | | | | Three Months Ended | | 2022 | March 31 | | June 30 | | September 30 | | December 31 | | Net sales | $ | 723,072 | | | $ | 838,235 | | | $ | 762,363 | | | $ | 693,885 | | | Gross profit | 243,747 | | | 320,772 | | | 299,447 | | | 248,455 | | | Net income | 161,531 | | | 210,538 | | | 191,773 | | | 153,998 | | | Earnings per common share – basic | 8.08 | | | 10.84 | | | 10.11 | | | 8.43 | | | Earnings per common share – diluted | 7.96 | | | 10.71 | | | 9.97 | | | 8.28 | |
|
| X |
- DefinitionThe entire disclosure for quarterly financial data. Includes, but is not limited to, tabular presentation of financial information for fiscal quarters, effect of year-end adjustments, and an explanation of matters or transactions that affect comparability of the information. Reference 1: http://www.xbrl.org/2003/role/disclosureRef
-Topic 270
-SubTopic 10
-Name Accounting Standards Codification
-Section 50
-Paragraph 1B
-Publisher FASB
-URI https://asc.fasb.org//1943274/2147482964/270-10-50-1B
Reference 2: http://fasb.org/us-gaap/role/ref/legacyRef
-Topic 270
-Name Accounting Standards Codification
-Publisher FASB
-URI https://asc.fasb.org//270/tableOfContent
| Name: |
us-gaap_QuarterlyFinancialInformationTextBlock |
| Namespace Prefix: |
us-gaap_ |
| Data Type: |
dtr-types:textBlockItemType |
| Balance Type: |
na |
| Period Type: |
duration |
|
v3.24.0.1
Pay vs Performance Disclosure - USD ($)
$ in Thousands |
3 Months Ended |
12 Months Ended |
Dec. 31, 2023 |
Sep. 30, 2023 |
Jun. 30, 2023 |
Mar. 31, 2023 |
Dec. 31, 2022 |
Sep. 30, 2022 |
Jun. 30, 2022 |
Mar. 31, 2022 |
Dec. 31, 2023 |
Dec. 31, 2022 |
Dec. 31, 2021 |
| Pay vs Performance Disclosure |
|
|
|
|
|
|
|
|
|
|
|
| Net income |
$ 66,123
|
$ 82,052
|
$ 104,741
|
$ 119,483
|
$ 153,998
|
$ 191,773
|
$ 210,538
|
$ 161,531
|
$ 372,399
|
$ 717,841
|
$ 541,422
|
| X |
- ReferencesReference 1: http://www.xbrl.org/2003/role/presentationRef
-Publisher SEC
-Name Regulation S-K
-Number 229
-Section 402
-Subsection v
-Paragraph 1
| Name: |
ecd_PvpTable |
| Namespace Prefix: |
ecd_ |
| Data Type: |
xbrli:stringItemType |
| Balance Type: |
na |
| Period Type: |
duration |
|
| X |
- DefinitionThe portion of profit or loss for the period, net of income taxes, which is attributable to the parent. Reference 1: http://www.xbrl.org/2003/role/disclosureRef
-Topic 235
-SubTopic 10
-Name Accounting Standards Codification
-Section S99
-Paragraph 1
-Subparagraph (SX 210.4-08(g)(1)(ii))
-Publisher FASB
-URI https://asc.fasb.org//1943274/2147480678/235-10-S99-1
Reference 2: http://www.xbrl.org/2003/role/disclosureRef
-Topic 323
-SubTopic 10
-Name Accounting Standards Codification
-Section 50
-Paragraph 3
-Subparagraph (c)
-Publisher FASB
-URI https://asc.fasb.org//1943274/2147481687/323-10-50-3
Reference 3: http://www.xbrl.org/2003/role/disclosureRef
-Topic 825
-SubTopic 10
-Name Accounting Standards Codification
-Section 50
-Paragraph 28
-Subparagraph (f)
-Publisher FASB
-URI https://asc.fasb.org//1943274/2147482907/825-10-50-28
Reference 4: http://www.xbrl.org/2003/role/disclosureRef
-Topic 220
-SubTopic 10
-Name Accounting Standards Codification
-Section 50
-Paragraph 6
-Publisher FASB
-URI https://asc.fasb.org//1943274/2147482765/220-10-50-6
Reference 5: http://www.xbrl.org/2003/role/disclosureRef
-Topic 250
-SubTopic 10
-Name Accounting Standards Codification
-Section 50
-Paragraph 3
-Publisher FASB
-URI https://asc.fasb.org//1943274/2147483443/250-10-50-3
Reference 6: http://www.xbrl.org/2003/role/disclosureRef
-Topic 250
-SubTopic 10
-Name Accounting Standards Codification
-Section 50
-Paragraph 1
-Subparagraph (b)(2)
-Publisher FASB
-URI https://asc.fasb.org//1943274/2147483443/250-10-50-1
Reference 7: http://www.xbrl.org/2003/role/disclosureRef
-Topic 815
-SubTopic 40
-Name Accounting Standards Codification
-Section 65
-Paragraph 1
-Subparagraph (f)
-Publisher FASB
-URI https://asc.fasb.org//1943274/2147480175/815-40-65-1
Reference 8: http://www.xbrl.org/2003/role/disclosureRef
-Topic 250
-SubTopic 10
-Name Accounting Standards Codification
-Section 50
-Paragraph 8
-Publisher FASB
-URI https://asc.fasb.org//1943274/2147483443/250-10-50-8
Reference 9: http://www.xbrl.org/2003/role/disclosureRef
-Topic 250
-SubTopic 10
-Name Accounting Standards Codification
-Section 50
-Paragraph 9
-Publisher FASB
-URI https://asc.fasb.org//1943274/2147483443/250-10-50-9
Reference 10: http://www.xbrl.org/2003/role/disclosureRef
-Topic 250
-SubTopic 10
-Name Accounting Standards Codification
-Section 50
-Paragraph 11
-Subparagraph (a)
-Publisher FASB
-URI https://asc.fasb.org//1943274/2147483443/250-10-50-11
Reference 11: http://www.xbrl.org/2003/role/disclosureRef
-Topic 250
-SubTopic 10
-Name Accounting Standards Codification
-Section 50
-Paragraph 11
-Subparagraph (b)
-Publisher FASB
-URI https://asc.fasb.org//1943274/2147483443/250-10-50-11
Reference 12: http://www.xbrl.org/2003/role/disclosureRef
-Topic 250
-SubTopic 10
-Name Accounting Standards Codification
-Section 50
-Paragraph 4
-Publisher FASB
-URI https://asc.fasb.org//1943274/2147483443/250-10-50-4
Reference 13: http://www.xbrl.org/2003/role/exampleRef
-Topic 946
-SubTopic 830
-Name Accounting Standards Codification
-Section 55
-Paragraph 10
-Publisher FASB
-URI https://asc.fasb.org//1943274/2147480167/946-830-55-10
Reference 14: http://www.xbrl.org/2003/role/disclosureRef
-Topic 946
-SubTopic 220
-Name Accounting Standards Codification
-Section 45
-Paragraph 7
-Publisher FASB
-URI https://asc.fasb.org//1943274/2147483581/946-220-45-7
Reference 15: http://www.xbrl.org/2003/role/disclosureRef
-Topic 944
-SubTopic 220
-Name Accounting Standards Codification
-Section S99
-Paragraph 1
-Subparagraph (SX 210.7-04(18))
-Publisher FASB
-URI https://asc.fasb.org//1943274/2147483586/944-220-S99-1
Reference 16: http://www.xbrl.org/2003/role/disclosureRef
-Topic 280
-SubTopic 10
-Name Accounting Standards Codification
-Section 50
-Paragraph 22
-Publisher FASB
-URI https://asc.fasb.org//1943274/2147482810/280-10-50-22
Reference 17: http://www.xbrl.org/2003/role/disclosureRef
-Topic 946
-SubTopic 220
-Name Accounting Standards Codification
-Section S99
-Paragraph 1
-Subparagraph (SX 210.6-07(9))
-Publisher FASB
-URI https://asc.fasb.org//1943274/2147483575/946-220-S99-1
Reference 18: http://www.xbrl.org/2003/role/disclosureRef
-Topic 946
-SubTopic 220
-Name Accounting Standards Codification
-Section S99
-Paragraph 3
-Subparagraph (SX 210.6-09(1)(d))
-Publisher FASB
-URI https://asc.fasb.org//1943274/2147483575/946-220-S99-3
Reference 19: http://www.xbrl.org/2003/role/disclosureRef
-Topic 470
-SubTopic 10
-Name Accounting Standards Codification
-Section S99
-Paragraph 1A
-Subparagraph (SX 210.13-01(a)(4)(i))
-Publisher FASB
-URI https://asc.fasb.org//1943274/2147480097/470-10-S99-1A
Reference 20: http://www.xbrl.org/2009/role/commonPracticeRef
-Topic 470
-SubTopic 10
-Name Accounting Standards Codification
-Section S99
-Paragraph 1A
-Subparagraph (SX 210.13-01(a)(4)(ii))
-Publisher FASB
-URI https://asc.fasb.org//1943274/2147480097/470-10-S99-1A
Reference 21: http://www.xbrl.org/2003/role/disclosureRef
-Topic 470
-SubTopic 10
-Name Accounting Standards Codification
-Section S99
-Paragraph 1A
-Subparagraph (SX 210.13-01(a)(4)(iii)(A))
-Publisher FASB
-URI https://asc.fasb.org//1943274/2147480097/470-10-S99-1A
Reference 22: http://www.xbrl.org/2003/role/disclosureRef
-Topic 470
-SubTopic 10
-Name Accounting Standards Codification
-Section S99
-Paragraph 1A
-Subparagraph (SX 210.13-01(a)(4)(iv))
-Publisher FASB
-URI https://asc.fasb.org//1943274/2147480097/470-10-S99-1A
Reference 23: http://www.xbrl.org/2003/role/disclosureRef
-Topic 470
-SubTopic 10
-Name Accounting Standards Codification
-Section S99
-Paragraph 1A
-Subparagraph (SX 210.13-01(a)(5))
-Publisher FASB
-URI https://asc.fasb.org//1943274/2147480097/470-10-S99-1A
Reference 24: http://www.xbrl.org/2003/role/disclosureRef
-Topic 470
-SubTopic 10
-Name Accounting Standards Codification
-Section S99
-Paragraph 1B
-Subparagraph (SX 210.13-02(a)(4)(i))
-Publisher FASB
-URI https://asc.fasb.org//1943274/2147480097/470-10-S99-1B
Reference 25: http://www.xbrl.org/2003/role/disclosureRef
-Topic 470
-SubTopic 10
-Name Accounting Standards Codification
-Section S99
-Paragraph 1B
-Subparagraph (SX 210.13-02(a)(4)(iii)(A))
-Publisher FASB
-URI https://asc.fasb.org//1943274/2147480097/470-10-S99-1B
Reference 26: http://www.xbrl.org/2003/role/disclosureRef
-Topic 470
-SubTopic 10
-Name Accounting Standards Codification
-Section S99
-Paragraph 1B
-Subparagraph (SX 210.13-02(a)(4)(iii)(B))
-Publisher FASB
-URI https://asc.fasb.org//1943274/2147480097/470-10-S99-1B
Reference 27: http://www.xbrl.org/2003/role/disclosureRef
-Topic 470
-SubTopic 10
-Name Accounting Standards Codification
-Section S99
-Paragraph 1B
-Subparagraph (SX 210.13-02(a)(4)(iv))
-Publisher FASB
-URI https://asc.fasb.org//1943274/2147480097/470-10-S99-1B
Reference 28: http://www.xbrl.org/2003/role/disclosureRef
-Topic 470
-SubTopic 10
-Name Accounting Standards Codification
-Section S99
-Paragraph 1B
-Subparagraph (SX 210.13-02(a)(5))
-Publisher FASB
-URI https://asc.fasb.org//1943274/2147480097/470-10-S99-1B
Reference 29: http://www.xbrl.org/2003/role/disclosureRef
-Topic 280
-SubTopic 10
-Name Accounting Standards Codification
-Section 50
-Paragraph 30
-Subparagraph (b)
-Publisher FASB
-URI https://asc.fasb.org//1943274/2147482810/280-10-50-30
Reference 30: http://www.xbrl.org/2003/role/disclosureRef
-Topic 280
-SubTopic 10
-Name Accounting Standards Codification
-Section 50
-Paragraph 32
-Subparagraph (f)
-Publisher FASB
-URI https://asc.fasb.org//1943274/2147482810/280-10-50-32
Reference 31: http://www.xbrl.org/2003/role/disclosureRef
-Topic 260
-SubTopic 10
-Name Accounting Standards Codification
-Section 45
-Paragraph 60B
-Subparagraph (a)
-Publisher FASB
-URI https://asc.fasb.org//1943274/2147482689/260-10-45-60B
Reference 32: http://www.xbrl.org/2003/role/exampleRef
-Topic 280
-SubTopic 10
-Name Accounting Standards Codification
-Section 50
-Paragraph 31
-Publisher FASB
-URI https://asc.fasb.org//1943274/2147482810/280-10-50-31
Reference 33: http://www.xbrl.org/2003/role/disclosureRef
-Topic 280
-SubTopic 10
-Name Accounting Standards Codification
-Section 50
-Paragraph 32
-Subparagraph (c)
-Publisher FASB
-URI https://asc.fasb.org//1943274/2147482810/280-10-50-32
Reference 34: http://www.xbrl.org/2003/role/disclosureRef
-Topic 205
-SubTopic 20
-Name Accounting Standards Codification
-Section 50
-Paragraph 7
-Publisher FASB
-URI https://asc.fasb.org//1943274/2147483499/205-20-50-7
Reference 35: http://fasb.org/us-gaap/role/ref/legacyRef
-Topic 230
-SubTopic 10
-Name Accounting Standards Codification
-Section 45
-Paragraph 28
-Publisher FASB
-URI https://asc.fasb.org//1943274/2147482740/230-10-45-28
Reference 36: http://www.xbrl.org/2003/role/disclosureRef
-Topic 220
-SubTopic 10
-Name Accounting Standards Codification
-Section 45
-Paragraph 1A
-Subparagraph (a)
-Publisher FASB
-URI https://asc.fasb.org//1943274/2147482790/220-10-45-1A
Reference 37: http://www.xbrl.org/2003/role/disclosureRef
-Topic 220
-SubTopic 10
-Name Accounting Standards Codification
-Section 45
-Paragraph 1B
-Subparagraph (a)
-Publisher FASB
-URI https://asc.fasb.org//1943274/2147482790/220-10-45-1B
Reference 38: http://fasb.org/us-gaap/role/ref/legacyRef
-Topic 220
-SubTopic 10
-Name Accounting Standards Codification
-Section S99
-Paragraph 2
-Subparagraph (SX 210.5-03(20))
-Publisher FASB
-URI https://asc.fasb.org//1943274/2147483621/220-10-S99-2
Reference 39: http://fasb.org/us-gaap/role/ref/legacyRef
-Topic 942
-SubTopic 220
-Name Accounting Standards Codification
-Section S99
-Paragraph 1
-Subparagraph (SX 210.9-04(22))
-Publisher FASB
-URI https://asc.fasb.org//1943274/2147483589/942-220-S99-1
| Name: |
us-gaap_NetIncomeLoss |
| Namespace Prefix: |
us-gaap_ |
| Data Type: |
xbrli:monetaryItemType |
| Balance Type: |
credit |
| Period Type: |
duration |
|
v3.24.0.1
| X |
- ReferencesReference 1: http://www.xbrl.org/2003/role/presentationRef
-Publisher SEC
-Name Regulation S-K
-Number 229
-Section 408
-Subsection a
-Paragraph 1
| Name: |
ecd_NonRule10b51ArrAdoptedFlag |
| Namespace Prefix: |
ecd_ |
| Data Type: |
xbrli:booleanItemType |
| Balance Type: |
na |
| Period Type: |
duration |
|
| X |
- ReferencesReference 1: http://www.xbrl.org/2003/role/presentationRef
-Publisher SEC
-Name Regulation S-K
-Number 229
-Section 408
-Subsection a
-Paragraph 1
| Name: |
ecd_NonRule10b51ArrTrmntdFlag |
| Namespace Prefix: |
ecd_ |
| Data Type: |
xbrli:booleanItemType |
| Balance Type: |
na |
| Period Type: |
duration |
|
| X |
- ReferencesReference 1: http://www.xbrl.org/2003/role/presentationRef
-Publisher SEC
-Name Regulation S-K
-Number 229
-Section 408
-Subsection a
-Paragraph 1
| Name: |
ecd_Rule10b51ArrAdoptedFlag |
| Namespace Prefix: |
ecd_ |
| Data Type: |
xbrli:booleanItemType |
| Balance Type: |
na |
| Period Type: |
duration |
|
| X |
- ReferencesReference 1: http://www.xbrl.org/2003/role/presentationRef
-Publisher SEC
-Name Regulation S-K
-Number 229
-Section 408
-Subsection a
-Paragraph 1
| Name: |
ecd_Rule10b51ArrTrmntdFlag |
| Namespace Prefix: |
ecd_ |
| Data Type: |
xbrli:booleanItemType |
| Balance Type: |
na |
| Period Type: |
duration |
|
| X |
- ReferencesReference 1: http://www.xbrl.org/2003/role/presentationRef
-Publisher SEC
-Name Regulation S-K
-Number 229
-Section 408
-Subsection a
-Paragraph 2
-Subparagraph A
| Name: |
ecd_TradingArrByIndTable |
| Namespace Prefix: |
ecd_ |
| Data Type: |
xbrli:stringItemType |
| Balance Type: |
na |
| Period Type: |
duration |
|
v3.24.0.1
Significant Accounting Policies (Policies)
|
12 Months Ended |
Dec. 31, 2023 |
|---|
| Accounting Policies [Abstract] |
|
| Business |
Business The Company conducts its business in one segment, the manufacture of electric building wire, manufacturing a broad range of electrical wire and cables used to distribute power from the transmission grid to the wall outlet or switch. Encore’s diversified product portfolio and low-cost of production position it exceptionally well to play a key role in the transition to a more sustainable and reliable energy infrastructure. Our products are proudly made in America at our vertically-integrated, single-site, Texas campus. The Company sells its products through manufacturers’ representatives to wholesale electrical distributors servicing the residential, commercial, industrial and renewable energy sectors.
|
| Basis of Presentation |
Basis of Presentation The Company's financial statements have been prepared in accordance with accounting principles generally accepted in the United States (“U.S. GAAP”).
|
| Use of Estimates |
Use of Estimates The preparation of financial statements in conformity with U.S. GAAP requires management to make estimates and assumptions that affect the amounts reported in the financial statements and accompanying notes. Actual results could differ from those estimates.
|
| Revenue Recognition |
Revenue Recognition Our revenue is derived by fulfilling customer orders for the purchase of our products, which include electrical building wire and cable. We recognize revenue at the point in time that control of the ordered products is transferred to the customer, which is typically upon shipment to the customer from our manufacturing facilities and based on agreed upon shipping terms on the related purchase order. Amounts billed and due from our customers are classified as accounts receivable on the balance sheet and require payment on a short-term basis through standard payment terms. Revenue is measured as the amount of consideration we expect to receive in exchange for fulfilling product orders. The amount of consideration we expect to receive and revenue we recognize includes estimates for trade payment discounts and customer rebates, which are estimated using historical experience and other relevant factors and is recorded within the same period that the revenue is recognized. We review and update these estimates regularly and the impact of any adjustments are recognized in the period the adjustments are identified. The adjustments resulting from updated estimates of trade payment discounts and customer rebates were not material.
|
| Freight Expenses |
Freight Expenses The Company classifies shipping and handling costs as a component of selling, general and administrative expenses.
|
| Derivatives |
Derivatives The Company may purchase copper and aluminum at current market prices for delivery in future months. These purchases meet the definition of a derivative in Accounting Standards Codification 815, Derivatives and Hedging (ASC 815). These transactions also qualify for the exclusion from derivative accounting as they meet the normal purchase and normal sale criterion in ASC 815.
|
| Fair Value of Financial Instruments |
Fair Value of Financial Instruments Certain items are required to be measured at fair value on a recurring basis, primarily cash equivalents held in banks. Fair value is defined as the price that would be received to sell an asset or paid to transfer a liability (an exit price) in the principal or most advantageous market for the asset or liability in an orderly transaction between market participants on the measurement date. A three-level hierarchy is followed for disclosure to show the extent and level of judgment used to estimate fair value measurements: Level 1 – Inputs used to measure fair value are unadjusted quoted prices that are available in active markets for the identical assets or liabilities as of the reporting date. Level 2 – Inputs used to measure fair value, other than quoted prices included in Level 1, are either directly or indirectly observable as of the reporting date through correlation with market data, including quoted prices for similar assets and liabilities in active markets and quoted prices in markets that are not active. Level 2 also includes assets and liabilities that are valued using models or other pricing methodologies that do not require significant judgment since the input assumptions used in the models, such as interest rates and volatility factors, are corroborated by readily observable data from actively quoted markets for substantially the full term of the financial instrument. Level 3 – Inputs used to measure fair value are unobservable inputs that are supported by little or no market activity and reflect the use of significant management judgment. These values are generally determined using pricing models for which the assumptions utilize management’s estimates of market participant assumptions.
|
| Concentrations of Credit Risk and Accounts Receivable |
Concentrations of Credit Risk and Accounts Receivable Financial instruments that potentially subject the Company to a concentration of credit risk consist principally of cash and cash equivalents and accounts receivable. The Company places its cash and cash equivalents with high credit quality financial institutions. Accounts receivable represent amounts due from customers, primarily wholesale electrical distributors, related to the sale of the Company’s products. Such receivables are uncollateralized and are generally due from customers located throughout the United States. Encore has two customers, each of whom slightly exceeds 10% of the Company's total sales.
|
| Cash and Cash Equivalents |
Cash and Cash Equivalents The Company considers all highly liquid instruments purchased with a maturity of three months or less to be cash equivalents.
|
| Inventories |
Inventories Inventories are stated at the lower of cost, using the LIFO method, or market. The Company evaluates the market value of its raw materials, work-in-process and finished goods inventory primarily based upon current raw material and finished goods prices at the end of each period.
|
| Property, Plant, and Equipment |
Property, Plant, and Equipment Property, plant and equipment is recorded at cost. Depreciation is recorded on a straight-line method over the estimated useful lives of the respective assets as follows: buildings and improvements, 3 to 45 years; machinery and equipment, 2 to 20 years; and furniture and fixtures, 5 to 20 years. Accelerated cost recovery methods are used for tax purposes. Repairs and maintenance costs are expensed as incurred. In accordance with its policy, the Company reviews the estimated useful lives of its fixed assets on an ongoing basis. This review indicated that the actual lives of its buildings were longer than the estimated useful lives used for depreciation purposes in the Company's financial statements. As a result, effective September 1, 2023, the Company changed some of its estimates of the useful lives of its buildings to better reflect the estimated periods during which these assets will remain in service. The estimated useful lives of some of the buildings that previously averaged 35 years were increased to an average of 45 years. The effect of this change in estimate was not material to the financial statements.
|
| Stock-Based Compensation |
Stock-Based Compensation Compensation cost for all stock-based compensation expected to vest is measured at fair value on the date of grant and recognized over the related service period. The fair value of stock awards is determined based on the number of shares granted and the quoted price of Encore’s common stock, and the fair value of stock options and stock appreciation rights is estimated on the date of grant using the Black-Scholes model. Such value is recognized as expense over the service period on a straight-line basis. Actual forfeitures are recorded as a cumulative adjustment in the period they occur.
|
| Earnings Per Share |
Earnings Per Share Earnings per common and common equivalent share is computed using the weighted average number of shares of common stock and common stock equivalents outstanding during each period. The dilutive effects of stock awards, which are common stock equivalents, are calculated using the treasury stock method.
|
| Income Taxes |
Income Taxes Income taxes are provided for based on the liability method, resulting in deferred income tax assets and liabilities arising due to temporary differences. Temporary differences are differences between the tax basis of assets and liabilities and their reported amounts in the financial statements that will result in taxable or deductible amounts in future years. The effect on deferred income tax assets and liabilities of a change in tax rates is recognized in income in the period the change in rate is enacted.
|
| Comprehensive Income |
Comprehensive Income Comprehensive income is defined as the change in equity of a business enterprise during a period from transactions and other events and circumstances from non-owner sources.
|
| Recent Accounting Pronouncements |
Recent Accounting Pronouncements The Financial Accounting Standards Board (“FASB”) Accounting Standards Codification (“ASC”) is the sole source of authoritative U.S. GAAP, along with the Securities and Exchange Commission ("SEC") and Public Company Accounting Oversight Board (“PCAOB”) issued rules and regulations that apply only to SEC registrants. The FASB issues an Accounting Standard Update (“ASU”) to communicate changes to the codification. The Company considers the applicability and impact of all ASUs. No new standards were adopted in 2023.
|
| X |
- References
+ Details
| Name: |
us-gaap_AccountingPoliciesAbstract |
| Namespace Prefix: |
us-gaap_ |
| Data Type: |
xbrli:stringItemType |
| Balance Type: |
na |
| Period Type: |
duration |
|
| X |
- DefinitionDisclosure of accounting policy for basis of accounting, or basis of presentation, used to prepare the financial statements (for example, US Generally Accepted Accounting Principles, Other Comprehensive Basis of Accounting, IFRS).
| Name: |
us-gaap_BasisOfAccountingPolicyPolicyTextBlock |
| Namespace Prefix: |
us-gaap_ |
| Data Type: |
dtr-types:textBlockItemType |
| Balance Type: |
na |
| Period Type: |
duration |
|
| X |
- DefinitionDisclosure of accounting policy for cash and cash equivalents, including the policy for determining which items are treated as cash equivalents. Other information that may be disclosed includes (1) the nature of any restrictions on the entity's use of its cash and cash equivalents, (2) whether the entity's cash and cash equivalents are insured or expose the entity to credit risk, (3) the classification of any negative balance accounts (overdrafts), and (4) the carrying basis of cash equivalents (for example, at cost) and whether the carrying amount of cash equivalents approximates fair value. Reference 1: http://fasb.org/us-gaap/role/ref/legacyRef
-Name Accounting Standards Codification
-Topic 230
-SubTopic 10
-Section 50
-Paragraph 1
-Publisher FASB
-URI https://asc.fasb.org//1943274/2147482913/230-10-50-1
| Name: |
us-gaap_CashAndCashEquivalentsPolicyTextBlock |
| Namespace Prefix: |
us-gaap_ |
| Data Type: |
dtr-types:textBlockItemType |
| Balance Type: |
na |
| Period Type: |
duration |
|
| X |
- DefinitionDisclosure of accounting policy for comprehensive income.
| Name: |
us-gaap_ComprehensiveIncomePolicyPolicyTextBlock |
| Namespace Prefix: |
us-gaap_ |
| Data Type: |
dtr-types:textBlockItemType |
| Balance Type: |
na |
| Period Type: |
duration |
|
| X |
- DefinitionDisclosure of accounting policy for credit risk. Reference 1: http://fasb.org/us-gaap/role/ref/legacyRef
-Name Accounting Standards Codification
-Topic 942
-SubTopic 825
-Section 50
-Paragraph 1
-Publisher FASB
-URI https://asc.fasb.org//1943274/2147480981/942-825-50-1
Reference 2: http://www.xbrl.org/2003/role/disclosureRef
-Name Accounting Standards Codification
-Section 50
-Paragraph 1
-Subparagraph (d)
-SubTopic 10
-Topic 275
-Publisher FASB
-URI https://asc.fasb.org//1943274/2147482861/275-10-50-1
| Name: |
us-gaap_ConcentrationRiskCreditRisk |
| Namespace Prefix: |
us-gaap_ |
| Data Type: |
dtr-types:textBlockItemType |
| Balance Type: |
na |
| Period Type: |
duration |
|
| X |
- DefinitionDisclosure of accounting policy for its derivative instruments and hedging activities. Reference 1: http://fasb.org/us-gaap/role/ref/legacyRef
-Name Accounting Standards Codification
-Section 50
-Paragraph 2
-SubTopic 10
-Topic 815
-Publisher FASB
-URI https://asc.fasb.org//1943274/2147480434/815-10-50-2
Reference 2: http://www.xbrl.org/2003/role/disclosureRef
-Topic 235
-SubTopic 10
-Name Accounting Standards Codification
-Section S99
-Paragraph 1
-Subparagraph (SX 210.4-08(n))
-Publisher FASB
-URI https://asc.fasb.org//1943274/2147480678/235-10-S99-1
Reference 3: http://fasb.org/us-gaap/role/ref/legacyRef
-Name Accounting Standards Codification
-Topic 815
-SubTopic 10
-Section 50
-Paragraph 1A
-Publisher FASB
-URI https://asc.fasb.org//1943274/2147480434/815-10-50-1A
Reference 4: http://fasb.org/us-gaap/role/ref/legacyRef
-Name Accounting Standards Codification
-Topic 815
-SubTopic 10
-Section 50
-Paragraph 1
-Publisher FASB
-URI https://asc.fasb.org//1943274/2147480434/815-10-50-1
Reference 5: http://fasb.org/us-gaap/role/ref/legacyRef
-Name Accounting Standards Codification
-Topic 815
-SubTopic 10
-Section 50
-Paragraph 4
-Publisher FASB
-URI https://asc.fasb.org//1943274/2147480434/815-10-50-4
Reference 6: http://fasb.org/us-gaap/role/ref/legacyRef
-Name Accounting Standards Codification
-Topic 815
-SubTopic 10
-Section 50
-Paragraph 7
-Publisher FASB
-URI https://asc.fasb.org//1943274/2147480434/815-10-50-7
| Name: |
us-gaap_DerivativesPolicyTextBlock |
| Namespace Prefix: |
us-gaap_ |
| Data Type: |
dtr-types:textBlockItemType |
| Balance Type: |
na |
| Period Type: |
duration |
|
| X |
- DefinitionDisclosure of accounting policy for computing basic and diluted earnings or loss per share for each class of common stock and participating security. Addresses all significant policy factors, including any antidilutive items that have been excluded from the computation and takes into account stock dividends, splits and reverse splits that occur after the balance sheet date of the latest reporting period but before the issuance of the financial statements. Reference 1: http://fasb.org/us-gaap/role/ref/legacyRef
-Name Accounting Standards Codification
-Topic 260
-SubTopic 10
-Section 50
-Paragraph 1
-Subparagraph (c)
-Publisher FASB
-URI https://asc.fasb.org//1943274/2147482662/260-10-50-1
Reference 2: http://fasb.org/us-gaap/role/ref/legacyRef
-Name Accounting Standards Codification
-Topic 260
-SubTopic 10
-Section 50
-Paragraph 2
-Publisher FASB
-URI https://asc.fasb.org//1943274/2147482662/260-10-50-2
| Name: |
us-gaap_EarningsPerSharePolicyTextBlock |
| Namespace Prefix: |
us-gaap_ |
| Data Type: |
dtr-types:textBlockItemType |
| Balance Type: |
na |
| Period Type: |
duration |
|
| X |
- DefinitionDisclosure of accounting policy for determining the fair value of financial instruments. Reference 1: http://fasb.org/us-gaap/role/ref/legacyRef
-Name Accounting Standards Codification
-Section 60
-Paragraph 1
-SubTopic 10
-Topic 820
-Publisher FASB
-URI https://asc.fasb.org//1943274/2147482053/820-10-60-1
Reference 2: http://fasb.org/us-gaap/role/ref/legacyRef
-Name Accounting Standards Codification
-Section 50
-Paragraph 1
-SubTopic 10
-Topic 825
-Publisher FASB
-URI https://asc.fasb.org//1943274/2147482907/825-10-50-1
| Name: |
us-gaap_FairValueOfFinancialInstrumentsPolicy |
| Namespace Prefix: |
us-gaap_ |
| Data Type: |
dtr-types:textBlockItemType |
| Balance Type: |
na |
| Period Type: |
duration |
|
| X |
- DefinitionDisclosure of accounting policy for income taxes, which may include its accounting policies for recognizing and measuring deferred tax assets and liabilities and related valuation allowances, recognizing investment tax credits, operating loss carryforwards, tax credit carryforwards, and other carryforwards, methodologies for determining its effective income tax rate and the characterization of interest and penalties in the financial statements. Reference 1: http://www.xbrl.org/2003/role/disclosureRef
-Topic 946
-SubTopic 10
-Name Accounting Standards Codification
-Section S99
-Paragraph 3
-Subparagraph (SX 210.6-03(h)(1))
-Publisher FASB
-URI https://asc.fasb.org//1943274/2147479886/946-10-S99-3
Reference 2: http://www.xbrl.org/2003/role/disclosureRef
-Topic 740
-SubTopic 10
-Name Accounting Standards Codification
-Section 50
-Paragraph 17
-Subparagraph (b)
-Publisher FASB
-URI https://asc.fasb.org//1943274/2147482685/740-10-50-17
Reference 3: http://www.xbrl.org/2003/role/disclosureRef
-Topic 740
-SubTopic 10
-Name Accounting Standards Codification
-Section 50
-Paragraph 9
-Publisher FASB
-URI https://asc.fasb.org//1943274/2147482685/740-10-50-9
Reference 4: http://www.xbrl.org/2003/role/disclosureRef
-Topic 740
-SubTopic 10
-Name Accounting Standards Codification
-Section 45
-Paragraph 25
-Publisher FASB
-URI https://asc.fasb.org//1943274/2147482525/740-10-45-25
Reference 5: http://www.xbrl.org/2003/role/disclosureRef
-Topic 740
-SubTopic 10
-Name Accounting Standards Codification
-Section 45
-Paragraph 28
-Publisher FASB
-URI https://asc.fasb.org//1943274/2147482525/740-10-45-28
Reference 6: http://www.xbrl.org/2003/role/disclosureRef
-Topic 740
-SubTopic 10
-Name Accounting Standards Codification
-Section 50
-Paragraph 19
-Publisher FASB
-URI https://asc.fasb.org//1943274/2147482685/740-10-50-19
Reference 7: http://www.xbrl.org/2003/role/disclosureRef
-Topic 220
-SubTopic 10
-Name Accounting Standards Codification
-Section 50
-Paragraph 1
-Publisher FASB
-URI https://asc.fasb.org//1943274/2147482765/220-10-50-1
Reference 8: http://www.xbrl.org/2003/role/disclosureRef
-Topic 740
-SubTopic 10
-Name Accounting Standards Codification
-Section 50
-Paragraph 20
-Publisher FASB
-URI https://asc.fasb.org//1943274/2147482685/740-10-50-20
| Name: |
us-gaap_IncomeTaxPolicyTextBlock |
| Namespace Prefix: |
us-gaap_ |
| Data Type: |
dtr-types:textBlockItemType |
| Balance Type: |
na |
| Period Type: |
duration |
|
| X |
- DefinitionDisclosure of inventory accounting policy for inventory classes, including, but not limited to, basis for determining inventory amounts, methods by which amounts are added and removed from inventory classes, loss recognition on impairment of inventories, and situations in which inventories are stated above cost. Reference 1: http://www.xbrl.org/2003/role/disclosureRef
-Topic 210
-SubTopic 10
-Name Accounting Standards Codification
-Section 50
-Paragraph 1
-Publisher FASB
-URI https://asc.fasb.org//1943274/2147483489/210-10-50-1
Reference 2: http://www.xbrl.org/2003/role/disclosureRef
-Topic 210
-SubTopic 10
-Name Accounting Standards Codification
-Section S99
-Paragraph 1
-Subparagraph (SX 210.5-02(6)(b))
-Publisher FASB
-URI https://asc.fasb.org//1943274/2147480566/210-10-S99-1
Reference 3: http://www.xbrl.org/2003/role/exampleRef
-Topic 235
-SubTopic 10
-Name Accounting Standards Codification
-Section 50
-Paragraph 4
-Subparagraph (d)
-Publisher FASB
-URI https://asc.fasb.org//1943274/2147483426/235-10-50-4
Reference 4: http://www.xbrl.org/2003/role/disclosureRef
-Topic 912
-SubTopic 330
-Name Accounting Standards Codification
-Section 50
-Paragraph 1
-Publisher FASB
-URI https://asc.fasb.org//1943274/2147482105/912-330-50-1
Reference 5: http://www.xbrl.org/2003/role/disclosureRef
-Topic 330
-Name Accounting Standards Codification
-Publisher FASB
-URI https://asc.fasb.org//330/tableOfContent
Reference 6: http://www.xbrl.org/2003/role/disclosureRef
-Topic 330
-SubTopic 10
-Name Accounting Standards Codification
-Section 50
-Paragraph 1
-Publisher FASB
-URI https://asc.fasb.org//1943274/2147483080/330-10-50-1
Reference 7: http://www.xbrl.org/2003/role/disclosureRef
-Topic 330
-SubTopic 10
-Name Accounting Standards Codification
-Section 50
-Paragraph 4
-Publisher FASB
-URI https://asc.fasb.org//1943274/2147483080/330-10-50-4
Reference 8: http://www.xbrl.org/2003/role/disclosureRef
-Name Accounting Standards Codification
-Section 45
-Paragraph 6
-Subparagraph (a)
-SubTopic 10
-Topic 270
-Publisher FASB
-URI https://asc.fasb.org//1943274/2147482989/270-10-45-6
| Name: |
us-gaap_InventoryPolicyTextBlock |
| Namespace Prefix: |
us-gaap_ |
| Data Type: |
dtr-types:textBlockItemType |
| Balance Type: |
na |
| Period Type: |
duration |
|
| X |
- DefinitionDisclosure of accounting policy pertaining to new accounting pronouncements that may impact the entity's financial reporting. Includes, but is not limited to, quantification of the expected or actual impact.
| Name: |
us-gaap_NewAccountingPronouncementsPolicyPolicyTextBlock |
| Namespace Prefix: |
us-gaap_ |
| Data Type: |
dtr-types:textBlockItemType |
| Balance Type: |
na |
| Period Type: |
duration |
|
| X |
- DefinitionDisclosure of accounting policy for long-lived, physical asset used in normal conduct of business and not intended for resale. Includes, but is not limited to, work of art, historical treasure, and similar asset classified as collections. Reference 1: http://fasb.org/us-gaap/role/ref/legacyRef
-Name Accounting Standards Codification
-Section 50
-Paragraph 1
-SubTopic 10
-Topic 360
-Publisher FASB
-URI https://asc.fasb.org//1943274/2147482099/360-10-50-1
Reference 2: http://www.xbrl.org/2003/role/disclosureRef
-Topic 944
-SubTopic 210
-Name Accounting Standards Codification
-Section S99
-Paragraph 1
-Subparagraph (SX 210.7-03(a)(8)(a))
-Publisher FASB
-URI https://asc.fasb.org//1943274/2147479440/944-210-S99-1
Reference 3: http://www.xbrl.org/2003/role/disclosureRef
-Name Accounting Standards Codification
-Section 50
-Paragraph 6
-SubTopic 360
-Topic 958
-Publisher FASB
-URI https://asc.fasb.org//1943274/2147480321/958-360-50-6
Reference 4: http://www.xbrl.org/2003/role/disclosureRef
-Name Accounting Standards Codification
-Section 50
-Paragraph 1
-Subparagraph (d)
-SubTopic 360
-Topic 958
-Publisher FASB
-URI https://asc.fasb.org//1943274/2147480321/958-360-50-1
| Name: |
us-gaap_PropertyPlantAndEquipmentPolicyTextBlock |
| Namespace Prefix: |
us-gaap_ |
| Data Type: |
dtr-types:textBlockItemType |
| Balance Type: |
na |
| Period Type: |
duration |
|
| X |
- DefinitionDisclosure of accounting policy for revenue from contract with customer. Reference 1: http://www.xbrl.org/2003/role/disclosureRef
-Topic 606
-SubTopic 10
-Name Accounting Standards Codification
-Section 50
-Paragraph 17
-Publisher FASB
-URI https://asc.fasb.org//1943274/2147479806/606-10-50-17
Reference 2: http://www.xbrl.org/2003/role/disclosureRef
-Topic 606
-SubTopic 10
-Name Accounting Standards Codification
-Section 50
-Paragraph 19
-Publisher FASB
-URI https://asc.fasb.org//1943274/2147479806/606-10-50-19
Reference 3: http://www.xbrl.org/2003/role/disclosureRef
-Topic 606
-SubTopic 10
-Name Accounting Standards Codification
-Section 50
-Paragraph 18
-Subparagraph (a)
-Publisher FASB
-URI https://asc.fasb.org//1943274/2147479806/606-10-50-18
Reference 4: http://www.xbrl.org/2003/role/disclosureRef
-Topic 606
-SubTopic 10
-Name Accounting Standards Codification
-Section 50
-Paragraph 18
-Subparagraph (b)
-Publisher FASB
-URI https://asc.fasb.org//1943274/2147479806/606-10-50-18
Reference 5: http://www.xbrl.org/2003/role/disclosureRef
-Topic 606
-SubTopic 10
-Name Accounting Standards Codification
-Section 50
-Paragraph 20
-Subparagraph (a)
-Publisher FASB
-URI https://asc.fasb.org//1943274/2147479806/606-10-50-20
Reference 6: http://www.xbrl.org/2003/role/disclosureRef
-Topic 606
-SubTopic 10
-Name Accounting Standards Codification
-Section 50
-Paragraph 20
-Subparagraph (b)
-Publisher FASB
-URI https://asc.fasb.org//1943274/2147479806/606-10-50-20
Reference 7: http://www.xbrl.org/2003/role/disclosureRef
-Topic 606
-SubTopic 10
-Name Accounting Standards Codification
-Section 50
-Paragraph 20
-Subparagraph (c)
-Publisher FASB
-URI https://asc.fasb.org//1943274/2147479806/606-10-50-20
Reference 8: http://www.xbrl.org/2003/role/disclosureRef
-Topic 606
-SubTopic 10
-Name Accounting Standards Codification
-Section 50
-Paragraph 20
-Subparagraph (d)
-Publisher FASB
-URI https://asc.fasb.org//1943274/2147479806/606-10-50-20
Reference 9: http://www.xbrl.org/2003/role/exampleRef
-Name Accounting Standards Codification
-Section 50
-Paragraph 4
-Subparagraph (e)
-SubTopic 10
-Topic 235
-Publisher FASB
-URI https://asc.fasb.org//1943274/2147483426/235-10-50-4
Reference 10: http://www.xbrl.org/2003/role/disclosureRef
-Name Accounting Standards Codification
-Topic 606
-Publisher FASB
-URI https://asc.fasb.org//606/tableOfContent
| Name: |
us-gaap_RevenueFromContractWithCustomerPolicyTextBlock |
| Namespace Prefix: |
us-gaap_ |
| Data Type: |
dtr-types:textBlockItemType |
| Balance Type: |
na |
| Period Type: |
duration |
|
| X |
- DefinitionDisclosure of accounting policy for award under share-based payment arrangement. Includes, but is not limited to, methodology and assumption used in measuring cost. Reference 1: http://www.xbrl.org/2003/role/disclosureRef
-Topic 718
-SubTopic 10
-Name Accounting Standards Codification
-Section 50
-Paragraph 2
-Subparagraph (f)(2)(i)
-Publisher FASB
-URI https://asc.fasb.org//1943274/2147480429/718-10-50-2
Reference 2: http://www.xbrl.org/2003/role/disclosureRef
-Topic 718
-SubTopic 10
-Name Accounting Standards Codification
-Section 50
-Paragraph 2
-Subparagraph (f)(2)(ii)
-Publisher FASB
-URI https://asc.fasb.org//1943274/2147480429/718-10-50-2
Reference 3: http://www.xbrl.org/2003/role/disclosureRef
-Topic 718
-SubTopic 10
-Name Accounting Standards Codification
-Section 50
-Paragraph 2
-Subparagraph (f)(2)(v)
-Publisher FASB
-URI https://asc.fasb.org//1943274/2147480429/718-10-50-2
Reference 4: http://www.xbrl.org/2003/role/disclosureRef
-Topic 718
-SubTopic 10
-Name Accounting Standards Codification
-Section S99
-Paragraph 1
-Subparagraph (SAB Topic 14.C.Q3)
-Publisher FASB
-URI https://asc.fasb.org//1943274/2147479830/718-10-S99-1
Reference 5: http://www.xbrl.org/2003/role/disclosureRef
-Topic 718
-SubTopic 10
-Name Accounting Standards Codification
-Section S99
-Paragraph 1
-Subparagraph (SAB Topic 14.D.1.Q5)
-Publisher FASB
-URI https://asc.fasb.org//1943274/2147479830/718-10-S99-1
Reference 6: http://www.xbrl.org/2003/role/disclosureRef
-Topic 718
-SubTopic 10
-Name Accounting Standards Codification
-Section S99
-Paragraph 1
-Subparagraph (SAB Topic 14.D.3.Q2)
-Publisher FASB
-URI https://asc.fasb.org//1943274/2147479830/718-10-S99-1
Reference 7: http://www.xbrl.org/2003/role/disclosureRef
-Topic 718
-SubTopic 10
-Name Accounting Standards Codification
-Section S99
-Paragraph 1
-Subparagraph (SAB Topic 14.D.2.Q6)
-Publisher FASB
-URI https://asc.fasb.org//1943274/2147479830/718-10-S99-1
Reference 8: http://www.xbrl.org/2003/role/disclosureRef
-Topic 718
-Name Accounting Standards Codification
-Publisher FASB
-URI https://asc.fasb.org//718/tableOfContent
Reference 9: http://www.xbrl.org/2003/role/disclosureRef
-Topic 718
-SubTopic 10
-Name Accounting Standards Codification
-Section 50
-Paragraph 2
-Subparagraph (b)
-Publisher FASB
-URI https://asc.fasb.org//1943274/2147480429/718-10-50-2
Reference 10: http://www.xbrl.org/2003/role/disclosureRef
-Topic 718
-SubTopic 10
-Name Accounting Standards Codification
-Section 50
-Paragraph 2
-Subparagraph (f)(1)
-Publisher FASB
-URI https://asc.fasb.org//1943274/2147480429/718-10-50-2
Reference 11: http://www.xbrl.org/2003/role/disclosureRef
-Topic 718
-SubTopic 10
-Name Accounting Standards Codification
-Section 50
-Paragraph 2
-Subparagraph (f)(2)
-Publisher FASB
-URI https://asc.fasb.org//1943274/2147480429/718-10-50-2
| Name: |
us-gaap_ShareBasedCompensationOptionAndIncentivePlansPolicy |
| Namespace Prefix: |
us-gaap_ |
| Data Type: |
dtr-types:textBlockItemType |
| Balance Type: |
na |
| Period Type: |
duration |
|
| X |
- DefinitionDisclosure of accounting policy for accounts receivable. Reference 1: http://www.xbrl.org/2003/role/disclosureRef
-Topic 310
-SubTopic 10
-Name Accounting Standards Codification
-Section 50
-Paragraph 2
-Publisher FASB
-URI https://asc.fasb.org//1943274/2147481962/310-10-50-2
Reference 2: http://www.xbrl.org/2003/role/disclosureRef
-Topic 310
-SubTopic 20
-Name Accounting Standards Codification
-Section 50
-Paragraph 1
-Publisher FASB
-URI https://asc.fasb.org//1943274/2147481569/310-20-50-1
Reference 3: http://fasb.org/us-gaap/role/ref/otherTransitionRef
-Name Accounting Standards Codification
-Section 50
-Paragraph 11B
-Subparagraph (b)
-SubTopic 10
-Topic 310
-Publisher FASB
-URI https://asc.fasb.org//1943274/2147481962/310-10-50-11B
Reference 4: http://www.xbrl.org/2003/role/disclosureRef
-Topic 310
-SubTopic 10
-Name Accounting Standards Codification
-Section 50
-Paragraph 1
-Subparagraph (a)
-Publisher FASB
-URI https://asc.fasb.org//1943274/2147481962/310-10-50-1
Reference 5: http://fasb.org/us-gaap/role/ref/otherTransitionRef
-Name Accounting Standards Codification
-Section 50
-Paragraph 6
-SubTopic 10
-Topic 310
-Publisher FASB
-URI https://asc.fasb.org//1943274/2147481962/310-10-50-6
Reference 6: http://fasb.org/us-gaap/role/ref/otherTransitionRef
-Name Accounting Standards Codification
-Section 50
-Paragraph 15
-Subparagraph (d)
-SubTopic 10
-Topic 310
-Publisher FASB
-URI https://asc.fasb.org//1943274/2147481962/310-10-50-15
| Name: |
us-gaap_TradeAndOtherAccountsReceivablePolicy |
| Namespace Prefix: |
us-gaap_ |
| Data Type: |
dtr-types:textBlockItemType |
| Balance Type: |
na |
| Period Type: |
duration |
|
| X |
- DefinitionDisclosure of accounting policy for the use of estimates in the preparation of financial statements in conformity with generally accepted accounting principles. Reference 1: http://fasb.org/us-gaap/role/ref/legacyRef
-Name Accounting Standards Codification
-Topic 275
-SubTopic 10
-Section 50
-Paragraph 9
-Publisher FASB
-URI https://asc.fasb.org//1943274/2147482861/275-10-50-9
Reference 2: http://fasb.org/us-gaap/role/ref/legacyRef
-Name Accounting Standards Codification
-Topic 275
-SubTopic 10
-Section 50
-Paragraph 4
-Publisher FASB
-URI https://asc.fasb.org//1943274/2147482861/275-10-50-4
Reference 3: http://www.xbrl.org/2003/role/disclosureRef
-Name Accounting Standards Codification
-Section 50
-Paragraph 1
-Subparagraph (b)
-SubTopic 10
-Topic 275
-Publisher FASB
-URI https://asc.fasb.org//1943274/2147482861/275-10-50-1
Reference 4: http://www.xbrl.org/2003/role/disclosureRef
-Name Accounting Standards Codification
-Section 50
-Paragraph 1
-Subparagraph (c)
-SubTopic 10
-Topic 275
-Publisher FASB
-URI https://asc.fasb.org//1943274/2147482861/275-10-50-1
Reference 5: http://www.xbrl.org/2003/role/disclosureRef
-Name Accounting Standards Codification
-Section 50
-Paragraph 11
-SubTopic 10
-Topic 275
-Publisher FASB
-URI https://asc.fasb.org//1943274/2147482861/275-10-50-11
Reference 6: http://www.xbrl.org/2003/role/disclosureRef
-Name Accounting Standards Codification
-Section 50
-Paragraph 12
-SubTopic 10
-Topic 275
-Publisher FASB
-URI https://asc.fasb.org//1943274/2147482861/275-10-50-12
Reference 7: http://fasb.org/us-gaap/role/ref/legacyRef
-Name Accounting Standards Codification
-Topic 275
-SubTopic 10
-Section 50
-Paragraph 8
-Publisher FASB
-URI https://asc.fasb.org//1943274/2147482861/275-10-50-8
| Name: |
us-gaap_UseOfEstimates |
| Namespace Prefix: |
us-gaap_ |
| Data Type: |
dtr-types:textBlockItemType |
| Balance Type: |
na |
| Period Type: |
duration |
|
| X |
- Definition
+ References
+ Details
| Name: |
wire_NatureOfOperationsPolicyTextBlock |
| Namespace Prefix: |
wire_ |
| Data Type: |
dtr-types1:textBlockItemType |
| Balance Type: |
na |
| Period Type: |
duration |
|
| X |
- DefinitionShipping And Handling Costs, Policy [Policy Text Block]
| Name: |
wire_ShippingAndHandlingCostsPolicyPolicyTextBlock |
| Namespace Prefix: |
wire_ |
| Data Type: |
dtr-types1:textBlockItemType |
| Balance Type: |
na |
| Period Type: |
duration |
|
v3.24.0.1
Significant Accounting Policies (Tables)
|
12 Months Ended |
Dec. 31, 2023 |
|---|
| Accounting Policies [Abstract] |
|
| Schedule of Allowance for Credit Losses |
The Company establishes an allowance for credit losses based upon the makeup of the current portfolio, past bad debt experience and current market conditions. | | | | | | | | | | | | | | | | | | | Allowance for Credit Losses (In Thousands) | 2023 | | 2022 | | 2021 | | Beginning balance January 1 | $ | 3,800 | | | $ | 3,800 | | | $ | 2,215 | | | Write-offs of bad debts | (45) | | | — | | | — | | | Collection of previous write-offs | — | | | — | | | 122 | | | Adjustment to allowance for credit losses | (1,300) | | | — | | | 1,463 | | | Ending balance at December 31 | $ | 2,455 | | | $ | 3,800 | | | $ | 3,800 | |
|
| X |
- References
+ Details
| Name: |
us-gaap_AccountingPoliciesAbstract |
| Namespace Prefix: |
us-gaap_ |
| Data Type: |
xbrli:stringItemType |
| Balance Type: |
na |
| Period Type: |
duration |
|
| X |
- DefinitionTabular disclosure of allowance for credit loss on accounts receivable. Reference 1: http://www.xbrl.org/2009/role/commonPracticeRef
-Topic 326
-SubTopic 20
-Name Accounting Standards Codification
-Section 50
-Paragraph 13
-Publisher FASB
-URI https://asc.fasb.org//1943274/2147479319/326-20-50-13
| Name: |
us-gaap_AccountsReceivableAllowanceForCreditLossTableTextBlock |
| Namespace Prefix: |
us-gaap_ |
| Data Type: |
dtr-types:textBlockItemType |
| Balance Type: |
na |
| Period Type: |
duration |
|
v3.24.0.1
Inventories (Tables)
|
12 Months Ended |
Dec. 31, 2023 |
|---|
| Inventory Disclosure [Abstract] |
|
| Schedule of Inventories |
Inventories consist of the following as of December 31: | | | | | | | | | | | | | In Thousands | 2023 | | 2022 | | Raw materials | $ | 64,512 | | | $ | 69,567 | | | Work-in-process | 55,921 | | | 42,611 | | | Finished goods | 139,348 | | | 138,943 | | | Total | 259,781 | | | 251,121 | | | Adjust to LIFO cost | (96,102) | | | (97,934) | | | | | | | Inventory, net | $ | 163,679 | | | $ | 153,187 | |
|
| X |
- References
+ Details
| Name: |
us-gaap_InventoryDisclosureAbstract |
| Namespace Prefix: |
us-gaap_ |
| Data Type: |
xbrli:stringItemType |
| Balance Type: |
na |
| Period Type: |
duration |
|
| X |
- DefinitionTabular disclosure of the carrying amount as of the balance sheet date of merchandise, goods, commodities, or supplies held for future sale or to be used in manufacturing, servicing or production process. Reference 1: http://fasb.org/us-gaap/role/ref/legacyRef
-Topic 210
-SubTopic 10
-Name Accounting Standards Codification
-Section S99
-Paragraph 1
-Subparagraph (SX 210.5-02(6)(a))
-Publisher FASB
-URI https://asc.fasb.org//1943274/2147480566/210-10-S99-1
Reference 2: http://fasb.org/us-gaap/role/ref/legacyRef
-Topic 210
-SubTopic 10
-Name Accounting Standards Codification
-Section S99
-Paragraph 1
-Subparagraph (SX 210.5-02(6)(b))
-Publisher FASB
-URI https://asc.fasb.org//1943274/2147480566/210-10-S99-1
Reference 3: http://fasb.org/us-gaap/role/ref/legacyRef
-Topic 210
-SubTopic 10
-Name Accounting Standards Codification
-Section S99
-Paragraph 1
-Subparagraph (SX 210.5-02(6)(c))
-Publisher FASB
-URI https://asc.fasb.org//1943274/2147480566/210-10-S99-1
Reference 4: http://fasb.org/us-gaap/role/ref/legacyRef
-Name Accounting Standards Codification
-Topic 210
-SubTopic 10
-Section 50
-Paragraph 1
-Publisher FASB
-URI https://asc.fasb.org//1943274/2147483489/210-10-50-1
| Name: |
us-gaap_ScheduleOfInventoryCurrentTableTextBlock |
| Namespace Prefix: |
us-gaap_ |
| Data Type: |
dtr-types:textBlockItemType |
| Balance Type: |
na |
| Period Type: |
duration |
|
v3.24.0.1
Property, Plant and Equipment, net (Tables)
|
12 Months Ended |
Dec. 31, 2023 |
|---|
| Property, Plant and Equipment [Abstract] |
|
| Schedule of Property, Plant and Equipment |
Property, plant and equipment consist of the following as of December 31: | | | | | | | | | | | | | In Thousands | 2023 | | 2022 | | Land and land improvements | $ | 90,162 | | | $ | 85,286 | | | Construction-in-progress | 163,514 | | | 125,809 | | | Buildings and improvements | 313,691 | | | 232,758 | | | Machinery and equipment | 478,060 | | | 438,303 | | | Furniture and fixtures | 17,231 | | | 15,178 | | | Property, plant and equipment, gross | 1,062,658 | | | 897,334 | | | Accumulated depreciation | (305,795) | | | (280,733) | | | Property, plant and equipment, net | $ | 756,863 | | | $ | 616,601 | |
|
| X |
- References
+ Details
| Name: |
us-gaap_PropertyPlantAndEquipmentAbstract |
| Namespace Prefix: |
us-gaap_ |
| Data Type: |
xbrli:stringItemType |
| Balance Type: |
na |
| Period Type: |
duration |
|
| X |
- DefinitionTabular disclosure of physical assets used in the normal conduct of business and not intended for resale. Includes, but is not limited to, balances by class of assets, depreciation and depletion expense and method used, including composite depreciation, and accumulated deprecation. Reference 1: http://fasb.org/us-gaap/role/ref/legacyRef
-Name Accounting Standards Codification
-Section 50
-Paragraph 1
-SubTopic 10
-Topic 360
-Publisher FASB
-URI https://asc.fasb.org//1943274/2147482099/360-10-50-1
| Name: |
us-gaap_PropertyPlantAndEquipmentTextBlock |
| Namespace Prefix: |
us-gaap_ |
| Data Type: |
dtr-types:textBlockItemType |
| Balance Type: |
na |
| Period Type: |
duration |
|
v3.24.0.1
Accrued Liabilities (Tables)
|
12 Months Ended |
Dec. 31, 2023 |
|---|
| Accrued Liabilities, Current [Abstract] |
|
| Schedule of Accrued Liabilities |
Accrued liabilities consist of the following as of December 31: | | | | | | | | | | | | | In Thousands | 2023 | | 2022 | | Sales rebates payable | $ | 39,123 | | | $ | 40,909 | | | Stock Appreciation Rights (SAR) Liability | 22,182 | | | 20,282 | | | Property taxes payable | 5,827 | | | 5,287 | | | Accrued salaries | 6,947 | | | 7,616 | | | Other accrued liabilities | 5,511 | | | 7,287 | | | Total accrued liabilities | $ | 79,590 | | | $ | 81,381 | |
|
| X |
- References
+ Details
| Name: |
us-gaap_AccruedLiabilitiesCurrentAbstract |
| Namespace Prefix: |
us-gaap_ |
| Data Type: |
xbrli:stringItemType |
| Balance Type: |
na |
| Period Type: |
duration |
|
| X |
- DefinitionTabular disclosure of the components of accrued liabilities.
| Name: |
us-gaap_ScheduleOfAccruedLiabilitiesTableTextBlock |
| Namespace Prefix: |
us-gaap_ |
| Data Type: |
dtr-types:textBlockItemType |
| Balance Type: |
na |
| Period Type: |
duration |
|
v3.24.0.1
Income Taxes (Tables)
|
12 Months Ended |
Dec. 31, 2023 |
|---|
| Income Tax Disclosure [Abstract] |
|
| Schedule of Income Tax Expenses |
The provision for income tax expense is summarized as follows for the years ended December 31: | | | | | | | | | | | | | | | | | | | In Thousands | 2023 | | 2022 | | 2021 | | Current: | | | | | | | Federal | $ | 100,472 | | | $ | 175,090 | | | $ | 143,392 | | | State | 7,428 | | | 12,379 | | | 12,319 | | | Deferred: | | | | | | | Federal | 4,115 | | | 19,797 | | | 2,132 | | | State | 227 | | | (257) | | | 132 | | | Total income tax expense | $ | 112,242 | | | $ | 207,009 | | | $ | 157,975 | |
|
| Schedule of Differences Between Provision for Income Taxes and Income Taxes Computed Using Federal Income Tax Rate |
The differences between the provision for income taxes and income taxes computed using the federal income tax rate are as follows for the years ended December 31: | | | | | | | | | | | | | In Thousands | 2023 | 2022 | 2021 | | Amount computed using the statutory rate | $ | 101,775 | | $ | 194,218 | | $ | 146,873 | | | State income taxes, net of federal tax benefit | 6,047 | | 9,576 | | 9,836 | | | 162(m) disallowance | 5,687 | | 3,244 | | 1,355 | | | | | | | | | | | Other | (1,267) | | (29) | | (89) | | | Total income tax expense | $ | 112,242 | | $ | 207,009 | | $ | 157,975 | |
|
| Schedule of Net Deferred Tax Liability |
The tax effect of each type of temporary difference giving rise to the net deferred tax liability at December 31 is as follows: | | | | | | | | | | | | | In Thousands | 2023 | | 2022 | | Depreciation | $ | (65,688) | | | $ | (60,304) | | | Inventory | (2,462) | | | (2,080) | | | Allowance for credit losses | 545 | | | 843 | | | Uniform capitalization rules | 1,110 | | | 574 | | | Stock-based compensation | 6,170 | | | 4,791 | | | Other | 343 | | | 536 | | | Net deferred income tax liability | $ | (59,982) | | | $ | (55,640) | |
|
| X |
- DefinitionTabular disclosure of the components of income tax expense attributable to continuing operations for each year presented including, but not limited to: current tax expense (benefit), deferred tax expense (benefit), investment tax credits, government grants, the benefits of operating loss carryforwards, tax expense that results from allocating certain tax benefits either directly to contributed capital or to reduce goodwill or other noncurrent intangible assets of an acquired entity, adjustments of a deferred tax liability or asset for enacted changes in tax laws or rates or a change in the tax status of the entity, and adjustments of the beginning-of-the-year balances of a valuation allowance because of a change in circumstances that causes a change in judgment about the realizability of the related deferred tax asset in future years. Reference 1: http://fasb.org/us-gaap/role/ref/legacyRef
-Topic 740
-SubTopic 10
-Name Accounting Standards Codification
-Paragraph 9
-Section 50
-Publisher FASB
-URI https://asc.fasb.org//1943274/2147482685/740-10-50-9
| Name: |
us-gaap_ScheduleOfComponentsOfIncomeTaxExpenseBenefitTableTextBlock |
| Namespace Prefix: |
us-gaap_ |
| Data Type: |
dtr-types:textBlockItemType |
| Balance Type: |
na |
| Period Type: |
duration |
|
| X |
- DefinitionTabular disclosure of the components of net deferred tax asset or liability recognized in an entity's statement of financial position, including the following: the total of all deferred tax liabilities, the total of all deferred tax assets, the total valuation allowance recognized for deferred tax assets. Reference 1: http://fasb.org/us-gaap/role/ref/legacyRef
-Topic 740
-SubTopic 10
-Name Accounting Standards Codification
-Paragraph 2
-Section 50
-Publisher FASB
-URI https://asc.fasb.org//1943274/2147482685/740-10-50-2
| Name: |
us-gaap_ScheduleOfDeferredTaxAssetsAndLiabilitiesTableTextBlock |
| Namespace Prefix: |
us-gaap_ |
| Data Type: |
dtr-types:textBlockItemType |
| Balance Type: |
na |
| Period Type: |
duration |
|
| X |
- DefinitionTabular disclosure of the reconciliation using percentage or dollar amounts of the reported amount of income tax expense attributable to continuing operations for the year to the amount of income tax expense that would result from applying domestic federal statutory tax rates to pretax income from continuing operations. Reference 1: http://fasb.org/us-gaap/role/ref/legacyRef
-Topic 740
-SubTopic 10
-Name Accounting Standards Codification
-Paragraph 12
-Section 50
-Publisher FASB
-URI https://asc.fasb.org//1943274/2147482685/740-10-50-12
| Name: |
us-gaap_ScheduleOfEffectiveIncomeTaxRateReconciliationTableTextBlock |
| Namespace Prefix: |
us-gaap_ |
| Data Type: |
dtr-types:textBlockItemType |
| Balance Type: |
na |
| Period Type: |
duration |
|
v3.24.0.1
Stock-Based Compensation (Tables)
|
12 Months Ended |
Dec. 31, 2023 |
|---|
| Share-Based Payment Arrangement [Abstract] |
|
| Schedule of Total Stock-Based Compensation Expense by Type of Award |
Total stock-based compensation expense by type of award was as follows for the years ended December 31: | | | | | | | | | | | | | | | | | | | In Thousands | 2023 | | 2022 | | 2021 | | Restricted Stock Units | $ | 20,738 | | | $ | 9,054 | | | $ | 1,889 | | | Stock grants | 1,018 | | | 724 | | | 489 | | | Stock options | 21 | | | 289 | | | 435 | | | Stock appreciation rights (“SARs”) | 23,438 | | | 7,319 | | | 22,188 | | | Restricted Stock Awards | 986 | | | 1,005 | | | 1,005 | | | Total stock-based compensation expense | $ | 46,201 | | | $ | 18,391 | | | $ | 26,006 | |
|
| Schedule of Restricted Stock and Restricted Stock Unit Activity |
The following presents a summary of restricted stock activity for the year ended December 31, 2023: | | | | | | | | | | | Weighted Average | | Number of Units | Grant Date Fair Value | Outstanding at January 1, 2023 | 241,436 | | $ | 109.69 | | | Granted | 236,800 | | 149.62 | | | Vested | (91,432) | | 103.97 | | | Forfeited/Canceled | — | | — | | Unvested at December 31, 2023 | 386,804 | | $ | 135.49 | |
The following presents a summary of restricted stock activity for the year ended December 31, 2023: | | | | | | | | | | | Weighted Average | | Number of Shares | Grant Date Fair Value | Outstanding at January 1, 2023 | 41,000 | | $ | 57.00 | | | Granted | — | | — | | | Vested | (26,000) | | 56.60 | | | | | Unvested at December 31, 2023 | 15,000 | | $ | 57.69 | |
|
| Schedule of Stock Option Activity |
The following presents a summary of stock option activity for the year ended December 31, 2023: | | | | | | | | | | | | | | | | | | | | | | | | | Number
of
Shares | | Weighted
Average
Exercise
Price | | Weighted
Average
Remaining
Contractual
Term | | Aggregate
Intrinsic Value
(In Thousands) | | Outstanding at January 1, 2023 | 275,500 | | | $ | 43.06 | | | | | | | | | | | | | | | Exercised | (22,000) | | | 42.53 | | | | | | | Forfeited/Canceled | — | | | — | | | | | | | Outstanding at December 31, 2023 | 253,500 | | | $ | 43.10 | | | 2.7 years | | $ | 43,222 | | | Vested and exercisable at December 31, 2023 | 253,500 | | | $ | 43.10 | | | 2.7 years | | $ | 43,222 | |
|
| Schedule of Stock Appreciation Rights Activity |
The following presents a summary of SARs activity for the year ended December 31, 2023: | | | | | | | | | | | | | | | | | | | | | | | | | Cash-settled SARs | | Weighted
Average
Exercise
Price | | Weighted
Average
Remaining
Contractual
Term | | Aggregate
Intrinsic Value
(In Thousands) | Outstanding at January 1, 2023 | 332,164 | | | $ | 54.18 | | | | | | | | | | | | | | | Exercised | (153,556) | | | 52.82 | | | | | | | Forfeited/Canceled | (6,600) | | | 56.47 | | | | | | Outstanding at December 31, 2023 | 172,008 | | | $ | 55.31 | | | 5.4 years | | $ | 27,228 | | Vested and exercisable at December 31, 2023 | 69,608 | | | $ | 53.51 | | | 5.0 years | | $ | 11,143 | |
|
| Schedule of Stock Appreciation Rights Valuation Assumptions |
The fair value of SARs outstanding during the years ended December 31, 2023, 2022 and 2021, are revalued each quarter using a Black-Scholes option pricing model and the following weighted average assumptions: | | | | | | | | | | | | | | | | | | | Year Ended December 31, | | 2023 | | 2022 | | 2021 | | Risk-free interest rate | 5.17 | % | | 4.46 | % | | 0.70 | % | | Expected dividend yield | 0.04 | % | | 0.06 | % | | 0.06 | % | | Expected volatility | 32.60 | % | | 44.03 | % | | 38.64 | % | | Expected lives | 0.6 years | | 1.3 years | | 2.1 years |
|
| X |
- DefinitionTabular disclosure of cost recognized for award under share-based payment arrangement by plan. Includes, but is not limited to, related tax benefit. Reference 1: http://fasb.org/us-gaap/role/ref/legacyRef
-Name Accounting Standards Codification
-Topic 718
-SubTopic 10
-Section 50
-Paragraph 2
-Subparagraph (h)(1)
-Publisher FASB
-URI https://asc.fasb.org//1943274/2147480429/718-10-50-2
| Name: |
us-gaap_ScheduleOfCompensationCostForShareBasedPaymentArrangementsAllocationOfShareBasedCompensationCostsByPlanTableTextBlock |
| Namespace Prefix: |
us-gaap_ |
| Data Type: |
dtr-types:textBlockItemType |
| Balance Type: |
na |
| Period Type: |
duration |
|
| X |
- DefinitionTabular disclosure of the number and weighted-average exercise prices (or conversion ratios) for stock appreciation rights awards that were outstanding at the beginning and end of the year, and the number of stock appreciation rights awards that were granted, exercised or converted, forfeited, and expired during the year. Reference 1: http://fasb.org/us-gaap/role/ref/legacyRef
-Name Accounting Standards Codification
-Topic 718
-SubTopic 10
-Section 50
-Paragraph 2
-Subparagraph (c)(1)
-Publisher FASB
-URI https://asc.fasb.org//1943274/2147480429/718-10-50-2
| Name: |
us-gaap_ScheduleOfShareBasedCompensationStockAppreciationRightsAwardActivityTableTextBlock |
| Namespace Prefix: |
us-gaap_ |
| Data Type: |
dtr-types:textBlockItemType |
| Balance Type: |
na |
| Period Type: |
duration |
|
| X |
- DefinitionTabular disclosure for stock option plans. Includes, but is not limited to, outstanding awards at beginning and end of year, grants, exercises, forfeitures, and weighted-average grant date fair value. Reference 1: http://fasb.org/us-gaap/role/ref/legacyRef
-Name Accounting Standards Codification
-Topic 718
-SubTopic 10
-Section 50
-Paragraph 2
-Subparagraph (c)(1)
-Publisher FASB
-URI https://asc.fasb.org//1943274/2147480429/718-10-50-2
Reference 2: http://fasb.org/us-gaap/role/ref/legacyRef
-Name Accounting Standards Codification
-Section 50
-Paragraph 2
-Subparagraph (d)
-SubTopic 10
-Topic 718
-Publisher FASB
-URI https://asc.fasb.org//1943274/2147480429/718-10-50-2
Reference 3: http://fasb.org/us-gaap/role/ref/legacyRef
-Name Accounting Standards Codification
-Section 50
-Paragraph 2
-Subparagraph (e)
-SubTopic 10
-Topic 718
-Publisher FASB
-URI https://asc.fasb.org//1943274/2147480429/718-10-50-2
| Name: |
us-gaap_ScheduleOfShareBasedCompensationStockOptionsActivityTableTextBlock |
| Namespace Prefix: |
us-gaap_ |
| Data Type: |
dtr-types:textBlockItemType |
| Balance Type: |
na |
| Period Type: |
duration |
|
| X |
- DefinitionDisclosure of the number and weighted-average grant date fair value for restricted stock and restricted stock units that were outstanding at the beginning and end of the year, and the number of restricted stock and restricted stock units that were granted, vested, or forfeited during the year.
| Name: |
us-gaap_ScheduleOfSharebasedCompensationRestrictedStockAndRestrictedStockUnitsActivityTableTextBlock |
| Namespace Prefix: |
us-gaap_ |
| Data Type: |
dtr-types:textBlockItemType |
| Balance Type: |
na |
| Period Type: |
duration |
|
| X |
- DefinitionSchedule of Share-based Payment Award, Non-Option Equity Instruments, Valuation Assumptions [Table Text Block]
| Name: |
wire_ScheduleofSharebasedPaymentAwardNonOptionEquityInstrumentsValuationAssumptionsTableTextBlock |
| Namespace Prefix: |
wire_ |
| Data Type: |
dtr-types1:textBlockItemType |
| Balance Type: |
na |
| Period Type: |
duration |
|
v3.24.0.1
Earnings Per Share (Tables)
|
12 Months Ended |
Dec. 31, 2023 |
|---|
| Earnings Per Share [Abstract] |
|
| Schedule of Computation of Basic and Diluted Earnings Per Share |
The following table sets forth certain components of the computation of basic and diluted earnings per share for the years ended December 31: | | | | | | | | | | | | | | | | | | | In Thousands | 2023 | | 2022 | | 2021 | | Numerator: | | | | | | | Net income | $ | 372,399 | | | $ | 717,841 | | | $ | 541,422 | | | | | | | | | Denominator: | | | | | | | Denominator for basic earnings per share – weighted average shares | 16,873 | | | 19,159 | | | 20,439 | | | | | | | | | Effect of dilutive securities: | | | | | | | Employee stock awards | 350 | | | 287 | | | 210 | | | | | | | | | Denominator for diluted earnings per share – weighted average shares | 17,223 | | | 19,446 | | | 20,649 | |
|
| Schedule of Anti-dilutive Excluded from Diluted Earnings Per Share |
Stock options to purchase common stock at exercise prices in excess of the average actual stock price for the period that were anti-dilutive and that were excluded from the determination of diluted earnings per share are as follows: | | | | | | | | | | | | | | | | | | | In Thousands, Except Per Share Data | 2023 | | 2022 | | 2021 | | Weighted average anti-dilutive stock options | — | | | — | | | — | | | | | | | | | Weighted average exercise price per share | $ | — | | | $ | — | | | $ | — | |
|
| X |
- References
+ Details
| Name: |
us-gaap_EarningsPerShareAbstract |
| Namespace Prefix: |
us-gaap_ |
| Data Type: |
xbrli:stringItemType |
| Balance Type: |
na |
| Period Type: |
duration |
|
| X |
- DefinitionTabular disclosure of securities (including those issuable pursuant to contingent stock agreements) that could potentially dilute basic earnings per share (EPS) in the future that were not included in the computation of diluted EPS because to do so would increase EPS amounts or decrease loss per share amounts for the period presented, by antidilutive securities. Reference 1: http://fasb.org/us-gaap/role/ref/legacyRef
-Name Accounting Standards Codification
-Topic 260
-SubTopic 10
-Section 50
-Paragraph 1
-Subparagraph (c)
-Publisher FASB
-URI https://asc.fasb.org//1943274/2147482662/260-10-50-1
| Name: |
us-gaap_ScheduleOfAntidilutiveSecuritiesExcludedFromComputationOfEarningsPerShareTextBlock |
| Namespace Prefix: |
us-gaap_ |
| Data Type: |
dtr-types:textBlockItemType |
| Balance Type: |
na |
| Period Type: |
duration |
|
| X |
- DefinitionTabular disclosure of an entity's basic and diluted earnings per share calculations, including a reconciliation of numerators and denominators of the basic and diluted per-share computations for income from continuing operations. Reference 1: http://www.xbrl.org/2009/role/commonPracticeRef
-Topic 260
-SubTopic 10
-Name Accounting Standards Codification
-Section 50
-Paragraph 1
-Subparagraph (a)
-Publisher FASB
-URI https://asc.fasb.org//1943274/2147482662/260-10-50-1
| Name: |
us-gaap_ScheduleOfEarningsPerShareBasicAndDilutedTableTextBlock |
| Namespace Prefix: |
us-gaap_ |
| Data Type: |
dtr-types:textBlockItemType |
| Balance Type: |
na |
| Period Type: |
duration |
|
v3.24.0.1
Quarterly Financial Information (Unaudited) (Tables)
|
12 Months Ended |
Dec. 31, 2023 |
|---|
| Quarterly Financial Information Disclosure [Abstract] |
|
| Schedule of Unaudited Quarterly Financial Information |
The following is a summary of the unaudited quarterly financial information for the two years ended December 31, 2023 and 2022 (in thousands, except per share data): | | | | | | | | | | | | | | | | | | | | | | | | | | Three Months Ended | | 2023 | March 31 | | June 30 | | September 30 | | December 31 | | Net sales | $ | 660,492 | | | $ | 636,460 | | | $ | 636,991 | | | $ | 633,779 | | | Gross profit | 205,085 | | | 166,148 | | | 148,242 | | | 136,408 | | | Net income | 119,483 | | | 104,741 | | | 82,052 | | | 66,123 | | | Earnings per common share – basic | 6.60 | | | 6.13 | | | 4.93 | | | 4.21 | | | Earnings per common share – diluted | 6.50 | | | 6.01 | | | 4.82 | | | 4.10 | |
| | | | | | | | | | | | | | | | | | | | | | | | | | Three Months Ended | | 2022 | March 31 | | June 30 | | September 30 | | December 31 | | Net sales | $ | 723,072 | | | $ | 838,235 | | | $ | 762,363 | | | $ | 693,885 | | | Gross profit | 243,747 | | | 320,772 | | | 299,447 | | | 248,455 | | | Net income | 161,531 | | | 210,538 | | | 191,773 | | | 153,998 | | | Earnings per common share – basic | 8.08 | | | 10.84 | | | 10.11 | | | 8.43 | | | Earnings per common share – diluted | 7.96 | | | 10.71 | | | 9.97 | | | 8.28 | |
|
| X |
- DefinitionTabular disclosure of quarterly financial data. Includes, but is not limited to, financial information for fiscal quarters, cumulative effect of a change in accounting principle and earnings per share data. Reference 1: http://www.xbrl.org/2003/role/disclosureRef
-Name Accounting Standards Codification
-Section 50
-Paragraph 1
-SubTopic 10
-Topic 270
-Publisher FASB
-URI https://asc.fasb.org//1943274/2147482964/270-10-50-1
| Name: |
us-gaap_ScheduleOfQuarterlyFinancialInformationTableTextBlock |
| Namespace Prefix: |
us-gaap_ |
| Data Type: |
dtr-types:textBlockItemType |
| Balance Type: |
na |
| Period Type: |
duration |
|
v3.24.0.1
Significant Accounting Policies - Narrative (Details)
$ in Thousands |
12 Months Ended |
|
|
|
Dec. 31, 2023
USD ($)
segment
customer
|
Dec. 31, 2022
USD ($)
|
Dec. 31, 2021
USD ($)
|
Sep. 01, 2023 |
Aug. 31, 2023 |
| Significant Accounting Policies [Line Items] |
|
|
|
|
|
| Number of operating segments | segment |
1
|
|
|
|
|
| Shipping and handling cost |
$ 204,510
|
$ 197,418
|
$ 168,543
|
|
|
| Buildings and improvements | Minimum |
|
|
|
|
|
| Significant Accounting Policies [Line Items] |
|
|
|
|
|
| Estimated useful lives of property plant and equipment |
3 years
|
|
|
|
|
| Buildings and improvements | Maximum |
|
|
|
|
|
| Significant Accounting Policies [Line Items] |
|
|
|
|
|
| Estimated useful lives of property plant and equipment |
45 years
|
|
|
|
|
| Machinery and equipment | Minimum |
|
|
|
|
|
| Significant Accounting Policies [Line Items] |
|
|
|
|
|
| Estimated useful lives of property plant and equipment |
2 years
|
|
|
|
|
| Machinery and equipment | Maximum |
|
|
|
|
|
| Significant Accounting Policies [Line Items] |
|
|
|
|
|
| Estimated useful lives of property plant and equipment |
20 years
|
|
|
|
|
| Furniture and fixtures | Minimum |
|
|
|
|
|
| Significant Accounting Policies [Line Items] |
|
|
|
|
|
| Estimated useful lives of property plant and equipment |
5 years
|
|
|
|
|
| Furniture and fixtures | Maximum |
|
|
|
|
|
| Significant Accounting Policies [Line Items] |
|
|
|
|
|
| Estimated useful lives of property plant and equipment |
20 years
|
|
|
|
|
| Building |
|
|
|
|
|
| Significant Accounting Policies [Line Items] |
|
|
|
|
|
| Estimated useful lives of property plant and equipment |
|
|
|
45 years
|
35 years
|
| Customer Concentration Risk | Sales Revenue, Net |
|
|
|
|
|
| Significant Accounting Policies [Line Items] |
|
|
|
|
|
| Customer concentration risk, number of customers | customer |
2
|
|
|
|
|
| Shipping and Handling |
|
|
|
|
|
| Significant Accounting Policies [Line Items] |
|
|
|
|
|
| Shipping and handling cost |
$ 51,200
|
$ 58,900
|
$ 47,200
|
|
|
| X |
- DefinitionNumber of operating segments. An operating segment is a component of an enterprise: (a) that engages in business activities from which it may earn revenues and incur expenses (including revenues and expenses relating to transactions with other components of the same enterprise), (b) whose operating results are regularly reviewed by the enterprise's chief operating decision maker to make decisions about resources to be allocated to the segment and assess its performance, and (c) for which discrete financial information is available. An operating segment may engage in business activities for which it has yet to earn revenues, for example, start-up operations may be operating segments before earning revenues. Reference 1: http://www.xbrl.org/2009/role/commonPracticeRef
-Topic 280
-SubTopic 10
-Name Accounting Standards Codification
-Section 50
-Paragraph 18
-Publisher FASB
-URI https://asc.fasb.org//1943274/2147482810/280-10-50-18
| Name: |
us-gaap_NumberOfOperatingSegments |
| Namespace Prefix: |
us-gaap_ |
| Data Type: |
xbrli:integerItemType |
| Balance Type: |
na |
| Period Type: |
duration |
|
| X |
- DefinitionUseful life of long lived, physical assets used in the normal conduct of business and not intended for resale, in 'PnYnMnDTnHnMnS' format, for example, 'P1Y5M13D' represents the reported fact of one year, five months, and thirteen days. Examples include, but not limited to, land, buildings, machinery and equipment, office equipment, furniture and fixtures, and computer equipment.
| Name: |
us-gaap_PropertyPlantAndEquipmentUsefulLife |
| Namespace Prefix: |
us-gaap_ |
| Data Type: |
xbrli:durationItemType |
| Balance Type: |
na |
| Period Type: |
instant |
|
| X |
- DefinitionThe aggregate total costs related to selling a firm's product and services, as well as all other general and administrative expenses. Direct selling expenses (for example, credit, warranty, and advertising) are expenses that can be directly linked to the sale of specific products. Indirect selling expenses are expenses that cannot be directly linked to the sale of specific products, for example telephone expenses, Internet, and postal charges. General and administrative expenses include salaries of non-sales personnel, rent, utilities, communication, etc. Reference 1: http://fasb.org/us-gaap/role/ref/legacyRef
-Topic 220
-SubTopic 10
-Name Accounting Standards Codification
-Section S99
-Paragraph 2
-Subparagraph (SX 210.5-03.4)
-Publisher FASB
-URI https://asc.fasb.org//1943274/2147483621/220-10-S99-2
| Name: |
us-gaap_SellingGeneralAndAdministrativeExpense |
| Namespace Prefix: |
us-gaap_ |
| Data Type: |
xbrli:monetaryItemType |
| Balance Type: |
debit |
| Period Type: |
duration |
|
| X |
- DefinitionCustomer Concentration Risk, Number of Customers
| Name: |
wire_CustomerConcentrationRiskNumberofCustomers |
| Namespace Prefix: |
wire_ |
| Data Type: |
xbrli:integerItemType |
| Balance Type: |
na |
| Period Type: |
duration |
|
| X |
- DefinitionSignificant Accounting Policies [Line Items]
| Name: |
wire_SignificantAccountingPoliciesLineItems |
| Namespace Prefix: |
wire_ |
| Data Type: |
xbrli:stringItemType |
| Balance Type: |
na |
| Period Type: |
duration |
|
| X |
- Details
| Name: |
us-gaap_PropertyPlantAndEquipmentByTypeAxis=us-gaap_BuildingAndBuildingImprovementsMember |
| Namespace Prefix: |
|
| Data Type: |
na |
| Balance Type: |
|
| Period Type: |
|
|
| X |
- Details
| Name: |
srt_RangeAxis=srt_MinimumMember |
| Namespace Prefix: |
|
| Data Type: |
na |
| Balance Type: |
|
| Period Type: |
|
|
| X |
- Details
| Name: |
srt_RangeAxis=srt_MaximumMember |
| Namespace Prefix: |
|
| Data Type: |
na |
| Balance Type: |
|
| Period Type: |
|
|
| X |
- Details
| Name: |
us-gaap_PropertyPlantAndEquipmentByTypeAxis=us-gaap_MachineryAndEquipmentMember |
| Namespace Prefix: |
|
| Data Type: |
na |
| Balance Type: |
|
| Period Type: |
|
|
| X |
- Details
| Name: |
us-gaap_PropertyPlantAndEquipmentByTypeAxis=us-gaap_FurnitureAndFixturesMember |
| Namespace Prefix: |
|
| Data Type: |
na |
| Balance Type: |
|
| Period Type: |
|
|
| X |
- Details
| Name: |
us-gaap_PropertyPlantAndEquipmentByTypeAxis=us-gaap_BuildingMember |
| Namespace Prefix: |
|
| Data Type: |
na |
| Balance Type: |
|
| Period Type: |
|
|
| X |
- Details
| Name: |
us-gaap_ConcentrationRiskByTypeAxis=us-gaap_CustomerConcentrationRiskMember |
| Namespace Prefix: |
|
| Data Type: |
na |
| Balance Type: |
|
| Period Type: |
|
|
| X |
- Details
| Name: |
us-gaap_ConcentrationRiskByBenchmarkAxis=us-gaap_SalesRevenueNetMember |
| Namespace Prefix: |
|
| Data Type: |
na |
| Balance Type: |
|
| Period Type: |
|
|
| X |
- Details
| Name: |
srt_ProductOrServiceAxis=us-gaap_ShippingAndHandlingMember |
| Namespace Prefix: |
|
| Data Type: |
na |
| Balance Type: |
|
| Period Type: |
|
|
v3.24.0.1
Significant Accounting Policies - Schedule of Allowance for Credit Losses (Details) - USD ($)
$ in Thousands |
12 Months Ended |
Dec. 31, 2023 |
Dec. 31, 2022 |
Dec. 31, 2021 |
| Allowance for Doubtful Accounts Receivable [Roll Forward] |
|
|
|
| Beginning balance January 1 |
$ 3,800
|
$ 3,800
|
$ 2,215
|
| Write-offs of bad debts |
(45)
|
0
|
0
|
| Collection of previous write-offs |
0
|
0
|
122
|
| Adjustment to allowance for credit losses |
(1,300)
|
0
|
1,463
|
| Ending balance at December 31 |
$ 2,455
|
$ 3,800
|
$ 3,800
|
| X |
- DefinitionAmount of allowance for credit loss on accounts receivable, classified as current. Reference 1: http://www.xbrl.org/2003/role/disclosureRef
-Topic 210
-SubTopic 10
-Name Accounting Standards Codification
-Section S99
-Paragraph 1
-Subparagraph (SX 210.5-02(4))
-Publisher FASB
-URI https://asc.fasb.org//1943274/2147480566/210-10-S99-1
Reference 2: http://www.xbrl.org/2003/role/disclosureRef
-Topic 326
-SubTopic 20
-Name Accounting Standards Codification
-Section 45
-Paragraph 1
-Publisher FASB
-URI https://asc.fasb.org//1943274/2147479344/326-20-45-1
Reference 3: http://www.xbrl.org/2003/role/disclosureRef
-Topic 310
-SubTopic 10
-Name Accounting Standards Codification
-Section 50
-Paragraph 4
-Publisher FASB
-URI https://asc.fasb.org//1943274/2147481962/310-10-50-4
| Name: |
us-gaap_AllowanceForDoubtfulAccountsReceivableCurrent |
| Namespace Prefix: |
us-gaap_ |
| Data Type: |
xbrli:monetaryItemType |
| Balance Type: |
credit |
| Period Type: |
instant |
|
| X |
- DefinitionAmount of increase in allowance for credit loss on accounts receivable, from recovery. Reference 1: http://www.xbrl.org/2003/role/disclosureRef
-Topic 326
-SubTopic 20
-Name Accounting Standards Codification
-Section 50
-Paragraph 13
-Subparagraph (e)
-Publisher FASB
-URI https://asc.fasb.org//1943274/2147479319/326-20-50-13
| Name: |
us-gaap_AllowanceForDoubtfulAccountsReceivableRecoveries |
| Namespace Prefix: |
us-gaap_ |
| Data Type: |
xbrli:monetaryItemType |
| Balance Type: |
credit |
| Period Type: |
duration |
|
| X |
- DefinitionA roll forward is a reconciliation of a concept from the beginning of a period to the end of a period.
| Name: |
us-gaap_AllowanceForDoubtfulAccountsReceivableRollforward |
| Namespace Prefix: |
us-gaap_ |
| Data Type: |
xbrli:stringItemType |
| Balance Type: |
na |
| Period Type: |
duration |
|
| X |
- DefinitionAmount of direct write-downs of accounts receivable charged against the allowance. Reference 1: http://www.xbrl.org/2003/role/disclosureRef
-Topic 326
-SubTopic 20
-Name Accounting Standards Codification
-Section 50
-Paragraph 13
-Subparagraph (d)
-Publisher FASB
-URI https://asc.fasb.org//1943274/2147479319/326-20-50-13
| Name: |
us-gaap_AllowanceForDoubtfulAccountsReceivableWriteOffs |
| Namespace Prefix: |
us-gaap_ |
| Data Type: |
xbrli:monetaryItemType |
| Balance Type: |
debit |
| Period Type: |
duration |
|
| X |
- DefinitionAmount of expense (reversal of expense) for expected credit loss on accounts receivable. Reference 1: http://www.xbrl.org/2003/role/disclosureRef
-Topic 326
-SubTopic 20
-Name Accounting Standards Codification
-Section 50
-Paragraph 13
-Subparagraph (b)
-Publisher FASB
-URI https://asc.fasb.org//1943274/2147479319/326-20-50-13
Reference 2: http://www.xbrl.org/2003/role/disclosureRef
-Topic 220
-SubTopic 10
-Name Accounting Standards Codification
-Section S99
-Paragraph 2
-Subparagraph (SX 210.5-03(5))
-Publisher FASB
-URI https://asc.fasb.org//1943274/2147483621/220-10-S99-2
| Name: |
us-gaap_ProvisionForDoubtfulAccounts |
| Namespace Prefix: |
us-gaap_ |
| Data Type: |
xbrli:monetaryItemType |
| Balance Type: |
debit |
| Period Type: |
duration |
|
v3.24.0.1
Inventories (Details) - USD ($)
$ in Thousands |
Dec. 31, 2023 |
Dec. 31, 2022 |
| Inventory Disclosure [Abstract] |
|
|
| Raw materials |
$ 64,512
|
$ 69,567
|
| Work-in-process |
55,921
|
42,611
|
| Finished goods |
139,348
|
138,943
|
| Total |
259,781
|
251,121
|
| Adjust to LIFO cost |
(96,102)
|
(97,934)
|
| Inventory, net |
$ 163,679
|
$ 153,187
|
| X |
- References
+ Details
| Name: |
us-gaap_InventoryDisclosureAbstract |
| Namespace Prefix: |
us-gaap_ |
| Data Type: |
xbrli:stringItemType |
| Balance Type: |
na |
| Period Type: |
duration |
|
| X |
- DefinitionAmount before valuation and LIFO reserves of completed merchandise or goods expected to be sold within one year or operating cycle, if longer. Reference 1: http://www.xbrl.org/2009/role/commonPracticeRef
-Topic 210
-SubTopic 10
-Name Accounting Standards Codification
-Section S99
-Paragraph 1
-Subparagraph (SX 210.5-02(6)(a)(1))
-Publisher FASB
-URI https://asc.fasb.org//1943274/2147480566/210-10-S99-1
| Name: |
us-gaap_InventoryFinishedGoods |
| Namespace Prefix: |
us-gaap_ |
| Data Type: |
xbrli:monetaryItemType |
| Balance Type: |
debit |
| Period Type: |
instant |
|
| X |
- DefinitionGross amount, as of the balance sheet date, of merchandise, goods, commodities, or supplies held for future sale or to be used in manufacturing, servicing or production process. Reference 1: http://www.xbrl.org/2009/role/commonPracticeRef
-Topic 210
-SubTopic 10
-Name Accounting Standards Codification
-Section S99
-Paragraph 1
-Subparagraph (SX 210.5-02(6))
-Publisher FASB
-URI https://asc.fasb.org//1943274/2147480566/210-10-S99-1
| Name: |
us-gaap_InventoryGross |
| Namespace Prefix: |
us-gaap_ |
| Data Type: |
xbrli:monetaryItemType |
| Balance Type: |
debit |
| Period Type: |
instant |
|
| X |
- DefinitionAmount by which inventory stated at last-in first-out (LIFO) is less than (in excess of) inventory stated at other inventory cost methods. Reference 1: http://www.xbrl.org/2009/role/commonPracticeRef
-Topic 210
-SubTopic 10
-Name Accounting Standards Codification
-Section S99
-Paragraph 1
-Subparagraph (SX 210.5-02(6)(c))
-Publisher FASB
-URI https://asc.fasb.org//1943274/2147480566/210-10-S99-1
| Name: |
us-gaap_InventoryLIFOReserve |
| Namespace Prefix: |
us-gaap_ |
| Data Type: |
xbrli:monetaryItemType |
| Balance Type: |
credit |
| Period Type: |
instant |
|
| X |
- DefinitionAmount after valuation and LIFO reserves of inventory expected to be sold, or consumed within one year or operating cycle, if longer. Reference 1: http://www.xbrl.org/2003/role/exampleRef
-Topic 852
-SubTopic 10
-Name Accounting Standards Codification
-Section 55
-Paragraph 10
-Publisher FASB
-URI https://asc.fasb.org//1943274/2147481372/852-10-55-10
Reference 2: http://www.xbrl.org/2003/role/exampleRef
-Topic 210
-SubTopic 10
-Name Accounting Standards Codification
-Section 45
-Paragraph 1
-Subparagraph (b)
-Publisher FASB
-URI https://asc.fasb.org//1943274/2147483467/210-10-45-1
Reference 3: http://www.xbrl.org/2003/role/disclosureRef
-Topic 210
-SubTopic 10
-Name Accounting Standards Codification
-Section S99
-Paragraph 1
-Subparagraph (SX 210.5-02(6))
-Publisher FASB
-URI https://asc.fasb.org//1943274/2147480566/210-10-S99-1
| Name: |
us-gaap_InventoryNet |
| Namespace Prefix: |
us-gaap_ |
| Data Type: |
xbrli:monetaryItemType |
| Balance Type: |
debit |
| Period Type: |
instant |
|
| X |
- DefinitionAmount before valuation and LIFO reserves of raw materials expected to be sold, or consumed within one year or operating cycle, if longer. Reference 1: http://www.xbrl.org/2009/role/commonPracticeRef
-Topic 210
-SubTopic 10
-Name Accounting Standards Codification
-Section S99
-Paragraph 1
-Subparagraph (SX 210.5-02(6)(a)(4))
-Publisher FASB
-URI https://asc.fasb.org//1943274/2147480566/210-10-S99-1
| Name: |
us-gaap_InventoryRawMaterials |
| Namespace Prefix: |
us-gaap_ |
| Data Type: |
xbrli:monetaryItemType |
| Balance Type: |
debit |
| Period Type: |
instant |
|
| X |
- DefinitionAmount before valuation and LIFO reserves of merchandise or goods in the production process expected to be completed within one year or operating cycle, if longer. Reference 1: http://www.xbrl.org/2009/role/commonPracticeRef
-Topic 210
-SubTopic 10
-Name Accounting Standards Codification
-Section S99
-Paragraph 1
-Subparagraph (SX 210.5-02(6)(a)(3))
-Publisher FASB
-URI https://asc.fasb.org//1943274/2147480566/210-10-S99-1
| Name: |
us-gaap_InventoryWorkInProcess |
| Namespace Prefix: |
us-gaap_ |
| Data Type: |
xbrli:monetaryItemType |
| Balance Type: |
debit |
| Period Type: |
instant |
|
v3.24.0.1
Property, Plant and Equipment, net - Schedule of Property, Plant and Equipment (Details) - USD ($)
$ in Thousands |
Dec. 31, 2023 |
Dec. 31, 2022 |
| Property, Plant and Equipment [Line Items] |
|
|
| Property, plant and equipment, gross |
$ 1,062,658
|
$ 897,334
|
| Accumulated depreciation |
(305,795)
|
(280,733)
|
| Property, plant and equipment, net |
756,863
|
616,601
|
| Land and land improvements |
|
|
| Property, Plant and Equipment [Line Items] |
|
|
| Property, plant and equipment, gross |
90,162
|
85,286
|
| Construction-in-progress |
|
|
| Property, Plant and Equipment [Line Items] |
|
|
| Property, plant and equipment, gross |
163,514
|
125,809
|
| Buildings and improvements |
|
|
| Property, Plant and Equipment [Line Items] |
|
|
| Property, plant and equipment, gross |
313,691
|
232,758
|
| Machinery and equipment |
|
|
| Property, Plant and Equipment [Line Items] |
|
|
| Property, plant and equipment, gross |
478,060
|
438,303
|
| Furniture and fixtures |
|
|
| Property, Plant and Equipment [Line Items] |
|
|
| Property, plant and equipment, gross |
$ 17,231
|
$ 15,178
|
| X |
- DefinitionAmount of accumulated depreciation, depletion and amortization for physical assets used in the normal conduct of business to produce goods and services. Reference 1: http://www.xbrl.org/2003/role/disclosureRef
-Topic 944
-SubTopic 210
-Name Accounting Standards Codification
-Section S99
-Paragraph 1
-Subparagraph (SX 210.7-03(a)(8)(b))
-Publisher FASB
-URI https://asc.fasb.org//1943274/2147479440/944-210-S99-1
Reference 2: http://www.xbrl.org/2003/role/disclosureRef
-Topic 210
-SubTopic 10
-Name Accounting Standards Codification
-Section S99
-Paragraph 1
-Subparagraph (SX 210.5-02(14))
-Publisher FASB
-URI https://asc.fasb.org//1943274/2147480566/210-10-S99-1
Reference 3: http://fasb.org/us-gaap/role/ref/legacyRef
-Name Accounting Standards Codification
-Topic 360
-SubTopic 10
-Section 50
-Paragraph 1
-Subparagraph (c)
-Publisher FASB
-URI https://asc.fasb.org//1943274/2147482099/360-10-50-1
| Name: |
us-gaap_AccumulatedDepreciationDepletionAndAmortizationPropertyPlantAndEquipment |
| Namespace Prefix: |
us-gaap_ |
| Data Type: |
xbrli:monetaryItemType |
| Balance Type: |
credit |
| Period Type: |
instant |
|
| X |
- DefinitionAmount before accumulated depreciation, depletion and amortization of physical assets used in the normal conduct of business and not intended for resale. Examples include, but are not limited to, land, buildings, machinery and equipment, office equipment, and furniture and fixtures. Reference 1: http://www.xbrl.org/2003/role/disclosureRef
-Topic 944
-SubTopic 210
-Name Accounting Standards Codification
-Section S99
-Paragraph 1
-Subparagraph (SX 210.7-03(a)(8))
-Publisher FASB
-URI https://asc.fasb.org//1943274/2147479440/944-210-S99-1
Reference 2: http://www.xbrl.org/2003/role/disclosureRef
-Topic 210
-SubTopic 10
-Name Accounting Standards Codification
-Section S99
-Paragraph 1
-Subparagraph (SX 210.5-02(13))
-Publisher FASB
-URI https://asc.fasb.org//1943274/2147480566/210-10-S99-1
Reference 3: http://fasb.org/us-gaap/role/ref/legacyRef
-Topic 360
-SubTopic 10
-Name Accounting Standards Codification
-Section 50
-Paragraph 1
-Subparagraph (b)
-Publisher FASB
-URI https://asc.fasb.org//1943274/2147482099/360-10-50-1
| Name: |
us-gaap_PropertyPlantAndEquipmentGross |
| Namespace Prefix: |
us-gaap_ |
| Data Type: |
xbrli:monetaryItemType |
| Balance Type: |
debit |
| Period Type: |
instant |
|
| X |
- DefinitionLine items represent financial concepts included in a table. These concepts are used to disclose reportable information associated with domain members defined in one or many axes to the table.
| Name: |
us-gaap_PropertyPlantAndEquipmentLineItems |
| Namespace Prefix: |
us-gaap_ |
| Data Type: |
xbrli:stringItemType |
| Balance Type: |
na |
| Period Type: |
duration |
|
| X |
- DefinitionAmount after accumulated depreciation, depletion and amortization of physical assets used in the normal conduct of business to produce goods and services and not intended for resale. Examples include, but are not limited to, land, buildings, machinery and equipment, office equipment, and furniture and fixtures. Reference 1: http://fasb.org/us-gaap/role/ref/legacyRef
-Name Accounting Standards Codification
-Section 50
-Paragraph 1
-SubTopic 10
-Topic 360
-Publisher FASB
-URI https://asc.fasb.org//1943274/2147482099/360-10-50-1
Reference 2: http://www.xbrl.org/2003/role/exampleRef
-Topic 852
-SubTopic 10
-Name Accounting Standards Codification
-Section 55
-Paragraph 10
-Publisher FASB
-URI https://asc.fasb.org//1943274/2147481372/852-10-55-10
Reference 3: http://www.xbrl.org/2003/role/disclosureRef
-Topic 944
-SubTopic 210
-Name Accounting Standards Codification
-Section S99
-Paragraph 1
-Subparagraph (SX 210.7-03(a)(8))
-Publisher FASB
-URI https://asc.fasb.org//1943274/2147479440/944-210-S99-1
Reference 4: http://www.xbrl.org/2003/role/disclosureRef
-Topic 942
-SubTopic 360
-Name Accounting Standards Codification
-Section 50
-Paragraph 1
-Publisher FASB
-URI https://asc.fasb.org//1943274/2147480842/942-360-50-1
| Name: |
us-gaap_PropertyPlantAndEquipmentNet |
| Namespace Prefix: |
us-gaap_ |
| Data Type: |
xbrli:monetaryItemType |
| Balance Type: |
debit |
| Period Type: |
instant |
|
| X |
- Details
| Name: |
us-gaap_PropertyPlantAndEquipmentByTypeAxis=us-gaap_LandAndLandImprovementsMember |
| Namespace Prefix: |
|
| Data Type: |
na |
| Balance Type: |
|
| Period Type: |
|
|
| X |
- Details
| Name: |
us-gaap_PropertyPlantAndEquipmentByTypeAxis=us-gaap_ConstructionInProgressMember |
| Namespace Prefix: |
|
| Data Type: |
na |
| Balance Type: |
|
| Period Type: |
|
|
| X |
- Details
| Name: |
us-gaap_PropertyPlantAndEquipmentByTypeAxis=us-gaap_BuildingAndBuildingImprovementsMember |
| Namespace Prefix: |
|
| Data Type: |
na |
| Balance Type: |
|
| Period Type: |
|
|
| X |
- Details
| Name: |
us-gaap_PropertyPlantAndEquipmentByTypeAxis=us-gaap_MachineryAndEquipmentMember |
| Namespace Prefix: |
|
| Data Type: |
na |
| Balance Type: |
|
| Period Type: |
|
|
| X |
- Details
| Name: |
us-gaap_PropertyPlantAndEquipmentByTypeAxis=us-gaap_FurnitureAndFixturesMember |
| Namespace Prefix: |
|
| Data Type: |
na |
| Balance Type: |
|
| Period Type: |
|
|
v3.24.0.1
| X |
- DefinitionThe amount of expense recognized in the current period that reflects the allocation of the cost of tangible assets over the assets' useful lives. Includes production and non-production related depreciation. Reference 1: http://fasb.org/us-gaap/role/ref/legacyRef
-Name Accounting Standards Codification
-Section 45
-Paragraph 28
-Subparagraph (b)
-SubTopic 10
-Topic 230
-Publisher FASB
-URI https://asc.fasb.org//1943274/2147482740/230-10-45-28
Reference 2: http://fasb.org/us-gaap/role/ref/legacyRef
-Name Accounting Standards Codification
-Topic 360
-SubTopic 10
-Section 50
-Paragraph 1
-Subparagraph (a)
-Publisher FASB
-URI https://asc.fasb.org//1943274/2147482099/360-10-50-1
| Name: |
us-gaap_Depreciation |
| Namespace Prefix: |
us-gaap_ |
| Data Type: |
xbrli:monetaryItemType |
| Balance Type: |
debit |
| Period Type: |
duration |
|
| X |
- References
+ Details
| Name: |
us-gaap_PropertyPlantAndEquipmentAbstract |
| Namespace Prefix: |
us-gaap_ |
| Data Type: |
xbrli:stringItemType |
| Balance Type: |
na |
| Period Type: |
duration |
|
v3.24.0.1
Accrued Liabilities (Details) - USD ($)
$ in Thousands |
Dec. 31, 2023 |
Dec. 31, 2022 |
| Accrued Liabilities, Current [Abstract] |
|
|
| Sales rebates payable |
$ 39,123
|
$ 40,909
|
| Stock Appreciation Rights (SAR) Liability |
22,182
|
20,282
|
| Property taxes payable |
5,827
|
5,287
|
| Accrued salaries |
6,947
|
7,616
|
| Other accrued liabilities |
5,511
|
7,287
|
| Total accrued liabilities |
$ 79,590
|
$ 81,381
|
| X |
- DefinitionCarrying value as of the balance sheet date of obligations incurred and payable, pertaining to costs that are statutory in nature, are incurred on contractual obligations, or accumulate over time and for which invoices have not yet been received or will not be rendered. Examples include taxes, interest, rent and utilities. Used to reflect the current portion of the liabilities (due within one year or within the normal operating cycle if longer). Reference 1: http://fasb.org/us-gaap/role/ref/legacyRef
-Name Accounting Standards Codification
-Topic 210
-SubTopic 10
-Section S99
-Paragraph 1
-Subparagraph (SX 210.5-02.20)
-Publisher FASB
-URI https://asc.fasb.org//1943274/2147480566/210-10-S99-1
| Name: |
us-gaap_AccruedLiabilitiesCurrent |
| Namespace Prefix: |
us-gaap_ |
| Data Type: |
xbrli:monetaryItemType |
| Balance Type: |
credit |
| Period Type: |
instant |
|
| X |
- References
+ Details
| Name: |
us-gaap_AccruedLiabilitiesCurrentAbstract |
| Namespace Prefix: |
us-gaap_ |
| Data Type: |
xbrli:stringItemType |
| Balance Type: |
na |
| Period Type: |
duration |
|
| X |
- DefinitionCarrying value as of the balance sheet date of the obligations incurred through that date and payable for employees' services provided. Used to reflect the current portion of the liabilities (due within one year or within the normal operating cycle if longer). Reference 1: http://www.xbrl.org/2003/role/exampleRef
-Topic 210
-SubTopic 10
-Name Accounting Standards Codification
-Section 45
-Paragraph 8
-Subparagraph (c)
-Publisher FASB
-URI https://asc.fasb.org//1943274/2147483467/210-10-45-8
Reference 2: http://fasb.org/us-gaap/role/ref/legacyRef
-Name Accounting Standards Codification
-Topic 210
-SubTopic 10
-Section S99
-Paragraph 1
-Subparagraph (SX 210.5-02.20)
-Publisher FASB
-URI https://asc.fasb.org//1943274/2147480566/210-10-S99-1
| Name: |
us-gaap_AccruedSalariesCurrent |
| Namespace Prefix: |
us-gaap_ |
| Data Type: |
xbrli:monetaryItemType |
| Balance Type: |
credit |
| Period Type: |
instant |
|
| X |
- DefinitionAmount of expenses incurred but not yet paid classified as other, due within one year or the normal operating cycle, if longer. Reference 1: http://fasb.org/us-gaap/role/ref/legacyRef
-Name Accounting Standards Codification
-Topic 210
-SubTopic 10
-Section S99
-Paragraph 1
-Subparagraph (SX 210.5-02.20)
-Publisher FASB
-URI https://asc.fasb.org//1943274/2147480566/210-10-S99-1
| Name: |
us-gaap_OtherAccruedLiabilitiesCurrent |
| Namespace Prefix: |
us-gaap_ |
| Data Type: |
xbrli:monetaryItemType |
| Balance Type: |
credit |
| Period Type: |
instant |
|
| X |
- DefinitionAccrual For SAR Liability
| Name: |
wire_AccrualForSARLiability |
| Namespace Prefix: |
wire_ |
| Data Type: |
xbrli:monetaryItemType |
| Balance Type: |
credit |
| Period Type: |
instant |
|
| X |
- DefinitionCarrying value as of the balance sheet date of obligations incurred through that date and payable for sales volume rebates.
| Name: |
wire_SalesVolumeRebatesPayable |
| Namespace Prefix: |
wire_ |
| Data Type: |
xbrli:monetaryItemType |
| Balance Type: |
credit |
| Period Type: |
instant |
|
v3.24.0.1
Debt (Details)
|
|
|
12 Months Ended |
Oct. 20, 2022 |
Feb. 09, 2021
USD ($)
bank
|
Dec. 31, 2023
USD ($)
|
Dec. 31, 2022
USD ($)
|
Dec. 31, 2021
USD ($)
|
| Line of Credit Facility [Line Items] |
|
|
|
|
|
| Debt outstanding |
|
|
$ 0
|
$ 0
|
|
| Number of banks to which the company is party to a credit agreement | bank |
|
2
|
|
|
|
| Outstanding borrowings |
|
|
0
|
|
|
| Letters of credit outstanding |
|
|
300,000
|
|
|
| Remaining borrowing capacity |
|
|
199,700,000
|
|
|
| Total interest paid |
|
|
400,000
|
400,000
|
$ 400,000
|
| Total interest capitalized |
|
|
$ 0
|
$ 0
|
$ 0
|
| Credit Agreement |
|
|
|
|
|
| Line of Credit Facility [Line Items] |
|
|
|
|
|
| Calculated maximum borrowings |
|
$ 200,000,000.0
|
|
|
|
| Available increase in borrowings under credit agreement |
|
$ 100,000,000.0
|
|
|
|
| Credit Agreement | Minimum |
|
|
|
|
|
| Line of Credit Facility [Line Items] |
|
|
|
|
|
| Percentage of commitment fee |
0.20%
|
|
|
|
|
| Credit Agreement | Maximum |
|
|
|
|
|
| Line of Credit Facility [Line Items] |
|
|
|
|
|
| Percentage of commitment fee |
0.325%
|
|
|
|
|
| Credit Agreement | Credit Agreement Interest Rate Option One | Minimum | Bloomberg Short-Term Bank Yield Index (BSBY) |
|
|
|
|
|
| Line of Credit Facility [Line Items] |
|
|
|
|
|
| Debt instrument basis spread on variable rate |
1.00%
|
|
|
|
|
| Credit Agreement | Credit Agreement Interest Rate Option One | Maximum | Bloomberg Short-Term Bank Yield Index (BSBY) |
|
|
|
|
|
| Line of Credit Facility [Line Items] |
|
|
|
|
|
| Debt instrument basis spread on variable rate |
1.875%
|
|
|
|
|
| Credit Agreement | Credit Agreement Interest Rate Option Two | Bloomberg Short-Term Bank Yield Index (BSBY) |
|
|
|
|
|
| Line of Credit Facility [Line Items] |
|
|
|
|
|
| Debt instrument basis spread on variable rate |
1.00%
|
|
|
|
|
| Credit Agreement | Credit Agreement Interest Rate Option Two | Minimum | Base Rate |
|
|
|
|
|
| Line of Credit Facility [Line Items] |
|
|
|
|
|
| Debt instrument basis spread on variable rate |
0.00%
|
|
|
|
|
| Credit Agreement | Credit Agreement Interest Rate Option Two | Maximum | Federal Funds Rate |
|
|
|
|
|
| Line of Credit Facility [Line Items] |
|
|
|
|
|
| Debt instrument basis spread on variable rate |
0.50%
|
|
|
|
|
| Credit Agreement | Credit Agreement Interest Rate Option Two | Maximum | Base Rate |
|
|
|
|
|
| Line of Credit Facility [Line Items] |
|
|
|
|
|
| Debt instrument basis spread on variable rate |
0.375%
|
|
|
|
|
| X |
- DefinitionPercentage points added to the reference rate to compute the variable rate on the debt instrument.
| Name: |
us-gaap_DebtInstrumentBasisSpreadOnVariableRate1 |
| Namespace Prefix: |
us-gaap_ |
| Data Type: |
dtr-types:percentItemType |
| Balance Type: |
na |
| Period Type: |
duration |
|
| X |
- DefinitionAmount of the cost of borrowed funds accounted for as interest expense. Reference 1: http://www.xbrl.org/2003/role/exampleRef
-Topic 946
-SubTopic 830
-Name Accounting Standards Codification
-Section 55
-Paragraph 10
-Publisher FASB
-URI https://asc.fasb.org//1943274/2147480167/946-830-55-10
Reference 2: http://www.xbrl.org/2009/role/commonPracticeRef
-Topic 946
-SubTopic 220
-Name Accounting Standards Codification
-Section 45
-Paragraph 3
-Subparagraph (i)
-Publisher FASB
-URI https://asc.fasb.org//1943274/2147483581/946-220-45-3
Reference 3: http://www.xbrl.org/2003/role/disclosureRef
-Topic 946
-SubTopic 220
-Name Accounting Standards Codification
-Section S99
-Paragraph 1
-Subparagraph (SX 210.6-07(3))
-Publisher FASB
-URI https://asc.fasb.org//1943274/2147483575/946-220-S99-1
Reference 4: http://www.xbrl.org/2003/role/disclosureRef
-Topic 280
-SubTopic 10
-Name Accounting Standards Codification
-Section 50
-Paragraph 22
-Subparagraph (d)
-Publisher FASB
-URI https://asc.fasb.org//1943274/2147482810/280-10-50-22
Reference 5: http://fasb.org/us-gaap/role/ref/legacyRef
-Name Accounting Standards Codification
-Topic 835
-SubTopic 30
-Section 45
-Paragraph 3
-Publisher FASB
-URI https://asc.fasb.org//1943274/2147482925/835-30-45-3
Reference 6: http://fasb.org/us-gaap/role/ref/legacyRef
-Topic 942
-SubTopic 220
-Name Accounting Standards Codification
-Section S99
-Paragraph 1
-Subparagraph (SX 210.9-04.9)
-Publisher FASB
-URI https://asc.fasb.org//1943274/2147483589/942-220-S99-1
Reference 7: http://www.xbrl.org/2003/role/disclosureRef
-Topic 220
-SubTopic 10
-Name Accounting Standards Codification
-Section S99
-Paragraph 2
-Subparagraph (210.5-03(11))
-Publisher FASB
-URI https://asc.fasb.org//1943274/2147483621/220-10-S99-2
Reference 8: http://www.xbrl.org/2003/role/disclosureRef
-Topic 835
-SubTopic 20
-Name Accounting Standards Codification
-Section 50
-Paragraph 1
-Subparagraph (a)
-Publisher FASB
-URI https://asc.fasb.org//1943274/2147483013/835-20-50-1
| Name: |
us-gaap_InterestExpense |
| Namespace Prefix: |
us-gaap_ |
| Data Type: |
xbrli:monetaryItemType |
| Balance Type: |
debit |
| Period Type: |
duration |
|
| X |
- DefinitionAmount of cash paid for interest capitalized, classified as investing activity. Reference 1: http://www.xbrl.org/2003/role/exampleRef
-Topic 230
-SubTopic 10
-Name Accounting Standards Codification
-Section 45
-Paragraph 13
-Subparagraph (c)
-Publisher FASB
-URI https://asc.fasb.org//1943274/2147482740/230-10-45-13
Reference 2: http://www.xbrl.org/2009/role/commonPracticeRef
-Topic 230
-SubTopic 10
-Name Accounting Standards Codification
-Section 50
-Paragraph 2
-Publisher FASB
-URI https://asc.fasb.org//1943274/2147482913/230-10-50-2
| Name: |
us-gaap_InterestPaidCapitalized |
| Namespace Prefix: |
us-gaap_ |
| Data Type: |
xbrli:monetaryItemType |
| Balance Type: |
credit |
| Period Type: |
duration |
|
| X |
- DefinitionThe total amount of the contingent obligation under letters of credit outstanding as of the reporting date.
| Name: |
us-gaap_LettersOfCreditOutstandingAmount |
| Namespace Prefix: |
us-gaap_ |
| Data Type: |
xbrli:monetaryItemType |
| Balance Type: |
credit |
| Period Type: |
instant |
|
| X |
- DefinitionThe carrying value as of the balance sheet date of the current and noncurrent portions of long-term obligations drawn from a line of credit, which is a bank's commitment to make loans up to a specific amount. Examples of items that might be included in the application of this element may consist of letters of credit, standby letters of credit, and revolving credit arrangements, under which borrowings can be made up to a maximum amount as of any point in time conditional on satisfaction of specified terms before, as of and after the date of drawdowns on the line. Includes short-term obligations that would normally be classified as current liabilities but for which (a) postbalance sheet date issuance of a long term obligation to refinance the short term obligation on a long term basis, or (b) the enterprise has entered into a financing agreement that clearly permits the enterprise to refinance the short-term obligation on a long term basis and the following conditions are met (1) the agreement does not expire within 1 year and is not cancelable by the lender except for violation of an objectively determinable provision, (2) no violation exists at the BS date, and (3) the lender has entered into the financing agreement is expected to be financially capable of honoring the agreement. Reference 1: http://fasb.org/us-gaap/role/ref/legacyRef
-Name Accounting Standards Codification
-Section S99
-Paragraph 1
-Subparagraph (SX 210.5-02(22))
-SubTopic 10
-Topic 210
-Publisher FASB
-URI https://asc.fasb.org//1943274/2147480566/210-10-S99-1
Reference 2: http://www.xbrl.org/2009/role/commonPracticeRef
-Topic 944
-SubTopic 210
-Name Accounting Standards Codification
-Section S99
-Paragraph 1
-Subparagraph (SX 210.7-03(a)(16)(a)(2))
-Publisher FASB
-URI https://asc.fasb.org//1943274/2147479440/944-210-S99-1
Reference 3: http://fasb.org/us-gaap/role/ref/legacyRef
-Topic 942
-SubTopic 210
-Name Accounting Standards Codification
-Section S99
-Paragraph 1
-Subparagraph (SX 210.9-03(16))
-Publisher FASB
-URI https://asc.fasb.org//1943274/2147479853/942-210-S99-1
| Name: |
us-gaap_LineOfCredit |
| Namespace Prefix: |
us-gaap_ |
| Data Type: |
xbrli:monetaryItemType |
| Balance Type: |
credit |
| Period Type: |
instant |
|
| X |
- DefinitionAmount of current borrowing capacity under the credit facility considering any current restrictions on the amount that could be borrowed (for example, borrowings may be limited by the amount of current assets), but without considering any amounts currently outstanding under the facility. Reference 1: http://fasb.org/us-gaap/role/ref/legacyRef
-Name Accounting Standards Codification
-Topic 210
-SubTopic 10
-Section S99
-Paragraph 1
-Subparagraph (SX 210.5-02.19(b),22(b))
-Publisher FASB
-URI https://asc.fasb.org//1943274/2147480566/210-10-S99-1
| Name: |
us-gaap_LineOfCreditFacilityCurrentBorrowingCapacity |
| Namespace Prefix: |
us-gaap_ |
| Data Type: |
xbrli:monetaryItemType |
| Balance Type: |
credit |
| Period Type: |
instant |
|
| X |
- DefinitionLine items represent financial concepts included in a table. These concepts are used to disclose reportable information associated with domain members defined in one or many axes to the table. Reference 1: http://www.xbrl.org/2009/role/commonPracticeRef
-Topic 235
-SubTopic 10
-Name Accounting Standards Codification
-Section S99
-Paragraph 1
-Subparagraph (SX 210.4-08(f))
-Publisher FASB
-URI https://asc.fasb.org//1943274/2147480678/235-10-S99-1
| Name: |
us-gaap_LineOfCreditFacilityLineItems |
| Namespace Prefix: |
us-gaap_ |
| Data Type: |
xbrli:stringItemType |
| Balance Type: |
na |
| Period Type: |
duration |
|
| X |
- DefinitionMaximum borrowing capacity under the credit facility without consideration of any current restrictions on the amount that could be borrowed or the amounts currently outstanding under the facility. Reference 1: http://fasb.org/us-gaap/role/ref/legacyRef
-Name Accounting Standards Codification
-Topic 210
-SubTopic 10
-Section S99
-Paragraph 1
-Subparagraph (SX 210.5-02.19(b),22(b))
-Publisher FASB
-URI https://asc.fasb.org//1943274/2147480566/210-10-S99-1
| Name: |
us-gaap_LineOfCreditFacilityMaximumBorrowingCapacity |
| Namespace Prefix: |
us-gaap_ |
| Data Type: |
xbrli:monetaryItemType |
| Balance Type: |
credit |
| Period Type: |
instant |
|
| X |
- DefinitionThe fee, expressed as a percentage of the line of credit facility, for available but unused credit capacity under the credit facility.
| Name: |
us-gaap_LineOfCreditFacilityUnusedCapacityCommitmentFeePercentage |
| Namespace Prefix: |
us-gaap_ |
| Data Type: |
dtr-types:percentItemType |
| Balance Type: |
na |
| Period Type: |
duration |
|
| X |
- DefinitionAmount, after deduction of unamortized premium (discount) and debt issuance cost, of long-term debt. Excludes lease obligation. Reference 1: http://fasb.org/us-gaap/role/ref/legacyRef
-Name Accounting Standards Codification
-Section S99
-Paragraph 1
-Subparagraph (SX 210.5-02(22))
-SubTopic 10
-Topic 210
-Publisher FASB
-URI https://asc.fasb.org//1943274/2147480566/210-10-S99-1
Reference 2: http://www.xbrl.org/2003/role/exampleRef
-Topic 470
-SubTopic 20
-Name Accounting Standards Codification
-Section 55
-Paragraph 69B
-Publisher FASB
-URI https://asc.fasb.org//1943274/2147481568/470-20-55-69B
Reference 3: http://www.xbrl.org/2003/role/exampleRef
-Topic 470
-SubTopic 20
-Name Accounting Standards Codification
-Section 55
-Paragraph 69C
-Publisher FASB
-URI https://asc.fasb.org//1943274/2147481568/470-20-55-69C
Reference 4: http://www.xbrl.org/2003/role/disclosureRef
-Topic 470
-SubTopic 20
-Name Accounting Standards Codification
-Section 50
-Paragraph 1D
-Subparagraph (b)
-Publisher FASB
-URI https://asc.fasb.org//1943274/2147481139/470-20-50-1D
Reference 5: http://www.xbrl.org/2009/role/commonPracticeRef
-Topic 944
-SubTopic 210
-Name Accounting Standards Codification
-Section S99
-Paragraph 1
-Subparagraph (SX 210.7-03(a)(16)(a)(2))
-Publisher FASB
-URI https://asc.fasb.org//1943274/2147479440/944-210-S99-1
Reference 6: http://fasb.org/us-gaap/role/ref/legacyRef
-Topic 942
-SubTopic 210
-Name Accounting Standards Codification
-Section S99
-Paragraph 1
-Subparagraph (SX 210.9-03(16))
-Publisher FASB
-URI https://asc.fasb.org//1943274/2147479853/942-210-S99-1
Reference 7: http://www.xbrl.org/2003/role/disclosureRef
-Topic 470
-SubTopic 20
-Name Accounting Standards Codification
-Section 50
-Paragraph 4
-Subparagraph (b)(3)
-Publisher FASB
-URI https://asc.fasb.org//1943274/2147481139/470-20-50-4
| Name: |
us-gaap_LongTermDebt |
| Namespace Prefix: |
us-gaap_ |
| Data Type: |
xbrli:monetaryItemType |
| Balance Type: |
credit |
| Period Type: |
instant |
|
| X |
- DefinitionAn Accordion, also called an Option, gives the Borrower the right to increase a credit facility up to a certain amount as defined in the credit agreement without getting further approval from existing lenders. The incremental dollars may be provided by the existing Lenders or new Lenders.
| Name: |
wire_LineOfCreditAccordionExtensionOption |
| Namespace Prefix: |
wire_ |
| Data Type: |
xbrli:monetaryItemType |
| Balance Type: |
credit |
| Period Type: |
duration |
|
| X |
- DefinitionNumber of lender banks in credit agreement.
| Name: |
wire_NumberOfLenderBanksInCreditAgreement |
| Namespace Prefix: |
wire_ |
| Data Type: |
xbrli:integerItemType |
| Balance Type: |
na |
| Period Type: |
duration |
|
| X |
- Details
| Name: |
us-gaap_CreditFacilityAxis=wire_CreditAgreementMember |
| Namespace Prefix: |
|
| Data Type: |
na |
| Balance Type: |
|
| Period Type: |
|
|
| X |
- Details
| Name: |
srt_RangeAxis=srt_MinimumMember |
| Namespace Prefix: |
|
| Data Type: |
na |
| Balance Type: |
|
| Period Type: |
|
|
| X |
- Details
| Name: |
srt_RangeAxis=srt_MaximumMember |
| Namespace Prefix: |
|
| Data Type: |
na |
| Balance Type: |
|
| Period Type: |
|
|
| X |
- Details
| Name: |
us-gaap_FinancialInstrumentAxis=wire_CreditAgreementInterestRateOptionOneMember |
| Namespace Prefix: |
|
| Data Type: |
na |
| Balance Type: |
|
| Period Type: |
|
|
| X |
- Details
| Name: |
us-gaap_VariableRateAxis=wire_BloombergShortTermBankYieldIndexMember |
| Namespace Prefix: |
|
| Data Type: |
na |
| Balance Type: |
|
| Period Type: |
|
|
| X |
- Details
| Name: |
us-gaap_FinancialInstrumentAxis=wire_CreditAgreementInterestRateOptionTwoMember |
| Namespace Prefix: |
|
| Data Type: |
na |
| Balance Type: |
|
| Period Type: |
|
|
| X |
- Details
| Name: |
us-gaap_VariableRateAxis=us-gaap_BaseRateMember |
| Namespace Prefix: |
|
| Data Type: |
na |
| Balance Type: |
|
| Period Type: |
|
|
| X |
- Details
| Name: |
us-gaap_VariableRateAxis=us-gaap_FederalFundsEffectiveSwapRateMember |
| Namespace Prefix: |
|
| Data Type: |
na |
| Balance Type: |
|
| Period Type: |
|
|
v3.24.0.1
Income Taxes - Schedule of Income Tax Expenses (Details) - USD ($)
$ in Thousands |
12 Months Ended |
Dec. 31, 2023 |
Dec. 31, 2022 |
Dec. 31, 2021 |
| Current: |
|
|
|
| Federal |
$ 100,472
|
$ 175,090
|
$ 143,392
|
| State |
7,428
|
12,379
|
12,319
|
| Deferred: |
|
|
|
| Federal |
4,115
|
19,797
|
2,132
|
| State |
227
|
(257)
|
132
|
| Total income tax expense |
$ 112,242
|
$ 207,009
|
$ 157,975
|
| X |
- DefinitionAmount of current federal tax expense (benefit) attributable to income (loss) from continuing operations. Includes, but is not limited to, current national tax expense (benefit) for non-US (United States of America) jurisdiction. Reference 1: http://www.xbrl.org/2009/role/commonPracticeRef
-Topic 235
-SubTopic 10
-Name Accounting Standards Codification
-Section S99
-Paragraph 1
-Subparagraph (SX 210.4-08(h)(1)(Note 1))
-Publisher FASB
-URI https://asc.fasb.org//1943274/2147480678/235-10-S99-1
Reference 2: http://www.xbrl.org/2009/role/commonPracticeRef
-Name Accounting Standards Codification
-Section 50
-Paragraph 9
-Subparagraph (a)
-SubTopic 10
-Topic 740
-Publisher FASB
-URI https://asc.fasb.org//1943274/2147482685/740-10-50-9
Reference 3: http://www.xbrl.org/2009/role/commonPracticeRef
-Topic 740
-SubTopic 10
-Name Accounting Standards Codification
-Section S99
-Paragraph 1
-Subparagraph (SAB Topic 6.I.7)
-Publisher FASB
-URI https://asc.fasb.org//1943274/2147479360/740-10-S99-1
| Name: |
us-gaap_CurrentFederalTaxExpenseBenefit |
| Namespace Prefix: |
us-gaap_ |
| Data Type: |
xbrli:monetaryItemType |
| Balance Type: |
debit |
| Period Type: |
duration |
|
| X |
- DefinitionAmount of current state and local tax expense (benefit) attributable to income (loss) from continuing operations. Includes, but is not limited to, current regional, territorial, and provincial tax expense (benefit) for non-US (United States of America) jurisdiction. Reference 1: http://www.xbrl.org/2009/role/commonPracticeRef
-Topic 235
-SubTopic 10
-Name Accounting Standards Codification
-Section S99
-Paragraph 1
-Subparagraph (SX 210.4-08(h)(1)(Note 1))
-Publisher FASB
-URI https://asc.fasb.org//1943274/2147480678/235-10-S99-1
Reference 2: http://www.xbrl.org/2009/role/commonPracticeRef
-Name Accounting Standards Codification
-Section 50
-Paragraph 9
-Subparagraph (a)
-SubTopic 10
-Topic 740
-Publisher FASB
-URI https://asc.fasb.org//1943274/2147482685/740-10-50-9
Reference 3: http://www.xbrl.org/2009/role/commonPracticeRef
-Topic 740
-SubTopic 10
-Name Accounting Standards Codification
-Section S99
-Paragraph 1
-Subparagraph (SAB Topic 6.I.7)
-Publisher FASB
-URI https://asc.fasb.org//1943274/2147479360/740-10-S99-1
| Name: |
us-gaap_CurrentStateAndLocalTaxExpenseBenefit |
| Namespace Prefix: |
us-gaap_ |
| Data Type: |
xbrli:monetaryItemType |
| Balance Type: |
debit |
| Period Type: |
duration |
|
v3.24.0.1
Income Taxes - Schedule of Differences Between Provision for Income Taxes and Income Taxes Computed Using Federal Income Tax Rate (Details) - USD ($)
$ in Thousands |
12 Months Ended |
Dec. 31, 2023 |
Dec. 31, 2022 |
Dec. 31, 2021 |
| Income Tax Disclosure [Abstract] |
|
|
|
| Amount computed using the statutory rate |
$ 101,775
|
$ 194,218
|
$ 146,873
|
| State income taxes, net of federal tax benefit |
6,047
|
9,576
|
9,836
|
| 162(m) disallowance |
5,687
|
3,244
|
1,355
|
| Other |
(1,267)
|
(29)
|
(89)
|
| Total income tax expense |
$ 112,242
|
$ 207,009
|
$ 157,975
|
v3.24.0.1
Income Taxes - Schedule of Net Deferred Tax Liability (Details) - USD ($)
$ in Thousands |
Dec. 31, 2023 |
Dec. 31, 2022 |
| Income Tax Disclosure [Abstract] |
|
|
| Depreciation |
$ (65,688)
|
$ (60,304)
|
| Inventory |
(2,462)
|
(2,080)
|
| Allowance for credit losses |
545
|
843
|
| Uniform capitalization rules |
1,110
|
574
|
| Stock-based compensation |
6,170
|
4,791
|
| Other |
343
|
536
|
| Net deferred income tax liability |
$ (59,982)
|
$ (55,640)
|
| X |
- DefinitionAmount, before allocation of valuation allowance, of deferred tax asset attributable to deductible temporary differences, classified as other. Reference 1: http://www.xbrl.org/2009/role/commonPracticeRef
-Topic 740
-SubTopic 10
-Name Accounting Standards Codification
-Section 50
-Paragraph 6
-Publisher FASB
-URI https://asc.fasb.org//1943274/2147482685/740-10-50-6
Reference 2: http://fasb.org/us-gaap/role/ref/legacyRef
-Name Accounting Standards Codification
-Topic 740
-SubTopic 10
-Section 50
-Paragraph 8
-Publisher FASB
-URI https://asc.fasb.org//1943274/2147482685/740-10-50-8
| Name: |
us-gaap_DeferredTaxAssetsOther |
| Namespace Prefix: |
us-gaap_ |
| Data Type: |
xbrli:monetaryItemType |
| Balance Type: |
debit |
| Period Type: |
instant |
|
| X |
- DefinitionAmount before allocation of valuation allowances of deferred tax asset attributable to deductible temporary differences from share-based compensation. Reference 1: http://www.xbrl.org/2009/role/commonPracticeRef
-Topic 740
-SubTopic 10
-Name Accounting Standards Codification
-Section 50
-Paragraph 6
-Publisher FASB
-URI https://asc.fasb.org//1943274/2147482685/740-10-50-6
Reference 2: http://fasb.org/us-gaap/role/ref/legacyRef
-Name Accounting Standards Codification
-Topic 740
-SubTopic 10
-Section 50
-Paragraph 8
-Publisher FASB
-URI https://asc.fasb.org//1943274/2147482685/740-10-50-8
| Name: |
us-gaap_DeferredTaxAssetsTaxDeferredExpenseCompensationAndBenefitsShareBasedCompensationCost |
| Namespace Prefix: |
us-gaap_ |
| Data Type: |
xbrli:monetaryItemType |
| Balance Type: |
debit |
| Period Type: |
instant |
|
| X |
- DefinitionAmount, before allocation of valuation allowance, of deferred tax asset attributable to deductible temporary difference from allowance for credit loss on accounts receivable. Reference 1: http://www.xbrl.org/2009/role/commonPracticeRef
-Topic 740
-SubTopic 10
-Name Accounting Standards Codification
-Section 50
-Paragraph 6
-Publisher FASB
-URI https://asc.fasb.org//1943274/2147482685/740-10-50-6
Reference 2: http://fasb.org/us-gaap/role/ref/legacyRef
-Name Accounting Standards Codification
-Topic 740
-SubTopic 10
-Section 50
-Paragraph 8
-Publisher FASB
-URI https://asc.fasb.org//1943274/2147482685/740-10-50-8
| Name: |
us-gaap_DeferredTaxAssetsTaxDeferredExpenseReservesAndAccrualsAllowanceForDoubtfulAccounts |
| Namespace Prefix: |
us-gaap_ |
| Data Type: |
xbrli:monetaryItemType |
| Balance Type: |
debit |
| Period Type: |
instant |
|
| X |
- DefinitionAmount, after deferred tax asset, of deferred tax liability attributable to taxable differences without jurisdictional netting. Reference 1: http://www.xbrl.org/2009/role/commonPracticeRef
-Topic 740
-SubTopic 10
-Name Accounting Standards Codification
-Section 50
-Paragraph 2
-Publisher FASB
-URI https://asc.fasb.org//1943274/2147482685/740-10-50-2
Reference 2: http://fasb.org/us-gaap/role/ref/legacyRef
-Name Accounting Standards Codification
-Topic 740
-SubTopic 10
-Section 45
-Paragraph 6
-Publisher FASB
-URI https://asc.fasb.org//1943274/2147482525/740-10-45-6
| Name: |
us-gaap_DeferredTaxLiabilities |
| Namespace Prefix: |
us-gaap_ |
| Data Type: |
xbrli:monetaryItemType |
| Balance Type: |
credit |
| Period Type: |
instant |
|
| X |
- DefinitionAmount of deferred tax consequences attributable to taxable temporary differences derived from inventory. Reference 1: http://www.xbrl.org/2009/role/commonPracticeRef
-Topic 740
-SubTopic 10
-Name Accounting Standards Codification
-Section 50
-Paragraph 6
-Publisher FASB
-URI https://asc.fasb.org//1943274/2147482685/740-10-50-6
Reference 2: http://fasb.org/us-gaap/role/ref/legacyRef
-Name Accounting Standards Codification
-Topic 740
-SubTopic 10
-Section 50
-Paragraph 8
-Publisher FASB
-URI https://asc.fasb.org//1943274/2147482685/740-10-50-8
| Name: |
us-gaap_DeferredTaxLiabilitiesDeferredExpenseCapitalizedInventoryCosts |
| Namespace Prefix: |
us-gaap_ |
| Data Type: |
xbrli:monetaryItemType |
| Balance Type: |
credit |
| Period Type: |
instant |
|
| X |
- DefinitionAmount of deferred tax liability attributable to taxable temporary differences from property, plant, and equipment. Reference 1: http://www.xbrl.org/2009/role/commonPracticeRef
-Topic 740
-SubTopic 10
-Name Accounting Standards Codification
-Section 50
-Paragraph 6
-Publisher FASB
-URI https://asc.fasb.org//1943274/2147482685/740-10-50-6
Reference 2: http://fasb.org/us-gaap/role/ref/legacyRef
-Name Accounting Standards Codification
-Topic 740
-SubTopic 10
-Section 50
-Paragraph 8
-Publisher FASB
-URI https://asc.fasb.org//1943274/2147482685/740-10-50-8
| Name: |
us-gaap_DeferredTaxLiabilitiesPropertyPlantAndEquipment |
| Namespace Prefix: |
us-gaap_ |
| Data Type: |
xbrli:monetaryItemType |
| Balance Type: |
credit |
| Period Type: |
instant |
|
v3.24.0.1
Income Taxes - Narrative (Details) - USD ($)
|
12 Months Ended |
Dec. 31, 2023 |
Dec. 31, 2022 |
Dec. 31, 2021 |
| Income Tax Disclosure [Abstract] |
|
|
|
| Inventory |
$ 2,462,000
|
$ 2,080,000
|
|
| Income tax payments |
97,700,000
|
201,700,000
|
$ 155,500,000
|
| Reserve for uncertain tax positions |
$ 0
|
$ 0
|
|
| X |
- DefinitionAmount of deferred tax consequences attributable to taxable temporary differences derived from inventory. Reference 1: http://www.xbrl.org/2009/role/commonPracticeRef
-Topic 740
-SubTopic 10
-Name Accounting Standards Codification
-Section 50
-Paragraph 6
-Publisher FASB
-URI https://asc.fasb.org//1943274/2147482685/740-10-50-6
Reference 2: http://fasb.org/us-gaap/role/ref/legacyRef
-Name Accounting Standards Codification
-Topic 740
-SubTopic 10
-Section 50
-Paragraph 8
-Publisher FASB
-URI https://asc.fasb.org//1943274/2147482685/740-10-50-8
| Name: |
us-gaap_DeferredTaxLiabilitiesDeferredExpenseCapitalizedInventoryCosts |
| Namespace Prefix: |
us-gaap_ |
| Data Type: |
xbrli:monetaryItemType |
| Balance Type: |
credit |
| Period Type: |
instant |
|
| X |
- DefinitionAmount recognized for uncertainty in income taxes classified as noncurrent. Reference 1: http://fasb.org/us-gaap/role/ref/legacyRef
-Name Accounting Standards Codification
-Topic 210
-SubTopic 10
-Section S99
-Paragraph 1
-Subparagraph (SX 210.5-02.24)
-Publisher FASB
-URI https://asc.fasb.org//1943274/2147480566/210-10-S99-1
| Name: |
us-gaap_LiabilityForUncertainTaxPositionsNoncurrent |
| Namespace Prefix: |
us-gaap_ |
| Data Type: |
xbrli:monetaryItemType |
| Balance Type: |
credit |
| Period Type: |
instant |
|
v3.24.0.1
Stock-Based Compensation - Stock-based Compensation Expense by Type of Award (Details) - USD ($)
$ in Thousands |
12 Months Ended |
Dec. 31, 2023 |
Dec. 31, 2022 |
Dec. 31, 2021 |
| Share-based Compensation Arrangement by Share-based Payment Award [Line Items] |
|
|
|
| Total stock-based compensation expense |
$ 46,201
|
$ 18,391
|
$ 26,006
|
| Restricted Stock Units |
|
|
|
| Share-based Compensation Arrangement by Share-based Payment Award [Line Items] |
|
|
|
| Total stock-based compensation expense |
20,738
|
9,054
|
1,889
|
| Stock grants |
|
|
|
| Share-based Compensation Arrangement by Share-based Payment Award [Line Items] |
|
|
|
| Total stock-based compensation expense |
1,018
|
724
|
489
|
| Stock options |
|
|
|
| Share-based Compensation Arrangement by Share-based Payment Award [Line Items] |
|
|
|
| Total stock-based compensation expense |
21
|
289
|
435
|
| Stock appreciation rights (“SARs”) |
|
|
|
| Share-based Compensation Arrangement by Share-based Payment Award [Line Items] |
|
|
|
| Total stock-based compensation expense |
23,438
|
7,319
|
22,188
|
| Restricted Stock Awards |
|
|
|
| Share-based Compensation Arrangement by Share-based Payment Award [Line Items] |
|
|
|
| Total stock-based compensation expense |
$ 986
|
$ 1,005
|
$ 1,005
|
| X |
- DefinitionAmount of expense for award under share-based payment arrangement. Excludes amount capitalized. Reference 1: http://www.xbrl.org/2003/role/disclosureRef
-Topic 718
-SubTopic 10
-Name Accounting Standards Codification
-Section S99
-Paragraph 1
-Subparagraph (SAB Topic 14.F)
-Publisher FASB
-URI https://asc.fasb.org//1943274/2147479830/718-10-S99-1
Reference 2: http://www.xbrl.org/2003/role/disclosureRef
-Topic 718
-SubTopic 10
-Name Accounting Standards Codification
-Section 50
-Paragraph 2
-Subparagraph (h)(1)(i)
-Publisher FASB
-URI https://asc.fasb.org//1943274/2147480429/718-10-50-2
| Name: |
us-gaap_AllocatedShareBasedCompensationExpense |
| Namespace Prefix: |
us-gaap_ |
| Data Type: |
xbrli:monetaryItemType |
| Balance Type: |
debit |
| Period Type: |
duration |
|
| X |
- DefinitionLine items represent financial concepts included in a table. These concepts are used to disclose reportable information associated with domain members defined in one or many axes to the table. Reference 1: http://www.xbrl.org/2003/role/disclosureRef
-Topic 718
-SubTopic 10
-Name Accounting Standards Codification
-Section 35
-Paragraph 1D
-Publisher FASB
-URI https://asc.fasb.org//1943274/2147480483/718-10-35-1D
Reference 2: http://www.xbrl.org/2003/role/disclosureRef
-Topic 718
-SubTopic 10
-Name Accounting Standards Codification
-Section 35
-Paragraph 3
-Publisher FASB
-URI https://asc.fasb.org//1943274/2147480483/718-10-35-3
Reference 3: http://www.xbrl.org/2003/role/disclosureRef
-Topic 718
-SubTopic 10
-Name Accounting Standards Codification
-Section 50
-Paragraph 2
-Subparagraph (a)(1)
-Publisher FASB
-URI https://asc.fasb.org//1943274/2147480429/718-10-50-2
Reference 4: http://www.xbrl.org/2003/role/disclosureRef
-Topic 718
-SubTopic 10
-Name Accounting Standards Codification
-Section 50
-Paragraph 2
-Subparagraph (a)(2)
-Publisher FASB
-URI https://asc.fasb.org//1943274/2147480429/718-10-50-2
Reference 5: http://www.xbrl.org/2003/role/disclosureRef
-Topic 718
-SubTopic 10
-Name Accounting Standards Codification
-Section 50
-Paragraph 2
-Subparagraph (a)(3)
-Publisher FASB
-URI https://asc.fasb.org//1943274/2147480429/718-10-50-2
Reference 6: http://www.xbrl.org/2003/role/disclosureRef
-Topic 718
-SubTopic 10
-Name Accounting Standards Codification
-Section 50
-Paragraph 2
-Subparagraph (c)(1)(i)
-Publisher FASB
-URI https://asc.fasb.org//1943274/2147480429/718-10-50-2
Reference 7: http://www.xbrl.org/2003/role/disclosureRef
-Topic 718
-SubTopic 10
-Name Accounting Standards Codification
-Section 50
-Paragraph 2
-Subparagraph (c)(1)(ii)
-Publisher FASB
-URI https://asc.fasb.org//1943274/2147480429/718-10-50-2
Reference 8: http://www.xbrl.org/2003/role/disclosureRef
-Topic 718
-SubTopic 10
-Name Accounting Standards Codification
-Section 50
-Paragraph 2
-Subparagraph (c)(1)(iii)
-Publisher FASB
-URI https://asc.fasb.org//1943274/2147480429/718-10-50-2
Reference 9: http://www.xbrl.org/2003/role/disclosureRef
-Topic 718
-SubTopic 10
-Name Accounting Standards Codification
-Section 50
-Paragraph 2
-Subparagraph (c)(1)(iv)
-Publisher FASB
-URI https://asc.fasb.org//1943274/2147480429/718-10-50-2
Reference 10: http://www.xbrl.org/2003/role/disclosureRef
-Topic 718
-SubTopic 10
-Name Accounting Standards Codification
-Section 50
-Paragraph 2
-Subparagraph (c)(1)(iv)(01)
-Publisher FASB
-URI https://asc.fasb.org//1943274/2147480429/718-10-50-2
Reference 11: http://www.xbrl.org/2003/role/disclosureRef
-Topic 718
-SubTopic 10
-Name Accounting Standards Codification
-Section 50
-Paragraph 2
-Subparagraph (c)(1)(iv)(02)
-Publisher FASB
-URI https://asc.fasb.org//1943274/2147480429/718-10-50-2
Reference 12: http://www.xbrl.org/2003/role/disclosureRef
-Topic 718
-SubTopic 10
-Name Accounting Standards Codification
-Section 50
-Paragraph 2
-Subparagraph (c)(1)(iv)(03)
-Publisher FASB
-URI https://asc.fasb.org//1943274/2147480429/718-10-50-2
Reference 13: http://www.xbrl.org/2003/role/disclosureRef
-Topic 718
-SubTopic 10
-Name Accounting Standards Codification
-Section 50
-Paragraph 2
-Subparagraph (c)(1)(iv)(04)
-Publisher FASB
-URI https://asc.fasb.org//1943274/2147480429/718-10-50-2
Reference 14: http://www.xbrl.org/2003/role/disclosureRef
-Topic 718
-SubTopic 10
-Name Accounting Standards Codification
-Section 50
-Paragraph 2
-Subparagraph (c)(2)(i)
-Publisher FASB
-URI https://asc.fasb.org//1943274/2147480429/718-10-50-2
Reference 15: http://www.xbrl.org/2003/role/disclosureRef
-Topic 718
-SubTopic 10
-Name Accounting Standards Codification
-Section 50
-Paragraph 2
-Subparagraph (c)(2)(ii)
-Publisher FASB
-URI https://asc.fasb.org//1943274/2147480429/718-10-50-2
Reference 16: http://www.xbrl.org/2003/role/disclosureRef
-Topic 718
-SubTopic 10
-Name Accounting Standards Codification
-Section 50
-Paragraph 2
-Subparagraph (c)(2)(iii)
-Publisher FASB
-URI https://asc.fasb.org//1943274/2147480429/718-10-50-2
Reference 17: http://www.xbrl.org/2003/role/disclosureRef
-Topic 718
-SubTopic 10
-Name Accounting Standards Codification
-Section 50
-Paragraph 2
-Subparagraph (c)(2)(iii)(01)
-Publisher FASB
-URI https://asc.fasb.org//1943274/2147480429/718-10-50-2
Reference 18: http://www.xbrl.org/2003/role/disclosureRef
-Topic 718
-SubTopic 10
-Name Accounting Standards Codification
-Section 50
-Paragraph 2
-Subparagraph (c)(2)(iii)(02)
-Publisher FASB
-URI https://asc.fasb.org//1943274/2147480429/718-10-50-2
Reference 19: http://www.xbrl.org/2003/role/disclosureRef
-Topic 718
-SubTopic 10
-Name Accounting Standards Codification
-Section 50
-Paragraph 2
-Subparagraph (c)(2)(iii)(03)
-Publisher FASB
-URI https://asc.fasb.org//1943274/2147480429/718-10-50-2
Reference 20: http://www.xbrl.org/2003/role/disclosureRef
-Topic 718
-SubTopic 10
-Name Accounting Standards Codification
-Section 50
-Paragraph 2
-Subparagraph (d)(1)
-Publisher FASB
-URI https://asc.fasb.org//1943274/2147480429/718-10-50-2
Reference 21: http://www.xbrl.org/2003/role/disclosureRef
-Topic 718
-SubTopic 10
-Name Accounting Standards Codification
-Section 50
-Paragraph 2
-Subparagraph (d)(2)
-Publisher FASB
-URI https://asc.fasb.org//1943274/2147480429/718-10-50-2
Reference 22: http://www.xbrl.org/2003/role/disclosureRef
-Topic 718
-SubTopic 10
-Name Accounting Standards Codification
-Section 50
-Paragraph 2
-Subparagraph (e)(1)
-Publisher FASB
-URI https://asc.fasb.org//1943274/2147480429/718-10-50-2
Reference 23: http://www.xbrl.org/2003/role/disclosureRef
-Topic 718
-SubTopic 10
-Name Accounting Standards Codification
-Section 50
-Paragraph 2
-Subparagraph (e)(2)
-Publisher FASB
-URI https://asc.fasb.org//1943274/2147480429/718-10-50-2
Reference 24: http://www.xbrl.org/2003/role/disclosureRef
-Topic 718
-SubTopic 10
-Name Accounting Standards Codification
-Section 50
-Paragraph 2
-Subparagraph (f)(2)(i)
-Publisher FASB
-URI https://asc.fasb.org//1943274/2147480429/718-10-50-2
Reference 25: http://www.xbrl.org/2003/role/disclosureRef
-Topic 718
-SubTopic 10
-Name Accounting Standards Codification
-Section 50
-Paragraph 2
-Subparagraph (f)(2)(ii)
-Publisher FASB
-URI https://asc.fasb.org//1943274/2147480429/718-10-50-2
Reference 26: http://www.xbrl.org/2003/role/disclosureRef
-Topic 718
-SubTopic 10
-Name Accounting Standards Codification
-Section 50
-Paragraph 2
-Subparagraph (f)(2)(iii)
-Publisher FASB
-URI https://asc.fasb.org//1943274/2147480429/718-10-50-2
Reference 27: http://www.xbrl.org/2003/role/disclosureRef
-Topic 718
-SubTopic 10
-Name Accounting Standards Codification
-Section 50
-Paragraph 2
-Subparagraph (f)(2)(iv)
-Publisher FASB
-URI https://asc.fasb.org//1943274/2147480429/718-10-50-2
Reference 28: http://www.xbrl.org/2003/role/disclosureRef
-Topic 718
-SubTopic 10
-Name Accounting Standards Codification
-Section 50
-Paragraph 2
-Subparagraph (f)(2)(v)
-Publisher FASB
-URI https://asc.fasb.org//1943274/2147480429/718-10-50-2
| Name: |
us-gaap_ShareBasedCompensationArrangementByShareBasedPaymentAwardLineItems |
| Namespace Prefix: |
us-gaap_ |
| Data Type: |
xbrli:stringItemType |
| Balance Type: |
na |
| Period Type: |
duration |
|
| X |
- Details
| Name: |
us-gaap_AwardTypeAxis=us-gaap_RestrictedStockUnitsRSUMember |
| Namespace Prefix: |
|
| Data Type: |
na |
| Balance Type: |
|
| Period Type: |
|
|
| X |
- Details
| Name: |
us-gaap_AwardTypeAxis=wire_EmployeeStockGrantMember |
| Namespace Prefix: |
|
| Data Type: |
na |
| Balance Type: |
|
| Period Type: |
|
|
| X |
- Details
| Name: |
us-gaap_AwardTypeAxis=us-gaap_EmployeeStockOptionMember |
| Namespace Prefix: |
|
| Data Type: |
na |
| Balance Type: |
|
| Period Type: |
|
|
| X |
- Details
| Name: |
us-gaap_AwardTypeAxis=us-gaap_StockAppreciationRightsSARSMember |
| Namespace Prefix: |
|
| Data Type: |
na |
| Balance Type: |
|
| Period Type: |
|
|
| X |
- Details
| Name: |
us-gaap_AwardTypeAxis=us-gaap_RestrictedStockMember |
| Namespace Prefix: |
|
| Data Type: |
na |
| Balance Type: |
|
| Period Type: |
|
|
v3.24.0.1
Stock-Based Compensation - Narrative (Details)
|
1 Months Ended |
12 Months Ended |
36 Months Ended |
|
|
May 31, 2023
director
$ / shares
shares
|
Sep. 30, 2022
director
$ / shares
shares
|
May 31, 2022
director
$ / shares
shares
|
May 31, 2021
director
$ / shares
shares
|
Dec. 31, 2023
USD ($)
$ / shares
shares
|
Dec. 31, 2022
USD ($)
$ / shares
shares
|
Dec. 31, 2021
USD ($)
$ / shares
shares
|
Dec. 31, 2023
USD ($)
shares
|
Dec. 31, 2020
shares
|
| Share-based Compensation Arrangement by Share-based Payment Award [Line Items] |
|
|
|
|
|
|
|
|
|
| Number of securities authorized | shares |
|
|
|
|
|
|
|
|
1,000,000
|
| Shares available to be granted (in shares) | shares |
|
|
|
|
463,550
|
|
|
463,550
|
|
| Stock options granted (in shares) | shares |
|
|
|
|
0
|
0
|
0
|
|
|
| Total intrinsic value of options exercised |
|
|
|
|
$ 2,900,000
|
$ 200,000
|
$ 3,100,000
|
|
|
| Total unrecognized compensation cost related to non-vested stock options |
|
|
|
|
$ 0
|
|
|
$ 0
|
|
| Restricted Stock Units |
|
|
|
|
|
|
|
|
|
| Share-based Compensation Arrangement by Share-based Payment Award [Line Items] |
|
|
|
|
|
|
|
|
|
| Award vesting period |
|
|
|
|
3 years
|
|
|
|
|
| Granted (in shares) | shares |
|
|
|
|
236,800
|
177,200
|
98,600
|
|
|
| Weighted average grant date fair value (in usd per share) | $ / shares |
|
|
|
|
$ 149.62
|
$ 127.58
|
$ 61.92
|
|
|
| Unrecognized compensation cost |
|
|
|
|
$ 32,300,000
|
|
|
32,300,000
|
|
| Weighted average period of compensation cost |
|
|
|
|
1 year 9 months 18 days
|
|
|
|
|
| Stock grants |
|
|
|
|
|
|
|
|
|
| Share-based Compensation Arrangement by Share-based Payment Award [Line Items] |
|
|
|
|
|
|
|
|
|
| Granted (in shares) | shares |
1,250
|
850
|
1,250
|
1,250
|
|
|
|
|
|
| Weighted average grant date fair value (in usd per share) | $ / shares |
$ 162.93
|
$ 125.37
|
$ 123.45
|
$ 78.29
|
|
|
|
|
|
| Number of non-employee directors | director |
5
|
1
|
4
|
5
|
|
|
|
|
|
| Employee stock awards |
|
|
|
|
|
|
|
|
|
| Share-based Compensation Arrangement by Share-based Payment Award [Line Items] |
|
|
|
|
|
|
|
|
|
| Award vesting period |
|
|
|
|
5 years
|
|
|
|
|
| Award expiration period |
|
|
|
|
10 years
|
|
|
|
|
| Stock appreciation rights (“SARs”) |
|
|
|
|
|
|
|
|
|
| Share-based Compensation Arrangement by Share-based Payment Award [Line Items] |
|
|
|
|
|
|
|
|
|
| Award vesting period |
|
|
|
|
5 years
|
|
|
|
|
| Weighted average grant date fair value (in usd per share) | $ / shares |
|
|
|
|
$ 159.92
|
$ 87.20
|
$ 90.04
|
|
|
| Unrecognized compensation cost |
|
|
|
|
$ 5,300,000
|
|
|
5,300,000
|
|
| Weighted average period of compensation cost |
|
|
|
|
1 year
|
|
|
|
|
| Award expiration period |
|
|
|
|
10 years
|
|
|
|
|
| Liability balance |
|
|
|
|
$ 22,200,000
|
$ 20,300,000
|
|
$ 22,200,000
|
|
| Stock appreciation rights outstanding (in shares) | shares |
|
|
|
|
172,008
|
332,164
|
|
172,008
|
|
| Intrinsic value of SARs exercised |
|
|
|
|
$ 21,500,000
|
$ 9,100,000
|
$ 5,400,000
|
|
|
| Restricted Stock Awards |
|
|
|
|
|
|
|
|
|
| Share-based Compensation Arrangement by Share-based Payment Award [Line Items] |
|
|
|
|
|
|
|
|
|
| Award vesting period |
|
|
|
|
5 years
|
|
|
|
|
| Granted (in shares) | shares |
|
|
|
|
0
|
|
|
0
|
|
| Weighted average grant date fair value (in usd per share) | $ / shares |
|
|
|
|
$ 0
|
|
|
|
|
| Unrecognized compensation cost |
|
|
|
|
$ 400,000
|
|
|
$ 400,000
|
|
| Weighted average period of compensation cost |
|
|
|
|
9 months 18 days
|
|
|
|
|
| Total fair value of shares vested during year |
|
|
|
|
$ 4,400,000
|
|
|
|
|
| X |
- DefinitionWeighted-average period over which cost not yet recognized is expected to be recognized for award under share-based payment arrangement, in 'PnYnMnDTnHnMnS' format, for example, 'P1Y5M13D' represents reported fact of one year, five months, and thirteen days. Reference 1: http://www.xbrl.org/2003/role/disclosureRef
-Topic 718
-SubTopic 10
-Name Accounting Standards Codification
-Section 50
-Paragraph 2
-Subparagraph (i)
-Publisher FASB
-URI https://asc.fasb.org//1943274/2147480429/718-10-50-2
| Name: |
us-gaap_EmployeeServiceShareBasedCompensationNonvestedAwardsTotalCompensationCostNotYetRecognizedPeriodForRecognition1 |
| Namespace Prefix: |
us-gaap_ |
| Data Type: |
xbrli:durationItemType |
| Balance Type: |
na |
| Period Type: |
duration |
|
| X |
- DefinitionAmount of cost to be recognized for nonvested award under share-based payment arrangement. Excludes share and unit options. Reference 1: http://www.xbrl.org/2009/role/commonPracticeRef
-Topic 718
-SubTopic 10
-Name Accounting Standards Codification
-Section 50
-Paragraph 2
-Subparagraph (i)
-Publisher FASB
-URI https://asc.fasb.org//1943274/2147480429/718-10-50-2
| Name: |
us-gaap_EmployeeServiceShareBasedCompensationNonvestedAwardsTotalCompensationCostNotYetRecognizedShareBasedAwardsOtherThanOptions |
| Namespace Prefix: |
us-gaap_ |
| Data Type: |
xbrli:monetaryItemType |
| Balance Type: |
debit |
| Period Type: |
instant |
|
| X |
- DefinitionAmount of cost to be recognized for option under share-based payment arrangement. Reference 1: http://www.xbrl.org/2009/role/commonPracticeRef
-Topic 718
-SubTopic 10
-Name Accounting Standards Codification
-Section 50
-Paragraph 2
-Subparagraph (i)
-Publisher FASB
-URI https://asc.fasb.org//1943274/2147480429/718-10-50-2
| Name: |
us-gaap_EmployeeServiceShareBasedCompensationNonvestedAwardsTotalCompensationCostNotYetRecognizedStockOptions |
| Namespace Prefix: |
us-gaap_ |
| Data Type: |
xbrli:monetaryItemType |
| Balance Type: |
debit |
| Period Type: |
instant |
|
| X |
- DefinitionPeriod over which grantee's right to exercise award under share-based payment arrangement is no longer contingent on satisfaction of service or performance condition, in 'PnYnMnDTnHnMnS' format, for example, 'P1Y5M13D' represents reported fact of one year, five months, and thirteen days. Includes, but is not limited to, combination of market, performance or service condition. Reference 1: http://www.xbrl.org/2003/role/exampleRef
-Topic 718
-SubTopic 10
-Name Accounting Standards Codification
-Section 50
-Paragraph 2
-Subparagraph (a)(1)
-Publisher FASB
-URI https://asc.fasb.org//1943274/2147480429/718-10-50-2
| Name: |
us-gaap_ShareBasedCompensationArrangementByShareBasedPaymentAwardAwardVestingPeriod1 |
| Namespace Prefix: |
us-gaap_ |
| Data Type: |
xbrli:durationItemType |
| Balance Type: |
na |
| Period Type: |
duration |
|
| X |
- DefinitionThe number of grants made during the period on other than stock (or unit) option plans (for example, phantom stock or unit plan, stock or unit appreciation rights plan, performance target plan). Reference 1: http://www.xbrl.org/2003/role/disclosureRef
-Topic 718
-SubTopic 10
-Name Accounting Standards Codification
-Section 50
-Paragraph 2
-Subparagraph (c)(2)(iii)(01)
-Publisher FASB
-URI https://asc.fasb.org//1943274/2147480429/718-10-50-2
| Name: |
us-gaap_ShareBasedCompensationArrangementByShareBasedPaymentAwardEquityInstrumentsOtherThanOptionsGrantsInPeriod |
| Namespace Prefix: |
us-gaap_ |
| Data Type: |
xbrli:sharesItemType |
| Balance Type: |
na |
| Period Type: |
duration |
|
| X |
- DefinitionThe weighted average fair value at grant date for nonvested equity-based awards issued during the period on other than stock (or unit) option plans (for example, phantom stock or unit plan, stock or unit appreciation rights plan, performance target plan). Reference 1: http://www.xbrl.org/2003/role/disclosureRef
-Topic 718
-SubTopic 10
-Name Accounting Standards Codification
-Section 50
-Paragraph 2
-Subparagraph (c)(2)(iii)(01)
-Publisher FASB
-URI https://asc.fasb.org//1943274/2147480429/718-10-50-2
| Name: |
us-gaap_ShareBasedCompensationArrangementByShareBasedPaymentAwardEquityInstrumentsOtherThanOptionsGrantsInPeriodWeightedAverageGrantDateFairValue |
| Namespace Prefix: |
us-gaap_ |
| Data Type: |
dtr-types:perShareItemType |
| Balance Type: |
na |
| Period Type: |
duration |
|
| X |
- DefinitionFair value of share-based awards for which the grantee gained the right by satisfying service and performance requirements, to receive or retain shares or units, other instruments, or cash. Reference 1: http://www.xbrl.org/2003/role/disclosureRef
-Topic 718
-SubTopic 10
-Name Accounting Standards Codification
-Section 50
-Paragraph 2
-Subparagraph (d)(2)
-Publisher FASB
-URI https://asc.fasb.org//1943274/2147480429/718-10-50-2
| Name: |
us-gaap_ShareBasedCompensationArrangementByShareBasedPaymentAwardEquityInstrumentsOtherThanOptionsVestedInPeriodTotalFairValue |
| Namespace Prefix: |
us-gaap_ |
| Data Type: |
xbrli:monetaryItemType |
| Balance Type: |
debit |
| Period Type: |
duration |
|
| X |
- DefinitionLine items represent financial concepts included in a table. These concepts are used to disclose reportable information associated with domain members defined in one or many axes to the table. Reference 1: http://www.xbrl.org/2003/role/disclosureRef
-Topic 718
-SubTopic 10
-Name Accounting Standards Codification
-Section 35
-Paragraph 1D
-Publisher FASB
-URI https://asc.fasb.org//1943274/2147480483/718-10-35-1D
Reference 2: http://www.xbrl.org/2003/role/disclosureRef
-Topic 718
-SubTopic 10
-Name Accounting Standards Codification
-Section 35
-Paragraph 3
-Publisher FASB
-URI https://asc.fasb.org//1943274/2147480483/718-10-35-3
Reference 3: http://www.xbrl.org/2003/role/disclosureRef
-Topic 718
-SubTopic 10
-Name Accounting Standards Codification
-Section 50
-Paragraph 2
-Subparagraph (a)(1)
-Publisher FASB
-URI https://asc.fasb.org//1943274/2147480429/718-10-50-2
Reference 4: http://www.xbrl.org/2003/role/disclosureRef
-Topic 718
-SubTopic 10
-Name Accounting Standards Codification
-Section 50
-Paragraph 2
-Subparagraph (a)(2)
-Publisher FASB
-URI https://asc.fasb.org//1943274/2147480429/718-10-50-2
Reference 5: http://www.xbrl.org/2003/role/disclosureRef
-Topic 718
-SubTopic 10
-Name Accounting Standards Codification
-Section 50
-Paragraph 2
-Subparagraph (a)(3)
-Publisher FASB
-URI https://asc.fasb.org//1943274/2147480429/718-10-50-2
Reference 6: http://www.xbrl.org/2003/role/disclosureRef
-Topic 718
-SubTopic 10
-Name Accounting Standards Codification
-Section 50
-Paragraph 2
-Subparagraph (c)(1)(i)
-Publisher FASB
-URI https://asc.fasb.org//1943274/2147480429/718-10-50-2
Reference 7: http://www.xbrl.org/2003/role/disclosureRef
-Topic 718
-SubTopic 10
-Name Accounting Standards Codification
-Section 50
-Paragraph 2
-Subparagraph (c)(1)(ii)
-Publisher FASB
-URI https://asc.fasb.org//1943274/2147480429/718-10-50-2
Reference 8: http://www.xbrl.org/2003/role/disclosureRef
-Topic 718
-SubTopic 10
-Name Accounting Standards Codification
-Section 50
-Paragraph 2
-Subparagraph (c)(1)(iii)
-Publisher FASB
-URI https://asc.fasb.org//1943274/2147480429/718-10-50-2
Reference 9: http://www.xbrl.org/2003/role/disclosureRef
-Topic 718
-SubTopic 10
-Name Accounting Standards Codification
-Section 50
-Paragraph 2
-Subparagraph (c)(1)(iv)
-Publisher FASB
-URI https://asc.fasb.org//1943274/2147480429/718-10-50-2
Reference 10: http://www.xbrl.org/2003/role/disclosureRef
-Topic 718
-SubTopic 10
-Name Accounting Standards Codification
-Section 50
-Paragraph 2
-Subparagraph (c)(1)(iv)(01)
-Publisher FASB
-URI https://asc.fasb.org//1943274/2147480429/718-10-50-2
Reference 11: http://www.xbrl.org/2003/role/disclosureRef
-Topic 718
-SubTopic 10
-Name Accounting Standards Codification
-Section 50
-Paragraph 2
-Subparagraph (c)(1)(iv)(02)
-Publisher FASB
-URI https://asc.fasb.org//1943274/2147480429/718-10-50-2
Reference 12: http://www.xbrl.org/2003/role/disclosureRef
-Topic 718
-SubTopic 10
-Name Accounting Standards Codification
-Section 50
-Paragraph 2
-Subparagraph (c)(1)(iv)(03)
-Publisher FASB
-URI https://asc.fasb.org//1943274/2147480429/718-10-50-2
Reference 13: http://www.xbrl.org/2003/role/disclosureRef
-Topic 718
-SubTopic 10
-Name Accounting Standards Codification
-Section 50
-Paragraph 2
-Subparagraph (c)(1)(iv)(04)
-Publisher FASB
-URI https://asc.fasb.org//1943274/2147480429/718-10-50-2
Reference 14: http://www.xbrl.org/2003/role/disclosureRef
-Topic 718
-SubTopic 10
-Name Accounting Standards Codification
-Section 50
-Paragraph 2
-Subparagraph (c)(2)(i)
-Publisher FASB
-URI https://asc.fasb.org//1943274/2147480429/718-10-50-2
Reference 15: http://www.xbrl.org/2003/role/disclosureRef
-Topic 718
-SubTopic 10
-Name Accounting Standards Codification
-Section 50
-Paragraph 2
-Subparagraph (c)(2)(ii)
-Publisher FASB
-URI https://asc.fasb.org//1943274/2147480429/718-10-50-2
Reference 16: http://www.xbrl.org/2003/role/disclosureRef
-Topic 718
-SubTopic 10
-Name Accounting Standards Codification
-Section 50
-Paragraph 2
-Subparagraph (c)(2)(iii)
-Publisher FASB
-URI https://asc.fasb.org//1943274/2147480429/718-10-50-2
Reference 17: http://www.xbrl.org/2003/role/disclosureRef
-Topic 718
-SubTopic 10
-Name Accounting Standards Codification
-Section 50
-Paragraph 2
-Subparagraph (c)(2)(iii)(01)
-Publisher FASB
-URI https://asc.fasb.org//1943274/2147480429/718-10-50-2
Reference 18: http://www.xbrl.org/2003/role/disclosureRef
-Topic 718
-SubTopic 10
-Name Accounting Standards Codification
-Section 50
-Paragraph 2
-Subparagraph (c)(2)(iii)(02)
-Publisher FASB
-URI https://asc.fasb.org//1943274/2147480429/718-10-50-2
Reference 19: http://www.xbrl.org/2003/role/disclosureRef
-Topic 718
-SubTopic 10
-Name Accounting Standards Codification
-Section 50
-Paragraph 2
-Subparagraph (c)(2)(iii)(03)
-Publisher FASB
-URI https://asc.fasb.org//1943274/2147480429/718-10-50-2
Reference 20: http://www.xbrl.org/2003/role/disclosureRef
-Topic 718
-SubTopic 10
-Name Accounting Standards Codification
-Section 50
-Paragraph 2
-Subparagraph (d)(1)
-Publisher FASB
-URI https://asc.fasb.org//1943274/2147480429/718-10-50-2
Reference 21: http://www.xbrl.org/2003/role/disclosureRef
-Topic 718
-SubTopic 10
-Name Accounting Standards Codification
-Section 50
-Paragraph 2
-Subparagraph (d)(2)
-Publisher FASB
-URI https://asc.fasb.org//1943274/2147480429/718-10-50-2
Reference 22: http://www.xbrl.org/2003/role/disclosureRef
-Topic 718
-SubTopic 10
-Name Accounting Standards Codification
-Section 50
-Paragraph 2
-Subparagraph (e)(1)
-Publisher FASB
-URI https://asc.fasb.org//1943274/2147480429/718-10-50-2
Reference 23: http://www.xbrl.org/2003/role/disclosureRef
-Topic 718
-SubTopic 10
-Name Accounting Standards Codification
-Section 50
-Paragraph 2
-Subparagraph (e)(2)
-Publisher FASB
-URI https://asc.fasb.org//1943274/2147480429/718-10-50-2
Reference 24: http://www.xbrl.org/2003/role/disclosureRef
-Topic 718
-SubTopic 10
-Name Accounting Standards Codification
-Section 50
-Paragraph 2
-Subparagraph (f)(2)(i)
-Publisher FASB
-URI https://asc.fasb.org//1943274/2147480429/718-10-50-2
Reference 25: http://www.xbrl.org/2003/role/disclosureRef
-Topic 718
-SubTopic 10
-Name Accounting Standards Codification
-Section 50
-Paragraph 2
-Subparagraph (f)(2)(ii)
-Publisher FASB
-URI https://asc.fasb.org//1943274/2147480429/718-10-50-2
Reference 26: http://www.xbrl.org/2003/role/disclosureRef
-Topic 718
-SubTopic 10
-Name Accounting Standards Codification
-Section 50
-Paragraph 2
-Subparagraph (f)(2)(iii)
-Publisher FASB
-URI https://asc.fasb.org//1943274/2147480429/718-10-50-2
Reference 27: http://www.xbrl.org/2003/role/disclosureRef
-Topic 718
-SubTopic 10
-Name Accounting Standards Codification
-Section 50
-Paragraph 2
-Subparagraph (f)(2)(iv)
-Publisher FASB
-URI https://asc.fasb.org//1943274/2147480429/718-10-50-2
Reference 28: http://www.xbrl.org/2003/role/disclosureRef
-Topic 718
-SubTopic 10
-Name Accounting Standards Codification
-Section 50
-Paragraph 2
-Subparagraph (f)(2)(v)
-Publisher FASB
-URI https://asc.fasb.org//1943274/2147480429/718-10-50-2
| Name: |
us-gaap_ShareBasedCompensationArrangementByShareBasedPaymentAwardLineItems |
| Namespace Prefix: |
us-gaap_ |
| Data Type: |
xbrli:stringItemType |
| Balance Type: |
na |
| Period Type: |
duration |
|
| X |
- DefinitionNumber of equity instruments other than options outstanding, including both vested and non-vested instruments. Reference 1: http://fasb.org/us-gaap/role/ref/legacyRef
-Name Accounting Standards Codification
-Section 50
-Paragraph 2
-Subparagraph (c)(1)(i)
-SubTopic 10
-Topic 718
-Publisher FASB
-URI https://asc.fasb.org//1943274/2147480429/718-10-50-2
Reference 2: http://fasb.org/us-gaap/role/ref/legacyRef
-Name Accounting Standards Codification
-Section 50
-Paragraph 2
-Subparagraph (c)(1)(ii)
-SubTopic 10
-Topic 718
-Publisher FASB
-URI https://asc.fasb.org//1943274/2147480429/718-10-50-2
| Name: |
us-gaap_ShareBasedCompensationArrangementByShareBasedPaymentAwardNonOptionEquityInstrumentsOutstandingNumber |
| Namespace Prefix: |
us-gaap_ |
| Data Type: |
xbrli:sharesItemType |
| Balance Type: |
na |
| Period Type: |
instant |
|
| X |
- DefinitionNumber of shares authorized for issuance under share-based payment arrangement. Reference 1: http://www.xbrl.org/2003/role/exampleRef
-Topic 718
-SubTopic 10
-Name Accounting Standards Codification
-Section 50
-Paragraph 2
-Subparagraph (a)(3)
-Publisher FASB
-URI https://asc.fasb.org//1943274/2147480429/718-10-50-2
| Name: |
us-gaap_ShareBasedCompensationArrangementByShareBasedPaymentAwardNumberOfSharesAuthorized |
| Namespace Prefix: |
us-gaap_ |
| Data Type: |
xbrli:sharesItemType |
| Balance Type: |
na |
| Period Type: |
instant |
|
| X |
- DefinitionThe difference between the maximum number of shares (or other type of equity) authorized for issuance under the plan (including the effects of amendments and adjustments), and the sum of: 1) the number of shares (or other type of equity) already issued upon exercise of options or other equity-based awards under the plan; and 2) shares (or other type of equity) reserved for issuance on granting of outstanding awards, net of cancellations and forfeitures, if applicable. Reference 1: http://fasb.org/us-gaap/role/ref/legacyRef
-Name Accounting Standards Codification
-Topic 718
-SubTopic 10
-Section 50
-Paragraph 2
-Publisher FASB
-URI https://asc.fasb.org//1943274/2147480429/718-10-50-2
| Name: |
us-gaap_ShareBasedCompensationArrangementByShareBasedPaymentAwardNumberOfSharesAvailableForGrant |
| Namespace Prefix: |
us-gaap_ |
| Data Type: |
xbrli:sharesItemType |
| Balance Type: |
na |
| Period Type: |
instant |
|
| X |
- DefinitionAmount of accumulated difference between fair value of underlying shares on dates of exercise and exercise price on options exercised (or share units converted) into shares. Reference 1: http://www.xbrl.org/2003/role/disclosureRef
-Topic 718
-SubTopic 10
-Name Accounting Standards Codification
-Section 50
-Paragraph 2
-Subparagraph (d)(2)
-Publisher FASB
-URI https://asc.fasb.org//1943274/2147480429/718-10-50-2
| Name: |
us-gaap_ShareBasedCompensationArrangementByShareBasedPaymentAwardOptionsExercisesInPeriodTotalIntrinsicValue |
| Namespace Prefix: |
us-gaap_ |
| Data Type: |
xbrli:monetaryItemType |
| Balance Type: |
debit |
| Period Type: |
duration |
|
| X |
- DefinitionGross number of share options (or share units) granted during the period. Reference 1: http://www.xbrl.org/2003/role/disclosureRef
-Topic 718
-SubTopic 10
-Name Accounting Standards Codification
-Section 50
-Paragraph 2
-Subparagraph (c)(1)(iv)(01)
-Publisher FASB
-URI https://asc.fasb.org//1943274/2147480429/718-10-50-2
| Name: |
us-gaap_ShareBasedCompensationArrangementByShareBasedPaymentAwardOptionsGrantsInPeriodGross |
| Namespace Prefix: |
us-gaap_ |
| Data Type: |
xbrli:sharesItemType |
| Balance Type: |
na |
| Period Type: |
duration |
|
| X |
- DefinitionPeriod from grant date that an equity-based award expires, in 'PnYnMnDTnHnMnS' format, for example, 'P1Y5M13D' represents the reported fact of one year, five months, and thirteen days. Reference 1: http://www.xbrl.org/2003/role/exampleRef
-Topic 718
-SubTopic 10
-Name Accounting Standards Codification
-Section 50
-Paragraph 2
-Subparagraph (a)(2)
-Publisher FASB
-URI https://asc.fasb.org//1943274/2147480429/718-10-50-2
| Name: |
us-gaap_SharebasedCompensationArrangementBySharebasedPaymentAwardExpirationPeriod |
| Namespace Prefix: |
us-gaap_ |
| Data Type: |
xbrli:durationItemType |
| Balance Type: |
na |
| Period Type: |
duration |
|
| X |
- DefinitionNumber Of Non-Employee Directors
| Name: |
wire_NumberOfNonEmployeeDirectors |
| Namespace Prefix: |
wire_ |
| Data Type: |
xbrli:integerItemType |
| Balance Type: |
na |
| Period Type: |
duration |
|
| X |
- DefinitionShare-based Compensation Arrangement by Share-based Payment Award, Equity Instruments Other than Options, Exercises in Period, Intrinsic Value
| Name: |
wire_SharebasedCompensationArrangementbySharebasedPaymentAwardEquityInstrumentsOtherthanOptionsExercisesinPeriodIntrinsicValue |
| Namespace Prefix: |
wire_ |
| Data Type: |
xbrli:monetaryItemType |
| Balance Type: |
debit |
| Period Type: |
duration |
|
| X |
- DefinitionShare-based Compensation Arrangement by Share-based Payment Award, Liability Award
| Name: |
wire_SharebasedCompensationArrangementbySharebasedPaymentAwardLiabilityAmount |
| Namespace Prefix: |
wire_ |
| Data Type: |
xbrli:monetaryItemType |
| Balance Type: |
credit |
| Period Type: |
instant |
|
| X |
- Details
| Name: |
us-gaap_AwardTypeAxis=us-gaap_RestrictedStockUnitsRSUMember |
| Namespace Prefix: |
|
| Data Type: |
na |
| Balance Type: |
|
| Period Type: |
|
|
| X |
- Details
| Name: |
us-gaap_AwardTypeAxis=wire_EmployeeStockGrantMember |
| Namespace Prefix: |
|
| Data Type: |
na |
| Balance Type: |
|
| Period Type: |
|
|
| X |
- Details
| Name: |
us-gaap_AwardTypeAxis=us-gaap_EmployeeStockOptionMember |
| Namespace Prefix: |
|
| Data Type: |
na |
| Balance Type: |
|
| Period Type: |
|
|
| X |
- Details
| Name: |
us-gaap_AwardTypeAxis=us-gaap_StockAppreciationRightsSARSMember |
| Namespace Prefix: |
|
| Data Type: |
na |
| Balance Type: |
|
| Period Type: |
|
|
| X |
- Details
| Name: |
us-gaap_AwardTypeAxis=us-gaap_RestrictedStockMember |
| Namespace Prefix: |
|
| Data Type: |
na |
| Balance Type: |
|
| Period Type: |
|
|
v3.24.0.1
Stock-Based Compensation - Schedule of Restricted Stock Units (Details) - Restricted Stock Units - $ / shares
|
12 Months Ended |
Dec. 31, 2023 |
Dec. 31, 2022 |
Dec. 31, 2021 |
| Number of Shares |
|
|
|
| Beginning balance (in shares) |
241,436
|
|
|
| Granted (in shares) |
236,800
|
177,200
|
98,600
|
| Vested (in shares) |
(91,432)
|
|
|
| Forfeited/Canceled (in shares) |
0
|
|
|
| Ending balance (in shares) |
386,804
|
241,436
|
|
| Weighted Average Grant Date Fair Value |
|
|
|
| Beginning balance (in usd per share) |
$ 109.69
|
|
|
| Granted (in usd per share) |
149.62
|
$ 127.58
|
$ 61.92
|
| Vested (in usd per share) |
103.97
|
|
|
| Forfeited/Canceled (in usd per share) |
0
|
|
|
| Ending balance (in usd per share) |
$ 135.49
|
$ 109.69
|
|
| X |
- DefinitionThe number of equity-based payment instruments, excluding stock (or unit) options, that were forfeited during the reporting period. Reference 1: http://www.xbrl.org/2003/role/disclosureRef
-Topic 718
-SubTopic 10
-Name Accounting Standards Codification
-Section 50
-Paragraph 2
-Subparagraph (c)(2)(iii)(03)
-Publisher FASB
-URI https://asc.fasb.org//1943274/2147480429/718-10-50-2
| Name: |
us-gaap_ShareBasedCompensationArrangementByShareBasedPaymentAwardEquityInstrumentsOtherThanOptionsForfeitedInPeriod |
| Namespace Prefix: |
us-gaap_ |
| Data Type: |
xbrli:sharesItemType |
| Balance Type: |
na |
| Period Type: |
duration |
|
| X |
- DefinitionWeighted average fair value as of the grant date of equity-based award plans other than stock (unit) option plans that were not exercised or put into effect as a result of the occurrence of a terminating event. Reference 1: http://www.xbrl.org/2003/role/disclosureRef
-Topic 718
-SubTopic 10
-Name Accounting Standards Codification
-Section 50
-Paragraph 2
-Subparagraph (c)(2)(iii)(03)
-Publisher FASB
-URI https://asc.fasb.org//1943274/2147480429/718-10-50-2
| Name: |
us-gaap_ShareBasedCompensationArrangementByShareBasedPaymentAwardEquityInstrumentsOtherThanOptionsForfeituresWeightedAverageGrantDateFairValue |
| Namespace Prefix: |
us-gaap_ |
| Data Type: |
dtr-types:perShareItemType |
| Balance Type: |
na |
| Period Type: |
duration |
|
| X |
- DefinitionThe number of grants made during the period on other than stock (or unit) option plans (for example, phantom stock or unit plan, stock or unit appreciation rights plan, performance target plan). Reference 1: http://www.xbrl.org/2003/role/disclosureRef
-Topic 718
-SubTopic 10
-Name Accounting Standards Codification
-Section 50
-Paragraph 2
-Subparagraph (c)(2)(iii)(01)
-Publisher FASB
-URI https://asc.fasb.org//1943274/2147480429/718-10-50-2
| Name: |
us-gaap_ShareBasedCompensationArrangementByShareBasedPaymentAwardEquityInstrumentsOtherThanOptionsGrantsInPeriod |
| Namespace Prefix: |
us-gaap_ |
| Data Type: |
xbrli:sharesItemType |
| Balance Type: |
na |
| Period Type: |
duration |
|
| X |
- DefinitionThe weighted average fair value at grant date for nonvested equity-based awards issued during the period on other than stock (or unit) option plans (for example, phantom stock or unit plan, stock or unit appreciation rights plan, performance target plan). Reference 1: http://www.xbrl.org/2003/role/disclosureRef
-Topic 718
-SubTopic 10
-Name Accounting Standards Codification
-Section 50
-Paragraph 2
-Subparagraph (c)(2)(iii)(01)
-Publisher FASB
-URI https://asc.fasb.org//1943274/2147480429/718-10-50-2
| Name: |
us-gaap_ShareBasedCompensationArrangementByShareBasedPaymentAwardEquityInstrumentsOtherThanOptionsGrantsInPeriodWeightedAverageGrantDateFairValue |
| Namespace Prefix: |
us-gaap_ |
| Data Type: |
dtr-types:perShareItemType |
| Balance Type: |
na |
| Period Type: |
duration |
|
| X |
- DefinitionThe number of non-vested equity-based payment instruments, excluding stock (or unit) options, that validly exist and are outstanding as of the balance sheet date. Reference 1: http://www.xbrl.org/2003/role/disclosureRef
-Topic 718
-SubTopic 10
-Name Accounting Standards Codification
-Section 50
-Paragraph 2
-Subparagraph (c)(2)(i)
-Publisher FASB
-URI https://asc.fasb.org//1943274/2147480429/718-10-50-2
Reference 2: http://www.xbrl.org/2003/role/disclosureRef
-Topic 718
-SubTopic 10
-Name Accounting Standards Codification
-Section 50
-Paragraph 2
-Subparagraph (c)(2)(ii)
-Publisher FASB
-URI https://asc.fasb.org//1943274/2147480429/718-10-50-2
| Name: |
us-gaap_ShareBasedCompensationArrangementByShareBasedPaymentAwardEquityInstrumentsOtherThanOptionsNonvestedNumber |
| Namespace Prefix: |
us-gaap_ |
| Data Type: |
xbrli:sharesItemType |
| Balance Type: |
na |
| Period Type: |
instant |
|
| X |
- DefinitionA roll forward is a reconciliation of a concept from the beginning of a period to the end of a period.
| Name: |
us-gaap_ShareBasedCompensationArrangementByShareBasedPaymentAwardEquityInstrumentsOtherThanOptionsNonvestedRollForward |
| Namespace Prefix: |
us-gaap_ |
| Data Type: |
xbrli:stringItemType |
| Balance Type: |
na |
| Period Type: |
duration |
|
| X |
- DefinitionPer share or unit weighted-average fair value of nonvested award under share-based payment arrangement. Excludes share and unit options. Reference 1: http://www.xbrl.org/2003/role/disclosureRef
-Topic 718
-SubTopic 10
-Name Accounting Standards Codification
-Section 50
-Paragraph 2
-Subparagraph (c)(2)(i)
-Publisher FASB
-URI https://asc.fasb.org//1943274/2147480429/718-10-50-2
Reference 2: http://www.xbrl.org/2003/role/disclosureRef
-Topic 718
-SubTopic 10
-Name Accounting Standards Codification
-Section 50
-Paragraph 2
-Subparagraph (c)(2)(ii)
-Publisher FASB
-URI https://asc.fasb.org//1943274/2147480429/718-10-50-2
| Name: |
us-gaap_ShareBasedCompensationArrangementByShareBasedPaymentAwardEquityInstrumentsOtherThanOptionsNonvestedWeightedAverageGrantDateFairValue |
| Namespace Prefix: |
us-gaap_ |
| Data Type: |
dtr-types:perShareItemType |
| Balance Type: |
na |
| Period Type: |
instant |
|
| X |
- References
+ Details
| Name: |
us-gaap_ShareBasedCompensationArrangementByShareBasedPaymentAwardEquityInstrumentsOtherThanOptionsNonvestedWeightedAverageGrantDateFairValueRollForward |
| Namespace Prefix: |
us-gaap_ |
| Data Type: |
xbrli:stringItemType |
| Balance Type: |
na |
| Period Type: |
duration |
|
| X |
- DefinitionThe number of equity-based payment instruments, excluding stock (or unit) options, that vested during the reporting period. Reference 1: http://www.xbrl.org/2003/role/disclosureRef
-Topic 718
-SubTopic 10
-Name Accounting Standards Codification
-Section 50
-Paragraph 2
-Subparagraph (c)(2)(iii)(02)
-Publisher FASB
-URI https://asc.fasb.org//1943274/2147480429/718-10-50-2
| Name: |
us-gaap_ShareBasedCompensationArrangementByShareBasedPaymentAwardEquityInstrumentsOtherThanOptionsVestedInPeriod |
| Namespace Prefix: |
us-gaap_ |
| Data Type: |
xbrli:sharesItemType |
| Balance Type: |
na |
| Period Type: |
duration |
|
| X |
- DefinitionThe weighted average fair value as of grant date pertaining to an equity-based award plan other than a stock (or unit) option plan for which the grantee gained the right during the reporting period, by satisfying service and performance requirements, to receive or retain shares or units, other instruments, or cash in accordance with the terms of the arrangement. Reference 1: http://www.xbrl.org/2003/role/disclosureRef
-Topic 718
-SubTopic 10
-Name Accounting Standards Codification
-Section 50
-Paragraph 2
-Subparagraph (c)(2)(iii)(02)
-Publisher FASB
-URI https://asc.fasb.org//1943274/2147480429/718-10-50-2
| Name: |
us-gaap_ShareBasedCompensationArrangementByShareBasedPaymentAwardEquityInstrumentsOtherThanOptionsVestedInPeriodWeightedAverageGrantDateFairValue |
| Namespace Prefix: |
us-gaap_ |
| Data Type: |
dtr-types:perShareItemType |
| Balance Type: |
na |
| Period Type: |
duration |
|
| X |
- Details
| Name: |
us-gaap_AwardTypeAxis=us-gaap_RestrictedStockUnitsRSUMember |
| Namespace Prefix: |
|
| Data Type: |
na |
| Balance Type: |
|
| Period Type: |
|
|
v3.24.0.1
Stock-Based Compensation - Schedule of Stock Option Activity (Details)
$ / shares in Units, $ in Thousands |
12 Months Ended |
|
Dec. 31, 2023
USD ($)
$ / shares
shares
|
|---|
| Number of Shares |
|
| Outstanding, beginning balance (in shares) | shares |
275,500
|
| Exercised (in shares) | shares |
(22,000)
|
| Forfeited/canceled (in shares) | shares |
0
|
| Outstanding, ending balance (in shares) | shares |
253,500
|
| Vested and exercisable, ending balance (in shares) | shares |
253,500
|
| Weighted Average Exercise Price |
|
| Outstanding, beginning balance (in usd per share) | $ / shares |
$ 43.06
|
| Exercised (in usd per share) | $ / shares |
42.53
|
| Forfeited/canceled (in usd per share) | $ / shares |
0
|
| Outstanding, ending balance (in usd per share) | $ / shares |
43.10
|
| Weighted average exercise price, vested and exercisable, ending balance (in usd per share) | $ / shares |
$ 43.10
|
| Weighted average remaining contractual term, ending balance |
2 years 8 months 12 days
|
| Weighted average remaining contractual term, vested and exercisable, ending balance |
2 years 8 months 12 days
|
| Aggregate intrinsic value ending balance | $ |
$ 43,222
|
| Aggregate intrinsic value, vested and exercisable ending balance | $ |
$ 43,222
|
| X |
- DefinitionFor presentations that combine terminations, the number of shares under options that were cancelled during the reporting period as a result of occurrence of a terminating event specified in contractual agreements pertaining to the stock option plan or that expired. Reference 1: http://www.xbrl.org/2009/role/commonPracticeRef
-Topic 718
-SubTopic 10
-Name Accounting Standards Codification
-Section 50
-Paragraph 2
-Subparagraph (c)(1)(iv)
-Publisher FASB
-URI https://asc.fasb.org//1943274/2147480429/718-10-50-2
| Name: |
us-gaap_ShareBasedCompensationArrangementByShareBasedPaymentAwardOptionsForfeituresAndExpirationsInPeriod |
| Namespace Prefix: |
us-gaap_ |
| Data Type: |
xbrli:sharesItemType |
| Balance Type: |
na |
| Period Type: |
duration |
|
| X |
- DefinitionWeighted average price of options that were either forfeited or expired. Reference 1: http://www.xbrl.org/2009/role/commonPracticeRef
-Topic 718
-SubTopic 10
-Name Accounting Standards Codification
-Section 50
-Paragraph 2
-Subparagraph (c)(1)(iv)
-Publisher FASB
-URI https://asc.fasb.org//1943274/2147480429/718-10-50-2
| Name: |
us-gaap_ShareBasedCompensationArrangementByShareBasedPaymentAwardOptionsForfeituresAndExpirationsInPeriodWeightedAverageExercisePrice |
| Namespace Prefix: |
us-gaap_ |
| Data Type: |
dtr-types:perShareItemType |
| Balance Type: |
na |
| Period Type: |
duration |
|
| X |
- DefinitionAmount by which the current fair value of the underlying stock exceeds the exercise price of options outstanding. Reference 1: http://fasb.org/us-gaap/role/ref/legacyRef
-Name Accounting Standards Codification
-Topic 718
-SubTopic 10
-Section 50
-Paragraph 2
-Publisher FASB
-URI https://asc.fasb.org//1943274/2147480429/718-10-50-2
| Name: |
us-gaap_ShareBasedCompensationArrangementByShareBasedPaymentAwardOptionsOutstandingIntrinsicValue |
| Namespace Prefix: |
us-gaap_ |
| Data Type: |
xbrli:monetaryItemType |
| Balance Type: |
debit |
| Period Type: |
instant |
|
| X |
- DefinitionNumber of options outstanding, including both vested and non-vested options. Reference 1: http://www.xbrl.org/2003/role/disclosureRef
-Topic 718
-SubTopic 10
-Name Accounting Standards Codification
-Section 50
-Paragraph 2
-Subparagraph (c)(1)(i)
-Publisher FASB
-URI https://asc.fasb.org//1943274/2147480429/718-10-50-2
Reference 2: http://www.xbrl.org/2003/role/disclosureRef
-Topic 718
-SubTopic 10
-Name Accounting Standards Codification
-Section 50
-Paragraph 2
-Subparagraph (c)(1)(ii)
-Publisher FASB
-URI https://asc.fasb.org//1943274/2147480429/718-10-50-2
| Name: |
us-gaap_ShareBasedCompensationArrangementByShareBasedPaymentAwardOptionsOutstandingNumber |
| Namespace Prefix: |
us-gaap_ |
| Data Type: |
xbrli:sharesItemType |
| Balance Type: |
na |
| Period Type: |
instant |
|
| X |
- DefinitionA roll forward is a reconciliation of a concept from the beginning of a period to the end of a period.
| Name: |
us-gaap_ShareBasedCompensationArrangementByShareBasedPaymentAwardOptionsOutstandingRollForward |
| Namespace Prefix: |
us-gaap_ |
| Data Type: |
xbrli:stringItemType |
| Balance Type: |
na |
| Period Type: |
duration |
|
| X |
- DefinitionWeighted average price at which grantees can acquire the shares reserved for issuance under the stock option plan. Reference 1: http://www.xbrl.org/2003/role/disclosureRef
-Topic 718
-SubTopic 10
-Name Accounting Standards Codification
-Section 50
-Paragraph 2
-Subparagraph (c)(1)(i)
-Publisher FASB
-URI https://asc.fasb.org//1943274/2147480429/718-10-50-2
Reference 2: http://www.xbrl.org/2003/role/disclosureRef
-Topic 718
-SubTopic 10
-Name Accounting Standards Codification
-Section 50
-Paragraph 2
-Subparagraph (c)(1)(ii)
-Publisher FASB
-URI https://asc.fasb.org//1943274/2147480429/718-10-50-2
| Name: |
us-gaap_ShareBasedCompensationArrangementByShareBasedPaymentAwardOptionsOutstandingWeightedAverageExercisePrice |
| Namespace Prefix: |
us-gaap_ |
| Data Type: |
dtr-types:perShareItemType |
| Balance Type: |
na |
| Period Type: |
instant |
|
| X |
- References
+ Details
| Name: |
us-gaap_ShareBasedCompensationArrangementByShareBasedPaymentAwardOptionsOutstandingWeightedAverageExercisePriceRollforward |
| Namespace Prefix: |
us-gaap_ |
| Data Type: |
xbrli:stringItemType |
| Balance Type: |
na |
| Period Type: |
duration |
|
| X |
- DefinitionAmount by which current fair value of underlying stock exceeds exercise price of fully vested and expected to vest exercisable or convertible options. Includes, but is not limited to, unvested options for which requisite service period has not been rendered but that are expected to vest based on achievement of performance condition, if forfeitures are recognized when they occur. Reference 1: http://www.xbrl.org/2003/role/disclosureRef
-Topic 718
-SubTopic 10
-Name Accounting Standards Codification
-Section 50
-Paragraph 2
-Subparagraph (e)(2)
-Publisher FASB
-URI https://asc.fasb.org//1943274/2147480429/718-10-50-2
| Name: |
us-gaap_ShareBasedCompensationArrangementByShareBasedPaymentAwardOptionsVestedAndExpectedToVestExercisableAggregateIntrinsicValue |
| Namespace Prefix: |
us-gaap_ |
| Data Type: |
xbrli:monetaryItemType |
| Balance Type: |
debit |
| Period Type: |
instant |
|
| X |
- DefinitionNumber of fully vested and expected to vest exercisable options that may be converted into shares under option plan. Includes, but is not limited to, unvested options for which requisite service period has not been rendered but that are expected to vest based on achievement of performance condition, if forfeitures are recognized when they occur. Reference 1: http://www.xbrl.org/2003/role/disclosureRef
-Topic 718
-SubTopic 10
-Name Accounting Standards Codification
-Section 50
-Paragraph 2
-Subparagraph (e)(2)
-Publisher FASB
-URI https://asc.fasb.org//1943274/2147480429/718-10-50-2
| Name: |
us-gaap_ShareBasedCompensationArrangementByShareBasedPaymentAwardOptionsVestedAndExpectedToVestExercisableNumber |
| Namespace Prefix: |
us-gaap_ |
| Data Type: |
xbrli:sharesItemType |
| Balance Type: |
na |
| Period Type: |
instant |
|
| X |
- DefinitionWeighted-average exercise price, at which grantee can acquire shares reserved for issuance, for fully vested and expected to vest exercisable or convertible options. Includes, but is not limited to, unvested options for which requisite service period has not been rendered but that are expected to vest based on achievement of performance condition, if forfeitures are recognized when they occur. Reference 1: http://www.xbrl.org/2003/role/disclosureRef
-Topic 718
-SubTopic 10
-Name Accounting Standards Codification
-Section 50
-Paragraph 2
-Subparagraph (e)(2)
-Publisher FASB
-URI https://asc.fasb.org//1943274/2147480429/718-10-50-2
| Name: |
us-gaap_ShareBasedCompensationArrangementByShareBasedPaymentAwardOptionsVestedAndExpectedToVestExercisableWeightedAverageExercisePrice |
| Namespace Prefix: |
us-gaap_ |
| Data Type: |
dtr-types:perShareItemType |
| Balance Type: |
na |
| Period Type: |
instant |
|
| X |
- DefinitionWeighted average price at which option holders acquired shares when converting their stock options into shares. Reference 1: http://www.xbrl.org/2003/role/disclosureRef
-Topic 718
-SubTopic 10
-Name Accounting Standards Codification
-Section 50
-Paragraph 2
-Subparagraph (c)(1)(iv)(02)
-Publisher FASB
-URI https://asc.fasb.org//1943274/2147480429/718-10-50-2
| Name: |
us-gaap_ShareBasedCompensationArrangementsByShareBasedPaymentAwardOptionsExercisesInPeriodWeightedAverageExercisePrice |
| Namespace Prefix: |
us-gaap_ |
| Data Type: |
dtr-types:perShareItemType |
| Balance Type: |
na |
| Period Type: |
duration |
|
| X |
- DefinitionWeighted average remaining contractual term for option awards outstanding, in 'PnYnMnDTnHnMnS' format, for example, 'P1Y5M13D' represents the reported fact of one year, five months, and thirteen days. Reference 1: http://fasb.org/us-gaap/role/ref/legacyRef
-Topic 718
-SubTopic 10
-Subparagraph (e)(1)
-Name Accounting Standards Codification
-Paragraph 2
-Section 50
-Publisher FASB
-URI https://asc.fasb.org//1943274/2147480429/718-10-50-2
| Name: |
us-gaap_SharebasedCompensationArrangementBySharebasedPaymentAwardOptionsOutstandingWeightedAverageRemainingContractualTerm2 |
| Namespace Prefix: |
us-gaap_ |
| Data Type: |
xbrli:durationItemType |
| Balance Type: |
na |
| Period Type: |
duration |
|
| X |
- DefinitionWeighted average remaining contractual term for fully vested and expected to vest exercisable or convertible options, in 'PnYnMnDTnHnMnS' format, for example, 'P1Y5M13D' represents the reported fact of one year, five months, and thirteen days. Includes, but is not limited to, unvested options for which requisite service period has not been rendered but that are expected to vest based on achievement of performance condition, if forfeitures are recognized when they occur. Reference 1: http://www.xbrl.org/2003/role/disclosureRef
-Topic 718
-SubTopic 10
-Name Accounting Standards Codification
-Section 50
-Paragraph 2
-Subparagraph (e)(2)
-Publisher FASB
-URI https://asc.fasb.org//1943274/2147480429/718-10-50-2
| Name: |
us-gaap_SharebasedCompensationArrangementBySharebasedPaymentAwardOptionsVestedAndExpectedToVestExercisableWeightedAverageRemainingContractualTerm1 |
| Namespace Prefix: |
us-gaap_ |
| Data Type: |
xbrli:durationItemType |
| Balance Type: |
na |
| Period Type: |
duration |
|
| X |
- DefinitionNumber of share options (or share units) exercised during the current period. Reference 1: http://fasb.org/us-gaap/role/ref/legacyRef
-Name Accounting Standards Codification
-Section 50
-Paragraph 2
-SubTopic 10
-Topic 505
-Publisher FASB
-URI https://asc.fasb.org//1943274/2147481112/505-10-50-2
Reference 2: http://www.xbrl.org/2003/role/disclosureRef
-Topic 718
-SubTopic 10
-Name Accounting Standards Codification
-Section 50
-Paragraph 2
-Subparagraph (c)(1)(iv)(02)
-Publisher FASB
-URI https://asc.fasb.org//1943274/2147480429/718-10-50-2
Reference 3: http://fasb.org/us-gaap/role/ref/legacyRef
-Topic 210
-SubTopic 10
-Name Accounting Standards Codification
-Section S99
-Paragraph 1
-Subparagraph (SX 210.5-02(28))
-Publisher FASB
-URI https://asc.fasb.org//1943274/2147480566/210-10-S99-1
Reference 4: http://fasb.org/us-gaap/role/ref/legacyRef
-Topic 505
-SubTopic 10
-Name Accounting Standards Codification
-Section S99
-Paragraph 1
-Subparagraph (SX 210.3-04)
-Publisher FASB
-URI https://asc.fasb.org//1943274/2147480008/505-10-S99-1
Reference 5: http://fasb.org/us-gaap/role/ref/legacyRef
-Topic 210
-SubTopic 10
-Name Accounting Standards Codification
-Section S99
-Paragraph 1
-Subparagraph (SX 210.5-02(29))
-Publisher FASB
-URI https://asc.fasb.org//1943274/2147480566/210-10-S99-1
| Name: |
us-gaap_StockIssuedDuringPeriodSharesStockOptionsExercised |
| Namespace Prefix: |
us-gaap_ |
| Data Type: |
xbrli:sharesItemType |
| Balance Type: |
na |
| Period Type: |
duration |
|
v3.24.0.1
Stock-Based Compensation - Schedule of Stock Appreciation Rights Activity (Details)
$ / shares in Units, $ in Thousands |
12 Months Ended |
|
Dec. 31, 2023
USD ($)
$ / shares
shares
|
|---|
| Cash-settled SARs |
|
| Vested and exercisable, ending balance (in shares) |
253,500
|
| Stock appreciation rights (“SARs”) |
|
| Cash-settled SARs |
|
| Beginning balance (in shares) |
332,164
|
| Exercised (in shares) |
(153,556)
|
| Forfeited/Canceled (in shares) |
(6,600)
|
| Ending balance (in shares) |
172,008
|
| Vested and exercisable, ending balance (in shares) |
69,608
|
| Weighted Average Exercise Price |
|
| Beginning balance (in usd per share) | $ / shares |
$ 54.18
|
| Exercised (in usd per share) | $ / shares |
52.82
|
| Forfeited/Canceled (in usd per share) | $ / shares |
56.47
|
| Ending balance (in usd per share) | $ / shares |
55.31
|
| Vested and exercisable, ending balance (in usd per share) | $ / shares |
$ 53.51
|
| Outstanding, weighted average contractual term, ending balance |
5 years 4 months 24 days
|
| Vested and exercisable, weighted average contractual term, ending balance |
5 years
|
| Outstanding, aggregate intrinsic value, ending balance | $ |
$ 27,228
|
| Vested and exercisable, aggregate intrinsic value, ending balance | $ |
$ 11,143
|
| X |
- DefinitionWeighted average remaining contractual term for equity-based awards excluding options, in 'PnYnMnDTnHnMnS' format, for example, 'P1Y5M13D' represents the reported fact of one year, five months, and thirteen days. Reference 1: http://fasb.org/us-gaap/role/ref/legacyRef
-Topic 718
-SubTopic 10
-Subparagraph (e)(1)
-Name Accounting Standards Codification
-Paragraph 2
-Section 50
-Publisher FASB
-URI https://asc.fasb.org//1943274/2147480429/718-10-50-2
| Name: |
us-gaap_ShareBasedCompensationArrangementByShareBasedPaymentAwardEquityInstrumentsOtherThanOptionsOutstandingWeightedAverageRemainingContractualTerms |
| Namespace Prefix: |
us-gaap_ |
| Data Type: |
xbrli:durationItemType |
| Balance Type: |
na |
| Period Type: |
duration |
|
| X |
- DefinitionNumber of non-option equity instruments exercised by participants. Reference 1: http://fasb.org/us-gaap/role/ref/legacyRef
-Name Accounting Standards Codification
-Section 50
-Paragraph 2
-Subparagraph (c)(1)(iv)(2)
-SubTopic 10
-Topic 718
-Publisher FASB
-URI https://asc.fasb.org//1943274/2147480429/718-10-50-2
| Name: |
us-gaap_ShareBasedCompensationArrangementByShareBasedPaymentAwardNonOptionEquityInstrumentsExercised |
| Namespace Prefix: |
us-gaap_ |
| Data Type: |
xbrli:sharesItemType |
| Balance Type: |
na |
| Period Type: |
duration |
|
| X |
- DefinitionNumber of shares under non-option equity instrument agreements that were either cancelled or expired. Reference 1: http://fasb.org/us-gaap/role/ref/legacyRef
-Name Accounting Standards Codification
-Section 50
-Paragraph 2
-Subparagraph (c)(1)(iv)(3)-(4)
-SubTopic 10
-Topic 718
-Publisher FASB
-URI https://asc.fasb.org//1943274/2147480429/718-10-50-2
| Name: |
us-gaap_ShareBasedCompensationArrangementByShareBasedPaymentAwardNonOptionEquityInstrumentsForfeituresAndExpirations |
| Namespace Prefix: |
us-gaap_ |
| Data Type: |
xbrli:sharesItemType |
| Balance Type: |
na |
| Period Type: |
duration |
|
| X |
- DefinitionNumber of equity instruments other than options outstanding, including both vested and non-vested instruments. Reference 1: http://fasb.org/us-gaap/role/ref/legacyRef
-Name Accounting Standards Codification
-Section 50
-Paragraph 2
-Subparagraph (c)(1)(i)
-SubTopic 10
-Topic 718
-Publisher FASB
-URI https://asc.fasb.org//1943274/2147480429/718-10-50-2
Reference 2: http://fasb.org/us-gaap/role/ref/legacyRef
-Name Accounting Standards Codification
-Section 50
-Paragraph 2
-Subparagraph (c)(1)(ii)
-SubTopic 10
-Topic 718
-Publisher FASB
-URI https://asc.fasb.org//1943274/2147480429/718-10-50-2
| Name: |
us-gaap_ShareBasedCompensationArrangementByShareBasedPaymentAwardNonOptionEquityInstrumentsOutstandingNumber |
| Namespace Prefix: |
us-gaap_ |
| Data Type: |
xbrli:sharesItemType |
| Balance Type: |
na |
| Period Type: |
instant |
|
| X |
- DefinitionA roll forward is a reconciliation of a concept from the beginning of a period to the end of a period.
| Name: |
us-gaap_ShareBasedCompensationArrangementByShareBasedPaymentAwardNonOptionEquityInstrumentsOutstandingRollForward |
| Namespace Prefix: |
us-gaap_ |
| Data Type: |
xbrli:stringItemType |
| Balance Type: |
na |
| Period Type: |
duration |
|
| X |
- DefinitionNumber of fully vested and expected to vest exercisable options that may be converted into shares under option plan. Includes, but is not limited to, unvested options for which requisite service period has not been rendered but that are expected to vest based on achievement of performance condition, if forfeitures are recognized when they occur. Reference 1: http://www.xbrl.org/2003/role/disclosureRef
-Topic 718
-SubTopic 10
-Name Accounting Standards Codification
-Section 50
-Paragraph 2
-Subparagraph (e)(2)
-Publisher FASB
-URI https://asc.fasb.org//1943274/2147480429/718-10-50-2
| Name: |
us-gaap_ShareBasedCompensationArrangementByShareBasedPaymentAwardOptionsVestedAndExpectedToVestExercisableNumber |
| Namespace Prefix: |
us-gaap_ |
| Data Type: |
xbrli:sharesItemType |
| Balance Type: |
na |
| Period Type: |
instant |
|
| X |
- DefinitionIntrinsic value of outstanding award under share-based payment arrangement. Excludes share and unit options.
| Name: |
us-gaap_SharebasedCompensationArrangementBySharebasedPaymentAwardEquityInstrumentsOtherThanOptionsAggregateIntrinsicValueOutstanding |
| Namespace Prefix: |
us-gaap_ |
| Data Type: |
xbrli:monetaryItemType |
| Balance Type: |
debit |
| Period Type: |
instant |
|
| X |
- DefinitionShare-Based Compensation Arrangement By Share-Based Payment Award, Non-Option Equity Instruments, Exercisable, Aggregate Intrinsic Value
| Name: |
wire_ShareBasedCompensationArrangementByShareBasedPaymentAwardNonOptionEquityInstrumentsExercisableAggregateIntrinsicValue |
| Namespace Prefix: |
wire_ |
| Data Type: |
xbrli:monetaryItemType |
| Balance Type: |
debit |
| Period Type: |
instant |
|
| X |
- DefinitionShare-Based Compensation Arrangement By Share-Based Payment Award, Non-Option Equity Instruments, Exercisable, Weighted Average Exercise Price
| Name: |
wire_ShareBasedCompensationArrangementByShareBasedPaymentAwardNonOptionEquityInstrumentsExercisableWeightedAverageExercisePrice |
| Namespace Prefix: |
wire_ |
| Data Type: |
dtr-types1:perShareItemType |
| Balance Type: |
na |
| Period Type: |
instant |
|
| X |
- DefinitionShare-Based Compensation Arrangement By Share-Based Payment Award, Non-Option Equity Instruments, Exercisable, Weighted Average Remaining Contractual Term
| Name: |
wire_ShareBasedCompensationArrangementByShareBasedPaymentAwardNonOptionEquityInstrumentsExercisableWeightedAverageRemainingContractualTerm |
| Namespace Prefix: |
wire_ |
| Data Type: |
xbrli:durationItemType |
| Balance Type: |
na |
| Period Type: |
duration |
|
| X |
- DefinitionShare-Based Compensation Arrangement by Share-Based Payment Award, Non-Option Equity Instruments, Nonvested, Weighted Average Grant Date Fair Value
| Name: |
wire_ShareBasedCompensationArrangementByShareBasedPaymentAwardNonOptionEquityInstrumentsNonvestedWeightedAverageGrantDateFairValueAbstract |
| Namespace Prefix: |
wire_ |
| Data Type: |
xbrli:stringItemType |
| Balance Type: |
na |
| Period Type: |
duration |
|
| X |
- DefinitionShare-based Compensation Arrangement by Share-based Payment Award, Non-Option Equity Instruments, Exercises in Period, Weighted Average Exercise Price
| Name: |
wire_SharebasedCompensationArrangementbySharebasedPaymentAwardNonOptionEquityInstrumentsExercisesinPeriodWeightedAverageExercisePrice |
| Namespace Prefix: |
wire_ |
| Data Type: |
dtr-types1:perShareItemType |
| Balance Type: |
na |
| Period Type: |
duration |
|
| X |
- DefinitionShare-based Compensation Arrangement by Share-based Payment Award, Non-Option Equity Instruments, Forfeitures and Expirations in Period, Weighted Average Exercise Price
| Name: |
wire_SharebasedCompensationArrangementbySharebasedPaymentAwardNonOptionEquityInstrumentsForfeituresandExpirationsinPeriodWeightedAverageExercisePrice |
| Namespace Prefix: |
wire_ |
| Data Type: |
dtr-types1:perShareItemType |
| Balance Type: |
na |
| Period Type: |
duration |
|
| X |
- DefinitionShare-based Compensation Arrangement by Share-based Payment Award, Non-Option Equity Instruments, Outstanding, Weighted Average Exercise Price
| Name: |
wire_SharebasedCompensationArrangementbySharebasedPaymentAwardNonOptionEquityInstrumentsOutstandingWeightedAverageExercisePrice |
| Namespace Prefix: |
wire_ |
| Data Type: |
dtr-types1:perShareItemType |
| Balance Type: |
na |
| Period Type: |
instant |
|
| X |
- Details
| Name: |
us-gaap_AwardTypeAxis=us-gaap_StockAppreciationRightsSARSMember |
| Namespace Prefix: |
|
| Data Type: |
na |
| Balance Type: |
|
| Period Type: |
|
|
v3.24.0.1
| X |
- DefinitionThe estimated dividend rate (a percentage of the share price) to be paid (expected dividends) to holders of the underlying shares over the option's term. Reference 1: http://www.xbrl.org/2003/role/disclosureRef
-Topic 718
-SubTopic 10
-Name Accounting Standards Codification
-Section 50
-Paragraph 2
-Subparagraph (f)(2)(iii)
-Publisher FASB
-URI https://asc.fasb.org//1943274/2147480429/718-10-50-2
| Name: |
us-gaap_ShareBasedCompensationArrangementByShareBasedPaymentAwardFairValueAssumptionsExpectedDividendRate |
| Namespace Prefix: |
us-gaap_ |
| Data Type: |
dtr-types:percentItemType |
| Balance Type: |
na |
| Period Type: |
duration |
|
| X |
- DefinitionThe estimated measure of the percentage by which a share price is expected to fluctuate during a period. Volatility also may be defined as a probability-weighted measure of the dispersion of returns about the mean. The volatility of a share price is the standard deviation of the continuously compounded rates of return on the share over a specified period. That is the same as the standard deviation of the differences in the natural logarithms of the stock prices plus dividends, if any, over the period. Reference 1: http://www.xbrl.org/2003/role/disclosureRef
-Topic 718
-SubTopic 10
-Name Accounting Standards Codification
-Section 50
-Paragraph 2
-Subparagraph (f)(2)(ii)
-Publisher FASB
-URI https://asc.fasb.org//1943274/2147480429/718-10-50-2
| Name: |
us-gaap_ShareBasedCompensationArrangementByShareBasedPaymentAwardFairValueAssumptionsExpectedVolatilityRate |
| Namespace Prefix: |
us-gaap_ |
| Data Type: |
dtr-types:percentItemType |
| Balance Type: |
na |
| Period Type: |
duration |
|
| X |
- DefinitionThe risk-free interest rate assumption that is used in valuing an option on its own shares. Reference 1: http://www.xbrl.org/2003/role/disclosureRef
-Topic 718
-SubTopic 10
-Name Accounting Standards Codification
-Section 50
-Paragraph 2
-Subparagraph (f)(2)(iv)
-Publisher FASB
-URI https://asc.fasb.org//1943274/2147480429/718-10-50-2
| Name: |
us-gaap_ShareBasedCompensationArrangementByShareBasedPaymentAwardFairValueAssumptionsRiskFreeInterestRate |
| Namespace Prefix: |
us-gaap_ |
| Data Type: |
dtr-types:percentItemType |
| Balance Type: |
na |
| Period Type: |
duration |
|
| X |
- DefinitionLine items represent financial concepts included in a table. These concepts are used to disclose reportable information associated with domain members defined in one or many axes to the table. Reference 1: http://www.xbrl.org/2003/role/disclosureRef
-Topic 718
-SubTopic 10
-Name Accounting Standards Codification
-Section 35
-Paragraph 1D
-Publisher FASB
-URI https://asc.fasb.org//1943274/2147480483/718-10-35-1D
Reference 2: http://www.xbrl.org/2003/role/disclosureRef
-Topic 718
-SubTopic 10
-Name Accounting Standards Codification
-Section 35
-Paragraph 3
-Publisher FASB
-URI https://asc.fasb.org//1943274/2147480483/718-10-35-3
Reference 3: http://www.xbrl.org/2003/role/disclosureRef
-Topic 718
-SubTopic 10
-Name Accounting Standards Codification
-Section 50
-Paragraph 2
-Subparagraph (a)(1)
-Publisher FASB
-URI https://asc.fasb.org//1943274/2147480429/718-10-50-2
Reference 4: http://www.xbrl.org/2003/role/disclosureRef
-Topic 718
-SubTopic 10
-Name Accounting Standards Codification
-Section 50
-Paragraph 2
-Subparagraph (a)(2)
-Publisher FASB
-URI https://asc.fasb.org//1943274/2147480429/718-10-50-2
Reference 5: http://www.xbrl.org/2003/role/disclosureRef
-Topic 718
-SubTopic 10
-Name Accounting Standards Codification
-Section 50
-Paragraph 2
-Subparagraph (a)(3)
-Publisher FASB
-URI https://asc.fasb.org//1943274/2147480429/718-10-50-2
Reference 6: http://www.xbrl.org/2003/role/disclosureRef
-Topic 718
-SubTopic 10
-Name Accounting Standards Codification
-Section 50
-Paragraph 2
-Subparagraph (c)(1)(i)
-Publisher FASB
-URI https://asc.fasb.org//1943274/2147480429/718-10-50-2
Reference 7: http://www.xbrl.org/2003/role/disclosureRef
-Topic 718
-SubTopic 10
-Name Accounting Standards Codification
-Section 50
-Paragraph 2
-Subparagraph (c)(1)(ii)
-Publisher FASB
-URI https://asc.fasb.org//1943274/2147480429/718-10-50-2
Reference 8: http://www.xbrl.org/2003/role/disclosureRef
-Topic 718
-SubTopic 10
-Name Accounting Standards Codification
-Section 50
-Paragraph 2
-Subparagraph (c)(1)(iii)
-Publisher FASB
-URI https://asc.fasb.org//1943274/2147480429/718-10-50-2
Reference 9: http://www.xbrl.org/2003/role/disclosureRef
-Topic 718
-SubTopic 10
-Name Accounting Standards Codification
-Section 50
-Paragraph 2
-Subparagraph (c)(1)(iv)
-Publisher FASB
-URI https://asc.fasb.org//1943274/2147480429/718-10-50-2
Reference 10: http://www.xbrl.org/2003/role/disclosureRef
-Topic 718
-SubTopic 10
-Name Accounting Standards Codification
-Section 50
-Paragraph 2
-Subparagraph (c)(1)(iv)(01)
-Publisher FASB
-URI https://asc.fasb.org//1943274/2147480429/718-10-50-2
Reference 11: http://www.xbrl.org/2003/role/disclosureRef
-Topic 718
-SubTopic 10
-Name Accounting Standards Codification
-Section 50
-Paragraph 2
-Subparagraph (c)(1)(iv)(02)
-Publisher FASB
-URI https://asc.fasb.org//1943274/2147480429/718-10-50-2
Reference 12: http://www.xbrl.org/2003/role/disclosureRef
-Topic 718
-SubTopic 10
-Name Accounting Standards Codification
-Section 50
-Paragraph 2
-Subparagraph (c)(1)(iv)(03)
-Publisher FASB
-URI https://asc.fasb.org//1943274/2147480429/718-10-50-2
Reference 13: http://www.xbrl.org/2003/role/disclosureRef
-Topic 718
-SubTopic 10
-Name Accounting Standards Codification
-Section 50
-Paragraph 2
-Subparagraph (c)(1)(iv)(04)
-Publisher FASB
-URI https://asc.fasb.org//1943274/2147480429/718-10-50-2
Reference 14: http://www.xbrl.org/2003/role/disclosureRef
-Topic 718
-SubTopic 10
-Name Accounting Standards Codification
-Section 50
-Paragraph 2
-Subparagraph (c)(2)(i)
-Publisher FASB
-URI https://asc.fasb.org//1943274/2147480429/718-10-50-2
Reference 15: http://www.xbrl.org/2003/role/disclosureRef
-Topic 718
-SubTopic 10
-Name Accounting Standards Codification
-Section 50
-Paragraph 2
-Subparagraph (c)(2)(ii)
-Publisher FASB
-URI https://asc.fasb.org//1943274/2147480429/718-10-50-2
Reference 16: http://www.xbrl.org/2003/role/disclosureRef
-Topic 718
-SubTopic 10
-Name Accounting Standards Codification
-Section 50
-Paragraph 2
-Subparagraph (c)(2)(iii)
-Publisher FASB
-URI https://asc.fasb.org//1943274/2147480429/718-10-50-2
Reference 17: http://www.xbrl.org/2003/role/disclosureRef
-Topic 718
-SubTopic 10
-Name Accounting Standards Codification
-Section 50
-Paragraph 2
-Subparagraph (c)(2)(iii)(01)
-Publisher FASB
-URI https://asc.fasb.org//1943274/2147480429/718-10-50-2
Reference 18: http://www.xbrl.org/2003/role/disclosureRef
-Topic 718
-SubTopic 10
-Name Accounting Standards Codification
-Section 50
-Paragraph 2
-Subparagraph (c)(2)(iii)(02)
-Publisher FASB
-URI https://asc.fasb.org//1943274/2147480429/718-10-50-2
Reference 19: http://www.xbrl.org/2003/role/disclosureRef
-Topic 718
-SubTopic 10
-Name Accounting Standards Codification
-Section 50
-Paragraph 2
-Subparagraph (c)(2)(iii)(03)
-Publisher FASB
-URI https://asc.fasb.org//1943274/2147480429/718-10-50-2
Reference 20: http://www.xbrl.org/2003/role/disclosureRef
-Topic 718
-SubTopic 10
-Name Accounting Standards Codification
-Section 50
-Paragraph 2
-Subparagraph (d)(1)
-Publisher FASB
-URI https://asc.fasb.org//1943274/2147480429/718-10-50-2
Reference 21: http://www.xbrl.org/2003/role/disclosureRef
-Topic 718
-SubTopic 10
-Name Accounting Standards Codification
-Section 50
-Paragraph 2
-Subparagraph (d)(2)
-Publisher FASB
-URI https://asc.fasb.org//1943274/2147480429/718-10-50-2
Reference 22: http://www.xbrl.org/2003/role/disclosureRef
-Topic 718
-SubTopic 10
-Name Accounting Standards Codification
-Section 50
-Paragraph 2
-Subparagraph (e)(1)
-Publisher FASB
-URI https://asc.fasb.org//1943274/2147480429/718-10-50-2
Reference 23: http://www.xbrl.org/2003/role/disclosureRef
-Topic 718
-SubTopic 10
-Name Accounting Standards Codification
-Section 50
-Paragraph 2
-Subparagraph (e)(2)
-Publisher FASB
-URI https://asc.fasb.org//1943274/2147480429/718-10-50-2
Reference 24: http://www.xbrl.org/2003/role/disclosureRef
-Topic 718
-SubTopic 10
-Name Accounting Standards Codification
-Section 50
-Paragraph 2
-Subparagraph (f)(2)(i)
-Publisher FASB
-URI https://asc.fasb.org//1943274/2147480429/718-10-50-2
Reference 25: http://www.xbrl.org/2003/role/disclosureRef
-Topic 718
-SubTopic 10
-Name Accounting Standards Codification
-Section 50
-Paragraph 2
-Subparagraph (f)(2)(ii)
-Publisher FASB
-URI https://asc.fasb.org//1943274/2147480429/718-10-50-2
Reference 26: http://www.xbrl.org/2003/role/disclosureRef
-Topic 718
-SubTopic 10
-Name Accounting Standards Codification
-Section 50
-Paragraph 2
-Subparagraph (f)(2)(iii)
-Publisher FASB
-URI https://asc.fasb.org//1943274/2147480429/718-10-50-2
Reference 27: http://www.xbrl.org/2003/role/disclosureRef
-Topic 718
-SubTopic 10
-Name Accounting Standards Codification
-Section 50
-Paragraph 2
-Subparagraph (f)(2)(iv)
-Publisher FASB
-URI https://asc.fasb.org//1943274/2147480429/718-10-50-2
Reference 28: http://www.xbrl.org/2003/role/disclosureRef
-Topic 718
-SubTopic 10
-Name Accounting Standards Codification
-Section 50
-Paragraph 2
-Subparagraph (f)(2)(v)
-Publisher FASB
-URI https://asc.fasb.org//1943274/2147480429/718-10-50-2
| Name: |
us-gaap_ShareBasedCompensationArrangementByShareBasedPaymentAwardLineItems |
| Namespace Prefix: |
us-gaap_ |
| Data Type: |
xbrli:stringItemType |
| Balance Type: |
na |
| Period Type: |
duration |
|
| X |
- DefinitionExpected term of award under share-based payment arrangement, in 'PnYnMnDTnHnMnS' format, for example, 'P1Y5M13D' represents reported fact of one year, five months, and thirteen days. Reference 1: http://www.xbrl.org/2003/role/disclosureRef
-Topic 718
-SubTopic 10
-Name Accounting Standards Codification
-Section 50
-Paragraph 2
-Subparagraph (f)(2)(i)
-Publisher FASB
-URI https://asc.fasb.org//1943274/2147480429/718-10-50-2
| Name: |
us-gaap_SharebasedCompensationArrangementBySharebasedPaymentAwardFairValueAssumptionsExpectedTerm1 |
| Namespace Prefix: |
us-gaap_ |
| Data Type: |
xbrli:durationItemType |
| Balance Type: |
na |
| Period Type: |
duration |
|
| X |
- Details
| Name: |
us-gaap_AwardTypeAxis=us-gaap_StockAppreciationRightsSARSMember |
| Namespace Prefix: |
|
| Data Type: |
na |
| Balance Type: |
|
| Period Type: |
|
|
v3.24.0.1
| X |
- DefinitionThe number of grants made during the period on other than stock (or unit) option plans (for example, phantom stock or unit plan, stock or unit appreciation rights plan, performance target plan). Reference 1: http://www.xbrl.org/2003/role/disclosureRef
-Topic 718
-SubTopic 10
-Name Accounting Standards Codification
-Section 50
-Paragraph 2
-Subparagraph (c)(2)(iii)(01)
-Publisher FASB
-URI https://asc.fasb.org//1943274/2147480429/718-10-50-2
| Name: |
us-gaap_ShareBasedCompensationArrangementByShareBasedPaymentAwardEquityInstrumentsOtherThanOptionsGrantsInPeriod |
| Namespace Prefix: |
us-gaap_ |
| Data Type: |
xbrli:sharesItemType |
| Balance Type: |
na |
| Period Type: |
duration |
|
| X |
- DefinitionThe weighted average fair value at grant date for nonvested equity-based awards issued during the period on other than stock (or unit) option plans (for example, phantom stock or unit plan, stock or unit appreciation rights plan, performance target plan). Reference 1: http://www.xbrl.org/2003/role/disclosureRef
-Topic 718
-SubTopic 10
-Name Accounting Standards Codification
-Section 50
-Paragraph 2
-Subparagraph (c)(2)(iii)(01)
-Publisher FASB
-URI https://asc.fasb.org//1943274/2147480429/718-10-50-2
| Name: |
us-gaap_ShareBasedCompensationArrangementByShareBasedPaymentAwardEquityInstrumentsOtherThanOptionsGrantsInPeriodWeightedAverageGrantDateFairValue |
| Namespace Prefix: |
us-gaap_ |
| Data Type: |
dtr-types:perShareItemType |
| Balance Type: |
na |
| Period Type: |
duration |
|
| X |
- DefinitionThe number of non-vested equity-based payment instruments, excluding stock (or unit) options, that validly exist and are outstanding as of the balance sheet date. Reference 1: http://www.xbrl.org/2003/role/disclosureRef
-Topic 718
-SubTopic 10
-Name Accounting Standards Codification
-Section 50
-Paragraph 2
-Subparagraph (c)(2)(i)
-Publisher FASB
-URI https://asc.fasb.org//1943274/2147480429/718-10-50-2
Reference 2: http://www.xbrl.org/2003/role/disclosureRef
-Topic 718
-SubTopic 10
-Name Accounting Standards Codification
-Section 50
-Paragraph 2
-Subparagraph (c)(2)(ii)
-Publisher FASB
-URI https://asc.fasb.org//1943274/2147480429/718-10-50-2
| Name: |
us-gaap_ShareBasedCompensationArrangementByShareBasedPaymentAwardEquityInstrumentsOtherThanOptionsNonvestedNumber |
| Namespace Prefix: |
us-gaap_ |
| Data Type: |
xbrli:sharesItemType |
| Balance Type: |
na |
| Period Type: |
instant |
|
| X |
- DefinitionA roll forward is a reconciliation of a concept from the beginning of a period to the end of a period.
| Name: |
us-gaap_ShareBasedCompensationArrangementByShareBasedPaymentAwardEquityInstrumentsOtherThanOptionsNonvestedRollForward |
| Namespace Prefix: |
us-gaap_ |
| Data Type: |
xbrli:stringItemType |
| Balance Type: |
na |
| Period Type: |
duration |
|
| X |
- DefinitionPer share or unit weighted-average fair value of nonvested award under share-based payment arrangement. Excludes share and unit options. Reference 1: http://www.xbrl.org/2003/role/disclosureRef
-Topic 718
-SubTopic 10
-Name Accounting Standards Codification
-Section 50
-Paragraph 2
-Subparagraph (c)(2)(i)
-Publisher FASB
-URI https://asc.fasb.org//1943274/2147480429/718-10-50-2
Reference 2: http://www.xbrl.org/2003/role/disclosureRef
-Topic 718
-SubTopic 10
-Name Accounting Standards Codification
-Section 50
-Paragraph 2
-Subparagraph (c)(2)(ii)
-Publisher FASB
-URI https://asc.fasb.org//1943274/2147480429/718-10-50-2
| Name: |
us-gaap_ShareBasedCompensationArrangementByShareBasedPaymentAwardEquityInstrumentsOtherThanOptionsNonvestedWeightedAverageGrantDateFairValue |
| Namespace Prefix: |
us-gaap_ |
| Data Type: |
dtr-types:perShareItemType |
| Balance Type: |
na |
| Period Type: |
instant |
|
| X |
- References
+ Details
| Name: |
us-gaap_ShareBasedCompensationArrangementByShareBasedPaymentAwardEquityInstrumentsOtherThanOptionsNonvestedWeightedAverageGrantDateFairValueRollForward |
| Namespace Prefix: |
us-gaap_ |
| Data Type: |
xbrli:stringItemType |
| Balance Type: |
na |
| Period Type: |
duration |
|
| X |
- DefinitionThe number of equity-based payment instruments, excluding stock (or unit) options, that vested during the reporting period. Reference 1: http://www.xbrl.org/2003/role/disclosureRef
-Topic 718
-SubTopic 10
-Name Accounting Standards Codification
-Section 50
-Paragraph 2
-Subparagraph (c)(2)(iii)(02)
-Publisher FASB
-URI https://asc.fasb.org//1943274/2147480429/718-10-50-2
| Name: |
us-gaap_ShareBasedCompensationArrangementByShareBasedPaymentAwardEquityInstrumentsOtherThanOptionsVestedInPeriod |
| Namespace Prefix: |
us-gaap_ |
| Data Type: |
xbrli:sharesItemType |
| Balance Type: |
na |
| Period Type: |
duration |
|
| X |
- DefinitionThe weighted average fair value as of grant date pertaining to an equity-based award plan other than a stock (or unit) option plan for which the grantee gained the right during the reporting period, by satisfying service and performance requirements, to receive or retain shares or units, other instruments, or cash in accordance with the terms of the arrangement. Reference 1: http://www.xbrl.org/2003/role/disclosureRef
-Topic 718
-SubTopic 10
-Name Accounting Standards Codification
-Section 50
-Paragraph 2
-Subparagraph (c)(2)(iii)(02)
-Publisher FASB
-URI https://asc.fasb.org//1943274/2147480429/718-10-50-2
| Name: |
us-gaap_ShareBasedCompensationArrangementByShareBasedPaymentAwardEquityInstrumentsOtherThanOptionsVestedInPeriodWeightedAverageGrantDateFairValue |
| Namespace Prefix: |
us-gaap_ |
| Data Type: |
dtr-types:perShareItemType |
| Balance Type: |
na |
| Period Type: |
duration |
|
| X |
- Details
| Name: |
us-gaap_AwardTypeAxis=us-gaap_RestrictedStockMember |
| Namespace Prefix: |
|
| Data Type: |
na |
| Balance Type: |
|
| Period Type: |
|
|
v3.24.0.1
Earnings Per Share - Computation of Basic and Diluted Net Earnings (Loss) Per Share (Details) - USD ($)
shares in Thousands, $ in Thousands |
3 Months Ended |
12 Months Ended |
Dec. 31, 2023 |
Sep. 30, 2023 |
Jun. 30, 2023 |
Mar. 31, 2023 |
Dec. 31, 2022 |
Sep. 30, 2022 |
Jun. 30, 2022 |
Mar. 31, 2022 |
Dec. 31, 2023 |
Dec. 31, 2022 |
Dec. 31, 2021 |
| Numerator: |
|
|
|
|
|
|
|
|
|
|
|
| Net income |
$ 66,123
|
$ 82,052
|
$ 104,741
|
$ 119,483
|
$ 153,998
|
$ 191,773
|
$ 210,538
|
$ 161,531
|
$ 372,399
|
$ 717,841
|
$ 541,422
|
| Denominator: |
|
|
|
|
|
|
|
|
|
|
|
| Denominator for basic earnings per share – weighted average shares (in shares) |
|
|
|
|
|
|
|
|
16,873
|
19,159
|
20,439
|
| Effect of dilutive securities: |
|
|
|
|
|
|
|
|
|
|
|
| Denominator for diluted earnings per share – weighted average shares (in shares) |
|
|
|
|
|
|
|
|
17,223
|
19,446
|
20,649
|
| Employee stock awards |
|
|
|
|
|
|
|
|
|
|
|
| Effect of dilutive securities: |
|
|
|
|
|
|
|
|
|
|
|
| Employee stock options (in shares) |
|
|
|
|
|
|
|
|
350
|
287
|
210
|
| X |
- DefinitionAdditional shares included in the calculation of diluted EPS as a result of the potentially dilutive effect of share based payment arrangements using the treasury stock method. Reference 1: http://www.xbrl.org/2003/role/disclosureRef
-Topic 718
-SubTopic 10
-Name Accounting Standards Codification
-Section 45
-Paragraph 1
-Publisher FASB
-URI https://asc.fasb.org//1943274/2147480454/718-10-45-1
Reference 2: http://www.xbrl.org/2003/role/disclosureRef
-Topic 260
-SubTopic 10
-Name Accounting Standards Codification
-Section 50
-Paragraph 1
-Subparagraph (a)
-Publisher FASB
-URI https://asc.fasb.org//1943274/2147482662/260-10-50-1
Reference 3: http://www.xbrl.org/2003/role/disclosureRef
-Topic 260
-SubTopic 10
-Name Accounting Standards Codification
-Section 45
-Paragraph 22
-Publisher FASB
-URI https://asc.fasb.org//1943274/2147482689/260-10-45-22
Reference 4: http://www.xbrl.org/2003/role/disclosureRef
-Topic 260
-SubTopic 10
-Name Accounting Standards Codification
-Section 45
-Paragraph 23
-Subparagraph (c)
-Publisher FASB
-URI https://asc.fasb.org//1943274/2147482689/260-10-45-23
Reference 5: http://www.xbrl.org/2003/role/disclosureRef
-Topic 260
-SubTopic 10
-Name Accounting Standards Codification
-Section 45
-Paragraph 28A
-Publisher FASB
-URI https://asc.fasb.org//1943274/2147482689/260-10-45-28A
| Name: |
us-gaap_IncrementalCommonSharesAttributableToShareBasedPaymentArrangements |
| Namespace Prefix: |
us-gaap_ |
| Data Type: |
xbrli:sharesItemType |
| Balance Type: |
na |
| Period Type: |
duration |
|
| X |
- DefinitionThe portion of profit or loss for the period, net of income taxes, which is attributable to the parent. Reference 1: http://www.xbrl.org/2003/role/disclosureRef
-Topic 235
-SubTopic 10
-Name Accounting Standards Codification
-Section S99
-Paragraph 1
-Subparagraph (SX 210.4-08(g)(1)(ii))
-Publisher FASB
-URI https://asc.fasb.org//1943274/2147480678/235-10-S99-1
Reference 2: http://www.xbrl.org/2003/role/disclosureRef
-Topic 323
-SubTopic 10
-Name Accounting Standards Codification
-Section 50
-Paragraph 3
-Subparagraph (c)
-Publisher FASB
-URI https://asc.fasb.org//1943274/2147481687/323-10-50-3
Reference 3: http://www.xbrl.org/2003/role/disclosureRef
-Topic 825
-SubTopic 10
-Name Accounting Standards Codification
-Section 50
-Paragraph 28
-Subparagraph (f)
-Publisher FASB
-URI https://asc.fasb.org//1943274/2147482907/825-10-50-28
Reference 4: http://www.xbrl.org/2003/role/disclosureRef
-Topic 220
-SubTopic 10
-Name Accounting Standards Codification
-Section 50
-Paragraph 6
-Publisher FASB
-URI https://asc.fasb.org//1943274/2147482765/220-10-50-6
Reference 5: http://www.xbrl.org/2003/role/disclosureRef
-Topic 250
-SubTopic 10
-Name Accounting Standards Codification
-Section 50
-Paragraph 3
-Publisher FASB
-URI https://asc.fasb.org//1943274/2147483443/250-10-50-3
Reference 6: http://www.xbrl.org/2003/role/disclosureRef
-Topic 250
-SubTopic 10
-Name Accounting Standards Codification
-Section 50
-Paragraph 1
-Subparagraph (b)(2)
-Publisher FASB
-URI https://asc.fasb.org//1943274/2147483443/250-10-50-1
Reference 7: http://www.xbrl.org/2003/role/disclosureRef
-Topic 815
-SubTopic 40
-Name Accounting Standards Codification
-Section 65
-Paragraph 1
-Subparagraph (f)
-Publisher FASB
-URI https://asc.fasb.org//1943274/2147480175/815-40-65-1
Reference 8: http://www.xbrl.org/2003/role/disclosureRef
-Topic 250
-SubTopic 10
-Name Accounting Standards Codification
-Section 50
-Paragraph 8
-Publisher FASB
-URI https://asc.fasb.org//1943274/2147483443/250-10-50-8
Reference 9: http://www.xbrl.org/2003/role/disclosureRef
-Topic 250
-SubTopic 10
-Name Accounting Standards Codification
-Section 50
-Paragraph 9
-Publisher FASB
-URI https://asc.fasb.org//1943274/2147483443/250-10-50-9
Reference 10: http://www.xbrl.org/2003/role/disclosureRef
-Topic 250
-SubTopic 10
-Name Accounting Standards Codification
-Section 50
-Paragraph 11
-Subparagraph (a)
-Publisher FASB
-URI https://asc.fasb.org//1943274/2147483443/250-10-50-11
Reference 11: http://www.xbrl.org/2003/role/disclosureRef
-Topic 250
-SubTopic 10
-Name Accounting Standards Codification
-Section 50
-Paragraph 11
-Subparagraph (b)
-Publisher FASB
-URI https://asc.fasb.org//1943274/2147483443/250-10-50-11
Reference 12: http://www.xbrl.org/2003/role/disclosureRef
-Topic 250
-SubTopic 10
-Name Accounting Standards Codification
-Section 50
-Paragraph 4
-Publisher FASB
-URI https://asc.fasb.org//1943274/2147483443/250-10-50-4
Reference 13: http://www.xbrl.org/2003/role/exampleRef
-Topic 946
-SubTopic 830
-Name Accounting Standards Codification
-Section 55
-Paragraph 10
-Publisher FASB
-URI https://asc.fasb.org//1943274/2147480167/946-830-55-10
Reference 14: http://www.xbrl.org/2003/role/disclosureRef
-Topic 946
-SubTopic 220
-Name Accounting Standards Codification
-Section 45
-Paragraph 7
-Publisher FASB
-URI https://asc.fasb.org//1943274/2147483581/946-220-45-7
Reference 15: http://www.xbrl.org/2003/role/disclosureRef
-Topic 944
-SubTopic 220
-Name Accounting Standards Codification
-Section S99
-Paragraph 1
-Subparagraph (SX 210.7-04(18))
-Publisher FASB
-URI https://asc.fasb.org//1943274/2147483586/944-220-S99-1
Reference 16: http://www.xbrl.org/2003/role/disclosureRef
-Topic 280
-SubTopic 10
-Name Accounting Standards Codification
-Section 50
-Paragraph 22
-Publisher FASB
-URI https://asc.fasb.org//1943274/2147482810/280-10-50-22
Reference 17: http://www.xbrl.org/2003/role/disclosureRef
-Topic 946
-SubTopic 220
-Name Accounting Standards Codification
-Section S99
-Paragraph 1
-Subparagraph (SX 210.6-07(9))
-Publisher FASB
-URI https://asc.fasb.org//1943274/2147483575/946-220-S99-1
Reference 18: http://www.xbrl.org/2003/role/disclosureRef
-Topic 946
-SubTopic 220
-Name Accounting Standards Codification
-Section S99
-Paragraph 3
-Subparagraph (SX 210.6-09(1)(d))
-Publisher FASB
-URI https://asc.fasb.org//1943274/2147483575/946-220-S99-3
Reference 19: http://www.xbrl.org/2003/role/disclosureRef
-Topic 470
-SubTopic 10
-Name Accounting Standards Codification
-Section S99
-Paragraph 1A
-Subparagraph (SX 210.13-01(a)(4)(i))
-Publisher FASB
-URI https://asc.fasb.org//1943274/2147480097/470-10-S99-1A
Reference 20: http://www.xbrl.org/2009/role/commonPracticeRef
-Topic 470
-SubTopic 10
-Name Accounting Standards Codification
-Section S99
-Paragraph 1A
-Subparagraph (SX 210.13-01(a)(4)(ii))
-Publisher FASB
-URI https://asc.fasb.org//1943274/2147480097/470-10-S99-1A
Reference 21: http://www.xbrl.org/2003/role/disclosureRef
-Topic 470
-SubTopic 10
-Name Accounting Standards Codification
-Section S99
-Paragraph 1A
-Subparagraph (SX 210.13-01(a)(4)(iii)(A))
-Publisher FASB
-URI https://asc.fasb.org//1943274/2147480097/470-10-S99-1A
Reference 22: http://www.xbrl.org/2003/role/disclosureRef
-Topic 470
-SubTopic 10
-Name Accounting Standards Codification
-Section S99
-Paragraph 1A
-Subparagraph (SX 210.13-01(a)(4)(iv))
-Publisher FASB
-URI https://asc.fasb.org//1943274/2147480097/470-10-S99-1A
Reference 23: http://www.xbrl.org/2003/role/disclosureRef
-Topic 470
-SubTopic 10
-Name Accounting Standards Codification
-Section S99
-Paragraph 1A
-Subparagraph (SX 210.13-01(a)(5))
-Publisher FASB
-URI https://asc.fasb.org//1943274/2147480097/470-10-S99-1A
Reference 24: http://www.xbrl.org/2003/role/disclosureRef
-Topic 470
-SubTopic 10
-Name Accounting Standards Codification
-Section S99
-Paragraph 1B
-Subparagraph (SX 210.13-02(a)(4)(i))
-Publisher FASB
-URI https://asc.fasb.org//1943274/2147480097/470-10-S99-1B
Reference 25: http://www.xbrl.org/2003/role/disclosureRef
-Topic 470
-SubTopic 10
-Name Accounting Standards Codification
-Section S99
-Paragraph 1B
-Subparagraph (SX 210.13-02(a)(4)(iii)(A))
-Publisher FASB
-URI https://asc.fasb.org//1943274/2147480097/470-10-S99-1B
Reference 26: http://www.xbrl.org/2003/role/disclosureRef
-Topic 470
-SubTopic 10
-Name Accounting Standards Codification
-Section S99
-Paragraph 1B
-Subparagraph (SX 210.13-02(a)(4)(iii)(B))
-Publisher FASB
-URI https://asc.fasb.org//1943274/2147480097/470-10-S99-1B
Reference 27: http://www.xbrl.org/2003/role/disclosureRef
-Topic 470
-SubTopic 10
-Name Accounting Standards Codification
-Section S99
-Paragraph 1B
-Subparagraph (SX 210.13-02(a)(4)(iv))
-Publisher FASB
-URI https://asc.fasb.org//1943274/2147480097/470-10-S99-1B
Reference 28: http://www.xbrl.org/2003/role/disclosureRef
-Topic 470
-SubTopic 10
-Name Accounting Standards Codification
-Section S99
-Paragraph 1B
-Subparagraph (SX 210.13-02(a)(5))
-Publisher FASB
-URI https://asc.fasb.org//1943274/2147480097/470-10-S99-1B
Reference 29: http://www.xbrl.org/2003/role/disclosureRef
-Topic 280
-SubTopic 10
-Name Accounting Standards Codification
-Section 50
-Paragraph 30
-Subparagraph (b)
-Publisher FASB
-URI https://asc.fasb.org//1943274/2147482810/280-10-50-30
Reference 30: http://www.xbrl.org/2003/role/disclosureRef
-Topic 280
-SubTopic 10
-Name Accounting Standards Codification
-Section 50
-Paragraph 32
-Subparagraph (f)
-Publisher FASB
-URI https://asc.fasb.org//1943274/2147482810/280-10-50-32
Reference 31: http://www.xbrl.org/2003/role/disclosureRef
-Topic 260
-SubTopic 10
-Name Accounting Standards Codification
-Section 45
-Paragraph 60B
-Subparagraph (a)
-Publisher FASB
-URI https://asc.fasb.org//1943274/2147482689/260-10-45-60B
Reference 32: http://www.xbrl.org/2003/role/exampleRef
-Topic 280
-SubTopic 10
-Name Accounting Standards Codification
-Section 50
-Paragraph 31
-Publisher FASB
-URI https://asc.fasb.org//1943274/2147482810/280-10-50-31
Reference 33: http://www.xbrl.org/2003/role/disclosureRef
-Topic 280
-SubTopic 10
-Name Accounting Standards Codification
-Section 50
-Paragraph 32
-Subparagraph (c)
-Publisher FASB
-URI https://asc.fasb.org//1943274/2147482810/280-10-50-32
Reference 34: http://www.xbrl.org/2003/role/disclosureRef
-Topic 205
-SubTopic 20
-Name Accounting Standards Codification
-Section 50
-Paragraph 7
-Publisher FASB
-URI https://asc.fasb.org//1943274/2147483499/205-20-50-7
Reference 35: http://fasb.org/us-gaap/role/ref/legacyRef
-Topic 230
-SubTopic 10
-Name Accounting Standards Codification
-Section 45
-Paragraph 28
-Publisher FASB
-URI https://asc.fasb.org//1943274/2147482740/230-10-45-28
Reference 36: http://www.xbrl.org/2003/role/disclosureRef
-Topic 220
-SubTopic 10
-Name Accounting Standards Codification
-Section 45
-Paragraph 1A
-Subparagraph (a)
-Publisher FASB
-URI https://asc.fasb.org//1943274/2147482790/220-10-45-1A
Reference 37: http://www.xbrl.org/2003/role/disclosureRef
-Topic 220
-SubTopic 10
-Name Accounting Standards Codification
-Section 45
-Paragraph 1B
-Subparagraph (a)
-Publisher FASB
-URI https://asc.fasb.org//1943274/2147482790/220-10-45-1B
Reference 38: http://fasb.org/us-gaap/role/ref/legacyRef
-Topic 220
-SubTopic 10
-Name Accounting Standards Codification
-Section S99
-Paragraph 2
-Subparagraph (SX 210.5-03(20))
-Publisher FASB
-URI https://asc.fasb.org//1943274/2147483621/220-10-S99-2
Reference 39: http://fasb.org/us-gaap/role/ref/legacyRef
-Topic 942
-SubTopic 220
-Name Accounting Standards Codification
-Section S99
-Paragraph 1
-Subparagraph (SX 210.9-04(22))
-Publisher FASB
-URI https://asc.fasb.org//1943274/2147483589/942-220-S99-1
| Name: |
us-gaap_NetIncomeLoss |
| Namespace Prefix: |
us-gaap_ |
| Data Type: |
xbrli:monetaryItemType |
| Balance Type: |
credit |
| Period Type: |
duration |
|
| X |
- References
+ Details
| Name: |
us-gaap_WeightedAverageNumberDilutedSharesOutstandingAdjustmentAbstract |
| Namespace Prefix: |
us-gaap_ |
| Data Type: |
xbrli:stringItemType |
| Balance Type: |
na |
| Period Type: |
duration |
|
| X |
- DefinitionThe average number of shares or units issued and outstanding that are used in calculating diluted EPS or earnings per unit (EPU), determined based on the timing of issuance of shares or units in the period. Reference 1: http://www.xbrl.org/2003/role/disclosureRef
-Topic 260
-SubTopic 10
-Name Accounting Standards Codification
-Section 50
-Paragraph 1
-Subparagraph (a)
-Publisher FASB
-URI https://asc.fasb.org//1943274/2147482662/260-10-50-1
Reference 2: http://www.xbrl.org/2003/role/disclosureRef
-Topic 260
-SubTopic 10
-Name Accounting Standards Codification
-Section 45
-Paragraph 16
-Publisher FASB
-URI https://asc.fasb.org//1943274/2147482689/260-10-45-16
| Name: |
us-gaap_WeightedAverageNumberOfDilutedSharesOutstanding |
| Namespace Prefix: |
us-gaap_ |
| Data Type: |
xbrli:sharesItemType |
| Balance Type: |
na |
| Period Type: |
duration |
|
| X |
- DefinitionNumber of [basic] shares or units, after adjustment for contingently issuable shares or units and other shares or units not deemed outstanding, determined by relating the portion of time within a reporting period that common shares or units have been outstanding to the total time in that period. Reference 1: http://www.xbrl.org/2003/role/disclosureRef
-Topic 260
-SubTopic 10
-Name Accounting Standards Codification
-Section 50
-Paragraph 1
-Subparagraph (a)
-Publisher FASB
-URI https://asc.fasb.org//1943274/2147482662/260-10-50-1
Reference 2: http://www.xbrl.org/2003/role/disclosureRef
-Topic 260
-SubTopic 10
-Name Accounting Standards Codification
-Section 45
-Paragraph 10
-Publisher FASB
-URI https://asc.fasb.org//1943274/2147482689/260-10-45-10
| Name: |
us-gaap_WeightedAverageNumberOfSharesOutstandingBasic |
| Namespace Prefix: |
us-gaap_ |
| Data Type: |
xbrli:sharesItemType |
| Balance Type: |
na |
| Period Type: |
duration |
|
| X |
- Details
| Name: |
us-gaap_AntidilutiveSecuritiesExcludedFromComputationOfEarningsPerShareByAntidilutiveSecuritiesAxis=us-gaap_EmployeeStockOptionMember |
| Namespace Prefix: |
|
| Data Type: |
na |
| Balance Type: |
|
| Period Type: |
|
|
v3.24.0.1
| X |
- DefinitionSecurities (including those issuable pursuant to contingent stock agreements) that could potentially dilute basic earnings per share (EPS) or earnings per unit (EPU) in the future that were not included in the computation of diluted EPS or EPU because to do so would increase EPS or EPU amounts or decrease loss per share or unit amounts for the period presented. Reference 1: http://www.xbrl.org/2003/role/disclosureRef
-Topic 260
-SubTopic 10
-Name Accounting Standards Codification
-Section 50
-Paragraph 1
-Subparagraph (c)
-Publisher FASB
-URI https://asc.fasb.org//1943274/2147482662/260-10-50-1
| Name: |
us-gaap_AntidilutiveSecuritiesExcludedFromComputationOfEarningsPerShareAmount |
| Namespace Prefix: |
us-gaap_ |
| Data Type: |
xbrli:sharesItemType |
| Balance Type: |
na |
| Period Type: |
duration |
|
| X |
- References
+ Details
| Name: |
us-gaap_EarningsPerShareAbstract |
| Namespace Prefix: |
us-gaap_ |
| Data Type: |
xbrli:stringItemType |
| Balance Type: |
na |
| Period Type: |
duration |
|
| X |
- DefinitionThe weighted average price as of the balance sheet date at which grantees could acquire the underlying shares with respect to all outstanding stock options which are in the customized range of exercise prices. Reference 1: http://fasb.org/us-gaap/role/ref/legacyRef
-Name Accounting Standards Codification
-Topic 718
-SubTopic 10
-Section 50
-Paragraph 2
-Subparagraph (c)(1)(i)-(ii)
-Publisher FASB
-URI https://asc.fasb.org//1943274/2147480429/718-10-50-2
| Name: |
us-gaap_SharebasedCompensationSharesAuthorizedUnderStockOptionPlansExercisePriceRangeOutstandingOptionsWeightedAverageExercisePriceBeginningBalance1 |
| Namespace Prefix: |
us-gaap_ |
| Data Type: |
dtr-types:perShareItemType |
| Balance Type: |
na |
| Period Type: |
instant |
|
v3.24.0.1
Stockholders' Equity (Details) - shares
|
12 Months Ended |
|
|
Dec. 31, 2023 |
Dec. 31, 2022 |
Dec. 31, 2021 |
Feb. 16, 2024 |
Jun. 30, 2023 |
| Number of shares authorized to be repurchased (in shares) |
|
|
|
|
2,000,000
|
| Repurchase of common stock authorized remaining (in shares) |
813,617
|
|
|
|
|
| Purchase of treasury stock (in shares) |
2,661,792
|
2,055,470
|
475,557
|
|
|
| Subsequent Event |
|
|
|
|
|
| Repurchase of common stock authorized remaining (in shares) |
|
|
|
2,000,000
|
|
| X |
- DefinitionThe number of shares authorized to be repurchased by an entity's Board of Directors under a stock repurchase plan.
| Name: |
us-gaap_StockRepurchaseProgramNumberOfSharesAuthorizedToBeRepurchased |
| Namespace Prefix: |
us-gaap_ |
| Data Type: |
xbrli:sharesItemType |
| Balance Type: |
na |
| Period Type: |
instant |
|
| X |
- DefinitionThe remaining number of shares authorized to be repurchased by an entity's Board of Directors under a stock repurchase plan.
| Name: |
us-gaap_StockRepurchaseProgramRemainingNumberOfSharesAuthorizedToBeRepurchased |
| Namespace Prefix: |
us-gaap_ |
| Data Type: |
xbrli:sharesItemType |
| Balance Type: |
na |
| Period Type: |
instant |
|
| X |
- DefinitionNumber of shares that have been repurchased during the period and are being held in treasury. Reference 1: http://fasb.org/us-gaap/role/ref/legacyRef
-Name Accounting Standards Codification
-Section 50
-Paragraph 2
-SubTopic 10
-Topic 505
-Publisher FASB
-URI https://asc.fasb.org//1943274/2147481112/505-10-50-2
Reference 2: http://fasb.org/us-gaap/role/ref/legacyRef
-Topic 505
-SubTopic 10
-Name Accounting Standards Codification
-Section S99
-Paragraph 1
-Subparagraph (SX 210.3-04)
-Publisher FASB
-URI https://asc.fasb.org//1943274/2147480008/505-10-S99-1
Reference 3: http://fasb.org/us-gaap/role/ref/legacyRef
-Topic 210
-SubTopic 10
-Name Accounting Standards Codification
-Section S99
-Paragraph 1
-Subparagraph (SX 210.5-02(29))
-Publisher FASB
-URI https://asc.fasb.org//1943274/2147480566/210-10-S99-1
| Name: |
us-gaap_TreasuryStockSharesAcquired |
| Namespace Prefix: |
us-gaap_ |
| Data Type: |
xbrli:sharesItemType |
| Balance Type: |
na |
| Period Type: |
duration |
|
| X |
- Details
| Name: |
us-gaap_SubsequentEventTypeAxis=us-gaap_SubsequentEventMember |
| Namespace Prefix: |
|
| Data Type: |
na |
| Balance Type: |
|
| Period Type: |
|
|
v3.24.0.1
| X |
- References
+ Details
| Name: |
us-gaap_CompensationAndRetirementDisclosureAbstract |
| Namespace Prefix: |
us-gaap_ |
| Data Type: |
xbrli:stringItemType |
| Balance Type: |
na |
| Period Type: |
duration |
|
| X |
- DefinitionAmount of cost for defined contribution plan. Reference 1: http://www.xbrl.org/2003/role/disclosureRef
-Topic 715
-SubTopic 70
-Name Accounting Standards Codification
-Section 50
-Paragraph 1
-Publisher FASB
-URI https://asc.fasb.org//1943274/2147480794/715-70-50-1
| Name: |
us-gaap_DefinedContributionPlanCostRecognized |
| Namespace Prefix: |
us-gaap_ |
| Data Type: |
xbrli:monetaryItemType |
| Balance Type: |
debit |
| Period Type: |
duration |
|
v3.24.0.1
Quarterly Financial Information (Unaudited) (Details) - USD ($)
$ / shares in Units, $ in Thousands |
3 Months Ended |
12 Months Ended |
Dec. 31, 2023 |
Sep. 30, 2023 |
Jun. 30, 2023 |
Mar. 31, 2023 |
Dec. 31, 2022 |
Sep. 30, 2022 |
Jun. 30, 2022 |
Mar. 31, 2022 |
Dec. 31, 2023 |
Dec. 31, 2022 |
Dec. 31, 2021 |
| Quarterly Financial Information Disclosure [Abstract] |
|
|
|
|
|
|
|
|
|
|
|
| Net sales |
$ 633,779
|
$ 636,991
|
$ 636,460
|
$ 660,492
|
$ 693,885
|
$ 762,363
|
$ 838,235
|
$ 723,072
|
$ 2,567,722
|
$ 3,017,555
|
$ 2,592,721
|
| Gross profit |
136,408
|
148,242
|
166,148
|
205,085
|
248,455
|
299,447
|
320,772
|
243,747
|
655,883
|
1,112,421
|
867,746
|
| Net income |
$ 66,123
|
$ 82,052
|
$ 104,741
|
$ 119,483
|
$ 153,998
|
$ 191,773
|
$ 210,538
|
$ 161,531
|
$ 372,399
|
$ 717,841
|
$ 541,422
|
| Earnings per common share - basic (in usd per share) |
$ 4.21
|
$ 4.93
|
$ 6.13
|
$ 6.60
|
$ 8.43
|
$ 10.11
|
$ 10.84
|
$ 8.08
|
$ 22.07
|
$ 37.47
|
$ 26.49
|
| Earnings per common share - diluted (in usd per share) |
$ 4.10
|
$ 4.82
|
$ 6.01
|
$ 6.50
|
$ 8.28
|
$ 9.97
|
$ 10.71
|
$ 7.96
|
$ 21.62
|
$ 36.91
|
$ 26.22
|
| X |
- DefinitionThe amount of net income (loss) for the period per each share of common stock or unit outstanding during the reporting period. Reference 1: http://www.xbrl.org/2003/role/disclosureRef
-Topic 250
-SubTopic 10
-Name Accounting Standards Codification
-Section 50
-Paragraph 3
-Publisher FASB
-URI https://asc.fasb.org//1943274/2147483443/250-10-50-3
Reference 2: http://www.xbrl.org/2003/role/disclosureRef
-Topic 260
-SubTopic 10
-Name Accounting Standards Codification
-Section 55
-Paragraph 15
-Publisher FASB
-URI https://asc.fasb.org//1943274/2147482635/260-10-55-15
Reference 3: http://www.xbrl.org/2003/role/disclosureRef
-Topic 815
-SubTopic 40
-Name Accounting Standards Codification
-Section 65
-Paragraph 1
-Subparagraph (e)(4)
-Publisher FASB
-URI https://asc.fasb.org//1943274/2147480175/815-40-65-1
Reference 4: http://www.xbrl.org/2003/role/disclosureRef
-Topic 815
-SubTopic 40
-Name Accounting Standards Codification
-Section 65
-Paragraph 1
-Subparagraph (f)
-Publisher FASB
-URI https://asc.fasb.org//1943274/2147480175/815-40-65-1
Reference 5: http://www.xbrl.org/2003/role/disclosureRef
-Topic 250
-SubTopic 10
-Name Accounting Standards Codification
-Section 50
-Paragraph 11
-Subparagraph (a)
-Publisher FASB
-URI https://asc.fasb.org//1943274/2147483443/250-10-50-11
Reference 6: http://www.xbrl.org/2003/role/disclosureRef
-Topic 250
-SubTopic 10
-Name Accounting Standards Codification
-Section 50
-Paragraph 11
-Subparagraph (b)
-Publisher FASB
-URI https://asc.fasb.org//1943274/2147483443/250-10-50-11
Reference 7: http://www.xbrl.org/2003/role/disclosureRef
-Topic 250
-SubTopic 10
-Name Accounting Standards Codification
-Section 50
-Paragraph 7
-Subparagraph (a)
-Publisher FASB
-URI https://asc.fasb.org//1943274/2147483443/250-10-50-7
Reference 8: http://www.xbrl.org/2003/role/disclosureRef
-Topic 260
-SubTopic 10
-Name Accounting Standards Codification
-Section 45
-Paragraph 2
-Publisher FASB
-URI https://asc.fasb.org//1943274/2147482689/260-10-45-2
Reference 9: http://www.xbrl.org/2003/role/disclosureRef
-Topic 260
-SubTopic 10
-Name Accounting Standards Codification
-Section 45
-Paragraph 60B
-Subparagraph (d)
-Publisher FASB
-URI https://asc.fasb.org//1943274/2147482689/260-10-45-60B
Reference 10: http://www.xbrl.org/2003/role/disclosureRef
-Topic 250
-SubTopic 10
-Name Accounting Standards Codification
-Section 50
-Paragraph 4
-Publisher FASB
-URI https://asc.fasb.org//1943274/2147483443/250-10-50-4
Reference 11: http://www.xbrl.org/2003/role/disclosureRef
-Topic 260
-SubTopic 10
-Name Accounting Standards Codification
-Section 50
-Paragraph 1
-Subparagraph (a)
-Publisher FASB
-URI https://asc.fasb.org//1943274/2147482662/260-10-50-1
Reference 12: http://www.xbrl.org/2003/role/disclosureRef
-Topic 260
-SubTopic 10
-Name Accounting Standards Codification
-Section 45
-Paragraph 10
-Publisher FASB
-URI https://asc.fasb.org//1943274/2147482689/260-10-45-10
Reference 13: http://www.xbrl.org/2003/role/disclosureRef
-Topic 220
-SubTopic 10
-Name Accounting Standards Codification
-Section S99
-Paragraph 2
-Subparagraph (SX 210.5-03(25))
-Publisher FASB
-URI https://asc.fasb.org//1943274/2147483621/220-10-S99-2
Reference 14: http://www.xbrl.org/2003/role/disclosureRef
-Topic 942
-SubTopic 220
-Name Accounting Standards Codification
-Section S99
-Paragraph 1
-Subparagraph (SX 210.9-04(27))
-Publisher FASB
-URI https://asc.fasb.org//1943274/2147483589/942-220-S99-1
Reference 15: http://www.xbrl.org/2003/role/disclosureRef
-Topic 944
-SubTopic 220
-Name Accounting Standards Codification
-Section S99
-Paragraph 1
-Subparagraph (SX 210.7-04(23))
-Publisher FASB
-URI https://asc.fasb.org//1943274/2147483586/944-220-S99-1
Reference 16: http://www.xbrl.org/2003/role/exampleRef
-Topic 260
-SubTopic 10
-Name Accounting Standards Codification
-Section 55
-Paragraph 52
-Publisher FASB
-URI https://asc.fasb.org//1943274/2147482635/260-10-55-52
Reference 17: http://www.xbrl.org/2003/role/disclosureRef
-Topic 260
-SubTopic 10
-Name Accounting Standards Codification
-Section 45
-Paragraph 7
-Publisher FASB
-URI https://asc.fasb.org//1943274/2147482689/260-10-45-7
| Name: |
us-gaap_EarningsPerShareBasic |
| Namespace Prefix: |
us-gaap_ |
| Data Type: |
dtr-types:perShareItemType |
| Balance Type: |
na |
| Period Type: |
duration |
|
| X |
- DefinitionThe amount of net income (loss) for the period available to each share of common stock or common unit outstanding during the reporting period and to each share or unit that would have been outstanding assuming the issuance of common shares or units for all dilutive potential common shares or units outstanding during the reporting period. Reference 1: http://www.xbrl.org/2003/role/disclosureRef
-Topic 250
-SubTopic 10
-Name Accounting Standards Codification
-Section 50
-Paragraph 3
-Publisher FASB
-URI https://asc.fasb.org//1943274/2147483443/250-10-50-3
Reference 2: http://www.xbrl.org/2003/role/disclosureRef
-Topic 260
-SubTopic 10
-Name Accounting Standards Codification
-Section 55
-Paragraph 15
-Publisher FASB
-URI https://asc.fasb.org//1943274/2147482635/260-10-55-15
Reference 3: http://www.xbrl.org/2003/role/disclosureRef
-Topic 815
-SubTopic 40
-Name Accounting Standards Codification
-Section 65
-Paragraph 1
-Subparagraph (e)(4)
-Publisher FASB
-URI https://asc.fasb.org//1943274/2147480175/815-40-65-1
Reference 4: http://www.xbrl.org/2003/role/disclosureRef
-Topic 815
-SubTopic 40
-Name Accounting Standards Codification
-Section 65
-Paragraph 1
-Subparagraph (f)
-Publisher FASB
-URI https://asc.fasb.org//1943274/2147480175/815-40-65-1
Reference 5: http://www.xbrl.org/2003/role/disclosureRef
-Topic 250
-SubTopic 10
-Name Accounting Standards Codification
-Section 50
-Paragraph 11
-Subparagraph (a)
-Publisher FASB
-URI https://asc.fasb.org//1943274/2147483443/250-10-50-11
Reference 6: http://www.xbrl.org/2003/role/disclosureRef
-Topic 250
-SubTopic 10
-Name Accounting Standards Codification
-Section 50
-Paragraph 11
-Subparagraph (b)
-Publisher FASB
-URI https://asc.fasb.org//1943274/2147483443/250-10-50-11
Reference 7: http://www.xbrl.org/2003/role/disclosureRef
-Topic 250
-SubTopic 10
-Name Accounting Standards Codification
-Section 50
-Paragraph 7
-Subparagraph (a)
-Publisher FASB
-URI https://asc.fasb.org//1943274/2147483443/250-10-50-7
Reference 8: http://www.xbrl.org/2003/role/disclosureRef
-Topic 260
-SubTopic 10
-Name Accounting Standards Codification
-Section 45
-Paragraph 2
-Publisher FASB
-URI https://asc.fasb.org//1943274/2147482689/260-10-45-2
Reference 9: http://www.xbrl.org/2003/role/disclosureRef
-Topic 260
-SubTopic 10
-Name Accounting Standards Codification
-Section 45
-Paragraph 60B
-Subparagraph (d)
-Publisher FASB
-URI https://asc.fasb.org//1943274/2147482689/260-10-45-60B
Reference 10: http://www.xbrl.org/2003/role/disclosureRef
-Topic 250
-SubTopic 10
-Name Accounting Standards Codification
-Section 50
-Paragraph 4
-Publisher FASB
-URI https://asc.fasb.org//1943274/2147483443/250-10-50-4
Reference 11: http://www.xbrl.org/2003/role/disclosureRef
-Topic 260
-SubTopic 10
-Name Accounting Standards Codification
-Section 50
-Paragraph 1
-Subparagraph (a)
-Publisher FASB
-URI https://asc.fasb.org//1943274/2147482662/260-10-50-1
Reference 12: http://www.xbrl.org/2003/role/disclosureRef
-Topic 220
-SubTopic 10
-Name Accounting Standards Codification
-Section S99
-Paragraph 2
-Subparagraph (SX 210.5-03(25))
-Publisher FASB
-URI https://asc.fasb.org//1943274/2147483621/220-10-S99-2
Reference 13: http://www.xbrl.org/2003/role/disclosureRef
-Topic 942
-SubTopic 220
-Name Accounting Standards Codification
-Section S99
-Paragraph 1
-Subparagraph (SX 210.9-04(27))
-Publisher FASB
-URI https://asc.fasb.org//1943274/2147483589/942-220-S99-1
Reference 14: http://www.xbrl.org/2003/role/disclosureRef
-Topic 944
-SubTopic 220
-Name Accounting Standards Codification
-Section S99
-Paragraph 1
-Subparagraph (SX 210.7-04(23))
-Publisher FASB
-URI https://asc.fasb.org//1943274/2147483586/944-220-S99-1
Reference 15: http://www.xbrl.org/2003/role/exampleRef
-Topic 260
-SubTopic 10
-Name Accounting Standards Codification
-Section 55
-Paragraph 52
-Publisher FASB
-URI https://asc.fasb.org//1943274/2147482635/260-10-55-52
Reference 16: http://www.xbrl.org/2003/role/disclosureRef
-Topic 260
-SubTopic 10
-Name Accounting Standards Codification
-Section 45
-Paragraph 7
-Publisher FASB
-URI https://asc.fasb.org//1943274/2147482689/260-10-45-7
| Name: |
us-gaap_EarningsPerShareDiluted |
| Namespace Prefix: |
us-gaap_ |
| Data Type: |
dtr-types:perShareItemType |
| Balance Type: |
na |
| Period Type: |
duration |
|
| X |
- DefinitionAggregate revenue less cost of goods and services sold or operating expenses directly attributable to the revenue generation activity. Reference 1: http://www.xbrl.org/2003/role/disclosureRef
-Topic 235
-SubTopic 10
-Name Accounting Standards Codification
-Section S99
-Paragraph 1
-Subparagraph (SX 210.4-08(g)(1)(ii))
-Publisher FASB
-URI https://asc.fasb.org//1943274/2147480678/235-10-S99-1
Reference 2: http://www.xbrl.org/2003/role/disclosureRef
-Topic 323
-SubTopic 10
-Name Accounting Standards Codification
-Section 50
-Paragraph 3
-Subparagraph (c)
-Publisher FASB
-URI https://asc.fasb.org//1943274/2147481687/323-10-50-3
Reference 3: http://www.xbrl.org/2003/role/disclosureRef
-Topic 825
-SubTopic 10
-Name Accounting Standards Codification
-Section 50
-Paragraph 28
-Subparagraph (f)
-Publisher FASB
-URI https://asc.fasb.org//1943274/2147482907/825-10-50-28
Reference 4: http://www.xbrl.org/2003/role/disclosureRef
-Topic 280
-SubTopic 10
-Name Accounting Standards Codification
-Section 50
-Paragraph 22
-Publisher FASB
-URI https://asc.fasb.org//1943274/2147482810/280-10-50-22
Reference 5: http://www.xbrl.org/2003/role/disclosureRef
-Topic 470
-SubTopic 10
-Name Accounting Standards Codification
-Section S99
-Paragraph 1A
-Subparagraph (SX 210.13-01(a)(4)(i))
-Publisher FASB
-URI https://asc.fasb.org//1943274/2147480097/470-10-S99-1A
Reference 6: http://www.xbrl.org/2009/role/commonPracticeRef
-Topic 470
-SubTopic 10
-Name Accounting Standards Codification
-Section S99
-Paragraph 1A
-Subparagraph (SX 210.13-01(a)(4)(ii))
-Publisher FASB
-URI https://asc.fasb.org//1943274/2147480097/470-10-S99-1A
Reference 7: http://www.xbrl.org/2003/role/disclosureRef
-Topic 470
-SubTopic 10
-Name Accounting Standards Codification
-Section S99
-Paragraph 1A
-Subparagraph (SX 210.13-01(a)(4)(iii)(A))
-Publisher FASB
-URI https://asc.fasb.org//1943274/2147480097/470-10-S99-1A
Reference 8: http://www.xbrl.org/2003/role/disclosureRef
-Topic 470
-SubTopic 10
-Name Accounting Standards Codification
-Section S99
-Paragraph 1A
-Subparagraph (SX 210.13-01(a)(4)(iv))
-Publisher FASB
-URI https://asc.fasb.org//1943274/2147480097/470-10-S99-1A
Reference 9: http://www.xbrl.org/2003/role/disclosureRef
-Topic 470
-SubTopic 10
-Name Accounting Standards Codification
-Section S99
-Paragraph 1A
-Subparagraph (SX 210.13-01(a)(5))
-Publisher FASB
-URI https://asc.fasb.org//1943274/2147480097/470-10-S99-1A
Reference 10: http://www.xbrl.org/2003/role/disclosureRef
-Topic 470
-SubTopic 10
-Name Accounting Standards Codification
-Section S99
-Paragraph 1B
-Subparagraph (SX 210.13-02(a)(4)(i))
-Publisher FASB
-URI https://asc.fasb.org//1943274/2147480097/470-10-S99-1B
Reference 11: http://www.xbrl.org/2003/role/disclosureRef
-Topic 470
-SubTopic 10
-Name Accounting Standards Codification
-Section S99
-Paragraph 1B
-Subparagraph (SX 210.13-02(a)(4)(iii)(A))
-Publisher FASB
-URI https://asc.fasb.org//1943274/2147480097/470-10-S99-1B
Reference 12: http://www.xbrl.org/2003/role/disclosureRef
-Topic 470
-SubTopic 10
-Name Accounting Standards Codification
-Section S99
-Paragraph 1B
-Subparagraph (SX 210.13-02(a)(4)(iii)(B))
-Publisher FASB
-URI https://asc.fasb.org//1943274/2147480097/470-10-S99-1B
Reference 13: http://www.xbrl.org/2003/role/disclosureRef
-Topic 470
-SubTopic 10
-Name Accounting Standards Codification
-Section S99
-Paragraph 1B
-Subparagraph (SX 210.13-02(a)(4)(iv))
-Publisher FASB
-URI https://asc.fasb.org//1943274/2147480097/470-10-S99-1B
Reference 14: http://www.xbrl.org/2003/role/disclosureRef
-Topic 470
-SubTopic 10
-Name Accounting Standards Codification
-Section S99
-Paragraph 1B
-Subparagraph (SX 210.13-02(a)(5))
-Publisher FASB
-URI https://asc.fasb.org//1943274/2147480097/470-10-S99-1B
Reference 15: http://www.xbrl.org/2003/role/disclosureRef
-Topic 280
-SubTopic 10
-Name Accounting Standards Codification
-Section 50
-Paragraph 30
-Subparagraph (b)
-Publisher FASB
-URI https://asc.fasb.org//1943274/2147482810/280-10-50-30
Reference 16: http://www.xbrl.org/2003/role/disclosureRef
-Topic 280
-SubTopic 10
-Name Accounting Standards Codification
-Section 50
-Paragraph 32
-Subparagraph (f)
-Publisher FASB
-URI https://asc.fasb.org//1943274/2147482810/280-10-50-32
Reference 17: http://www.xbrl.org/2003/role/exampleRef
-Topic 280
-SubTopic 10
-Name Accounting Standards Codification
-Section 50
-Paragraph 31
-Publisher FASB
-URI https://asc.fasb.org//1943274/2147482810/280-10-50-31
Reference 18: http://www.xbrl.org/2003/role/disclosureRef
-Topic 280
-SubTopic 10
-Name Accounting Standards Codification
-Section 50
-Paragraph 32
-Subparagraph (c)
-Publisher FASB
-URI https://asc.fasb.org//1943274/2147482810/280-10-50-32
Reference 19: http://fasb.org/us-gaap/role/ref/legacyRef
-Topic 220
-SubTopic 10
-Name Accounting Standards Codification
-Section S99
-Paragraph 2
-Subparagraph (SX 210.5-03.1,2)
-Publisher FASB
-URI https://asc.fasb.org//1943274/2147483621/220-10-S99-2
| Name: |
us-gaap_GrossProfit |
| Namespace Prefix: |
us-gaap_ |
| Data Type: |
xbrli:monetaryItemType |
| Balance Type: |
credit |
| Period Type: |
duration |
|
| X |
- DefinitionThe portion of profit or loss for the period, net of income taxes, which is attributable to the parent. Reference 1: http://www.xbrl.org/2003/role/disclosureRef
-Topic 235
-SubTopic 10
-Name Accounting Standards Codification
-Section S99
-Paragraph 1
-Subparagraph (SX 210.4-08(g)(1)(ii))
-Publisher FASB
-URI https://asc.fasb.org//1943274/2147480678/235-10-S99-1
Reference 2: http://www.xbrl.org/2003/role/disclosureRef
-Topic 323
-SubTopic 10
-Name Accounting Standards Codification
-Section 50
-Paragraph 3
-Subparagraph (c)
-Publisher FASB
-URI https://asc.fasb.org//1943274/2147481687/323-10-50-3
Reference 3: http://www.xbrl.org/2003/role/disclosureRef
-Topic 825
-SubTopic 10
-Name Accounting Standards Codification
-Section 50
-Paragraph 28
-Subparagraph (f)
-Publisher FASB
-URI https://asc.fasb.org//1943274/2147482907/825-10-50-28
Reference 4: http://www.xbrl.org/2003/role/disclosureRef
-Topic 220
-SubTopic 10
-Name Accounting Standards Codification
-Section 50
-Paragraph 6
-Publisher FASB
-URI https://asc.fasb.org//1943274/2147482765/220-10-50-6
Reference 5: http://www.xbrl.org/2003/role/disclosureRef
-Topic 250
-SubTopic 10
-Name Accounting Standards Codification
-Section 50
-Paragraph 3
-Publisher FASB
-URI https://asc.fasb.org//1943274/2147483443/250-10-50-3
Reference 6: http://www.xbrl.org/2003/role/disclosureRef
-Topic 250
-SubTopic 10
-Name Accounting Standards Codification
-Section 50
-Paragraph 1
-Subparagraph (b)(2)
-Publisher FASB
-URI https://asc.fasb.org//1943274/2147483443/250-10-50-1
Reference 7: http://www.xbrl.org/2003/role/disclosureRef
-Topic 815
-SubTopic 40
-Name Accounting Standards Codification
-Section 65
-Paragraph 1
-Subparagraph (f)
-Publisher FASB
-URI https://asc.fasb.org//1943274/2147480175/815-40-65-1
Reference 8: http://www.xbrl.org/2003/role/disclosureRef
-Topic 250
-SubTopic 10
-Name Accounting Standards Codification
-Section 50
-Paragraph 8
-Publisher FASB
-URI https://asc.fasb.org//1943274/2147483443/250-10-50-8
Reference 9: http://www.xbrl.org/2003/role/disclosureRef
-Topic 250
-SubTopic 10
-Name Accounting Standards Codification
-Section 50
-Paragraph 9
-Publisher FASB
-URI https://asc.fasb.org//1943274/2147483443/250-10-50-9
Reference 10: http://www.xbrl.org/2003/role/disclosureRef
-Topic 250
-SubTopic 10
-Name Accounting Standards Codification
-Section 50
-Paragraph 11
-Subparagraph (a)
-Publisher FASB
-URI https://asc.fasb.org//1943274/2147483443/250-10-50-11
Reference 11: http://www.xbrl.org/2003/role/disclosureRef
-Topic 250
-SubTopic 10
-Name Accounting Standards Codification
-Section 50
-Paragraph 11
-Subparagraph (b)
-Publisher FASB
-URI https://asc.fasb.org//1943274/2147483443/250-10-50-11
Reference 12: http://www.xbrl.org/2003/role/disclosureRef
-Topic 250
-SubTopic 10
-Name Accounting Standards Codification
-Section 50
-Paragraph 4
-Publisher FASB
-URI https://asc.fasb.org//1943274/2147483443/250-10-50-4
Reference 13: http://www.xbrl.org/2003/role/exampleRef
-Topic 946
-SubTopic 830
-Name Accounting Standards Codification
-Section 55
-Paragraph 10
-Publisher FASB
-URI https://asc.fasb.org//1943274/2147480167/946-830-55-10
Reference 14: http://www.xbrl.org/2003/role/disclosureRef
-Topic 946
-SubTopic 220
-Name Accounting Standards Codification
-Section 45
-Paragraph 7
-Publisher FASB
-URI https://asc.fasb.org//1943274/2147483581/946-220-45-7
Reference 15: http://www.xbrl.org/2003/role/disclosureRef
-Topic 944
-SubTopic 220
-Name Accounting Standards Codification
-Section S99
-Paragraph 1
-Subparagraph (SX 210.7-04(18))
-Publisher FASB
-URI https://asc.fasb.org//1943274/2147483586/944-220-S99-1
Reference 16: http://www.xbrl.org/2003/role/disclosureRef
-Topic 280
-SubTopic 10
-Name Accounting Standards Codification
-Section 50
-Paragraph 22
-Publisher FASB
-URI https://asc.fasb.org//1943274/2147482810/280-10-50-22
Reference 17: http://www.xbrl.org/2003/role/disclosureRef
-Topic 946
-SubTopic 220
-Name Accounting Standards Codification
-Section S99
-Paragraph 1
-Subparagraph (SX 210.6-07(9))
-Publisher FASB
-URI https://asc.fasb.org//1943274/2147483575/946-220-S99-1
Reference 18: http://www.xbrl.org/2003/role/disclosureRef
-Topic 946
-SubTopic 220
-Name Accounting Standards Codification
-Section S99
-Paragraph 3
-Subparagraph (SX 210.6-09(1)(d))
-Publisher FASB
-URI https://asc.fasb.org//1943274/2147483575/946-220-S99-3
Reference 19: http://www.xbrl.org/2003/role/disclosureRef
-Topic 470
-SubTopic 10
-Name Accounting Standards Codification
-Section S99
-Paragraph 1A
-Subparagraph (SX 210.13-01(a)(4)(i))
-Publisher FASB
-URI https://asc.fasb.org//1943274/2147480097/470-10-S99-1A
Reference 20: http://www.xbrl.org/2009/role/commonPracticeRef
-Topic 470
-SubTopic 10
-Name Accounting Standards Codification
-Section S99
-Paragraph 1A
-Subparagraph (SX 210.13-01(a)(4)(ii))
-Publisher FASB
-URI https://asc.fasb.org//1943274/2147480097/470-10-S99-1A
Reference 21: http://www.xbrl.org/2003/role/disclosureRef
-Topic 470
-SubTopic 10
-Name Accounting Standards Codification
-Section S99
-Paragraph 1A
-Subparagraph (SX 210.13-01(a)(4)(iii)(A))
-Publisher FASB
-URI https://asc.fasb.org//1943274/2147480097/470-10-S99-1A
Reference 22: http://www.xbrl.org/2003/role/disclosureRef
-Topic 470
-SubTopic 10
-Name Accounting Standards Codification
-Section S99
-Paragraph 1A
-Subparagraph (SX 210.13-01(a)(4)(iv))
-Publisher FASB
-URI https://asc.fasb.org//1943274/2147480097/470-10-S99-1A
Reference 23: http://www.xbrl.org/2003/role/disclosureRef
-Topic 470
-SubTopic 10
-Name Accounting Standards Codification
-Section S99
-Paragraph 1A
-Subparagraph (SX 210.13-01(a)(5))
-Publisher FASB
-URI https://asc.fasb.org//1943274/2147480097/470-10-S99-1A
Reference 24: http://www.xbrl.org/2003/role/disclosureRef
-Topic 470
-SubTopic 10
-Name Accounting Standards Codification
-Section S99
-Paragraph 1B
-Subparagraph (SX 210.13-02(a)(4)(i))
-Publisher FASB
-URI https://asc.fasb.org//1943274/2147480097/470-10-S99-1B
Reference 25: http://www.xbrl.org/2003/role/disclosureRef
-Topic 470
-SubTopic 10
-Name Accounting Standards Codification
-Section S99
-Paragraph 1B
-Subparagraph (SX 210.13-02(a)(4)(iii)(A))
-Publisher FASB
-URI https://asc.fasb.org//1943274/2147480097/470-10-S99-1B
Reference 26: http://www.xbrl.org/2003/role/disclosureRef
-Topic 470
-SubTopic 10
-Name Accounting Standards Codification
-Section S99
-Paragraph 1B
-Subparagraph (SX 210.13-02(a)(4)(iii)(B))
-Publisher FASB
-URI https://asc.fasb.org//1943274/2147480097/470-10-S99-1B
Reference 27: http://www.xbrl.org/2003/role/disclosureRef
-Topic 470
-SubTopic 10
-Name Accounting Standards Codification
-Section S99
-Paragraph 1B
-Subparagraph (SX 210.13-02(a)(4)(iv))
-Publisher FASB
-URI https://asc.fasb.org//1943274/2147480097/470-10-S99-1B
Reference 28: http://www.xbrl.org/2003/role/disclosureRef
-Topic 470
-SubTopic 10
-Name Accounting Standards Codification
-Section S99
-Paragraph 1B
-Subparagraph (SX 210.13-02(a)(5))
-Publisher FASB
-URI https://asc.fasb.org//1943274/2147480097/470-10-S99-1B
Reference 29: http://www.xbrl.org/2003/role/disclosureRef
-Topic 280
-SubTopic 10
-Name Accounting Standards Codification
-Section 50
-Paragraph 30
-Subparagraph (b)
-Publisher FASB
-URI https://asc.fasb.org//1943274/2147482810/280-10-50-30
Reference 30: http://www.xbrl.org/2003/role/disclosureRef
-Topic 280
-SubTopic 10
-Name Accounting Standards Codification
-Section 50
-Paragraph 32
-Subparagraph (f)
-Publisher FASB
-URI https://asc.fasb.org//1943274/2147482810/280-10-50-32
Reference 31: http://www.xbrl.org/2003/role/disclosureRef
-Topic 260
-SubTopic 10
-Name Accounting Standards Codification
-Section 45
-Paragraph 60B
-Subparagraph (a)
-Publisher FASB
-URI https://asc.fasb.org//1943274/2147482689/260-10-45-60B
Reference 32: http://www.xbrl.org/2003/role/exampleRef
-Topic 280
-SubTopic 10
-Name Accounting Standards Codification
-Section 50
-Paragraph 31
-Publisher FASB
-URI https://asc.fasb.org//1943274/2147482810/280-10-50-31
Reference 33: http://www.xbrl.org/2003/role/disclosureRef
-Topic 280
-SubTopic 10
-Name Accounting Standards Codification
-Section 50
-Paragraph 32
-Subparagraph (c)
-Publisher FASB
-URI https://asc.fasb.org//1943274/2147482810/280-10-50-32
Reference 34: http://www.xbrl.org/2003/role/disclosureRef
-Topic 205
-SubTopic 20
-Name Accounting Standards Codification
-Section 50
-Paragraph 7
-Publisher FASB
-URI https://asc.fasb.org//1943274/2147483499/205-20-50-7
Reference 35: http://fasb.org/us-gaap/role/ref/legacyRef
-Topic 230
-SubTopic 10
-Name Accounting Standards Codification
-Section 45
-Paragraph 28
-Publisher FASB
-URI https://asc.fasb.org//1943274/2147482740/230-10-45-28
Reference 36: http://www.xbrl.org/2003/role/disclosureRef
-Topic 220
-SubTopic 10
-Name Accounting Standards Codification
-Section 45
-Paragraph 1A
-Subparagraph (a)
-Publisher FASB
-URI https://asc.fasb.org//1943274/2147482790/220-10-45-1A
Reference 37: http://www.xbrl.org/2003/role/disclosureRef
-Topic 220
-SubTopic 10
-Name Accounting Standards Codification
-Section 45
-Paragraph 1B
-Subparagraph (a)
-Publisher FASB
-URI https://asc.fasb.org//1943274/2147482790/220-10-45-1B
Reference 38: http://fasb.org/us-gaap/role/ref/legacyRef
-Topic 220
-SubTopic 10
-Name Accounting Standards Codification
-Section S99
-Paragraph 2
-Subparagraph (SX 210.5-03(20))
-Publisher FASB
-URI https://asc.fasb.org//1943274/2147483621/220-10-S99-2
Reference 39: http://fasb.org/us-gaap/role/ref/legacyRef
-Topic 942
-SubTopic 220
-Name Accounting Standards Codification
-Section S99
-Paragraph 1
-Subparagraph (SX 210.9-04(22))
-Publisher FASB
-URI https://asc.fasb.org//1943274/2147483589/942-220-S99-1
| Name: |
us-gaap_NetIncomeLoss |
| Namespace Prefix: |
us-gaap_ |
| Data Type: |
xbrli:monetaryItemType |
| Balance Type: |
credit |
| Period Type: |
duration |
|
| X |
- DefinitionAmount, excluding tax collected from customer, of revenue from satisfaction of performance obligation by transferring promised good or service to customer. Tax collected from customer is tax assessed by governmental authority that is both imposed on and concurrent with specific revenue-producing transaction, including, but not limited to, sales, use, value added and excise. Reference 1: http://www.xbrl.org/2003/role/disclosureRef
-Topic 924
-SubTopic 10
-Name Accounting Standards Codification
-Section S99
-Paragraph 1
-Subparagraph (SAB Topic 11.L)
-Publisher FASB
-URI https://asc.fasb.org//1943274/2147479941/924-10-S99-1
Reference 2: http://www.xbrl.org/2003/role/disclosureRef
-Topic 606
-SubTopic 10
-Name Accounting Standards Codification
-Section 50
-Paragraph 5
-Publisher FASB
-URI https://asc.fasb.org//1943274/2147479806/606-10-50-5
Reference 3: http://www.xbrl.org/2003/role/disclosureRef
-Topic 280
-SubTopic 10
-Name Accounting Standards Codification
-Section 50
-Paragraph 30
-Subparagraph (a)
-Publisher FASB
-URI https://asc.fasb.org//1943274/2147482810/280-10-50-30
Reference 4: http://www.xbrl.org/2003/role/disclosureRef
-Topic 280
-SubTopic 10
-Name Accounting Standards Codification
-Section 50
-Paragraph 42
-Publisher FASB
-URI https://asc.fasb.org//1943274/2147482810/280-10-50-42
Reference 5: http://www.xbrl.org/2003/role/disclosureRef
-Topic 280
-SubTopic 10
-Name Accounting Standards Codification
-Section 50
-Paragraph 22
-Subparagraph (b)
-Publisher FASB
-URI https://asc.fasb.org//1943274/2147482810/280-10-50-22
Reference 6: http://www.xbrl.org/2003/role/disclosureRef
-Topic 280
-SubTopic 10
-Name Accounting Standards Codification
-Section 50
-Paragraph 32
-Subparagraph (b)
-Publisher FASB
-URI https://asc.fasb.org//1943274/2147482810/280-10-50-32
Reference 7: http://www.xbrl.org/2003/role/disclosureRef
-Topic 280
-SubTopic 10
-Name Accounting Standards Codification
-Section 50
-Paragraph 40
-Publisher FASB
-URI https://asc.fasb.org//1943274/2147482810/280-10-50-40
Reference 8: http://www.xbrl.org/2003/role/disclosureRef
-Topic 280
-SubTopic 10
-Name Accounting Standards Codification
-Section 50
-Paragraph 22
-Subparagraph (a)
-Publisher FASB
-URI https://asc.fasb.org//1943274/2147482810/280-10-50-22
Reference 9: http://www.xbrl.org/2003/role/disclosureRef
-Topic 280
-SubTopic 10
-Name Accounting Standards Codification
-Section 50
-Paragraph 32
-Subparagraph (a)
-Publisher FASB
-URI https://asc.fasb.org//1943274/2147482810/280-10-50-32
Reference 10: http://www.xbrl.org/2003/role/disclosureRef
-Topic 280
-SubTopic 10
-Name Accounting Standards Codification
-Section 50
-Paragraph 41
-Subparagraph (a)
-Publisher FASB
-URI https://asc.fasb.org//1943274/2147482810/280-10-50-41
Reference 11: http://www.xbrl.org/2003/role/disclosureRef
-Topic 606
-SubTopic 10
-Name Accounting Standards Codification
-Section 50
-Paragraph 4
-Subparagraph (a)
-Publisher FASB
-URI https://asc.fasb.org//1943274/2147479806/606-10-50-4
| Name: |
us-gaap_RevenueFromContractWithCustomerExcludingAssessedTax |
| Namespace Prefix: |
us-gaap_ |
| Data Type: |
xbrli:monetaryItemType |
| Balance Type: |
credit |
| Period Type: |
duration |
|
Encore Wire (NASDAQ:WIRE)
Historical Stock Chart
From Apr 2024 to May 2024

Encore Wire (NASDAQ:WIRE)
Historical Stock Chart
From May 2023 to May 2024
