Pay vs Performance Disclosure
|
12 Months Ended |
|
Dec. 31, 2023
USD ($)
|
Dec. 31, 2022
USD ($)
|
Dec. 31, 2021
USD ($)
|
Dec. 31, 2020
USD ($)
|
| Pay vs Performance Disclosure |
|
|
|
|
| Pay vs Performance Disclosure, Table |
Pay versus Performance Table The table below presents the compensation paid to our principal executive officer (“PEO”) and the aggregate compensation paid to our other named executive officers (“NEOs”), our Total Shareholder Return (“TSR”) and the TSR of our peer group, and our performance with respect to two other performance metrics for 2023 and each of the three previous fiscal years. The compensation amounts reflected in the table below are calculated in accordance with SEC rules and do not represent amounts actually earned or realized by our PEO or our other NEOs. 2023 | | | $15,379,511 | | | $19,849,625 | | | $3,189,070 | | | $3,902,156 | | | $182 | | | $158 | | | $2,812 | | | 71% | 2022 | | | $14,041,987 | | | $8,571,380 | | | $3,008,361 | | | $2,028,489 | | | $158 | | | $125 | | | $1,842 | | | 67% | 2021 | | | $12,289,397 | | | $19,472,820 | | | $2,828,285 | | | $4,188,291 | | | $173 | | | $152 | | | $1,636 | | | 67% | 2020 | | | $10,141,570 | | | $14,487,968 | | | $2,560,565 | | | $3,408,267 | | | $132 | | | $118 | | | $1,179 | | | 61% |
(1)
| The principal executive officer (“PEO”) is Mr. Milan Galik, our Chief Executive Officer and President. |
(2)
| To calculate the CAP to the PEO and the average CAP to the non-PEO NEOs, the below adjustments were made to total compensation as reported in the Summary Compensation Table. The adjustments were calculated according to the prescribed method determined by the SEC for the calculation of CAP for the periods presented: |
PEO
| 2023 | | | $15,379,511 | | | ($11,025,000) | | | $11,231,126 | | | $3,527,139 | | | $25,036 | | | $711,813 | | | $19,849,625 | 2022 | | | $14,041,987 | | | ($10,037,500) | | | $9,846,473 | | | ($2,293,784) | | | $27,033 | | | ($3,012,829) | | | $8,571,380 | 2021 | | | $12,289,397 | | | ($8,525,000) | | | $8,753,434 | | | $6,042,859 | | | $25,017 | | | $887,113 | | | $19,472,820 | 2020 | | | $10,141,570 | | | ($6,500,000) | | | $6,902,906 | | | $4,512,108 | | | $0 | | | ($568,616) | | | $14,487,968 | Average for non-PEO NEOs
| 2023 | | | $3,189,070 | | | ($1,412,500) | | | $1,429,445 | | | $563,278 | | | $12,518 | | | $120,346 | | | $3,902,156 | 2022 | | | $3,008,361 | | | ($1,334,375) | | | $1,299,225 | | | ($402,096) | | | $14,016 | | | ($556,643) | | | $2,028,489 | 2021 | | | $2,828,285 | | | ($1,237,500) | | | $1,261,547 | | | $1,142,546 | | | $12,509 | | | $180,904 | | | $4,188,291 | 2020 | | | $2,560,565 | | | ($1,122,500) | | | $1,192,098 | | | $901,365 | | | $0 | | | ($123,260) | | | $3,408,267 |
(3)
| The non-PEO NEOs for all periods presented are the following: Mr. Thomas Peterffy, Chairman; Mr. Earl H. Nemser, Vice Chairman; Mr. Paul J. Brody, Chief Financial Officer, Treasurer and Secretary; and Dr. Thomas A.J. Frank, Executive Vice President and Chief Information Officer. |
(4)
| The rate of return assumes $100 was invested in our common stock and the S&P 500 Index on December 31, 2019 and assumes the reinvestment of dividends before tax considerations. |
(5)
| Our selected peer group is the S&P 500 index. |
(6)
| For additional information regarding non-GAAP financial measures, refer to “Non-GAAP Financial Measures” in Part II, Item 7 of our Annual Report on Form 10-K for the year ended December 31, 2023. |
|
|
|
|
| Company Selected Measure Name |
Adjusted pre-tax profit margin.
|
|
|
|
| Named Executive Officers, Footnote |
(1)
| The principal executive officer (“PEO”) is Mr. Milan Galik, our Chief Executive Officer and President. |
(3)
| The non-PEO NEOs for all periods presented are the following: Mr. Thomas Peterffy, Chairman; Mr. Earl H. Nemser, Vice Chairman; Mr. Paul J. Brody, Chief Financial Officer, Treasurer and Secretary; and Dr. Thomas A.J. Frank, Executive Vice President and Chief Information Officer. |
|
|
|
|
| Peer Group Issuers, Footnote |
(5)
| Our selected peer group is the S&P 500 index. |
|
|
|
|
| PEO Total Compensation Amount |
$ 15,379,511
|
$ 14,041,987
|
$ 12,289,397
|
$ 10,141,570
|
| PEO Actually Paid Compensation Amount |
$ 19,849,625
|
8,571,380
|
19,472,820
|
14,487,968
|
| Adjustment To PEO Compensation, Footnote |
(2)
| To calculate the CAP to the PEO and the average CAP to the non-PEO NEOs, the below adjustments were made to total compensation as reported in the Summary Compensation Table. The adjustments were calculated according to the prescribed method determined by the SEC for the calculation of CAP for the periods presented: |
PEO
| 2023 | | | $15,379,511 | | | ($11,025,000) | | | $11,231,126 | | | $3,527,139 | | | $25,036 | | | $711,813 | | | $19,849,625 | 2022 | | | $14,041,987 | | | ($10,037,500) | | | $9,846,473 | | | ($2,293,784) | | | $27,033 | | | ($3,012,829) | | | $8,571,380 | 2021 | | | $12,289,397 | | | ($8,525,000) | | | $8,753,434 | | | $6,042,859 | | | $25,017 | | | $887,113 | | | $19,472,820 | 2020 | | | $10,141,570 | | | ($6,500,000) | | | $6,902,906 | | | $4,512,108 | | | $0 | | | ($568,616) | | | $14,487,968 | Average for non-PEO NEOs
| 2023 | | | $3,189,070 | | | ($1,412,500) | | | $1,429,445 | | | $563,278 | | | $12,518 | | | $120,346 | | | $3,902,156 | 2022 | | | $3,008,361 | | | ($1,334,375) | | | $1,299,225 | | | ($402,096) | | | $14,016 | | | ($556,643) | | | $2,028,489 | 2021 | | | $2,828,285 | | | ($1,237,500) | | | $1,261,547 | | | $1,142,546 | | | $12,509 | | | $180,904 | | | $4,188,291 | 2020 | | | $2,560,565 | | | ($1,122,500) | | | $1,192,098 | | | $901,365 | | | $0 | | | ($123,260) | | | $3,408,267 |
|
|
|
|
| Non-PEO NEO Average Total Compensation Amount |
$ 3,189,070
|
3,008,361
|
2,828,285
|
2,560,565
|
| Non-PEO NEO Average Compensation Actually Paid Amount |
$ 3,902,156
|
2,028,489
|
4,188,291
|
3,408,267
|
| Adjustment to Non-PEO NEO Compensation Footnote |
(2)
| To calculate the CAP to the PEO and the average CAP to the non-PEO NEOs, the below adjustments were made to total compensation as reported in the Summary Compensation Table. The adjustments were calculated according to the prescribed method determined by the SEC for the calculation of CAP for the periods presented: |
PEO
| 2023 | | | $15,379,511 | | | ($11,025,000) | | | $11,231,126 | | | $3,527,139 | | | $25,036 | | | $711,813 | | | $19,849,625 | 2022 | | | $14,041,987 | | | ($10,037,500) | | | $9,846,473 | | | ($2,293,784) | | | $27,033 | | | ($3,012,829) | | | $8,571,380 | 2021 | | | $12,289,397 | | | ($8,525,000) | | | $8,753,434 | | | $6,042,859 | | | $25,017 | | | $887,113 | | | $19,472,820 | 2020 | | | $10,141,570 | | | ($6,500,000) | | | $6,902,906 | | | $4,512,108 | | | $0 | | | ($568,616) | | | $14,487,968 | Average for non-PEO NEOs
| 2023 | | | $3,189,070 | | | ($1,412,500) | | | $1,429,445 | | | $563,278 | | | $12,518 | | | $120,346 | | | $3,902,156 | 2022 | | | $3,008,361 | | | ($1,334,375) | | | $1,299,225 | | | ($402,096) | | | $14,016 | | | ($556,643) | | | $2,028,489 | 2021 | | | $2,828,285 | | | ($1,237,500) | | | $1,261,547 | | | $1,142,546 | | | $12,509 | | | $180,904 | | | $4,188,291 | 2020 | | | $2,560,565 | | | ($1,122,500) | | | $1,192,098 | | | $901,365 | | | $0 | | | ($123,260) | | | $3,408,267 |
|
|
|
|
| Compensation Actually Paid vs. Total Shareholder Return |
Graphical Analysis of the Information Presented in the Pay versus Performance Table As described above, our executive compensation program seeks to align named executive officers’ long-term interests with those of our stockholders to incentivize a long-term increase in stockholder value, and therefore does not specifically align the Company’s performance measures with CAP (as defined by SEC rules) for a particular year. In accordance with Item 402(v) of Regulation S-K, we are providing the following graphic descriptions of the relationships between information presented in the Pay versus Performance table above, for each of the four years ended December 31, 2023. 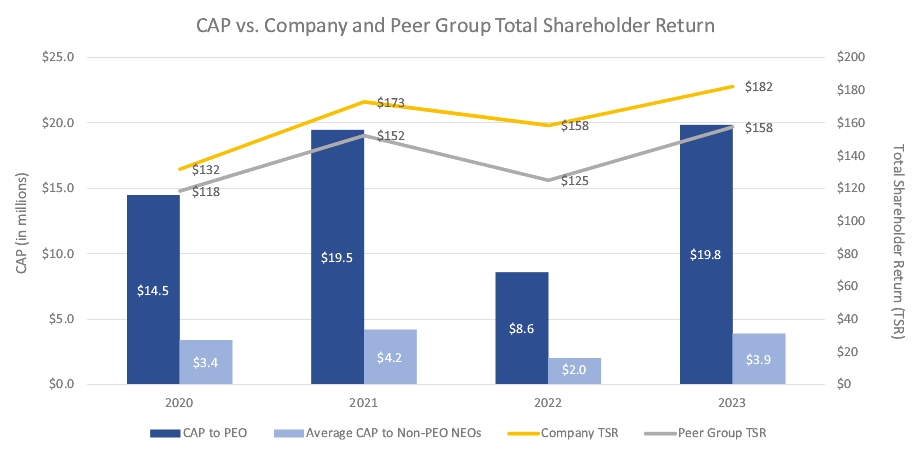
|
|
|
|
| Compensation Actually Paid vs. Net Income |
Graphical Analysis of the Information Presented in the Pay versus Performance Table As described above, our executive compensation program seeks to align named executive officers’ long-term interests with those of our stockholders to incentivize a long-term increase in stockholder value, and therefore does not specifically align the Company’s performance measures with CAP (as defined by SEC rules) for a particular year. In accordance with Item 402(v) of Regulation S-K, we are providing the following graphic descriptions of the relationships between information presented in the Pay versus Performance table above, for each of the four years ended December 31, 2023. 
|
|
|
|
| Compensation Actually Paid vs. Company Selected Measure |
Graphical Analysis of the Information Presented in the Pay versus Performance Table As described above, our executive compensation program seeks to align named executive officers’ long-term interests with those of our stockholders to incentivize a long-term increase in stockholder value, and therefore does not specifically align the Company’s performance measures with CAP (as defined by SEC rules) for a particular year. In accordance with Item 402(v) of Regulation S-K, we are providing the following graphic descriptions of the relationships between information presented in the Pay versus Performance table above, for each of the four years ended December 31, 2023. 
|
|
|
|
| Total Shareholder Return Vs Peer Group |
Graphical Analysis of the Information Presented in the Pay versus Performance Table As described above, our executive compensation program seeks to align named executive officers’ long-term interests with those of our stockholders to incentivize a long-term increase in stockholder value, and therefore does not specifically align the Company’s performance measures with CAP (as defined by SEC rules) for a particular year. In accordance with Item 402(v) of Regulation S-K, we are providing the following graphic descriptions of the relationships between information presented in the Pay versus Performance table above, for each of the four years ended December 31, 2023.
|
|
|
|
| Tabular List, Table |
Financial Performance Measures As described in the Compensation Philosophy and Objectives section contained in this Proxy Statement, our executive compensation program is designed to directly link a significant portion of the compensation of our named executive officers to individual performance and our overall performance, with the goals of aligning our executives’ long-term interests with those of our stockholders and attracting, retaining and motivating key executives who are essential to the implementation of our strategic growth and development strategy. Our Compensation Committee evaluates individual and company performance in a qualitative fashion and does not utilize specific financial or operating performance goals or targets in setting executive compensation, but it considers the following financial measures to be the most important financial measures used by the Company to link CAP for the Company’s named executive officers for the most recently completed fiscal year, to Company performance: • | Adjusted income before income taxes. |
• | Adjusted pre-tax profit margin. |
• | 3-year adjusted net revenue growth. |
For additional information regarding non-GAAP financial measures, refer to “Non-GAAP Financial Measures” in Part II, Item 7 of our Annual Report on Form 10-K for the year ended December 31, 2023.
|
|
|
|
| Total Shareholder Return Amount |
$ 182
|
158
|
173
|
132
|
| Peer Group Total Shareholder Return Amount |
158
|
125
|
152
|
118
|
| Net Income (Loss) |
$ 2,812,000,000
|
$ 1,842,000,000
|
$ 1,636,000,000
|
$ 1,179,000,000
|
| Company Selected Measure Amount |
0.71
|
0.67
|
0.67
|
0.61
|
| PEO Name |
Mr. Milan Galik
|
Mr. Milan Galik
|
Mr. Milan Galik
|
Mr. Milan Galik
|
| Measure:: 1 |
|
|
|
|
| Pay vs Performance Disclosure |
|
|
|
|
| Name |
Adjusted income before income taxes.
|
|
|
|
| Measure:: 2 |
|
|
|
|
| Pay vs Performance Disclosure |
|
|
|
|
| Name |
Adjusted pre-tax profit margin.
|
|
|
|
| Non-GAAP Measure Description |
(6)
| For additional information regarding non-GAAP financial measures, refer to “Non-GAAP Financial Measures” in Part II, Item 7 of our Annual Report on Form 10-K for the year ended December 31, 2023. |
|
|
|
|
| Measure:: 3 |
|
|
|
|
| Pay vs Performance Disclosure |
|
|
|
|
| Name |
3-year adjusted net revenue growth.
|
|
|
|
| PEO | Amounts Reported in the Summary Compensation Table for Stock Awards [Member] |
|
|
|
|
| Pay vs Performance Disclosure |
|
|
|
|
| Adjustment to Compensation, Amount |
$ (11,025,000)
|
$ (10,037,500)
|
$ (8,525,000)
|
$ (6,500,000)
|
| PEO | Fair Value of Stock Awards Granted During the Year, Outstanding and Unvested at Year-End [Member] |
|
|
|
|
| Pay vs Performance Disclosure |
|
|
|
|
| Adjustment to Compensation, Amount |
11,231,126
|
9,846,473
|
8,753,434
|
6,902,906
|
| PEO | Change in Fair Value of Stock Awards Granted in Any Prior Year, Outstanding and Unvested at Year-End [Member] |
|
|
|
|
| Pay vs Performance Disclosure |
|
|
|
|
| Adjustment to Compensation, Amount |
3,527,139
|
(2,293,784)
|
6,042,859
|
4,512,108
|
| PEO | Fair Value of Stock Awards Granted and Vested in the Same Year [Member] |
|
|
|
|
| Pay vs Performance Disclosure |
|
|
|
|
| Adjustment to Compensation, Amount |
25,036
|
27,033
|
25,017
|
0
|
| PEO | Change in Fair Value of Stock Awards Granted in Any Prior Year, Vested During the Year [Member] |
|
|
|
|
| Pay vs Performance Disclosure |
|
|
|
|
| Adjustment to Compensation, Amount |
711,813
|
(3,012,829)
|
887,113
|
(568,616)
|
| Non-PEO NEO | Amounts Reported in the Summary Compensation Table for Stock Awards [Member] |
|
|
|
|
| Pay vs Performance Disclosure |
|
|
|
|
| Adjustment to Compensation, Amount |
(1,412,500)
|
(1,334,375)
|
(1,237,500)
|
(1,122,500)
|
| Non-PEO NEO | Fair Value of Stock Awards Granted During the Year, Outstanding and Unvested at Year-End [Member] |
|
|
|
|
| Pay vs Performance Disclosure |
|
|
|
|
| Adjustment to Compensation, Amount |
1,429,445
|
1,299,225
|
1,261,547
|
1,192,098
|
| Non-PEO NEO | Change in Fair Value of Stock Awards Granted in Any Prior Year, Outstanding and Unvested at Year-End [Member] |
|
|
|
|
| Pay vs Performance Disclosure |
|
|
|
|
| Adjustment to Compensation, Amount |
563,278
|
(402,096)
|
1,142,546
|
901,365
|
| Non-PEO NEO | Fair Value of Stock Awards Granted and Vested in the Same Year [Member] |
|
|
|
|
| Pay vs Performance Disclosure |
|
|
|
|
| Adjustment to Compensation, Amount |
12,518
|
14,016
|
12,509
|
0
|
| Non-PEO NEO | Change in Fair Value of Stock Awards Granted in Any Prior Year, Vested During the Year [Member] |
|
|
|
|
| Pay vs Performance Disclosure |
|
|
|
|
| Adjustment to Compensation, Amount |
$ 120,346
|
$ (556,643)
|
$ 180,904
|
$ (123,260)
|