J. Allen Fine, Chairman of Investors Title Company, (NASDAQ: ITIC)
announced that for the second quarter ended June 30, 2006, the
Company reported net income of $4,315,537, an increase of 11.7%
compared with $3,861,998 for the prior year period. Net income per
diluted share equaled $1.68, an increase of 13.5% compared with
$1.48 per diluted share in the same period last year. Net premiums
written decreased 4.4% to $19,123,591 and revenues increased 1.2%
to $23,126,621 compared with the prior year period. For the
six-month period ended June 30, 2006, the Company reported net
income $7,190,478, an increase of 32.1%, compared with $5,442,492
for the same six-month period in 2005. Diluted earnings per share
were $2.79, an increase of 34.1% compared with $2.08 for the same
six-month ended period in 2005. Net premiums written decreased 3.7%
to $35,755,217 and revenues increased 2.7% to $43,305,469 compared
with the prior year. Growth in the fee income generated in the
exchange services segment and the Trust division coupled with an
increase in investment income drove the overall increase in total
revenue. Offsetting these increases was a decline in premiums
written resulting primarily from a lower level of real estate
activity. Operating expenses remained flat as the decline in
commissions paid to agents was offset by an increase in personnel
costs. The effective tax rate declined resulting primarily from
higher interest rates and higher balances invested in tax-exempt
securities. Chairman Fine added, "The decline in our premium
revenue has followed the overall softening in the residential
housing market this year. As generally expected, transaction volume
and mortgage loan originations have trended down as a result of
higher mortgage rates. Countering this trend slightly has been
ongoing strength in the commercial real estate sector." Investors
Title Company is engaged through its subsidiaries in the business
of issuing and underwriting title insurance policies. The Company
also provides services in connection with tax-deferred exchanges of
like-kind property as well as investment management services to
individuals, trusts, foundations and businesses. Certain statements
contained herein may constitute forward-looking statements within
the meaning of the Private Securities Litigation Reform Act of
1995. Such statements include any predictions regarding activity in
the U.S. real estate market. These statements involve a number of
risks and uncertainties that could cause actual results to differ
materially from anticipated and historical results. For more
details on risk, uncertainties and other factors that could affect
expectations, refer to the Company's Annual Report on Form 10-K for
the year ended December 31, 2005, as filed with the Securities and
Exchange Commission. -0- *T Investors Title Company and
Subsidiaries Consolidated Statements of Income June 30, 2006 and
2005 (Unaudited) For The For The Three Months Six Months Ended
Ended June 30 June 30 -------------------- --------------------
2006 2005 2006 2005 --------- --------- --------- -----------
Revenues: Underwriting income: Premiums Written $19,222,175
$20,052,131 $35,968,444 $37,298,168 Less-premiums for reinsurance
ceded 98,584 45,736 213,227 184,815 ----------- -----------
----------- ----------- Net premiums written 19,123,591 20,006,395
35,755,217 37,113,353 Investment income- interest and dividends
1,034,696 808,559 2,028,750 1,561,324 Net realized gain (loss) on
sales of investments (17,190) 30,801 544,457 19,907 Exchange
services revenue 1,908,357 1,239,793 2,936,089 2,049,432 Other
1,077,167 768,514 2,040,956 1,439,625 ----------- -----------
----------- ----------- Total 23,126,621 22,854,062 43,305,469
42,183,641 ----------- ----------- ----------- -----------
Operating Expenses: Commissions to agents 7,289,322 7,848,781
13,572,718 14,840,530 Provision for claims 2,030,412 2,172,108
3,885,691 4,071,113 Salaries, employee benefits and payroll taxes
4,917,022 4,413,567 9,922,869 9,780,879 Office occupancy and
operations 1,266,042 1,239,870 2,731,355 2,589,076 Business
development 547,505 464,388 1,053,163 891,861 Taxes, other than
payroll and income 146,007 209,230 296,892 319,984 Premium and
retaliatory taxes 328,542 393,770 670,610 793,315 Professional fees
737,534 653,251 1,325,156 1,091,181 Other 219,728 66,099 438,567
111,210 ----------- ----------- ----------- ----------- Total
17,482,114 17,461,064 33,897,021 34,489,149 ----------- -----------
----------- ----------- Income Before Income Taxes 5,644,507
5,392,998 9,408,448 7,694,492 ----------- ----------- -----------
----------- Provision For Income Taxes 1,328,970 1,531,000
2,217,970 2,252,000 ----------- ----------- ----------- -----------
Net Income $ 4,315,537 $ 3,861,998 $ 7,190,478 $ 5,442,492
=========== =========== =========== =========== Basic Earnings Per
Common Share $ 1.70 $ 1.51 $ 2.83 $ 2.12 =========== ===========
=========== =========== Weighted Average Shares Outstanding - Basic
2,537,883 2,563,094 2,543,475 2,563,793 =========== ===========
=========== =========== Diluted Earnings Per Common Share $ 1.68 $
1.48 $ 2.79 $ 2.08 =========== =========== =========== ===========
Weighted Average Shares Outstanding - Diluted 2,572,062 2,607,611
2,578,743 2,616,418 =========== =========== =========== ===========
Investors Title Company and Subsidiaries Consolidated Balance
Sheets As of June 30, 2006 and December 31, 2005 (Unaudited) June
30, Dec. 31, 2006 2005 -------------------------- Assets Cash and
cash equivalents $ 3,691,551 $ 14,608,481 Investments in
securities: Fixed maturities: Held-to-maturity, at amortized cost
1,199,924 1,648,708 Available-for-sale, at fair value 91,429,904
75,472,342 Equity securities, available-for-sale at fair value
11,872,205 9,437,678 Short-term investments 4,386,825 7,257,734
Other investments 1,662,557 1,336,111 ------------ ------------
Total investments 110,551,415 95,152,573 Premiums receivable, net
7,680,380 7,818,558 Accrued interest and dividends 1,102,015
1,010,198 Prepaid expenses and other assets 2,021,482 1,592,326
Property acquired in settlement of claims 413,480 359,980 Property,
net 5,907,523 5,466,765 Deferred income taxes, net 2,917,684
2,462,647 ------------ ------------ Total Assets $134,285,530
$128,471,528 ============ ============ Liabilities and
Stockholders' Equity Liabilities: Reserves for claims $ 35,866,000
$ 34,857,000 Accounts payable and accrued liabilities 8,579,869
7,928,384 Commissions and reinsurance payables 358,385 442,098
Current income taxes payable 279,123 946,790 ------------
------------ Total liabilities 45,083,377 44,174,272 ------------
------------ Stockholders' Equity: Common stock - no par value
(shares authorized 10,000,000; 2,534,036 and 2,549,434 shares
issued and outstanding 2006 and 2005, respectively, excluding
291,792 and 297,783 shares 2006 and 2005, respectively, of common
stock held by the Company's subsidiary) 1 1 Retained earnings
87,591,774 81,477,022 Accumulated other comprehensive income (net
unrealized gain on investments) 1,610,378 2,820,233 ------------
------------ Total stockholders' equity 89,202,153 84,297,256
------------ ------------ Total Liabilities and Stockholders'
Equity $134,285,530 $128,471,528 ============ ============
Investors Title Company and Subsidiaries Net Premiums Written By
State June 30, 2006 and 2005 (Unaudited) For the Three Months For
the Six Months Ended Ended June 30 June 30 -----------------------
----------------------- State 2006 2005 2006 2005
----------------------------------------------
----------------------- Alabama $ 330,545 $ 379,273 $ 574,181 $
730,003 Florida 327,956 462,331 606,291 771,940 Illinois 280,013
278,550 527,908 491,330 Kentucky 583,539 545,873 1,157,037 984,840
Maryland 407,905 487,882 781,674 860,528 Michigan 881,521 1,273,971
1,758,830 2,385,378 Minnesota 304,900 259,992 642,069 528,792
Mississippi 167,225 298,242 301,677 561,593 Nebraska 197,136
180,377 331,446 385,695 New York 709,195 774,372 1,212,791
1,360,377 North Carolina 9,773,452 9,606,689 18,214,934 17,365,468
Pennsylvania 410,595 448,823 726,507 827,648 South Carolina
1,536,781 1,340,095 2,938,854 3,387,988 Tennessee 614,769 722,736
1,281,092 1,290,584 Virginia 1,897,939 2,211,161 3,572,042
3,954,013 West Virginia 640,423 582,511 1,095,841 1,012,065 Other
158,281 199,253 238,844 385,880 ----------- ----------- -----------
----------- Direct Premiums 19,222,175 20,052,131 35,962,018
37,284,122 Reinsurance Assumed - - 6,426 14,046 Reinsurance Ceded
(98,584) (45,736) (213,227) (184,815) ----------- -----------
----------- ----------- Net Premiums Written $19,123,591
$20,006,395 $35,755,217 $37,113,353 =========== ===========
=========== =========== Investors Title Company and Subsidiaries
Net Premiums Written By Branch and Agency June 30, 2006 and 2005
(Unaudited) For The Three Months Ended June 30
------------------------------------------ 2006 % 2005 %
------------------------------------------ Branch $9,004,581 47
$9,131,282 46 Agency 10,119,010 53 10,875,113 54
------------------------------------------ Total $19,123,591 100
$20,006,395 100 ==========================================
Investors Title Company and Subsidiaries Net Premiums Written By
Branch and Agency June 30, 2006 and 2005 (Unaudited) For The Six
Months Ended June 30
----------------------------------------------- 2006 % 2005 %
----------------------------------------------- Branch $16,730,965
47 $16,381,111 44 Agency 19,024,252 53 20,732,242 56
------------------------- ----------------------- Total $35,755,217
100 $37,113,353 100
================================================== *T
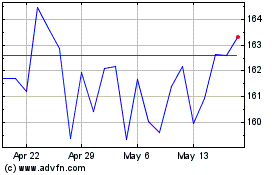
Investors Title (NASDAQ:ITIC)
Historical Stock Chart
From Jun 2024 to Jul 2024

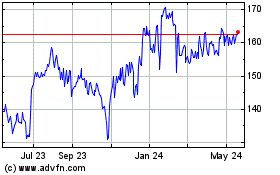
Investors Title (NASDAQ:ITIC)
Historical Stock Chart
From Jul 2023 to Jul 2024
