SonoSite, Inc. (Nasdaq:SONO), the world leader and
specialist in bedside and point-of-care ultrasound, today reported
financial results for the first quarter ended March 31, 2011.
REVENUE
Revenue for the first quarter of 2011 was $71.1 million, an
increase of 27% compared to $56.0 million in the first quarter of
2010. Revenue from VisualSonics, Inc., acquired in June 2010, was
$8.2 million for the quarter.
Foreign currency rates had a 2% favorable impact on first
quarter revenue results.
FIRST QUARTER HIGHLIGHTS
- The US Sector delivered another quarter
of double-digit revenue growth, up $4.5 million or 21%;
- Strong performance by the US Enterprise
channel, which grew 71% compared to the prior year;
- VisualSonics successfully launched the
Vevo® LAZR Photoacoustics Imaging system at the American
Association of Cancer Research, receiving positive feedback and
interest among scientific researchers.
EBITDAS, EBITDA and Operating Income (EBIT)
First Quarter Results
First quarter EBITDAS was $8.7 million or 12% of revenue, an
increase of 62% over the prior year.
EBITDA was $6.6 million or 9% of revenue, an increase of 52%
over the prior year.
EBIT was $4.0 million or 6% of revenue, an increase of 51% over
the prior year.
EPS
EPS was $0.07 per share for the first quarter of 2011 versus
$0.08 per share in 2010. SonoSite recognized an income tax expense
of $0.7 million in 2011 compared to an income tax benefit of $1.0
million in the prior year.
COMMENTARY
“We finished the first quarter strong with the fifth consecutive
quarter that our revenue growth has exceeded expectations,” said
Kevin M. Goodwin, SonoSite President and CEO. “We also saw positive
trends and sustained growth in the hospital channel, fueling our
confidence in the expansion of point-of-care visualization, which
is significant as we prepare to roll-out our new product portfolio
in the upcoming months. Our international business also performed
well despite facing economic uncertainties and the challenges in
Japan.”
Mr. Goodwin continued, “Our newly acquired VisualSonics (VSI)
business also had a solid quarter, contributing eight million
dollars to the top line, in spite of delays in NIH research
funding, which impacted revenue performance due to delays in the
U.S. Government budget approval. Additionally, in the quarter, VSI
launched the Vevo LAZR Photoacoustics Imaging system at the recent
American Association of Cancer Research conference and received
strong interest among researchers. We are confident that the
photoacoustics technology will transform scientific discovery and
extend beyond cancer research.”
FINANCIAL OUTLOOK
“We have seen positive secular momentum for five consecutive
quarters and have become much more confident about the long-term
opportunity for significant growth in point-of-care visualization,”
said Marcus Smith, SonoSite’s CFO. “This, combined with the
successful acquisition of VisualSonics, a robust pipeline of
innovative new products, and thirteen years of practice creating
and growing new markets indicates that we are in a unique position
to significantly expand our reach and penetration.”
Mr. Smith continued, “With this in mind, we are gearing up to go
after this opportunity in a more aggressive manner. Management,
with the full agreement of our Board of Directors, will be
implementing a plan that involves a step-up in our growth
investment over the next three years aimed at significantly
increasing our value.”
We are planning investment opportunities that will:
- Significantly increase demand
generation and the profile of the company,
- Deliver our most ambitious wave of new
innovations in the company’s thirteen year history, and
- Continue to expand our geographic reach
to fully penetrate key market opportunities internationally.
Reflecting the current investment strategy:
- Management is now targeting operating
expenses of $195 - $197 million with the majority of the
year-over-year increase occurring in the second and third
quarters,
- We are updating our 2011 revenue growth
target to 15-20% versus the previously announced 13-18% range,
and
- If current 2011 foreign exchange
forecasts for a weakening U.S. dollar hold, we estimate that there
will be a potential $2 million increase to operating expenses
offset by a potential $5 million increase to revenues; due to the
volatility of foreign exchange rates, this impact is not reflected
in management’s updated targets.
Mr. Smith continued, “As we have stated, profitable growth
remains the key operating philosophy and revenue growth remains the
key driver of long-term operating leverage. Our long-term objective
is 15% revenue growth per year through 2014, which would take the
company above the half billion dollar mark, and produce 20%
operating margins.”
Non-GAAP Measures
This release includes discussions of EBITDA and EBITDAS; these
are non-GAAP financial measures. SonoSite believes these measures
are a useful complement to results provided in accordance with
GAAP. “EBITDA” refers to operating income (EBIT) before
depreciation and amortization. “EBITDAS” refers to operating income
(EBIT) before depreciation, amortization and stock-based
compensation.
Conference Call Information
SonoSite will hold a conference call on April 25th at 1:30 pm
PT/4:30 pm ET. The call will be broadcast live and can be accessed
via http://www.sonosite.com/company/investors. A
replay of the audio webcast will be available beginning April 25th
at 5:30 pm PT and will be available until May 9th at 11:59 pm PT by
dialing 719-457-0820 or toll-free 888-203-1112. The confirmation
code 2602385 is required to access the replay. The call will also
be archived on SonoSite’s website.
About SonoSite
SonoSite, Inc. (www.sonosite.com) is the innovator and world
leader in bedside and point-of-care ultrasound and an industry
leader in ultra high-frequency micro-ultrasound technology and
impedance cardiography equipment. Headquartered near Seattle, the
company is represented by fourteen subsidiaries and a global
distribution network in over 100 countries. SonoSite’s small,
lightweight systems are expanding the use of ultrasound across the
clinical spectrum by cost-effectively bringing high-performance
ultrasound to the point of patient care.
Forward-looking Information and the
Private Litigation Reform Act of 1995
Certain statements in this press release are “forward-looking
statements” for the purposes of the safe harbor provisions of the
Private Securities Litigation Reform Act of 1995, including
statements relating to our future financial condition and results
of operations and statements regarding planned product launches and
the potential market opportunity for these products. These
forward-looking statements are based on the opinions and estimates
of our management at the time the statements are made and are
subject to risks and uncertainties that could cause actual results
to differ materially from those expected or implied by the
forward-looking statements. These statements are not guaranties of
future performance, are based on potentially inaccurate assumptions
and are subject to known and unknown risks and uncertainties,
including, without limitation, the risk that we do not achieve the
financial results that we expect, the risk we are unable to launch
our new products as and when expected, the risk that our existing
and new products do not achieve market success and the other
factors contained in Item 1A. “Risk Factors” section of our most
recent Annual Report on Form 10-K filed with the Securities and
Exchange Commission. We caution readers not to place undue reliance
upon these forward-looking statements that speak only as to the
date of this release. We undertake no obligation to publicly revise
any forward-looking statements to reflect new information, events
or circumstances after the date of this release or to reflect the
occurrence of unanticipated events.
SonoSite, Inc. Selected Financial Information
Condensed Consolidated Statements of Income (in
thousands except per share data) (unaudited)
Three Months
Ended March 31, 2011 2010 Revenue $ 71,081 $
55,977 Cost of revenue 21,128 16,280
Gross margin 49,953 39,697 Operating expenses: Research and
development 9,445 7,597 Sales, general and administrative
36,474 29,429 Total operating expenses
45,919 37,026 Operating income 4,034 2,671 Other
loss, net (2,363 ) (2,262 ) Income before
income taxes 1,671 409 Income tax provision (benefit)
667 (973 ) Net income $ 1,004 $ 1,382
Net income per share: Basic $ 0.07 $ 0.08
Diluted $ 0.07 $ 0.08 Weighted
average common and potential common shares outstanding: Basic
13,608 16,284 Diluted
14,152 16,823
Reconciliation of
Non-GAAP Measures - EBITDA and EBITDAS:
Operating income (EBIT) $ 4,034 $ 2,671 Depreciation
and amortization 2,588 1,679 EBITDA 6,622
4,350 Stock-based compensation 2,039 1,009
EBITDAS $ 8,661 $ 5,359
Condensed
Consolidated Balance Sheets (in thousands) (unaudited)
As of March 31, 2010 December 31, 2010
ASSETS Current Assets Cash and cash equivalents $ 83,208 $
78,690 Accounts receivable, net 77,699 81,516 Inventories 39,947
37,126 Deferred tax assets, current 8,961 7,801 Prepaid expenses
and other current assets 10,597 12,384
Total current assets 220,412 217,517 Property and equipment,
net 9,082 9,133 Deferred tax assets, net 3,418 4,373 Investment in
affiliate 8,000 8,000 Goodwill 39,851 37,786 Identifiable
intangible assets, net 46,343 47,423 Other assets 5,592
4,823 Total assets $ 332,698 $ 329,055
LIABILITIES AND SHAREHOLDERS' EQUITY
Current Liabilities Accounts payable $ 11,369 $ 10,597 Accrued
expenses 24,036 32,535 Deferred revenue 6,481
6,042 Total current liabilities 41,886 49,174
Long-term debt, net 98,555 97,379 Deferred tax liability, net 3,167
1,811 Deferred revenue 14,991 15,236 Other non-current liabilities,
net 12,614 12,565 Total
liabilities $ 171,213 $ 176,165 Commitments
and contingencies Shareholders' Equity: Common stock and
additional paid-in capital 304,658 299,005 Accumulated deficit
(147,970 ) (148,975 ) Accumulated other comprehensive income
4,797 2,860 Total shareholders' equity
161,485 152,890 Total liabilities and
shareholders' equity $ 332,698 $ 329,055
Condensed
Consolidated Statements of Cash Flow (in thousands)
(unaudited)
Three Months Ended March 31, 2011
2010 Operating activities: Net income $ 1,004 $ 1,382
Adjustments to reconcile net income to net cash provided by
operating activities: Depreciation and amortization 2,616 1,679
Stock-based compensation 2,039 1,009 Deferred income tax provision
(41 ) 143 Amortization of debt discount and debt issuance costs
1,165 1,179 Excess tax benefit from stock-based compensation (720 )
(436 ) Other 94 (1 ) Changes in operating assets and liabilities:
Changes in working capital (3,603 ) 8,782 Net
cash provided by operating activities 2,554 13,737 Investing
activities: Purchases of investment securities - (42,246 ) Proceeds
from the sales/maturities of investment securities - 53,298
Purchases of property and equipment (689 ) (1,006 ) Investment in
affiliate - (4,000 ) Net cash (used in)
provided by investing activities (689 ) 6,046 Financing
activities: Excess tax benefit from exercise stock-based awards 720
436 Minimum tax withholding on stock-based awards (121 ) (692 )
Stock repurchases including transaction costs - (90,046 ) Payment
of contingent purchase consideration for LumenVu, Inc. (300 ) (425
) Proceeds from exercise of stock-based awards 3,047 1,568
Repayment of long-term debt (7 ) (5 ) Net cash
provided by (used in) financing activities 3,339 (89,164 )
Effect of exchange rate changes on cash and cash equivalents
(686 ) 783 Net change in cash and cash
equivalents 4,518 (68,598 ) Cash and cash equivalents at beginning
of year 78,690 183,065 Cash and cash
equivalents at end of year $ 83,208 $ 114,467
Supplemental disclosure of cash flow information: Cash (refund)
paid for income taxes $ (754 ) $ 333 Cash paid for
interest $ 2,156 $ 2,156
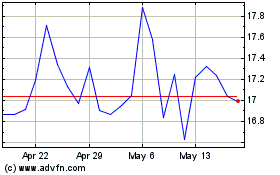
Sonos (NASDAQ:SONO)
Historical Stock Chart
From Jun 2024 to Jul 2024

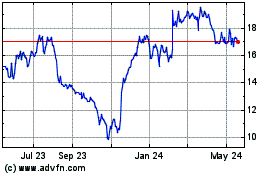
Sonos (NASDAQ:SONO)
Historical Stock Chart
From Jul 2023 to Jul 2024
