UNITED STATES SECURITIES AND EXCHANGE COMMISSION
Washington, D.C. 20549
FORM 6-K
REPORT OF FOREIGN PRIVATE ISSUER
PURSUANT TO RULE 13a-16 OR 15d-16 UNDER
THE SECURITIES EXCHANGE ACT OF 1934
For the month of August 2023
Commission File Number: 001-15276
Itaú Unibanco Holding S.A.
(Exact name of registrant as specified in its charter)
Itaú Unibanco Holding S.A.
(Translation of Registrant’s Name into English)
Praça Alfredo Egydio de Souza Aranha, 100-Torre
Conceição
CEP 04344-902 São Paulo, SP, Brazil
(Address of Principal Executive Office)
Indicate by check mark whether the registrant files
or will file annual reports under cover of Form 20-F or Form 40-F.
Form
20-F ☒ Form 40-F ☐
Indicate by check mark if the registrant is submitting
the Form 6-K in paper as permitted by Regulation S-T Rule 101(b)(1):
Yes
☐ No ☒
Indicate by check mark if the registrant is submitting
the Form 6-K in paper as permitted by Regulation S-T Rule 101(b)(7):
Yes
☐ No ☒
EXHIBIT INDEX
SIGNATURES
Pursuant to the requirements of the Securities Exchange
Act of 1934, the registrant has duly caused this report to be signed on its behalf by the undersigned, thereunto duly authorized.
Date: August 23, 2023.
Itaú Unibanco Holding S.A.
By: /s/ Milton Maluhy Filho
Name: Milton Maluhy Filho
Title: Chief Executive Officer
By: /s/ Alexsandro Broedel
Name: Alexandro Broedel
Title: Chief Financial Officer
TABLE OF CONTENTS
Page
| CERTAIN TERMS AND CONVENTIONS |
1 |
| CAUTIONARY STATEMENT REGARDING FORWARD-LOOKING STATEMENTS |
2 |
| PRESENTATION OF FINANCIAL AND OTHER INFORMATION |
4 |
| SELECTED FINANCIAL DATA |
5 |
| OPERATING AND FINANCIAL REVIEW AND PROSPECTS |
7 |
| REGULATORY RECENT DEVELOPMENTS |
23 |
| SIGNATURES |
32 |
| FINANCIAL STATEMENTS |
33 |
CERTAIN TERMS AND CONVENTIONS
All references in this Form 6-K
to (i) “Itaú Unibanco Holding,” “Itaú Unibanco Group,” “we,” “us”
or “our” are references to Itaú Unibanco Holding S.A. and its consolidated subsidiaries, except where otherwise
specified or required by the context; (ii) the “Brazilian government” are references to the federal government
of the Federative Republic of Brazil, or Brazil; (iii) “preferred shares” are references to our authorized and outstanding
preferred shares with no par value; and (iv) “common shares” are references to our authorized and outstanding common
shares with no par value. All references to “ADSs” are to American Depositary Shares, each representing one preferred
share, without par value. The ADSs are evidenced by American Depositary Receipts, or “ADRs,” issued by The Bank of
New York Mellon, or BNY Mellon. All references herein to the “real,” “reais” or “R$”
are to the Brazilian real, the official currency of Brazil. All references to “US$,” “dollars”
or “U.S. dollars” are to United States dollars.
Additionally, unless specified
or the context indicates otherwise, the following definitions apply throughout this Form 6-K:
| · | “Itaú Unibanco”
means Itaú Unibanco S.A., together with its consolidated subsidiaries; |
| · | “Itaú BBA”
means Banco Itaú BBA S.A., together with its consolidated subsidiaries; |
| · | “Itaú Corpbanca”
means Itaú Corpbanca, together with its consolidated subsidiaries; and |
| · | “Central Bank”
means the Central Bank of Brazil. |
Additionally,
acronyms used repeatedly, defined and technical terms, specific market expressions and the full names of our main subsidiaries and other
entities referenced in this report on Form 6-K are explained or detailed in the glossary of
terms beginning on page 200 to our annual report on Form 20-F for the year ended December 31, 2022 filed with the SEC on April
28, 2023, or our 2022 Form 20-F.
CAUTIONARY STATEMENT REGARDING FORWARD-LOOKING
STATEMENTS
This report on Form 6-K
contains statements that are or may constitute forward-looking statements within the meaning of the U.S. Private Securities Litigation
Reform Act of 1995, Section 27A of the United States Securities Act of 1933, as amended, or the Securities Act, and Section 21E of the
U.S. Securities Exchange Act of 1934, as amended, or the Exchange Act. We have based these forward-looking statements largely on our current
expectations and projections about future events and financial trends affecting our business. These forward-looking statements are subject
to risks, uncertainties and assumptions including, among other risks:
| · | Political instability in Brazil, including developments
and the perception of risks in connection with the recently elected government in Brazil, as well as ongoing corruption and other investigations
and increasing fractious relations and infighting within the administration of the Brazilian government, as well as policies and potential
changes to address these matters or otherwise, including economic and fiscal reforms, any of which may negatively affect growth prospects
in the Brazilian economy as a whole; |
| · | General economic, political, and business conditions
in Brazil and variations in inflation indices, interest rates, foreign exchange rates, and the performance of financial markets in Brazil
and the other markets in which we operate; |
| · | Global economic and political conditions, as well as
geopolitical instability, in particular in the countries where we operate, including in relation to the United States or the Russian invasion
of Ukraine; |
| · | Changes in laws or regulations, including in respect
of tax matters, compulsory deposits and reserve requirements, that adversely affect our business; |
| · | Any changes in tax law, tax reforms or review of the
tax treatment of our activities may adversely affect our operations and profitability; |
| · | Disruptions and volatility in the global financial
markets; |
| · | Costs and availability of funding; |
| · | Failure or hacking of our security and operational
infrastructure or systems; |
| · | Our ability to protect personal data; |
| · | Our level of capitalization; |
| · | Increases in defaults by borrowers and other loan delinquencies,
which result in increases in loan loss allowances; |
| · | Competition in our industry; |
| · | Changes in our loan portfolio and changes in the value
of our securities and derivatives; |
| · | Customer losses or losses of other sources of revenues; |
| · | Our ability to execute our strategies and capital expenditure
plans and to maintain and improve our operating performance; |
| · | Our exposure to Brazilian public debt; |
| · | Incorrect pricing methodologies for insurance, pension
plan and premium bond products and inadequate reserves; |
| · | The effectiveness of our risk management policies; |
| · | Our ability to successfully integrate acquired or merged
businesses; |
| · | Adverse legal or regulatory disputes or proceedings; |
| · | Environmental damage and climate change and effects
from socio-environmental issues, including new and/or more stringent regulations relating to these issues; and |
| · | Other risk factors as set forth in our 2022 Form 20-F. |
The words “believe”,
“may”, “will”, “estimate”, “continue”, “anticipate”, “intend”,
“expect” and similar words are intended to identify forward-looking statements but are not the exclusive means of identifying
such statements. We undertake no obligation to update publicly or revise any forward-looking statements because of new information, future
events or otherwise. In light of these risks and uncertainties, the forward-looking information, events and circumstances discussed in
this report on Form 6-K might not occur. Our actual results and performance could differ substantially from those anticipated in such
forward-looking statements.
PRESENTATION OF FINANCIAL AND OTHER INFORMATION
The information found
in this Form 6-K is accurate only as of the date of such information or as of the date of this Form 6-K, as applicable. Our activities,
our financial position and assets, the results of operations and our prospects may have changed since that date.
Information contained
in or accessible through our website or any other websites referenced herein does not form part of this Form 6-K unless we specifically
state that it is incorporated by reference and forms part of this Form 6-K. All references in this Form 6-K to websites are inactive textual
references and are for information only.
Effect of Rounding
Certain amounts and percentages
included in this Form 6-K, including in the section of this Form 6-K entitled “Operating and Financial Review and Prospects”
have been rounded for ease of presentation. Percentage figures included in this Form 6-K have not been calculated in all cases on the
basis of the rounded figures but on the basis of the original amounts prior to rounding. For this reason, certain percentage amounts in
this Form 6-K may vary from those obtained by performing the same calculations using the figures in our audited interim consolidated financial
statements. Certain other amounts that appear in this Form 6-K may vary slightly and figures shown as totals in certain tables may not
be an arithmetical aggregation of the figures preceding them.
About our Financial Information
The reference date for
the quantitative information derived from our consolidated balance sheet included in this Form 6-K is as of June 30, 2023 and December
31, 2022 and the reference dates for information derived from our consolidated statement of income are the six-month periods ended June
30, 2023 and 2022, except where otherwise indicated.
Our audited interim consolidated
financial statements as of June 30, 2023 and December 31, 2022 and for the six-month periods ended June 31, 2023 and 2022, included at
the end of this Form 6-K, are prepared in accordance with International Financial Reporting Standards, or IFRS, issued by the International
Accounting Standards Board, or IASB.
Our audited interim consolidated
financial statements as of June 30, 2023 and December 31, 2022 and for the six-month periods ended June 30, 2023 and 2022 were audited
in accordance with International Standards on Auditing by PricewaterhouseCoopers Auditores Independentes Ltda., or PwC, our independent
auditors. Such financial statements are referred to herein as our audited interim consolidated financial statements.
Please see “Note
30 – Segment Information” to our audited interim consolidated financial statements for further details about the main differences
between our management reporting systems and our audited interim consolidated financial statements prepared in accordance with IFRS issued
by the IASB.
SELECTED FINANCIAL DATA
We present below our selected
financial data derived from our audited interim consolidated financial statements included in this Form 6-K. Our audited interim consolidated
financial statements are presented as of June 30, 2023 and December 31, 2022 and for the six-month periods ended June 30, 2023 and 2022
and have been prepared in accordance with IFRS issued by the IASB. Considering the adoption of IFRS 17 for insurance and reinsurance contracts
held as from January 1, 2023, we adopted the modified retrospective approach with a transition date of January 1, 2022 for comparative
purposes. For further details, please see “Note 2 – Significant accounting policies” to our audited interim consolidated
financial statements.
Additionally, we present
a summarized version of our Consolidated Statement of Income, Consolidated Balance Sheet and Consolidated Statement of Cash Flows in the
section “Operating and Financial Review and Prospects.”
The following selected
financial data should be read together with “Presentation of Financial and Other Information” and “Operating and Financial
Review and Prospects.”
| Income Information |
For the six-month period ended
June 30, |
Variation |
| 2023 |
2022 |
| (In millions of R$, except percentages and basis points) |
% |
| Operating Revenues |
76,173 |
70,011 |
8.8 |
| Net interest income(1) |
47,732 |
43,332 |
10.2 |
| Non-interest income(2) |
28,441 |
26,679 |
6.6 |
| Expected Loss from Financial Assets |
(16,029) |
(13,235) |
21.1 |
| Other operating income (expenses) |
(41,000) |
(37,722) |
8.7 |
| Net income attributable to owners of the parent company |
15,974 |
13,966 |
14.4 |
| Recurring Return on Average Equity - Annualized - Consolidated (3) |
18.6% |
18.6% |
- |
| Return on Average Equity – Annualized - Consolidated(4) |
18.5% |
18.1% |
40 bps |
(1) Includes: (i) interest and similar income; (ii) interest and similar expenses; (iii) income of financial assets and liabilities at fair value through profit or loss; and (iv) foreign exchange results and exchange variations in foreign transactions.
(2) Includes commissions and banking fees, income from insurance contracts and private pension and other income. |
| (3) The Recurring Return on Average Equity is obtained by dividing the Recurring Result (R$16,081 million and R$14,348 million in the six-month periods ended June 30, 2023 and 2022, respectively) by the Average Stockholders’ Equity adjusted by the dividends proposed (R$172,707 million and R$154,342 million in the six-month periods ended June 30, 2023 and 2022, respectively). The resulting amount is multiplied by the number of periods in the year to derive the annualized rate. The calculation bases of returns were adjusted by the dividends proposed after the balance sheet closing dates, which have not yet been approved at annual Stockholders' or Board meetings. |
(4) The Return on Average Equity is calculated by dividing the Net Income (R$15,974 million and R$13,966 million in the six-month periods ended June 30, 2023 and 2022, respectively) by the Average Stockholders’ Equity adjusted by the dividends proposed (R$172,707 million and R$154,342 million in the six-month periods ended June 30, 2023 and 2022, respectively). This average considers the Stockholders’ Equity from the four previous quarters. The quotient of this division was multiplied by the number of periods in the year to arrive at the annual ratio. The calculation bases of returns were adjusted by the proposed dividend amounts after the balance sheet dates not yet approved at the annual shareholders 'meeting or at the Board of Directors' meetings.
|
| |
|
|
|
| Balance Sheet Information |
As of June 30, |
As of December 31, |
Variation |
| 2023 |
2022 |
|
| |
(In millions of R$, except percentages and basis points) |
% |
| Total assets |
2,434,208 |
2,321,066 |
4.9 |
| Total loans and finance lease operations |
901,185 |
909,422 |
(0.9) |
| (-) Provision for expected loss(1) |
(54,046) |
(52,324) |
3.3 |
| Common Equity Tier I Ratio - in % |
12.2% |
11.9% |
30 bps |
| Tier I Ratio - in % |
13.6% |
13.5% |
10 bps |
| Total Capital Ratio - in % |
15.1% |
15.0% |
10 bps |
| (1) Comprises Expected Credit Loss for Financial Guarantees Pledged R$ (778) at 06/30/2023 (R$ (810) at 12/31/2022) and Loan Commitments R$ (3,094) at 06/30/2023 (R$ (2,874) at 12/31/2022). Please see “Note 10 — Loan and Lease operations” to our audited interim consolidated financial statements for further details. |
| |
| Other Information |
For the six-month period ended
June 30, |
Variation |
| 2023 |
2022 |
% |
| Net income per share – R$ (1) |
1.63 |
1.43 |
14.0 |
| Weighted average number of outstanding shares - basic |
9,795,857,635 |
9,797,123,736 |
(0.0) |
| Total Number of Employees |
99,864 |
99,913 |
(0.0) |
| Brazil |
88,078 |
87,703 |
0.4 |
| Abroad |
11,786 |
12,210 |
(3.5) |
| Total Branches and CSBs – Client Service Branches |
4,081 |
4,192 |
(2.6) |
| ATM – Automated Teller Machines (2) |
42,400 |
43,747 |
(3.1) |
| (1) Calculated based on the weighted average number of outstanding shares for the period. |
| (2) Includes ESBs (electronic service branches) and service points at third-party locations and Banco24Horas ATMs. |
OPERATING AND FINANCIAL REVIEW AND PROSPECTS
The following discussion should be read in conjunction
with our audited interim consolidated financial statements and accompanying notes and other financial information included elsewhere in
this Form 6-K and the description of our business in “Item 4. Information on the Company” in our 2022 Form 20-F. The following
discussion contains forward-looking statements that involve risks and uncertainties. Our actual results may differ materially from those
discussed in forward-looking statements as a result of various factors, including those set forth in “Forward-Looking Statements”
herein and in our 2022 Form 20-F.
Results of Operations
The table below presents
our summarized consolidated statement of income for the six-month periods ended June 30, 2023 and 2022. The interest rates presented are
expressed in Brazilian reais and include the effect of the variation of the real against foreign currencies. For more information
on the products and services we offer, see “Item 4. Information on the Company” in our 2022 Form 20-F.
Please see our audited
interim consolidated financial statements for the six-month period ended June 30, 2023 and 2022 for further details about our Consolidated
Statement of Income.
| Summarized Consolidated Statement of Income |
For the six month period ended
June 30, |
Variation |
| 2023 |
2022 |
R$ million |
% |
| |
(In millions of R$) |
|
|
| Operating revenues |
76,173 |
70,011 |
6,162 |
8.8 |
| Net interest income(1) |
47,732 |
43,332 |
4,400 |
10.2 |
| Non-interest income(2) |
28,441 |
26,679 |
1,762 |
6.6 |
| Expected loss from financial assets |
(16,029) |
(13,235) |
(2,794) |
21.1 |
| Other operating income (expenses) |
(41,000) |
(37,722) |
(3,278) |
8.7 |
| Net income before income tax and social contribution |
19,144 |
19,054 |
90 |
0.5 |
| Current and deferred income and social contribution taxes |
(2,681) |
(4,492) |
1,811 |
(40.3) |
| Net income |
16,463 |
14,562 |
1,901 |
13.1 |
| Net income attributable to owners of the parent company |
15,974 |
13,966 |
2,008 |
14.4 |
| (1) Includes: |
(i) interest and similar income (R$111,549 million and R$84,127 million in the six-month periods ended June 30, 2023 and 2022, respectively);
(ii) interest and similar expenses (R$(81,576) million and R$(46,025) million in the six-month periods ended June 30, 2023 and 2022, respectively);
(iii) income of financial assets and liabilities at fair value through profit or loss (R$11,917 million and R$4,879) million in the six-month periods ended June 30, 2023 and 2022, respectively); and
(iv) foreign exchange results and exchange variations in foreign transactions (R$5,842 million and R$351 million in the six-month periods ended June 30, 2023 and 2022, respectively). |
| (2) Includes commissions and banking fees, Income from insurance contracts and private pension and other income. |
Six-month period ended June 30, 2023, compared to six-month period
ended June 30, 2022.
Net income attributable
to owners of the parent company increased by 14.4% to R$15,974 million for the six-month period ended June 30, 2023, from R$13,966
million for the same period of 2022. This is mainly due to an 8.8%, or R$6,162 million, increase in operating revenues, and 40.3%, or
R$1,811 million, decrease in current and deferred income and social contribution taxes, offset by an 8.7%, or R$3,278 million, increase
in other operating income (expenses), and 21.1%, or R$2,794 million, increase in expected loss from financial assets. These line items
are further described below:
Net interest income
increased by R$4,400 million, or 10.2%, for the six-month period ended June 30, 2023, compared to the same period of 2022, mainly
due to increases in the following line items (i) R$27,422 million in interest and similar income, mainly due to increases of R$10,803
million in income from securities purchased under agreements to resell, R$10,323 million in loan operations income, and R$3,524 million
in financial assets at fair value through other comprehensive income; (ii) R$7,038 million in income of financial assets and liabilities
at fair value through profit or loss; and (iii) R$5,491 million in foreign exchange results and exchange variations in foreign transactions.
These increases were offset by an increase of R$35,551
million in interest and similar expenses.
| o | Interest and similar income increased by 32.6%
for the six-month period ended June 30, 2023, compared to the same period of 2022, due to higher income from securities purchased under
agreements to resell and the positive effect of the growth of our loan portfolio, associated with the gradual change in the composition
of credit risk assets between periods, or the Mix of Credit Products, in addition to the positive impact of the increase in the Brazilian
base interest rate, or SELIC Rate. As of June 30, 2023, the SELIC Rate was 13.75% per annum compared to 13.25% per annum as of June 30,
2022. |
| o | Interest and similar expenses increased by 77.2%
for the six-month period ended June 30, 2023 compared to the same period of 2022, due to increases in the following line items: (i) R$15,510
million in expenses from deposits, especially in time deposits; and (ii) R$11,781 million in expenses from securities sold under repurchase
agreements. The increases mentioned above are a result of the increase in the volume of our operations and the slight increase in interest
rates. |
Please see “Note 21 – Interest
and similar income and expenses and income of financial assets and liabilities at fair value through profit or loss” to our audited
interim consolidated financial statements for further details on interest and similar expenses.
Non-interest income increased
by 6.6%, or R$1,762 million for the six-month period ended June 30, 2023 compared to the same period of 2022. This increase was mainly
due to (i) a 39.6%, or R$973 million, increase in income from insurance contracts and private pension, due to higher insurance sales mainly
related to group life products, credit life and mortgage insurance products, and the increase in our financial result of the period; and
(ii) a 1.2%, or R$271 million, increase in commissions and banking fees, due to the higher transaction volume from credit and debit cards,
both in the issuance and acquiring businesses.
The following chart shows the
main components of our banking service fees for the six-month period ended June 30, 2023, and 2022:
Please see “Note
22 – Commissions and Banking Fees” to our audited interim consolidated financial statements for further details on banking
service fees.
Expected Loss from
Financial Assets
Our expected loss from
financial assets increased by R$2,794 million, or 21.1%, for the six-month period ended June 30, 2023, compared to the same period of
2022, mainly due to an increase in expected loss with loan and lease operations of R$2,570 million for the six-month period ended June
30, 2023, compared to the same period of 2022. This increase was mainly due to an increase in our credit portfolio and higher provisions
in the Retail Business in Brazil, a result of the increase in origination of unsecured consumer credit products.
Please see “Note
10 — Loan and Lease operations” to our audited interim consolidated financial statements for further details on our loan and
lease operations portfolio.
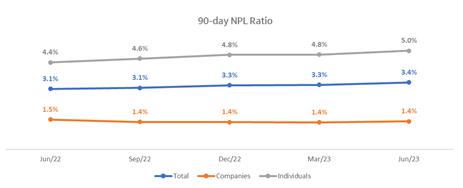
| o | Non-performing loans: We calculate
our 90-day non-performing loan, or NPL ratio, as the value of our 90-days non-performing loans to our loan portfolio. |
As of June 30, 2023, our 90-day NPL ratio
was 3.4%, an increase of 30 basis points compared to June 30, 2022. This increase was due to the increase of 60 basis points in the 90-day
NPL ratio in respect of our individuals loan portfolio, which experienced higher delinquency rates. This was partially offset by a decrease
of 10 basis points in the NPL ratio of our companies loan portfolio. In the second quarter of 2023, we recorded sales of active portfolios
with no risk retention to unaffiliated companies. From these sales, R$185 million refer to active loans that were more than 90 days overdue,
of which R$139 million would still be an active loan portfolio at the end of the period if not sold. Additionally, we sold R$99 million
which refer to active portfolios non-overdue or with short delinquency from our Latin American operations. These sales did not have a
material impact on delinquency ratios.
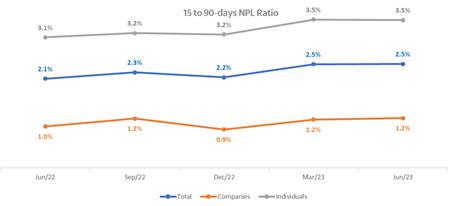
We calculate our 15 to 90 days non-performing
loan ratio as the value of our 15 to 90 days NPL to our loan portfolio. The 15 to 90 days NPL ratio is an indicator of early delinquency.
As of June 30, 2023, our 15 to 90 days
NPL ratio was 2.5%, an increase of 40 basis points when compared to June 30, 2022. During this period our 15 to 90-day NPL ratio increased
by 40 basis points in the 15 to 90-day NPL ratio of our individuals loan portfolio, which is returning to its pre-pandemic levels, mainly
due to higher delinquency rates, and increased by 20 basis points in respect of our companies loan portfolio, as of June 30, 2023 compared
to June 30, 2022.
The chart below shows a comparison of
both NPL ratios for each quarter as of June 30, 2022, through June 30, 2023:
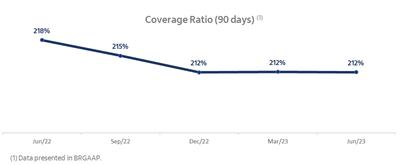
Coverage ratio (90 days): We calculate
our coverage ratio as provisions for expected losses to 90-day non-performing loans. As of June 30, 2023, our coverage ratio in accordance
with accounting practices adopted in Brazil applicable to institutions authorized to operate by the Central Bank, or BRGAAP, was 212%
compared to a ratio of 218% as of June 30, 2022. This decrease was mainly due to an increase in 90-day NPL, concentrated in the individuals
segment in Brazil and driven by the growth of our loan portfolio, especially in the Retail Business segment.
The chart below shows a comparison in
the coverage ratios for each quarter as of June 30, 2022, through June 30, 2023:
Other Operating Income
(Expenses) increased by 8.7% to an expense of R$41,000 million for the six-month period ended June 30, 2023, from an expense of R$37,722
million for the same period of 2022. This increase was mainly due to the R$3,069 million, or 9.2%, increase in our general and administrative
expenses for the six-month period ended June 30, 2023. This increase was due to: (i) the effects of our annual collective wage agreement;
(ii) the increase in profit sharing expenses; (iii) higher expenses with data processing and telecommunications; and (iv) higher expenses
with depreciation and amortization.
Please see “Note
23 – General and Administrative Expenses” to our audited interim consolidated financial statements for further details.
Current and deferred
income and social contribution taxes amounted to an expense of R$2,681 million for the six-month period ended June 30, 2023, from
an expense of R$4,492 million in the six-month period ended June 30, 2022, mainly driven by the increase in the average annualized long-term
interest rate, or TJLP, from 6.45% in the six-month period ended June 30, 2022 to 7.325% in the same period of 2023.
Please see “Note 24 –
Taxes” to our audited interim consolidated financial statements for further details.
Basis for Presentation of Segment Information
We maintain segment information
based on reports used by senior management to assess the financial performance of our businesses and to make decisions regarding the allocation
of funds for investment and other purposes.
Segment information is
not prepared in accordance with IFRS issued by the IASB but based on BRGAAP. It also includes the following adjustments: (i) the recognition
of the impact of capital allocation using a proprietary model; (ii) the use of funding and cost of capital at market prices, using certain
managerial criteria; (iii) the exclusion or inclusion of extraordinary items from our results; and (iv) managerial adjustments and reclassifications
applied to allow us to review our business analyses from the management point of view.
Extraordinary items correspond
to relevant events (with a positive or negative accounting effect) identified in our results of operations for each relevant period. We
apply a historically consistent methodology (approved by our governance procedures) pursuant to which relevant events are either not related
to our core operations or are related to previous fiscal years. The provisions for restructuring are extraordinary items and, as such,
do not impact the results and analysis regarding our segment information below.
For more information on
our segments, see “Item 4. Information on the Company” in our 2022 Form 20-F and “Note 30 – Segment Information”
to our audited interim consolidated financial statements.
The table below sets forth
the summarized results from our operating segments for the six-month period ended June 30, 2023:
Summarized Consolidated Statement of Income
from January 1, 2023 to June 30, 2023(1) |
Retail
Business
(a) |
Wholesale Business
(b) |
Activities with the Market + Corporation
(c) |
Total
(a)+(b)+(c) |
Adjustments |
IFRS consolidated(2) |
| |
(In millions of R$) |
| Operating revenues |
47,644 |
26,466 |
2,167 |
76,277 |
(104) |
76,173 |
| Cost of Credit |
(16,462) |
(2,067) |
- |
(18,529) |
2,500 |
(16,029) |
| Claims |
(761) |
(7) |
- |
(768) |
768 |
- |
| Other operating income (expenses) |
(22,102) |
(9,983) |
(779) |
(32,864) |
(8,136) |
(41,000) |
| Income tax and social contribution |
(2,004) |
(4,247) |
(306) |
(6,557) |
3,876 |
(2,681) |
| Non-controlling interest in subsidiaries |
(19) |
(370) |
7 |
(382) |
(107) |
(489) |
| Net income |
6,296 |
9,792 |
1,089 |
17,177 |
(1,203) |
15,974 |
(1) The first three columns are our business segments. Additional information about each of our business segments can be found below under the headings "(a) Retail Business", "(b) Wholesale Business" and "(c) Activities with the Market + Corporation".
The adjustments column includes the following pro forma adjustments: (i) the recognition of the impact of capital allocation using a proprietary model; (ii) the use of funding and cost of capital at market prices, using certain managerial criteria; (iii) the exclusion of non-recurring events from our results; and (iv) the reclassification of the tax effects from hedging transactions we enter into for our investments abroad.
The IFRS consolidated column is the total result of our three segments plus adjustments.
(2) The IFRS Consolidated figures do not represent the sum of the parties because there are intercompany transactions that were eliminated only in the consolidated statements. Segments are assessed by top management, net of income and expenses between related parties. |
The following discussion should
be read in conjunction with our audited interim consolidated financial statements, especially “Note 30 – Segment Information.”
The adjustments column shown in this note shows the effects of the differences between the segmented results (substantially in accordance
with BRGAAP) and those calculated according to the principles adopted in our audited interim consolidated financial statements in IFRS
as issued by the IASB.
Six-month period ended June 30, 2023, compared
to the six-month period ended June 30, 2022:
This segment consists
of business with retail customers, account holders and non-account holders, individuals and legal entities, high income clients (Itaú
Uniclass and Personnalité) and the companies’ segment (microenterprises and small companies). It includes financing and credit
assignments made outside the branch network, in addition to credit cards and payroll loans.
The following table sets forth
our summarized consolidated statement of income with respect to our Retail Business segment for the six-month periods ended June 30, 2023,
and 2022:
| Summarized Consolidated Statement of Income - Retail Business |
For
the six-month period ended June 30, |
Variation
|
| 2023 |
2022 |
R$ million |
% |
| |
(In millions of R$) |
|
|
| Operating revenues |
47,644 |
43,550 |
4,094 |
9.4 |
| Interest margin |
29,315 |
26,184 |
3,131 |
12.0 |
| Non-interest income (1) |
18,329 |
17,366 |
963 |
5.5 |
| Cost of credit and claims |
(17,223) |
(14,644) |
(2,579) |
17.6 |
| Other operating income (expenses) |
(22,102) |
(21,060) |
(1,042) |
4.9 |
| Income tax and social contribution |
(2,004) |
(2,416) |
412 |
(17.0) |
| Non-controlling interest in subsidiaries |
(19) |
(31) |
12 |
(38.7) |
| Net income |
6,296 |
5,399 |
897 |
16.6 |
| (1) Non-interest income include: commissions and banking fees; income from insurance and private pension operations before claim and selling expenses and other revenues. |
Net income from
our Retail Business segment increased by 16.6%, to R$6,296 million for the six-month period ended June 30, 2023, from R$5,399 million
for the same period of 2022. These results are explained as follows:
Operating revenues: increased by R$4,094 million
for the six-month period ended June 30, 2023, compared to the same period of 2022, due to an increase of 12.0% in interest margin, as
a result of the increase in the Mix of Credit Products. Moreover, non-interest income increased by 5.5% in the six-month period ended
June 30, 2023, compared to the same period of 2022, driven by the increase in commissions and fees, as a result of the increase in acquiring
revenues, due to the higher transaction volume from credit cards and higher gains from “flex” products offered as part of
our merchant services (advance payment of card receivables by the acquirer), and of the increase in card-issuing activities due to higher
gains from interchange fees, driven by the increase in the transaction volume related to credit cards. Revenues from insurance also increased,
driven by the increase in earned premiums.
Cost of credit and claims increased by R$2,579
million for the six-month period ended June 30, 2023, compared to the same period of 2022, due to an increase in provisions for loan losses,
driven by the increased origination in consumer credit and unsecured credit products, the portfolio growth, and the increased in volume
of renegotiations.
Other operating income (expenses) increased
by R$1,042 million for the six-month period ended June 30, 2023, compared to the same period of 2022, mainly due to (i) higher personnel
expenses, as a result of our annual collective wage agreement and the higher profit sharing expenses; and (ii) higher administrative expenses,
due to the increase in expenses with data processing and telecommunications, and depreciation and amortization.
Income tax and social contribution for the Retail
Business segment, as well as for the Wholesale Business segment and Activities with the Market + Corporation segment, is calculated by
adopting the full income tax rate, net of the tax effect of any payment of interest on capital. The difference between the income tax
amount determined for each business segment and the effective income tax amount, as stated in our audited interim consolidated financial statements, is recorded under the Activities with
the Market + Corporation segment. As discussed above under “Net income attributable to owners of the parent company - Current and deferred income and social contribution taxes,” our current and
deferred income and social contribution taxes decreased mainly as a result of a decrease in income before tax and social contribution.
(b) Wholesale Business
This business segment
consists of products and services offered to middle-market companies, high net worth clients (Private Banking), and the operation of Latin
American units and Itaú BBA, which is the unit responsible for business with large companies and investment banking operations.
The following table sets forth
our summarized consolidated statement of income with respect to our Wholesale Business segment for the six-month periods ended June 30,
2023, and 2022:
| Summarized Consolidated Statement of Income - Wholesale Business |
For the six-month period ended
June 30, |
Variation
|
| 2023 |
2022 |
R$ million |
% |
| |
(In millions of R$) |
|
|
| Operating revenues |
26,466 |
23,072 |
3,394 |
14.7 |
| Interest margin |
19,418 |
15,756 |
3,662 |
23.2 |
| Non-interest income (1) |
7,048 |
7,316 |
(268) |
(3.7) |
| Cost of credit and claims |
(2,074) |
(584) |
(1,489) |
254.8 |
| Other operating income (expenses) |
(9,983) |
(9,192) |
(791) |
8.6 |
| Income tax and social contribution |
(4,247) |
(4,398) |
152 |
(3.5) |
| Non-controlling interest in subsidiaries |
(370) |
(502) |
133 |
(26.5) |
| Net income |
9,792 |
8,396 |
1,396 |
16.6 |
| (1) Non-interest income include: commissions and banking fees; income from insurance and private pension operations before claim and selling expenses and other revenues. |
Net income
from the Wholesale Business segment increased by 16.6%, to R$9,792 million for the six-month period ended June 30, 2023 from R$8,396 million
for the same period of 2022. These results are explained as follows:
Operating revenues: increased by R$3,394 million,
or 14.7%, for the six-month period ended June 30, 2023 compared to the same period of 2022, due to an increase of 23.2% in the interest
margin, driven by the higher margin of liabilities recorded during the period and the higher result from structured operations. The 3.7%
decrease in non-interest income was driven by lower volumes of economic advisory and brokerage services. As of June 30, 2023, we participated
in 89 local operations, which included debentures and promissory notes issuance, as well as securitization transactions, totaling R$22.1
billion, ranking first in volume and in number of operations pursuant to a ranking published by the Brazilian Financial and Capital Markets
Association (Associação Brasileira das Entidades dos Mercados Financeiro e de Capitais, or ANBIMA). In the equity
markets, we ranked first in number of operations, participating in seventeen operations (including Block Trades), and second in volume
with R$4.7 billion, both in Dealogic´s ranking, as of June 30, 2023. We also provided financial advisory services for fifteen M&A
transactions in Brazil, totaling R$14.8 billion. As of June 30, 2023, we were ranked second place in number of M&A deals and fourth
place in volume in Dealogic’s ranking.
Cost of credit and claims increased by R$1,489
million for the six-month period ended June 30, 2023 compared to the same period of 2022, due to the normalization
in the provision for loan losses in the Wholesale Business segment in Brazil.
Other operating income (expenses) decreased
by R$791 million for the six-month period ended June 30, 2023, compared to the same period of 2022, mainly due to the higher personnel
expenses as a result of the effects of the annual collective wage agreement, and the increase in administrative expenses due to higher
expenses with data processing and telecommunications, and depreciation and amortization.
Income tax and social contribution for
this business segment, as well as for the Retail Business and Activities with the Market + Corporation segments, is calculated by adopting
the full income tax rate, net of the tax effect of any payment of interest on capital. The difference between the income tax amount determined
for each segment and the effective income tax amount, as stated in our audited interim consolidated financial statements, is recorded
under the Activities with the Market + Corporation segment. As discussed above, our current and deferred income and social contribution
taxes increased mainly due to an increase in income before tax and social contribution.
(c) Activities
with the Market + Corporation
This segment consists
of results from capital surplus, subordinated debt surplus and the net balance of tax credits and debits. It also includes the financial
margin on market trading, treasury operating costs, and equity in earnings of companies not included in either of the other segments.
The following table sets forth
our summarized consolidated statement of income with respect to our Activities with the Market + Corporation segment for the six-month
periods ended June 30, 2023, and 2022:
| Summarized Consolidated Statement of Income - Activities with the Market + Corporation |
For
the six-month period ended June 30, |
Variation
|
| 2023 |
2022 |
R$ million |
% |
| |
(In millions of R$) |
|
|
| Operating revenues |
2,167 |
1,662 |
505 |
30.4 |
| Interest margin |
1,957 |
1,745 |
213 |
12.2 |
| Non-interest income (1) |
210 |
(83) |
294 |
(353.1) |
| Other operating income (expenses) |
(779) |
(103) |
(676) |
655.6 |
| Income tax and social contribution |
(306) |
(175) |
(131) |
74.8 |
| Non-controlling interest in subsidiaries |
7 |
(140) |
147 |
(105.1) |
| Net income |
1,089 |
1,244 |
(155) |
(12.5) |
| (1) Non-interest income include: commissions and banking fees; income from insurance and private pension operations before claim and selling expenses and other revenues. |
Net income
from the Activities with the Market + Corporation segment decreased by R$155 million, or 12.5%, for the six-month period ended June 30,
2023, compared to the same period of 2022. We recorded an increase of R$676 million in other operating income (expenses), due to the tax
benefit received in the six-month period ended June 30, 2022. This effect offsets the increase of R$505 million in operating revenues.
Income tax and social contribution for
this segment, as well as for the Retail Business and Wholesale Business segments, is calculated by adopting the full income tax rate,
net of the tax effect of any payment of interest on capital. The difference between the income tax amount determined for each segment
and the effective income tax amount, as stated in our audited interim consolidated financial statements, is recorded under the Activities
with the Market + Corporation segment. As discussed above,
our current and deferred income and social contribution taxes decreased mainly due to a decrease in income before tax and social contribution.
Balance Sheet
The table below sets forth
our summarized balance sheet as of June 30, 2023 and December 31, 2022. Please see our audited interim consolidated financial statements
for further details about our Consolidated Balance Sheet.
| Summarized Balance Sheet - Assets |
As of |
Variation |
| |
|
|
| June 30, 2023 |
December 31, 2022 |
R$ million |
% |
| |
|
|
(In millions of R$) |
|
|
| Cash |
30,636 |
35,381 |
(4,745) |
(13.4) |
| Financial assets at amortized cost |
1,606,250 |
1,578,789 |
27,461 |
1.7 |
| |
|
Compulsory deposits in the Central Bank of Brazil |
136,749 |
115,748 |
21,001 |
18.1 |
| |
|
Interbank deposits, securities purchased under agreements to resell and securities at amortized cost |
506,296 |
494,397 |
11,899 |
2.4 |
| |
|
Loan and lease operations portfolio |
901,185 |
909,422 |
(8,237) |
(0.9) |
| |
|
Other financial assets |
113,957 |
109,909 |
4,048 |
3.7 |
| |
|
(-) Provision for Expected Loss |
(51,937) |
(50,687) |
(1,250) |
2.5 |
| Financial assets at fair value through other comprehensive income |
134,347 |
126,748 |
7,599 |
6.0 |
| Financial assets at fair value through profit or loss |
541,074 |
464,682 |
76,392 |
16.4 |
| Insurance contracts, Investments in associates and join ventures, Fixed assets, Goodwill and Intangible assets and other assets |
59,544 |
55,821 |
3,723 |
6.7 |
| Tax assets |
62,357 |
59,645 |
2,712 |
4.5 |
| Total assets |
2,434,208 |
2,321,066 |
113,142 |
4.9 |
June 30, 2023, compared to December 31,
2022.
Total assets
increased by R$113,142 million, as of June 30, 2023, compared to December 31, 2022, mainly due to an increase in financial assets at fair
value through profit or loss and in financial assets at amortized cost. This result is further described below:
Financial assets at
amortized cost increased by R$27,461 million, or 1.7%, as of June 30, 2023, compared to December 31, 2022, mainly due to an increase
in compulsory deposits in the Central Bank of Brazil, interbank deposits, securities purchased under agreements to resell and securities
at amortized cost, and other financial assets.
Interbank deposits,
securities purchased under agreements to resell, securities at amortized cost increased by R$11,899 million, or 2.4%, as of June 30,
2023 compared to December 31, 2022, mainly due to an increase of R$22,985 million in securities, mainly in corporate securities, especially
in rural product notes (Cédula do Produtor Rural) and debentures, partially offset by decreases of: (i) R$8,237 in loan
and lease operations, mainly in foreign loans due to the exchange variation; and (ii) R$4,820 in securities purchased under agreements
to resell.
Please see “Note
4 - Interbank Deposits and Securities Purchased Under Agreements to Resell”, “Note 9 - Financial assets at amortized cost
– Securities”, and “Note 10 – Loan and lease operations” to our audited interim consolidated financial statements
for further details.
Loan and lease operations
portfolio decreased by R$8,237 million, or 0.9%, as of June 30, 2023, compared to December 31, 2022, mainly due to the decreases of
R$6,467 million in foreign loans – Latin America, due to the impact of exchange variation; and R$5,251 million in our corporate
portfolio. The increase of R$6,845 million in our individuals loan portfolio, was due to increases of R$5,657 million in mortgage loans;
and R$5,236 million in personal loans; which were partially offset by the seasonal decrease of R$6,452 million in credit cards as holders
tend to use their cards less in the first quarter.
| Loan and Lease Operations, by asset type |
As of |
Variation |
| |
|
|
| June 30, 2023 |
December 31, 2022 |
R$ million |
% |
| |
(In millions of R$) |
|
|
| Individuals |
406,948 |
400,103 |
6,845 |
1.7 |
| Credit card |
129,403 |
135,855 |
(6,452) |
(4.7) |
| Personal loan |
59,181 |
53,945 |
5,236 |
9.7 |
| Payroll loans |
75,203 |
73,633 |
1,570 |
2.1 |
| Vehicles |
32,440 |
31,606 |
834 |
2.6 |
| Mortgage loans |
110,721 |
105,064 |
5,657 |
5.4 |
| Corporate |
134,017 |
139,268 |
(5,251) |
(3.8) |
| Micro/Small and Medium Businesses |
161,532 |
164,896 |
(3,364) |
(2.0) |
| Foreign Loans Latin America |
198,688 |
205,155 |
(6,467) |
(3.2) |
| Total Loan operations and lease operations portfolio |
901,185 |
909,422 |
(8,237) |
(0.9) |
Please see “Note
10 – Loan and Lease Operations” to our audited interim consolidated financial statements for further details.
The table below sets forth
our summarized balance sheet – liabilities and stockholders’ equity as of June 30, 2023 and December 31, 2022. Please see
our audited interim consolidated financial statements for further details about our Consolidated Balance Sheet.
| Summarized Balance Sheet - Liabilities and Stockholders' Equity |
As of |
Variation |
| |
| June 30, 2023 |
December 31, 2022 |
R$ million |
% |
| |
|
|
(In millions of R$) |
|
|
| Financial Liabilities |
1,912,522 |
1,836,690 |
75,832 |
4.1 |
| |
At Amortized Cost |
1,840,419 |
1,755,498 |
84,921 |
4.8 |
| |
|
Deposits |
923,281 |
871,438 |
51,843 |
5.9 |
| |
|
Securities sold under repurchase agreements |
319,099 |
293,440 |
25,659 |
8.7 |
| |
|
Interbank market funds, Institutional market funds and other financial liabilities |
598,039 |
590,620 |
7,419 |
1.3 |
| |
At Fair Value Through Profit or Loss |
68,231 |
77,508 |
(9,277) |
(12.0) |
| |
Provision for Expected Loss |
3,872 |
3,684 |
188 |
5.1 |
| Insurance contracts and private pension |
249,769 |
233,126 |
16,643 |
7.1 |
| Provisions |
20,140 |
19,475 |
665 |
3.4 |
| Tax liabilities |
7,360 |
6,773 |
587 |
8.7 |
| Other liabilities |
55,476 |
47,895 |
7,581 |
15.8 |
| Total liabilities |
2,245,267 |
2,143,959 |
101,308 |
4.7 |
| Total stockholders’ equity attributed to the owners of the parent company |
178,853 |
167,717 |
11,136 |
6.6 |
| Non-controlling interests |
10,088 |
9,390 |
698 |
7.4 |
| Total stockholders’ equity |
188,941 |
177,107 |
11,834 |
6.7 |
| Total liabilities and stockholders' equity |
2,434,208 |
2,321,066 |
113,142 |
4.9 |
Total liabilities
and stockholders’ equity increased by R$113,142 million, as of June 30, 2023, compared to December 31, 2022, mainly due
to an increase in financial liabilities at amortized cost. These results are detailed as follows:
Deposits increased
by R$51,843 million, or 5.9%, as of June 30, 2023, compared to December 31, 2022, mainly due to an increase of R$56,008 million in time
deposits, due to the commercial strategy to focus on this product in the Retail Business segment and higher demand
for fixed income products.
Please see “Note
15 – Deposits” to our audited interim consolidated financial statements for further details.
Securities sold under
repurchase agreements increased by R$25,659 million, or 8.7%, as of June 30, 2023 compared to December 31, 2022, mainly due to an
increase of R$49,063 million in government securities, partially offset by a decrease of R$22,622 million in assets received as collateral.
Please see “Note
17 – Securities Sold Under Repurchase Agreements and Interbank and Institutional Market Funds” to our audited interim consolidated
financial statements for further details.
Interbank market funds,
institutional market funds and other financial liabilities increased by R$7,419 million, or 1.3%, as of June 30, 2023 compared to
December 31, 2022, mainly due to an increase of R$23,795 million in interbank market funds, offset by decreases of R$10,693 million in
institutional market funds and R$5,683 million in other financial liabilities.
Please see “Note
17 – Securities Sold Under Repurchase Agreements and Interbank and Institutional Market Funds” and “Note 18 –
Other assets and liabilities” to our audited interim consolidated financial statements for further details.
Insurance contracts
and private pension increased by R$16,643 million, or 7.1%, as of June 30, 2023 compared to December 31, 2022, mainly due to the update
of standard private pension contracts known as PGBL and VGBL.
Capital Management
Capital Adequacy
Through our Internal Capital
Adequacy Assessment Process, or ICAAP, we assess the adequacy of our capital to face the risks to which we are subject. For ICAAP, capital
is composed of regulatory capital for credit, market and operational risks, and by the necessary capital to cover other risks.
In order to ensure our capital
soundness and availability to support business growth, we maintain capital levels above the minimum requirements, according to the Common
Equity Tier I, Additional Tier I Capital, and Tier II minimum ratios.
Our Total Capital, Tier I Capital
and Common Equity Tier I Capital ratios are calculated on a consolidated basis, applied to institutions included in our Prudential Conglomerate
which comprises not only financial institutions but also consortium administrators (administradoras de consórcio), payment
institutions, factoring companies or companies that directly or indirectly assume credit risk, and investment funds in which our Itaú
Unibanco Group retains substantially all risks and rewards.
| |
As of June 30, |
As of December 31, |
| |
2023 |
2022 |
| |
(In R$ million, except percentages) |
| Available capital (amounts) |
|
|
| Common Equity Tier I (CET I) |
155,372 |
147,781 |
| Tier I |
173,670 |
166,868 |
| Total capital |
192,828 |
185,415 |
| Risk-weighted assets (amounts) |
|
|
| Total risk-weighted assets (RWA) |
1,274,840 |
1,238,582 |
| Risk-based capital ratios as a percentage of RWA |
|
|
| Common Equity Tier I ratio (%) |
12.20% |
11.90% |
| Tier I ratio (%) |
13.60% |
13.50% |
| Total capital ratio (%) |
15.10% |
15.00% |
| Additional CET I buffer requirements as a percentage of RWA |
|
|
| Capital conservation buffer requirement (%) |
2.50% |
2.50% |
| Countercyclical buffer requirement (%) (1) |
0.00% |
0.00% |
| Bank G-SIB and/or D-SIB additional requirements (%) |
1.00% |
1.00% |
| Total of bank CET I specific buffer requirements (%) |
3.50% |
3.50% |
(1) The countercyclical capital buffer is fixed by the Financial Stability Committee and currently is set to zero.
|
As of June 30, 2023, our Total Capital
reached R$192,828 million, an increase of R$7,413 million compared to December 31, 2022. Our Basel Ratio (calculated as the ratio between
our Total Capital and the total amount of Risk Weighted Assets, or RWA) reached 15.1%, an increase of 10 basis points due to the result
of the period and prudential and equity adjustments, partially offset by the increase of Risk-Weighted Assets.
Additionally, the Fixed Asset Ratio
(Índice de Imobilização) indicates the level of total capital committed to adjusted permanent assets. Itaú
Unibanco Holding is within the maximum limit of 50% of total adjusted capital, as established by the Central Bank. On June 30, 2023, our
Fixed Asset Ratio reached 20%, which represents a buffer of R$57,779 million.
| |
Three-month period ended, |
| Liquidity Coverage Ratio |
June 30, 2023 |
December 31,2022 |
| Total Weighted Value (average) |
| |
(In millions of R$) |
| Total High Liquidity Assets (HQLA)1 |
355,222 |
325,269 |
| Cash Outflows2 |
368,049 |
361,902 |
| Cash Inflows3 |
170,357 |
164,104 |
| Total Net Cash Outflows |
197,692 |
197,798 |
| LCR% |
179.7% |
164.4% |
| (1) High Quality Liquidity Assets correspond to inventories, in some cases weighted by a discount factor, of assets that remain liquid in the market even in periods of stress, that can easily be converted into cash and that are classified as low risk. |
| (2) Outflows — total potential cash outflows for a 30-day horizon, calculated for a standard stress scenario as defined by BACEN Circular 3,749. |
| (3) Inflows — total potential cash inflows for a 30-day horizon, calculated for a standard stress scenario as defined by BACEN Circular 3,749. |
Our Tier I ratio reached 13.6%, as
of June 30, 2023, an increase of 10 basis points compared to March 31, 2023, due to the result of the period, partially offset by the
increase in Risk-Weighted Assets. Considering the regulatory changes, the Tier I Capital ratio Pro Forma would have reached 14.7%.
Please see “Note 32 – Risk
and Capital Management” of our audited interim consolidated financial statements for further details about regulatory capital.
Liquidity Ratios
The Basel III Framework introduced
global liquidity standards, providing for minimum liquidity requirements and aims to ensure that banks can rely on their own sources of
liquidity, leaving central banks as a lender of last resort. Basel III provides for two liquidity ratios to ensure that financial institutions
have sufficient liquidity to meet their short-term and long-term obligations: (i) the liquidity coverage ratio, or LCR, and (ii) the net
stable funding ratio, or NSFR.
We believe that the LCR and
NSFR provide more relevant information than an analysis of summarized cash flows.
We present below a discussion
of our LCR for the average of the three-month period ended on June 30, 2023, and NSFR as of June 30, 2023.
Liquidity Coverage Ratio
The LCR measures the short-term resistance
of a bank’s liquidity risk profile. It is the ratio of the stock of high-quality liquid assets to expected net cash outflows over
the next 30 days, assuming a scenario of idiosyncratic or systemic liquidity stress.
We calculate our LCR according to
the methodology established in Central Bank Circular No. 3,749/2015. We measure our total high liquidity assets for the end of each period
to cash outflows and inflows as the daily average value for each period. Pursuant to Central Bank regulations, effective as of January
1, 2019, the minimum LCR is 100%.
| |
Three-month period ended, |
| Liquidity Coverage Ratio |
June 30, 2023 |
December 31,2022 |
| Total Weighted Value (average) |
| |
(In millions of R$) |
| Total High Liquidity Assets (HQLA)1 |
355,222 |
325,269 |
| Cash Outflows2 |
368,049 |
361,902 |
| Cash Inflows3 |
170,357 |
164,104 |
| Total Net Cash Outflows |
197,692 |
197,798 |
| LCR% |
179.7% |
164.4% |
| (1) High Quality Liquidity Assets correspond to inventories, in some cases weighted by a discount factor, of assets that remain liquid in the market even in periods of stress, that can easily be converted into cash and that are classified as low risk. |
| (2) Outflows — total potential cash outflows for a 30-day horizon, calculated for a standard stress scenario as defined by BACEN Circular 3,749. |
| (3) Inflows — total potential cash inflows for a 30-day horizon, calculated for a standard stress scenario as defined by BACEN Circular 3,749. |
Our average LCR as of June 30,
2023 was 179.7% and, accordingly, above Central Bank requirements.
Net Stable Funding Ratio
The NSFR measures long-term liquidity
risk. It is the ratio of available stable funding to required stable funding over a one-year time period, assuming a stressed scenario.
We calculate our NSFR according to
the methodology established in Central Bank Circular No. 3,869/2017. The NSFR corresponds to the ratio of our available stable funds for
the end of each period (recursos estáveis disponíveis, or ASF) to our required stable funds for the end of each period
(recursos estáveis requeridos, or RSF).
Pursuant to Central Bank regulations, effective as of October
1, 2018, the minimum NSFR is 100%.
| |
As of June 30, |
As of December 31, |
| Net Stable Funding Ratio |
2023 |
2022 |
| Total Ajusted Value |
| |
(In millions of R$) |
| Total Available Stable Funding (ASF)¹ |
1,216,666 |
1,151,750 |
| Total Required Stable Funding (RSF)² |
951,168 |
922,395 |
| NSFR (%) |
127.9% |
124.9% |
| (1) ASF – Available Stable Funding – refers to liabilities and equity weighted by a discount factor according to their stability, pursuant to Central Bank Circular 3,869/2017. |
| (2) RSF – Required Stable Funding – refers to assets and off-balance exposures weighted by a discount factor to their necessity, pursuant to Central Bank Circular 3,869/2017. |
As of June 30, 2023, our ASF
totaled R$1,216.7 billion, mainly due to capital and Retail Business and Wholesale Business funding, and our RSF totaled R$951.2 billion,
particularly due to loans and financings with Wholesale Business and Retail Business customers, central governments and transactions with
central banks.
As of June 30, 2023, our NSFR
was 127.9% and, accordingly, above Central Bank requirements.
Liquidity and Capital Resources
We define our consolidated group
operational liquidity reserve as the total amount of assets that can be rapidly turned into cash, based on local market practices and
legal restrictions. The operational liquidity reserve generally includes: (i) cash and deposits on demand, (ii) funded positions of securities
purchased under agreements to resell and (iii) unencumbered government securities.
The following table presents
our operational liquidity reserve as of June 30, 2023 and 2022:
| Operational Liquidity Reserve |
As of June 30, |
2023 Average Balance(1) |
| 2023 |
2022 |
| |
(In millions of R$) |
|
| Cash |
30,636 |
33,839 |
33,653 |
| Securities purchased under agreements to resell – Funded position (2) |
58,798 |
57,892 |
55,148 |
| Unencumbered government securities (3) |
199,180 |
157,054 |
182,816 |
| Operational reserve |
288,614 |
248,785 |
271,617 |
| (1) Average calculated based on audited interim financial statements. |
|
|
|
| (2) Net of R$ 7.915 (R$ 4.768 at 06/30/2022), which securities are restricted to guarantee transactions at B3 S.A.—Brasil, Bolsa Balcão (B3) and the Central Bank. |
| (3) Present values are included as a result of the change in the reporting of future flows of assets that are now reported as future value as of September 2016. |
Our main sources of funding
are interest-bearing deposits, deposits received under repurchase agreements, on lending from government financial institutions, lines
of credit with foreign banks and the issuance of securities abroad.
Please see “Note
15 – Deposits” to our audited interim consolidated financial statements for further details about funding.
Capital Expenditures
In accordance with our practice in
the last few years, our capital expenditures in the six-month period ended June 30, 2023, were funded with internal resources. We cannot
provide assurance that we will make capital expenditures in the future and, if made, that the amounts
will correspond to the current estimates. The table below presents our capital expenditures for the six-month period ended June 30, 2023,
and for the year ended December 31, 2022:
| |
Six-month period ended |
For the year ended |
| Capital Expenditures |
June 30, 2023 |
December 31, 2022 |
| (In millions of R$, except percentages) |
| Fixed Assets |
973 |
2,727 |
| Fixed assets under construction |
457 |
905 |
| Land and buildings |
0 |
8 |
| Improvements |
39 |
56 |
| Installations, furniture and data processing equipment |
454 |
1,710 |
| Other |
23 |
48 |
| Intangible Assets |
2,999 |
5,768 |
| Goodwill |
603 |
0 |
| Software acquired or internally developed |
2,124 |
4,727 |
| Other intangibles |
272 |
1,041 |
| Total |
3,972 |
8,495 |
Please see “Note
13 – Fixed Assets” and “Note 14 – Goodwill and Intangible Assets” to our audited interim consolidated financial
statements for details about our capital expenditures.
Capitalization
The table below presents
our capitalization as of June 30, 2023. The information described is derived from our audited interim consolidated financial statements
as of and for the six-month period ended June 30, 2023. As of the date of this Form 6-K, there has been no material change in our capitalization
since June 30, 2023.
| Capitalization |
For the six-month period ended June 30, 2023 |
| R$ |
US$ (1) |
| |
(In millions, except percentages) |
| Current liabilities |
|
|
| Deposits |
430,808 |
89,398 |
| Securities sold under repurchase agreements |
268,430 |
55,702 |
| Structured notes |
- |
- |
| Derivatives |
34,728 |
7,206 |
| Interbank market funds |
155,437 |
32,255 |
| Institutional market funds |
9,829 |
2,040 |
| Other financial liabilities |
157,367 |
32,656 |
| lnsurance contracts and private pension |
462 |
96 |
| Provisions |
6,531 |
1,355 |
| Tax liabilities |
2,826 |
586 |
| Other Non-financial liabilities |
50,843 |
10,550 |
| Total |
1,117,261 |
231,845 |
| Long-term liabilities |
|
|
| Deposits |
492,473 |
102,194 |
| Securities sold under repurchase agreements |
50,669 |
10,514 |
| Structured notes |
86 |
18 |
| Derivatives |
32,598 |
6,764 |
| Interbank market funds |
162,945 |
33,813 |
| Institutional market funds |
108,860 |
22,590 |
| Other financial liabilities |
4,420 |
917 |
| lnsurance contracts and private pension |
249,307 |
51,734 |
| Provision for Expected Loss |
3,872 |
803 |
| Provisions |
13,609 |
2,824 |
| Tax liabilities |
4,040 |
838 |
| Other Non-financial liabilities |
4,634 |
962 |
| Total |
1,127,512 |
233,972 |
| Income tax and social contribution - deferred |
494 |
103 |
| Non-controlling interests |
10,088 |
2,093 |
| Stockholders’ equity attributed to the owners of the parent company (2) |
178,853 |
37,114 |
| Total capitalization (3) |
2,434,208 |
505,127 |
| BIS ratio (4) |
15.1% |
|
| (1) Convenience translation at 4.819 reais per U.S. dollar, the exchange rate in effect on June 30, 2023. |
|
|
| (2) Itaú Unibanco Holding’s authorized and outstanding share capital consists of 4,958,290,359 common shares and 4,841,653,914 preferred shares, all of which are fully paid. For more information regarding our share capital see Note 19 to our audited consolidated financial statements as of and for the period ended June 30, 2023. |
| (3) Total capitalization corresponds to the sum of total current liabilities, long-term liabilities, deferred income, minority interest in subsidiaries and stockholders’ equity. |
| (4) Calculated by dividing total regulatory capital by risk weight assets. |
Off-Balance Sheet Arrangements
We do not have any off-balance
sheet arrangements, other than the guarantees, financial guarantees, commitments to be released, letters of credit to be released and
contractual commitments that are described in “Note 13 – Fixed assets,” “Note 14 – Goodwill and Intangible
assets,” “Note 32 – Risk and Capital Management, I.I – Collateral and policies for mitigating credit risk”
and “Note 32 – Risk and Capital Management – I.IV – Maximum Exposure of Financial Assets to Credit Risk”
to our audited interim consolidated financial statements.
REGULATORY RECENT DEVELOPMENTS
We are subject to the regulation and
supervision of various regulatory entities in the segments we operate. The supervision of these entities is essential to the structure
of our business and directly impacts our growth strategies. Our 2022 Form 20-F contains disclosure of the regulations and supervision
of various regulatory entities to which we are subject in “Item 4B. Business Overview - Supervision and Regulation.”
We describe below the material regulatory
developments applicable to us that took place during the six-month period ended June 30, 2023 and through the date of this Form 6-K.
Central Bank regulates partnerships and outsourcing
services established within PIX
On February 17, 2023, the Central
Bank published Resolution No. 293, which establishes additional rules for partnerships and outsourcing arrangements established within
PIX (Central Bank’s instant payments system) by market participants, which were previously defined in Central Bank Resolution No.
269, issued on December 1, 2022. Both rules amended Central Bank Resolution No. 1, which establishes the regulations for the PIX payment
scheme.
Central Bank Resolution No. 269, among
other amendments, introduced the definition of “partnerships” within the PIX scheme as a commercial relationship between two
or more institutions directly participating in the PIX scheme and “outsourcing” as a relationship between a participating
institution and a non-participating private agent. Central Bank Resolution No. 269 also explicitly prohibits PIX related outsourcing arrangements
in two cases: (i) when the third party offers transactional accounts (i.e., current or payment accounts, among other types as defined
by Central Bank Resolution No. 1, of 2020, which establishes the PIX regulations); and (ii) when the third party does not hold a transactional
account but initiates payment transactions through an account provided by a participating institution.
The first type of outsourcing is expressly
forbidden because the agent that holds a transactional account and wishes to offer PIX to its customers must necessarily be a PIX participant,
going through the adhesion process, which includes the performance of software homologation tests and the evaluation of the requirements
for user experience, rather than relying on another direct PIX participant to offer PIX transactions to its client-base.
Through Resolution No. 293, the Central
Bank defined a transition regime for institutions that implemented the first type of restricted outsourcing arrangement, applicable to
institutions with agreements in effect as of December 1, 2022, provided they submit a request to join the PIX scheme as a direct participant
by May 31, 2023. With the transition regime, such agents may, exceptionally, maintain the PIX offering to their clients through an outsourcing
arrangement executed with a PIX participant for the duration of the adhesion process.
Regarding the second type, the rule
simply reiterates the regulatory impediment that payment initiation service providers, or PISPs, carry out their activities without the
required authorization to operate from the Central Bank and mandatory participation in Open Finance.
The changes introduced by Central
Bank Resolution No. 269 mentioned herein, as well as the entirety of Central Bank Resolution No. 293, entered into effect on March 1,
2023.
Central Bank improves implementation requirements
to the Open Finance process
On February 27, 2023, the Central
Bank published Resolution No. 294, which amended Central Bank Resolution No. 32, of October 29, 2020, and established technical requirements
and operational procedures for the Open Finance implementation in Brazil. The main change introduced by the new rule is related to the
scope of the monitoring function assigned to the governance structure responsible for implementing Open Finance.
The rule also improves definitions
regarding the directory of Open Finance participants and the responsibility for managing their information, formally establishing the
need for prior consent from the Central Bank in case of exclusion of a participating institution from the ecosystem or exclusion of a
participation modality.
On the same date, the Central Bank
also published Resolution No. 295, which exempts from mandatory participation in the Open Finance ecosystem institutions that (i) do not
hold accounts that can be freely used by their clients through electronic channels; (ii) do not have individuals, microentrepreneurs and
small companies as clients, as defined in Supplementary Law No. 123, of December 13, 2006; (iii) offer unblocked accounts (contas de
livre movimentação) only to a specific and limited set of individual clients, such as their own employees, and other
cases in which their participation is not able to bring customers significant benefits in the light of the objectives and principles of
Open Finance; or (iv) provide their clients with access to electronic channels to operate their accounts only in contingency situations.
Unlike the previous criteria of exemption,
which was automatic, the Open Finance participation waivers introduced by Resolution No. 295 will require prior approval by the Central
Bank.
Resolutions Nos. 294 and 295 entered
into effect on April 1, 2023.
Central Bank establishes guidelines for acceptance
of Bank Credit Certificates as collateral for the issuance of Financial Liquidity Lines
On March 3, 2023, the Central Bank
defined basic guidelines, through Central Bank Vote No. 40/2023, for the acceptance of Bank Credit Certificates (Cédulas de
Crédito Bancário, or CCBs) as eligible collateral in the context of the issuance of Financial Liquidity Lines (Linhas
Financeiras de Liquidez, or LFL) by the Central Bank.
The LFL were established by the Central
Bank in 2021, as a structural measure to improve its operational framework for the purposes of supplying liquidity to the National Financial
System, whether in response to market-wide dysfunctions or specific problems in some institutions. Currently, the only assets eligible
to be offered as collateral are debentures and commercial certificates.
The definition of guidelines, approved
by Central Bank Vote No. 40/2023, aims to direct and coordinate the market for the developments necessary for effective operation as of
the first quarter of 2024. In summary, book-entry and notarial CCBs deposited in Central Depositaries of financial assets will be eligible
as collateral for LFLs. The admissibility rules will be similar to those of the Special Temporary Liquidity Line for the Acquisition of
Financial Bills Guaranteed by Financial Assets (Linha Temporária Especial de Liquidez para Aquisição de Letra
Financeira com Garantia em Ativos Financeiros, or LTEL-LFG), whose criteria will be determined based on the information provided by
the Credit Information System (Sistema de Informações de Crédito, or SCR). The Central Bank will also define
the eligible modalities of credit and the phasing in of the production of these modalities.
The incorporation of CCBs as eligible
collateral assets in the LFL is a structural measure in the LFL evolution agenda. With the evolution, the Central Bank will seek to deepen
the use of the LFL to allow the structural reduction of compulsory deposits. These changes are expected to be implemented in the first
quarter of 2024.
Central Bank announces guidelines for the pilot project
of its digital currency, the “Real Digital,” or DREX
On March 6, 2023, the Central Bank
reviewed the guidelines applicable to its proposed digital currency, the Real Digital, through Vote No. 31/2023.
Some relevant guidelines applicable
to the project include (i) that tokenized assets will follow their respective regulatory regimes, so as not to generate asymmetry between
the current and tokenized forms of these assets; (ii) the emphasis on the design of a distributed ledger technology, or DLT, that enables
the registration of assets of various natures and the incorporation of technologies with smart contracts and programmable currency; and
(iii) total adherence to the regulations concerning secrecy, data protection, and anti-money laundering.
In line with the updated guidelines,
the pilot project began in March 2023, with the first tests of a platform for operations with the “Real Digital”, a collaborative
environment for testing and developing of the solution.
Additionally, on April 27, 2023, the
Central Bank issued Resolution No. 315, which establishes formal rules applicable to the pilot project of the “Real Digital”
and institutes the Executive Management Committee of the “Real Digital” platform.
Pursuant to Resolution No. 315, the
number of participants in the pilot project is limited to up to 10 institutions subject to Central Bank supervision, such as us, selected
according to criteria and procedures set forth in the regulation. The Executive Committee received proposals from entities interested
in participating in the pilot project. The rule also provides that the Executive Committee of the pilot project could expand the list
of selected participants to up to 20 candidates, if necessary. Institutions authorized to operate by the Central Bank that necessarily
have the capacity to test, based on their corresponding business model, transactions involving the issuance, redemption or transfer of
financial assets, as well as executing the simulation of financial flows resulting from trading events, when applicable to financial assets subject to the test, were allowed
to participate in the pilot project. On May 24, 2023, the regulator disclosed a list of 14 selected participants, which included us. Adhesion
will be formalized through the execution of a Term of Participation and the submission of a proposal to the Central Bank. The Central
Bank will begin incorporating participants into the Real Digital Pilot platform by mid-June 2023.
Resolution No. 315 also establishes
that, during the conduction of the pilot project, a forum will be created for the exchange of information and adequate orientation of
the expectations in relation to the development of the “Real Digital” platform and the proposed tests.
Central Bank Resolution No. 315 entered
into effect on April 28, 2023.
Additionally, on August 7, 2023, the
Central Bank announced “DREX” as the official name of its digital currency.
Central Bank approves changes in the local rules applicable
internal ratings-based approach for credit risks established in Basel III
On March 16, 2023, the Central Bank
issued Resolution No. 303, which provides for changes in the calculation of the capital requirement related to credit risk exposures calculated
through the internal ratings-based, or IRB, approach (RWACIRB). This new rule is in accordance with the best practice recommendations
of the Basel Committee on Banking Supervision, or BCBS, inserted in the set of recommendations known as "Basel III" and will
replace Central Bank Circular No. 3,648, issued on March 4, 2013.
The Central Bank expects that the
new framework of IRB approaches will be more robust and limit the variability of the capital requirement among the institutions that eventually
adopt them. To this end, Resolution No. 303 introduces limits for some parameters, reduces the set of portfolios eligible to the IRB approaches
and introduces several improvements to the applicable prudential regulation, including flexibility in the application process for the
use of the IRB approaches, which now allows partial adoption by the institution, for specific portfolios.
The rule is applicable to financial
institutions classified in segments S1, such as us, and S2, according to classifications issued by the Central Bank for the purposes of
the proportional application of prudential regulation according to systemic risk. Currently, none of the institutions included in these
segments, including us, uses IRB approaches, whose adoption is optional and subject to prior approval by the Central Bank.
Resolution No. 303 entered into effect
on July 1, 2023.
Central Bank introduces changes to the Pillar 3 Report
On March 23, 2023, the Central Bank
issued Resolution No. 306, in order to alter several prudential rules to include in their scope of application regulatory conglomerates
(conglomerados prudenciais) led by payment institutions.
Among such adjustments, this rule
also updated Central Bank Resolution No. 54, issued on December 16, 2020, which establishes the disclosure of Pillar 3 report and is applicable
to regulatory conglomerates led by financial institutions, such as ours.
Among other changes, two new topic
sections were included in the Pillar 3 report. The first deals with the comparison between the RWA, amounts calculated through the standard
approach and through the IRB approaches, and the second with the disclosure of information related to assets subject to any impediment
or restriction of negotiation due to a legal, regulatory, statutory or contractual aspect.
Resolution No. 306 entered into effect
on July 1, 2023.
Central Bank issues regulations on the registration
and centralized deposit of real estate receivables
On March 28, 2023, the Central Bank
issued Resolution No. 308, which regulates the activities of registration and centralized deposit of real estate receivables
associated with real estate projects.
The intention is to enable, at the
discretion of the market participants, the use of the services provided by the registering entities and central depositaries and the structure
of the systems managed by these institutions improve the management process of real estate receivables and the broader and more transparent
access to the receivables agendas by potential financiers, which could contribute to the access to better credit conditions for developers
and subdivision owners.
The rule also details the procedures
applicable to registration entities and central depositaries so they may obtain a specific authorization from the Central Bank to operate
with real estate receivables.
Resolution No. 308 came into effect
on May 2, 2023, although provisions regarding interoperability between different registration entities and central depositaries have a
specific implementation schedule.
Central Bank issues new rule on accounting standards
On March 28, 2023, the Central Bank
issued Resolution No. 309, in accordance with the recent efforts from the regulator to adjust the accounting standard for institutions
regulated by the Central Bank in line with international pronouncement “IFRS 9 – Financial Instruments” issued by the
IASB, applying to the individual statements of financial institutions operating in Brazil. These concepts have already been applied to
consolidated financial statements.
This new rule establishes accounting
procedures to (i) define the components of financial instruments which constitute payments of principal and interest on the principal
value for the purposes of classification of financial assets; (ii) define the methodology for determining the effective interest rate
of financial instruments; (iii) establish parameters to measure the expected loss associated with credit risk, including for setting minimum
levels of allowance for expected losses associated with credit risk; and (iv) detail the information on financial instruments to be disclosed
in explanatory notes.
Accordingly, the changes provided
aim to introduce a methodology for determining the effective interest rate of financial instruments that reflect the actual rate of return
on these instruments in the financial statements, as well as provide new parameters for constituting an allowance for expected losses
associated with the credit risk of financial instruments, which, for the purposes of Resolution No. 309, has the loss incurred as one
of its components.
Resolution No. 309 will enter into
effect on January 1, 2025.
CMN overhauls the regulatory regime applicable to
credit derivatives
On April 20, 2023, the National Monetary
Council, or CMN, issued Resolution No. 5,070, which overhauled the rules governing the performance of credit derivative operations by
financial institutions and other institutions authorized to operate by the Central Bank. Through the new resolution, the CMN seeks to
adapt Brazilian regulations to the innumerous changes the market has undergone internationally since the publication of the previous rule
applicable to such operations, CMN Resolution No. 2,933, in 2002.
The new rules have been studied by
the Central Bank since 2015 and incorporate several suggestions from interested market participants, which contributed to the final format
of the regulation through Public Consultation No. 84 in 2021.
The regulation considers two types
of credit derivative: the credit default swap, or CDS, and the total return swap, or TRS. In both types, the counterparty defined in the
rule as the receiver of the risk sells protection against the credit risk of one or more reference entities to the counterparty defined
as transferring the risk.
Additionally, the main changes provided
in the new regulation include: (i) the updating of the list of institutions able to act as a counterparty receiving credit risk in transactions
carried out with financial institutions, which now incorporates non-financial entities (such as insurance companies, pension entities
and investment funds, among others), provided that they meet the requirements established by the Brazilian Securities Commission (Comissão
de Valores Mobiliários, or CVM)to be classified
as a professional investor; (ii) the possibility of specifying credit indices, asset indices, baskets or reference portfolios as reference
entities and obligations of the credit derivatives; (iii) the permission for the performance of credit derivatives with financial flows
denominated or referenced in currency or price indices other than those denominating or indexing the reference obligation; (iv) the permission
for credit derivatives to have reference obligations of lower liquidity, as long as their pricing methodology complies with the rules
contained in the regulatory framework applicable to derivatives; (v) the expansion of the list of institutions able to act as suppliers
of quoted values for the reference obligations, including regulatory or self-regulatory entities and international trading platforms;
and (vi) flexibilization of the requirement for maintaining ownership of the reference obligation by the counterparty transferring the
risk, which will now be mandatory only in cases where the reference obligation is one or more credit or leasing transactions.
The new rule also established several
formal adjustments, updating defined terms, designations, informational requirements of the contracts and types of credit events that
may be contracted, in line with the standards proposed by the International Swaps and Derivatives Association, or ISDA.
The Central Bank´s expectation
is that the new rule, which incorporates international practices, standards and concepts, will serve as an inductive element for the development
of the credit derivatives market in Brazil, offering more appropriate conditions for the pricing and management of credit risk and contributing
to the expansion of long-term credit in Brazil, in all its forms.
Resolution No. 5,070 entered into
effect on June 1, 2023.
Changes to tax rules for Brazilian individuals who
hold foreign investments
On April 30, 2023, the Brazilian Federal
Government issued the Provisional Measure No. 1,171, which changed the rules applicable to the taxation of Brazilian individuals that
hold investments in foreign jurisdictions, also establishing a specific tax regime to trusts.
According to Provisional Measure No.
1,171, from January 2024 onwards, the earnings from capital invested abroad, derived from financial investments, profits and dividends
from controlled entities and assets and rights held in trusts will be subject to the assessment of the Income Tax at the rates varying
from zero to 22.5%, as follows: (i) zero, over the earnings up to BRL 6,000; (ii) 15%, over the earnings that exceed BRL 6,000 and do
not surpass BRL 50,000; and (iii) 22.5% over the earnings above BRL 50,000.
Specifically in the case of financial
investments held abroad, the earnings registered abroad will be offered to taxation in the Annual Income Tax Returns of the individual
at the rates provided above (separately from the other earnings), considering the period in which the earnings were actually made available
to that individual (i.e., upon redemption, amortization, liquidation, end of the term or sale of the investment).
In turn, Provisional Measure No. 1,171
sets forth the automatic taxation, on December 31 of each year of profits generated from January 1, 2024 onwards by controlled foreign
entities. Provisional Measure No. 1,171 defined controlled foreign entities as all foreign entities, with or without legal personality,
including investment funds and foundations, in which the individual (together with other related persons) (i) holds, directly or indirectly
(including due to specific vote arrangements, such as a shareholders agreement), powers that grant him/her preponderance in corporate
decisions or the power to elect or dismiss the majority of its managers; or (ii) holds, directly or indirectly, more than 50% of the entity’s
share capital (or equivalent) or the right to receiving 50% or more of its profits or of its assets (the latter, in case of liquidation).
Moreover, Provisional Measure No.
1,171 established that only the controlled foreign entities that (i) are located in tax haven jurisdictions or privileged tax regimes,
as defined under Brazilian tax law; or (ii) have less than 80% of active income (defined as the income derived from the entity’s
own business, except the one derived from royalties, interest, dividends, equity participation, lease, capital gains – not considering
the one deriving from equity participation held for more than 2 years –, financial investments and financial intermediation), in
comparison with their total income. The losses registered from the coming into effect of Provisional Measure No. 1,171 will be allowed
to be offset, without any time limitation, with future profits of the same entity. Profits generated until 31 December 2023 or of any
legal entities that are not framed by the concept of “controlled
foreign entities” will only be subject to taxation when made available to the Brazilian individual.
The currency exchange rate variation
of the principal invested in controlled foreign entities, whether or not they are located in a tax haven and/or privileged tax regime
or have passive income, will comprise the capital gain perceived by the individual at the time of disposal, write-off, or liquidation
of the investment, including by means of a devolution of capital.
Provisional Measure No. 1,171 also
provided for a specific tax treatment for trusts of Brazilian individuals abroad, basically determining that the assets and rights that
compose the trust will be considered as owned by (i) remaining under the ownership of the settlor after the establishment of the trust;
and (ii) passing to the ownership of the beneficiary at the time of distribution, by the trust, to the beneficiary or upon the death of
the settlor, whichever comes first. Trusts may still be framed by the concept of controlled foreign entities, as defined above. From January
1st, 2024, onwards, the distribution by the trust to the beneficiary shall have the legal nature of a gratuitous transfer from the settlor
to the beneficiary – thus being a donation if it occurs during the settlor's lifetime, or an inheritance if resulting from the Settlor's
death.
Irrespective of all of the above,
Brazilian individual may opt to update their tax basis on investments held abroad to the market value of the assets on December 31, 2022,
by collecting the Income Tax over the positive difference between its current tax basis on the assets and the market value of those assets
until November 30, 2023.
In the case of controlled foreign
entities whose tax basis has been updated to December 31, 2022, Provisional Measure No. 1,171 also authorized the update of the tax basis
from December 31, 2022, to December 31, 2023, by means of the collection of the Income Tax at a 10% rate until May 31, 2024.
Finally, Provisional Measure No. 1,171
(i) prohibited the calculation of capital gains in foreign currency in the case of assets also acquired in foreign currency by Brazilian
individuals; (ii) revoked the non-taxation of assets acquired abroad when the individual as not tax-resident in Brazil; and (iii) increased
the exempt amounts of the individuals’ income tax.
Provisional Measure No. 1,171 came
into force on May 1, 2023 and, on June 27, 2023, the President of the Brazilian National Congress extended its validity for a period of
60 days.
CMN and Central Bank issue new rule on data sharing
to prevent frauds within the National Financial and Payment Systems
On May 23, 2023, the CMN and the Central
Bank issued the Joint Resolution No. 6, which establishes the obligation for financial institutions and other entities authorized by the
Central Bank to share among each other information about frauds occurred within the National Financial System (Sistema Financeiro Nacional,
or SFN), and Brazilian Payment System (Sistema de Pagamentos Brasileiro, or SPB). The rule aims to reduce the asymmetry of data
and information faced by these institutions to support procedures and controls in their fraud prevention processes, as well as improve
their practices.
Joint Resolution No. 6 establishes
the registry of minimum information that must be shared, which includes: (i) the identification of the person who would have committed
or tried to commit fraud; (ii) the description of the indications of the occurrence or the attempt of fraud; (iii) identification of the
institution responsible for the data and information registry; and (iv) identification of the recipient account and its holder, in case
of transfers or payments. During the implementation of the electronic system provided in the Joint Resolution No. 6, the institutions
must comply with some requirements, such as (i) allowing unrestricted access to the system’s functionalities, provided the identification
of the person who accessed it; (ii) adoption of a single common standard communication that allows the execution of its functionalities;
and (iii) establishment of procedures and controls to guarantee compliance with applicable regulations, confidentiality, among others.
According to the Joint Resolution
No. 6, institutions are responsible for the use of data and information obtained through the electronic system, as well as for observing
bank secrecy requirements. They must also obtain their clients’ prior contractual consent in order to process and share the fraud
data.
Joint Resolution No. 6 will enter
into effect on November 1, 2023.
The Brazilian Federal Government empowers the Central
Bank to regulate virtual assets market
On June 13, 2023, the Brazilian government
issued the Decree No. 11,563, regulating the virtual assets market law (Law No. 14,478 of December 21, 2022, or Law No. 14,478), and designating
the Central Bank as the authority in charge of regulating and overseeing this market within the scope of this law.
Law No. 14,478 sets out the guidelines
and standards for the provision of virtual asset services, also addressing how virtual asset service providers are to be regulated. The
decree grants the Central Bank authority to (i) regulate the provision of virtual asset services, pursuant to the guidelines of Law No.
14,478, (ii) regulate, authorize and supervise virtual assets service providers; and (iii) deliberate on the other matters provided in
the law, excluding the matters relating to the national register of politically exposed persons introduced by Law No. 14,478.
Pursuant to provisions of Law No.
14,478, the decree provides that the powers and authority of the CVM remain intact. The CVM is tasked with regulating the issuance and
offering of those virtual assets classified as securities under Law No. 6,385 of 1976.
Decree No. 11,563 came into effect
on June 20, 2023, along with Law No. 14,478.
New Brazilian transfer pricing legislation is published
On June 14, 2023, Law No. 14,596 was
issued and changed the transfer pricing legislation by regulating the convergence of the Brazilian model to standards applied by the Organization
for Economic Co-operation and Development, or OECD.
Under the new law, the allocation
of taxable profits in cross-border transactions between related parties will start in accordance with international guidelines and the
arm's length principle, departing from the fixed-margin methodologies previously applied in Brazil.
Several provisions of Law No. 14,596
still pend supplementary regulation, including as regards: (i) selection of the most suitable method for transfer pricing control; (ii)
control of commodities transactions; (iii) use of statistical measures other than those prescribed by law for the range of comparable;
(iv) compensating adjustments, among other topics.
These topics will be included in a
normative ruling to be issued in the next months by the Brazilian tax authorities, after the conclusion of a public consultation.
Law No. 14,596 will enter into effect
on January 1, 2024. Taxpayers may opt to anticipate the effects of Law No. 14,596, pursuant to its section 45, a specific provision which
entered into effect on its publication date (June 15, 2023).
The National Monetary Council, or CMN, introduces
changes to risk management requirements applicable to financial institutions
On June 29, 2023, the CMN issued Resolution
No. 5,089, which amends CMN Resolution No. 4,557, of February 23, 2017, to add a specific section about country and transfer risks, defining
such risks and amending their current treatment. Previously, country and transfer risks were included in the definition of credit risk.
Pursuant to the new rule, they will now be considered autonomous risks.
Under the new rule, country risk is
defined as the possibility of losses associated or incurred due to events related to foreign jurisdictions, which includes sovereign risk,
in the case of exposure to the central government of a foreign jurisdiction; and indirect country risk, in case of an event related to
a foreign jurisdiction other than the one where the counterparty or the issuer of the risk mitigating instrument is located, associated
with the exposure assumed by the applicable financial conglomerate, when the
counterparty or the issuer may be significantly impacted by the respective event.
Transfer risk is now defined as the
possibility of occurrence of obstacles in the currency conversion of the funds required for the settlement of obligations towards the
financial conglomerate, if these funds are held in a jurisdiction other than that where the respective settlement will take place.
The amendments to Resolution No. 4,557
introduced by Resolution No. 5,089 will enter into effect on January 1, 2024.
House of Representatives approves Brazilian consumption
tax reform
On June 6, 2023, the Brazilian House
of Representatives approved the substitute opinion for Constitutional Amendment Proposal No. 45, or PEC 45, which deals with the consumption
tax reform.
In general terms, the substitutive
opinion amends the Brazilian Constitution to provide for the replacement of 5 taxes by two new value-added taxes, the Tax on Goods and
Services (Imposto sobre Bens e Serviços, or IBS) and the Contribution on Goods and Services (Contribuição
sobre Bens e Serviços, or CBS). The current taxes on consumption that will be repealed by PEC 45 and replaced by the IBS and
CBS include (i) tax on distribution of goods and services (Imposto sobre Circulação de Mercadorias e Serviços,
or ICMS); (ii) tax on services (Imposto sobre Serviços, or ISS); (iii) tax on manufactured products (Imposto sobre Circulação
de Mercadorias e Serviços, or ICMS); (iv) the Profit Participation Program Contribution (Programa de Integração
Social, or PIS), and Social Security Financing Contribution (Contribuição para o Financiamento da Seguridade Social,
or COFINS).
PEC 45 also provides authorization
for the Brazilian government to introduce a selective tax on goods and services that are harmful to health and/or the environment.
In addition, articles 1, 8 and 9 of
PEC 45 delegate to the Complementary Law that institutes the IBS and CBS the competence to provide for differentiated taxation regimes
for certain sectors, goods and services, exhaustively listed in these provisions.
PEC 45 also provides for a 7-year
transition period into the new model, whereby the ICMS and ISS will be slowly phased out and replaced by the new value-added taxes.
PEC 45 is now under review by the
Brazilian Senate for approval or new amendments, upon which it will return to the House of Representatives (depending on the relevance
of the changes) or be sent for presidential sanctioning.
The Brazilian Federal Government launches the Emergency
Program for Renegotiation of Debts of Individuals in Default – Desenrola Brasil
On June 5, 2023, the Brazilian government
issued the Provisional Measure No. 11,563, which establishes the National Program for Renegotiation of Debts of Individuals in Default
(Programa Nacional de Renegociação de Dívidas de Pessoas Físicas Inadimplentes), or Desenrola Brasil,
to encourage the renegotiation of private debts of individuals, especially those with low-income and difficulties in obtaining credit.
Desenrola Brasil is divided into two
tiers, characterized by its target audience and the debts allowed to be renegotiated under the respective tier. The target audience of
Tier 1 (Faixa 1) are debtors with monthly gross income of up to two times the current minimum wage (current minimum wage is R$1,320.00)
or who are enrolled in the Single Registry for Social Programs of the Federal Government (CadÚnico); whereas Tier 2 (Faixa
2) has a target audience of debtors with negative financial debts incurred up to December 31, 2022, and who earn a monthly gross income
of up to R$20,000.00, among other criteria.
For Tier 1, financial institutions,
such as us, will be able to carry out renegotiations with individuals registered in defaulter registers through credit operations with
guaranteed coverage default risk, in which the guarantees will be offered by the Operations Guarantee Fund (Fundo de Garantia de Operações
– FGO) limited to the amount of R$5,000.00 per debtor.
For debts classified under Tier 2,
on the other hand, financial institutions will be able to, from calendar year 2024 to calendar year 2028, register them as tax sparing
credits arising from temporary differences.
Provisional Measure 11,563/2023 entered
into force on June 7, 2023, and may lose effect if not converted into Law in 120 days.
SIGNATURES
Pursuant to the requirements of the Securities Exchange
Act of 1934, as amended, the registrant has duly caused this report to be signed on its behalf by the undersigned, thereunto duly authorized.
Date: August 23, 2023
Itaú Unibanco Holding S.A.
By: /s/ Milton Maluhy Filho
Name: Milton Maluhy Filho
Title: Chief Executive Officer
By: /s/ Alexsandro Broedel
Name: Alexsandro Broedel
Title: Chief Financial Officer
FINANCIAL STATEMENTS
www.pwc.com.br
Itaú Unibanco Holding S.A.
Consolidated financial statements at
June 30, 2023
and independent auditor's report

Independent auditor's report
To the Board of Directors and Stockholders Itaú
Unibanco Holding S.A.
Opinion
We have audited the accompanying consolidated financial statements
of Itaú Unibanco Holding S.A. ("Bank") and its subsidiaries, which comprise the consolidated balance sheet as at June
30, 2023 and the consolidated statements of income and comprehensive income for the quarter and six-month period then ended and changes
in stockholders' equity and cash flows for the six-month period then ended, and notes to the financial statements, including significant
accounting policies and other explanatory information.
In our opinion, the consolidated financial statements referred
to above present fairly, in all material respects, the consolidated financial position of the Bank and its subsidiaries as at June 30,
2023, the consolidated financial performance for the quarter and six-month period then ended and the consolidated cash flows for the six-month
period then ended, in accordance with International Accounting Standard (IAS) 34 - "Interim Financial Reporting" issued by the
International Accounting Standards Board (IASB).
Basis for opinion
We conducted our audit in accordance with Brazilian and International
Standards on Auditing. Our responsibilities under those standards are further described in the Auditor's responsibilities for the audit
of the Consolidated Financial Statements" section of our report. We are independent of the Bank and its subsidiaries in accordance
with the ethical requirements established in the Code of Professional Ethics and Professional Standards issued by the Brazilian Federal
Accounting Council, and we have fulfilled our other ethical responsibilities in accordance with these requirements. We believe that the
audit evidence we have obtained is sufficient and appropriate to provide a basis for our audit opinion.
Key Audit Matters
| Key Audit Matters are those matters that, in our
professional judgment, were of most significance in our 2023 half-year audit. These matters were addressed in the context of our
audit of the consolidated financial statements as a whole, and in forming our opinion thereon, and we do not provide a separate
opinion on these matters.
|
|
 |
Independentes Ltda., Avenida Brigadeiro Faria Lima, 3732,
Edifício B32, 16o
São
Paulo, SP, Brasil, 04538-132
T: +55 (11) 4004-8000, www.pwc.com.br
| |
| |
Itaú Unibanco Holding S.A. |
|
Why it is a Key Audit Matter
|
|
How
the matter was addressed in the audit |
| Measurement of financial assets
and liabilities and provision for expected loss in accordance with IFRS 9 - Financial Instruments (Notes 2 (c) II, 2 (c) VI, 2 (d)
IV, 4 to 10 and 28)
The provision for expected loss continued to be an area of focus
in our audit, as it involves Management's judgment in determining the necessary provision through the application of methodology and processes
which use a variety of assumptions, including, among others, prospective information, and criteria for determining a significant increase
or decrease in credit risk.
Furthermore, management regularly reviews the judgments and
estimates used in determining the Provision for Loan Losses.
The financial instruments measured at fair value include operations
with low liquidity and/or no active market, which are substantially comprised of securities issued by companies and by derivative contracts.
The fair value measurement of these financial instruments involves subjectivity, since it depends on valuation techniques performed based
on internal models that include Management assumptions in their fair valuation.
Furthermore, market risk management is complex, especially in
times of high volatility, as well as in situations where observable prices or market parameters are not available.
These matters also continued to be a focus of our 2023 half-year
audit due to the relevance and subjectivity mentioned above.
|
|
We confirmed our understanding of the process of measurement
the provision for expected loss and of financial assets and liabilities in accordance with IFRS 9.
Regarding the provision for expected loss methodology, we performed
a number of audit procedures substantially related to the: (i) analysis of management's accounting policies in comparison with IFRS 9
requirements; (ii) testing of controls related to the measurement of the provision for expected loss, which considers data, models and
assumptions adopted by Management; (iii) tests on the models, including their approval and validation of assumptions adopted to determine
the estimated losses and recoveries. In addition, we tested management's documentation of the guarantees, the projected cash flows, the
credit renegotiations, the counterparty's risk assessment, the payment delays, and other aspects that could result in a significant increase
of the credit risk, as well as the classification of operations in their proper stages, pursuant to IFRS 9; (iv) testing of data inputs
to the models and, where available, comparing certain data and assumptions with market information; and (v) analysis over Management's
disclosures in the financial statements in order to comply with IFRS 7 - Financial Instruments: Disclosures and IFRS 9.
We consider that the criteria and assumptions adopted by management
in determining and recording the provision for expected loss are appropriate and consistent, in all material respects, in the context
of the consolidated financial statements.
Regarding the measurement of financial assets and financial
liabilities, we applied the following main audit procedures: i) analysis of Management's accounting policies in comparison with IFRS 9
requirements; ii) update our understanding of the valuation methodology used for these financial instruments and the main assumptions
used by Management, as well as comparing them with independent methodologies and assumptions. We performed, on a sample basis, the recalculation
of the valuation of certain
|
| |
| |
Itaú Unibanco Holding S.A. |
| Why it is a Key Audit Matter |
|
How the matter was addressed in the audit |
| |
|
operations and analyzed the consistency of such methodologies
with those applied in prior periods.
We believe that the criteria and assumptions adopted by Management
to measure the fair value of these financial instruments are appropriate and consistent with the disclosures in the accompanying notes
to the Financial Statements.
|
| Information technology environment |
|
|
|
The Bank and its subsidiaries rely on their technology structure
to process their operations and prepare their financial statements.
Technology represents a fundamental aspect on the evolution of the
Bank and its subsidiaries' business, and over the last years, significant short and long-term investments have been made in the information
technology systems and processes.
The technology structure is comprised of more than one environment
with different processes and segregated controls. Additionally, a substantial part of the Bank and its subsidiaries' teams are performing
their activities remotely (home office), which caused the need to adapt technology processes and infrastructure to maintain the continuity
of operations.
The lack of adequacy of the general controls of the technology environment
and of the controls that depend on technology systems may result in the incorrect processing of critical information used to prepare the
financial statements, as well as risks related to information security and cybersecurity. Accordingly, this continued as an area of focus
in our audit.
Provisions and contingent liabilities
(Notes 2 (c) X, 2 (d) XIV and 29)
The Bank and its subsidiaries have provisions and contingent liabilities
mainly arising from judicial and administrative proceedings, inherent to the normal course of their business, filed by third parties,
former employees, and public agencies, involving civil, labor, tax, and social security matters.
In general, the settlement of these proceedings takes a long time
and involve not only discussions
|
|
As part of our audit procedures, with the support of our specialists,
we assessed the information technology environment, including the automated controls of the application systems that are significant for
the preparation of the financial statements.
The procedures performed comprised the combination of relevant
tests of design and effectiveness of controls as well as the performance of tests related to the information security, including the access
management control, change management and monitoring the operating capacity of technology infrastructure.
The audit procedures applied resulted in appropriate evidence
that was considered in determining the nature, timing, and extent of other audit procedures.
We confirmed our understanding and tested the design and the
effectiveness of the main controls used to identify, assess, monitor, measure, record, and disclose the provision and contingent liabilities,
including the totality and the integrity of the database.
We tested the models used to quantify judicial proceedings
of civil and labor natures considered on a group basis. We were supported by our
|
| |
| |
Itaú Unibanco Holding S.A. |
| Why it is a Key Audit Matter |
|
How the matter was addressed in the audit |
| on the matter itself, but also complex process-related
aspects, depending on the applicable legislation.
Besides the subjective aspects in determining the possibility
of loss attributed to each case, the evolution of case law on certain causes is not always uniform. Considering the materiality of the
amounts and the uncertainties and judgments involved, as described above, in determining, recording, and disclosing the provision and
contingent liabilities required items, we continue to consider this an area of audit focus.
|
|
specialists in the labor, legal, and fiscal areas, according
to the nature of each proceeding.
Also, in a sample basis, we performed external confirmation
procedures with both internal and external lawyers responsible for the proceedings.
We considered that the criteria and assumptions adopted by Management
for determining the provision, as well as the information disclosed in the explanatory notes are appropriate.
|
| |
|
|
Responsibilities of management and those charged with governance for the consolidated financial statements
|
| Management
is responsible for the preparation and fair presentation of the consolidated financial statements
in accordance with the International Financial Reporting Standards (IFRS), issued by the
International Accounting Standards Board (IASB), and for such internal control as management
determines is necessary to enable the preparation of financial statements that are free from
material misstatement, whether due to fraud or error.
In preparing the consolidated financial
statements, management is responsible for assessing the Bank's ability to continue as a going concern, disclosing, as applicable, matters
related to going concern and using the going concern basis of accounting unless management either intends to liquidate the Bank or to
cease operations, or has no realistic alternative but to do so.
Those charged with governance are
responsible for overseeing the Bank's and its subsidiaries financial reporting process.
|
|
Auditor's responsibilities for the audit of the consolidated financial statements
|
Our
objectives are to obtain reasonable assurance about whether the consolidated financial statements
as a whole are free from material misstatement, whether due to fraud or error, and to issue
an auditor's report that includes our opinion. Reasonable assurance is a high level of assurance
but is not a guarantee that an audit conducted in accordance with Brazilian and International
Standards on Auditing will always detect a material misstatement when it exists. Misstatements
can arise from fraud or error and are considered material if, individually or in the aggregate,
they could reasonably be expected to influence the economic decisions of users taken on the
basis of these financial statements.
As part of an audit in accordance with
Brazilian and International Standards on Auditing, we exercise professional judgment and maintain professional skepticism throughout
the audit. We also:
|
| • | Identify and assess the risks of material misstatement of the consolidated
financial statements, whether due to fraud or error, design and perform audit procedures responsive to those risks, and obtain audit evidence
that is sufficient and appropriate to provide a basis for our opinion. The risk of not detecting a material misstatement resulting from
fraud is higher than for one resulting from error, as fraud may involve collusion, forgery, intentional omissions, misrepresentations,
or the override of internal control. |
| |
| |
Itaú Unibanco Holding S.A. |
| • | Obtain an understanding of internal control relevant to the audit in order
to design audit procedures that are appropriate in the circumstances, but not for the purpose of expressing an opinion on the effectiveness
of the internal control of the Bank and its subsidiaries. |
| • | Evaluate the appropriateness of accounting policies used and the reasonableness
of accounting estimates and related disclosures made by management. |
| • | Conclude on the appropriateness of management's use of the going concern
basis of accounting and, based on the audit evidence obtained, whether a material uncertainty exists related to events or conditions that
may cast significant doubt on the Bank's ability to continue as a going concern. If we conclude that a material uncertainty exists, we
are required to draw attention in our auditor's report to the related disclosures in the financial statements or, if such disclosures
are inadequate, to modify our opinion. Our conclusions are based on the audit evidence obtained up to the date of our auditor's report.
However, future events or conditions may cause the Bank to cease to continue as a going concern. |
| • | Evaluate the overall presentation, structure, and content of the consolidated
financial statements, including the disclosures, and whether these financial statements represent the underlying transactions and events
in a manner that achieves fair presentation. |
| • | Obtain sufficient appropriate audit evidence regarding the financial information
of the entities or business activities within the Group to express an opinion on the consolidated financial statements. We are responsible
for the direction, supervision, and performance of the group audit. We remain solely responsible for our audit opinion. |
We communicate with those charged with
governance regarding, among other matters, the planned scope and timing of the audit and significant audit findings, including any significant
deficiencies in internal control that we identify during our audit.
We also provide those charged with governance with a statement
that we have complied with relevant ethical requirements regarding independence, and to communicate with them all relationships and other
matters that may reasonably be thought to bear on our independence, and where applicable, related safeguards.
From the matters communicated with those charged with governance,
we determine those matters that were of most significance in the audit of the financial statements of the half-year ended June 30, 2023
and are therefore the key audit matters. We describe these matters in our auditor's report unless law or regulation precludes public disclosure
about the matter or when, in extremely rare circumstances, we determine that a matter should not be communicated in our report because
the adverse consequences of doing so would reasonably be expected to outweigh the public interest benefits of such communication.
São
Paulo, August 7, 2023

PricewaterhouseCoopers
Auditores
Independentes Ltda.
CRC 2SP000160/O-5

Emerson Laerte da Silva
Contador CRC 1SP171089/O-3
| Itaú Unibanco Holding
S.A. |
|
|
|
| Consolidated Balance Sheet |
|
|
|
| (In
millions of reais) |
|
|
|
| Assets |
Note |
06/30/2023 |
12/31/2022 |
| Cash |
|
30,636 |
35,381 |
| Financial
assets |
|
2,281,671 |
2,170,219 |
| At
Amortized Cost |
|
1,606,250 |
1,578,789 |
| Compulsory
deposits in the Central Bank of Brazil |
|
136,749 |
115,748 |
| Interbank
deposits |
4 |
53,326 |
59,592 |
| Securities
purchased under agreements to resell |
4 |
216,959 |
221,779 |
| Securities |
9 |
236,011 |
213,026 |
| Loan
and lease operations |
10 |
901,185 |
909,422 |
| Other
financial assets |
18a |
113,957 |
109,909 |
| (-)
Provision for expected loss |
4, 9, 10 |
(51,937) |
(50,687) |
| At
Fair Value through Other Comprehensive Income |
|
134,347 |
126,748 |
| Securities |
8 |
134,347 |
126,748 |
| At
Fair Value through Profit or Loss |
|
541,074 |
464,682 |
| Securities |
5 |
466,567 |
385,099 |
| Derivatives |
6, 7 |
72,845 |
78,208 |
| Other
financial assets |
18a |
1,662 |
1,375 |
| Insurance
contracts |
27 |
86 |
23 |
| Tax
assets |
|
62,357 |
59,645 |
| Income
tax and social contribution - current |
|
1,242 |
1,647 |
| Income
tax and social contribution - deferred |
24b I |
54,044 |
51,634 |
| Other |
|
7,071 |
6,364 |
| Other
assets |
18a |
19,719 |
17,474 |
| Investments
in associates and joint ventures |
11 |
7,880 |
7,443 |
| Fixed
assets, net |
13 |
7,938 |
7,767 |
| Goodwill and Intangible
assets, net |
14 |
23,921 |
23,114 |
| Total
assets |
|
2,434,208 |
2,321,066 |
| The accompanying notes
are an integral part of these consolidated financial statements. |
| Itaú Unibanco Holding
S.A. |
|
|
|
| Consolidated Balance Sheet |
|
|
|
| (In
millions of reais) |
|
|
|
| Liabilities
and stockholders' equity |
Note |
06/30/2023 |
12/31/2022 |
| Financial Liabilities |
|
1,912,522 |
1,836,690 |
| At
Amortized Cost |
|
1,840,419 |
1,755,498 |
| Deposits |
15 |
923,281 |
871,438 |
| Securities
sold under repurchase agreements |
17a |
319,099 |
293,440 |
| Interbank
market funds |
17b |
318,382 |
294,587 |
| Institutional
market funds |
17c |
118,689 |
129,382 |
| Other
financial liabilities |
18b |
160,968 |
166,651 |
| At
Fair Value through Profit or Loss |
|
68,231 |
77,508 |
| Derivatives |
6, 7 |
67,326 |
76,861 |
| Structured
notes |
16 |
86 |
64 |
| Other
financial liabilities |
18b |
819 |
583 |
| Provision
for Expected Loss |
10 |
3,872 |
3,684 |
| Loan
commitments |
|
3,094 |
2,874 |
| Financial
guarantees |
|
778 |
810 |
| Insurance
contracts and private pension |
27 |
249,769 |
233,126 |
| Provisions |
29 |
20,140 |
19,475 |
| Tax
liabilities |
24c |
7,360 |
6,773 |
| Income
tax and social contribution - current |
|
2,826 |
2,950 |
| Income
tax and social contribution - deferred |
24b II |
494 |
345 |
| Other |
|
4,040 |
3,478 |
| Other
liabilities |
18b |
55,476 |
47,895 |
| Total
liabilities |
|
2,245,267 |
2,143,959 |
| Total
stockholders’ equity attributed to the owners of the parent company |
|
178,853 |
167,717 |
| Capital |
19a |
90,729 |
90,729 |
| Treasury
shares |
19a |
(109) |
(71) |
| Capital
reserves |
19c |
2,273 |
2,480 |
| Revenue
reserves |
19c |
96,273 |
86,209 |
| Other
comprehensive income |
|
(10,313) |
(11,630) |
| Non-controlling
interests |
19d |
10,088 |
9,390 |
| Total
stockholders’ equity |
|
188,941 |
177,107 |
| Total
liabilities and stockholders' equity |
|
2,434,208 |
2,321,066 |
| The accompanying notes
are an integral part of these consolidated financial statements. |
| Itaú Unibanco Holding
S.A. |
|
|
|
|
|
| Consolidated Statement of Income |
|
|
|
|
|
| (In
millions of reais, except for number of shares and earnings per share information) |
| |
Note |
04/01
to 06/30/2023 |
04/01
to 06/30/2022 |
01/01
to 06/30/2023 |
01/01
to 06/30/2022 |
| Operating Revenues |
|
40,122 |
35,446 |
76,173 |
70,011 |
| Interest
and similar income |
21a |
54,303 |
47,248 |
111,549 |
84,127 |
| Interest
and similar expenses |
21b |
(41,923) |
(21,543) |
(81,576) |
(46,025) |
| Income
of Financial Assets and Liabilities at Fair Value through Profit or Loss |
21c |
8,805 |
8,477 |
11,917 |
4,879 |
| Foreign
exchange results and exchange variations in foreign transactions |
|
4,567 |
(12,084) |
5,842 |
351 |
| Commissions
and Banking Fees |
22 |
11,174 |
11,282 |
22,229 |
21,958 |
| Income
from Insurance Contracts and Private Pension |
|
1,698 |
1,213 |
3,431 |
2,458 |
| Operating
Income from Insurance Contracts and Private Pension, net of Reinsurance |
27 |
1,620 |
1,335 |
3,154 |
2,730 |
| Financial
Income from Insurance Contracts and Private Pension, net of Reinsurance |
27 |
(8,234) |
(3,622) |
(13,990) |
(9,509) |
| Income
from Financial Assets related to Insurance Contracts and Private Pension |
|
8,312 |
3,500 |
14,267 |
9,237 |
| Other
income |
|
1,498 |
853 |
2,781 |
2,263 |
| Expected
Loss from Financial Assets |
|
(7,857) |
(7,019) |
(16,029) |
(13,235) |
| Expected
Loss with Loan and Lease Operations |
10c |
(8,204) |
(7,023) |
(16,286) |
(13,716) |
| Expected
Loss with Other Financial Asset, net |
|
347 |
4 |
257 |
481 |
| Operating
Revenues Net of Expected Losses from Financial Assets |
|
32,265 |
28,427 |
60,144 |
56,776 |
| Other
operating income / (expenses) |
|
(21,358) |
(18,535) |
(41,000) |
(37,722) |
| General
and administrative expenses |
23 |
(18,968) |
(16,409) |
(36,298) |
(33,229) |
| Tax
expenses |
|
(2,635) |
(2,257) |
(5,094) |
(4,789) |
| Share
of profit or (loss) in associates and joint ventures |
11 |
245 |
131 |
392 |
296 |
| Income
/ (loss) before income tax and social contribution |
|
10,907 |
9,892 |
19,144 |
19,054 |
| Current
income tax and social contribution |
24a |
(3,587) |
(2,634) |
(5,832) |
(4,769) |
| Deferred
income tax and social contribution |
24a |
1,609 |
352 |
3,151 |
277 |
| Net
income / (loss) |
|
8,929 |
7,610 |
16,463 |
14,562 |
| Net
income attributable to owners of the parent company |
25 |
8,619 |
7,298 |
15,974 |
13,966 |
| Net
income / (loss) attributable to non-controlling interests |
19d |
310 |
312 |
489 |
596 |
| Earnings
per share - basic |
25 |
|
|
|
|
| Common |
|
0.88 |
0.74 |
1.63 |
1.43 |
| Preferred |
|
0.88 |
0.74 |
1.63 |
1.43 |
| Earnings
per share - diluted |
25 |
|
|
|
|
| Common |
|
0.87 |
0.74 |
1.62 |
1.42 |
| Preferred |
|
0.87 |
0.74 |
1.62 |
1.42 |
| Weighted
average number of outstanding shares - basic |
25 |
|
|
|
|
| Common |
|
4,958,290,359 |
4,958,290,359 |
4,958,290,359 |
4,958,290,359 |
| Preferred |
|
4,841,653,914 |
4,842,752,798 |
4,837,567,276 |
4,838,833,377 |
| Weighted
average number of outstanding shares - diluted |
25 |
|
|
|
|
| Common |
|
4,958,290,359 |
4,958,290,359 |
4,958,290,359 |
4,958,290,359 |
| Preferred |
|
4,912,392,609 |
4,899,092,078 |
4,891,767,691 |
4,875,507,563 |
| The accompanying notes
are an integral part of these consolidated financial statements. |
| Itaú Unibanco Holding
S.A. |
|
|
|
|
|
| Consolidated Statement of Comprehensive
Income |
|
|
|
|
|
| (In
millions of reais) |
|
|
|
|
|
| |
Note |
04/01
to 06/30/2023 |
04/01
to 06/30/2022 |
01/01
to 06/30/2023 |
01/01
to 06/30/2022 |
| Net income / (loss) |
|
8,929 |
7,610 |
16,463 |
14,562 |
| Financial
assets at fair value through other comprehensive income |
|
3,689 |
(2,867) |
3,607 |
(2,702) |
| Change
in fair value |
|
6,100 |
(7,008) |
5,590 |
(4,435) |
| Tax
effect |
|
(1,372) |
2,249 |
(1,413) |
1,187 |
| (Gains)
/ losses transferred to income statement |
|
(1,890) |
3,439 |
(1,037) |
992 |
| Tax
effect |
|
851 |
(1,547) |
467 |
(446) |
| Hedge |
|
271 |
(163) |
321 |
(224) |
| Cash
flow hedge |
7 |
70 |
60 |
147 |
(278) |
| Change
in fair value |
|
122 |
117 |
277 |
(468) |
| Tax
effect |
|
(52) |
(57) |
(130) |
190 |
| Hedge
of net investment in foreign operation |
7 |
201 |
(223) |
174 |
54 |
| Change
in fair value |
|
383 |
(416) |
336 |
128 |
| Tax
effect |
|
(182) |
193 |
(162) |
(74) |
| Insurance
contracts and private pension |
|
(440) |
419 |
(486) |
713 |
| Change
in discount rate |
|
(734) |
711 |
(833) |
1,209 |
| Tax
effect |
|
294 |
(292) |
347 |
(496) |
| Remeasurements
of liabilities for post-employment benefits (1) |
|
(8) |
(2) |
(13) |
(6) |
| Remeasurements |
26 |
(14) |
(6) |
(24) |
(11) |
| Tax
effect |
|
6 |
4 |
11 |
5 |
| Foreign
exchange variation in foreign investments |
|
(2,009) |
1,507 |
(2,112) |
(2,792) |
| Total
other comprehensive income |
|
1,503 |
(1,106) |
1,317 |
(5,011) |
| Total
comprehensive income |
|
10,432 |
6,504 |
17,780 |
9,551 |
| Comprehensive
income attributable to the owners of the parent company |
|
10,122 |
6,192 |
17,291 |
8,955 |
| Comprehensive
income attributable to non-controlling interests |
|
310 |
312 |
489 |
596 |
| 1) Amounts that will
not be subsequently reclassified to income. |
| The accompanying notes
are an integral part of these consolidated financial statements. |
| Itaú Unibanco
Holding S.A. |
|
|
|
|
|
|
|
|
|
|
|
|
|
|
|
| Consolidated Statement
of Changes in Stockholders’ Equity |
| (In
millions of reais) |
| |
|
Note |
Attributed
to owners of the parent company |
Total
stockholders’ equity – owners of the parent company |
Total
stockholders’ equity – non-controlling interests |
Total |
| |
|
Capital |
Treasury
shares |
Capital
reserves |
Revenue
reserves |
Retained
earnings |
Other
comprehensive income |
| |
|
Financial
assets at fair value through other comprehensive income (1) |
Insurance
contracts and private pension |
Remeasurements
of liabilities of post-employment benefits |
Conversion
adjustments of foreign investments |
Gains
and losses – hedge (2) |
| Total
- 01/01/2022 |
|
90,729 |
(528) |
2,250 |
65,985 |
- |
(2,542) |
- |
(1,486) |
6,531 |
(8,393) |
152,546 |
11,612 |
164,158 |
| Transactions
with owners |
|
- |
457 |
(162) |
- |
- |
- |
- |
- |
- |
- |
295 |
(1,281) |
(986) |
| Result
of delivery of treasury shares |
19, 20 |
- |
457 |
64 |
- |
- |
- |
- |
- |
- |
- |
521 |
- |
521 |
| Recognition
of share-based payment plans |
|
- |
- |
(226) |
- |
- |
- |
- |
- |
- |
- |
(226) |
- |
(226) |
| (Increase)
/ Decrease to the owners of the parent company |
2d I, 3 |
- |
- |
- |
- |
- |
- |
- |
- |
- |
- |
- |
(1,281) |
(1,281) |
| Dividends |
|
- |
- |
- |
- |
- |
- |
- |
- |
- |
- |
- |
(301) |
(301) |
| Interest
on capital |
|
- |
- |
- |
- |
(4,041) |
- |
- |
- |
- |
- |
(4,041) |
- |
(4,041) |
| Unclaimed
dividends and Interest on capital |
|
- |
- |
- |
- |
79 |
- |
- |
- |
- |
- |
79 |
- |
79 |
| Corporate
reorganization |
|
- |
- |
- |
(775) |
- |
- |
- |
- |
- |
- |
(775) |
- |
(775) |
| Other
(3) |
|
- |
- |
- |
356 |
- |
- |
- |
- |
- |
- |
356 |
- |
356 |
| Total
comprehensive income |
|
- |
- |
- |
- |
13,898 |
(2,702) |
713 |
(6) |
(2,792) |
(224) |
8,887 |
596 |
9,483 |
| Net
income |
|
- |
- |
- |
- |
13,966 |
- |
- |
- |
- |
- |
13,966 |
596 |
14,562 |
| Other
comprehensive income for the period |
|
- |
- |
- |
- |
(68) |
(2,702) |
713 |
(6) |
(2,792) |
(224) |
(5,079) |
- |
(5,079) |
| Appropriations: |
|
|
|
|
|
|
|
|
|
|
|
|
|
|
| Legal
reserve |
|
- |
- |
- |
723 |
(723) |
- |
- |
- |
- |
- |
- |
- |
- |
| Statutory
reserve |
|
- |
- |
- |
9,213 |
(9,213) |
- |
- |
- |
- |
- |
- |
- |
- |
| Total
- 06/30/2022 |
19 |
90,729 |
(71) |
2,088 |
75,502 |
- |
(5,244) |
713 |
(1,492) |
3,739 |
(8,617) |
157,347 |
10,626 |
167,973 |
| Change
in the period |
|
- |
457 |
(162) |
9,517 |
- |
(2,702) |
713 |
(6) |
(2,792) |
(224) |
4,801 |
(986) |
3,815 |
| Total
- 01/01/2023 |
|
90,729 |
(71) |
2,480 |
86,209 |
- |
(5,984) |
796 |
(1,520) |
3,505 |
(8,427) |
167,717 |
9,390 |
177,107 |
| Transactions
with owners |
|
- |
(38) |
(207) |
- |
- |
- |
- |
- |
- |
- |
(245) |
596 |
351 |
| Acquisition
of treasury shares |
19, 20 |
- |
(689) |
- |
- |
- |
- |
- |
- |
- |
- |
(689) |
- |
(689) |
| Result
of delivery of treasury shares |
19, 20 |
- |
651 |
(7) |
- |
- |
- |
- |
- |
- |
- |
644 |
- |
644 |
| Recognition
of share-based payment plans |
|
- |
- |
(200) |
- |
- |
- |
- |
- |
- |
- |
(200) |
- |
(200) |
| (Increase)
/ Decrease to the owners of the parent company |
2d I, 3 |
- |
- |
- |
- |
- |
- |
- |
- |
- |
- |
- |
596 |
596 |
| Dividends |
|
- |
- |
- |
- |
- |
- |
- |
- |
- |
- |
- |
(387) |
(387) |
| Interest
on capital |
|
- |
- |
- |
- |
(6,214) |
- |
- |
- |
- |
- |
(6,214) |
- |
(6,214) |
| Unclaimed
dividends and Interest on capital |
|
- |
- |
- |
- |
47 |
- |
- |
- |
- |
- |
47 |
- |
47 |
| Corporate
reorganization |
2d I, 3 |
- |
- |
- |
(193) |
- |
- |
- |
- |
- |
- |
(193) |
- |
(193) |
| Other
(3) |
|
- |
- |
- |
450 |
- |
- |
- |
- |
- |
- |
450 |
- |
450 |
| Total
comprehensive income |
|
- |
- |
- |
- |
15,974 |
3,607 |
(486) |
(13) |
(2,112) |
321 |
17,291 |
489 |
17,780 |
| Net
income |
|
- |
- |
- |
- |
15,974 |
- |
- |
- |
- |
- |
15,974 |
489 |
16,463 |
| Other
comprehensive income for the period |
|
- |
- |
- |
- |
- |
3,607 |
(486) |
(13) |
(2,112) |
321 |
1,317 |
- |
1,317 |
| Appropriations: |
|
|
|
|
|
|
|
|
|
|
|
|
|
|
| Legal
reserve |
|
- |
- |
- |
818 |
(818) |
- |
- |
- |
- |
- |
- |
- |
- |
| Statutory
reserve |
|
- |
- |
- |
8,989 |
(8,989) |
- |
- |
- |
- |
- |
- |
- |
- |
| Total
- 06/30/2023 |
19 |
90,729 |
(109) |
2,273 |
96,273 |
- |
(2,377) |
310 |
(1,533) |
1,393 |
(8,106) |
178,853 |
10,088 |
188,941 |
| Change
in the period |
|
- |
(38) |
(207) |
10,064 |
- |
3,607 |
(486) |
(13) |
(2,112) |
321 |
11,136 |
698 |
11,834 |
1) Includes the share in other comprehensive
income of investments in associates and joint ventures related to financial assets at fair value through other comprehensive income.
2) Includes cash flow hedge and hedge of net investment in foreign operation.
3) Includes Argentina´s hyperinflation adjustment. |
| The accompanying notes
are an integral part of these consolidated financial statements. |
| Itaú Unibanco Holding
S.A. |
|
|
|
| Consolidated Statement of Cash Flows |
|
|
|
| (In
millions of reais) |
|
|
|
| |
Note |
01/01
to 06/30/2023 |
01/01
to 06/30/2022 |
| Adjusted net income |
|
50,770 |
66,439 |
| Net
income |
|
16,463 |
14,562 |
| Adjustments
to net income: |
|
34,307 |
51,877 |
| Share-based
payment |
|
(142) |
(158) |
| Effects
of changes in exchange rates on cash and cash equivalents |
|
9,116 |
30,615 |
| Expected
loss from financial assets |
|
16,029 |
13,961 |
| Income
from interest and foreign exchange variation from operations with subordinated debt |
|
1,252 |
(549) |
| Financial
income from insurance contracts and private pension |
27 |
13,990 |
9,509 |
| Depreciation
and amortization |
|
2,899 |
2,356 |
| Expense
from update / charges on the provision for civil, labor, tax and legal obligations |
|
541 |
769 |
| Provision
for civil, labor, tax and legal obligations |
|
2,141 |
1,849 |
| Revenue
from update / charges on deposits in guarantee |
|
(460) |
(534) |
| Deferred
taxes (excluding hedge tax effects) |
24b |
(852) |
305 |
| Income
from share in the net income of associates and joint ventures and other investments |
|
(392) |
(296) |
| Income
from financial assets - at fair value through other comprehensive income |
|
(1,037) |
992 |
| Income
from interest and foreign exchange variation of financial assets at fair value through other comprehensive income |
|
(7,687) |
(6,643) |
| Income
from interest and foreign exchange variation of financial assets at amortized cost |
|
(1,721) |
(1,500) |
| (Gain)
/ loss on sale of investments and fixed assets |
|
(1) |
(6) |
| Other |
23 |
631 |
1,207 |
| Change
in assets and liabilities |
|
6,908 |
15,040 |
| (Increase)
/ decrease in assets |
|
|
|
| Interbank
deposits |
|
756 |
11,614 |
| Securities
purchased under agreements to resell |
|
23,242 |
1,244 |
| Compulsory
deposits with the Central Bank of Brazil |
|
(21,001) |
(7,759) |
| Loan
operations |
|
(6,327) |
(50,459) |
| Derivatives
(assets / liabilities) |
|
(3,851) |
1,526 |
| Financial
assets designated at fair value through profit or loss |
|
(81,468) |
(10,054) |
| Other
financial assets |
|
(3,875) |
(837) |
| Other
tax assets |
|
(302) |
161 |
| Other
assets |
|
(3,217) |
(6,530) |
| (Decrease)
/ increase in liabilities |
|
|
|
| Deposits |
|
51,843 |
(21,679) |
| Deposits
received under securities repurchase agreements |
|
25,659 |
(7,529) |
| Funds
from interbank markets |
|
23,795 |
82,238 |
| Funds
from institutional markets |
|
(337) |
3,000 |
| Other
financial liabilities |
|
(5,447) |
11,843 |
| Financial
liabilities at fair value throught profit or loss |
|
23 |
(26) |
| Insurance
contracts and private pension |
|
2,167 |
(4,808) |
| Provisions |
|
1,760 |
1,225 |
| Tax
liabilities |
|
1,328 |
456 |
| Other
liabilities |
|
7,158 |
15,143 |
| Payment
of income tax and social contribution |
|
(4,998) |
(3,729) |
| Net
cash from / (used in) operating activities |
|
57,678 |
81,479 |
| Dividends
/ Interest on capital received from investments in associates and joint ventures |
|
250 |
39 |
| Cash
upon sale of fixed assets |
|
61 |
22 |
| Mutual
rescission of intangible assets agreements |
|
53 |
1 |
| (Purchase)
/ Cash from the sale of financial assets at fair value through other comprehensive income |
|
1,170 |
647 |
| (Purchase)
/ redemptions of financial assets at amortized cost |
|
(21,303) |
(46,647) |
| (Purchase)
of investments in associates and joint ventures |
|
(171) |
(528) |
| (Purchase)
of fixed assets |
|
(973) |
(853) |
| (Purchase)
of intangible assets |
14 |
(2,999) |
(2,963) |
| Net
cash from / (used in) investment activities |
|
(23,912) |
(50,282) |
| Subordinated
debt obligations redemptions |
|
(11,608) |
(8,705) |
| Change
in non-controlling interests stockholders |
|
596 |
(1,281) |
| Acquisition
of treasury shares |
|
(689) |
- |
| Result
of delivery of treasury shares |
|
586 |
453 |
| Dividends
and interest on capital paid to non-controlling interests |
|
(387) |
(301) |
| Dividends
and interest on capital paid |
|
(4,993) |
(3,229) |
| Net
cash from / (used in) financing activities |
|
(16,495) |
(13,063) |
| Net
increase / (decrease) in cash and cash equivalents |
2d III |
17,271 |
18,134 |
| Cash
and cash equivalents at the beginning of the period |
|
104,257 |
103,887 |
| Effects
of changes in exchange rates on cash and cash equivalents |
|
(9,116) |
(30,615) |
| Cash
and cash equivalents at the end of the period |
|
112,412 |
91,406 |
| Cash |
|
30,636 |
33,839 |
| Interbank
deposits |
|
7,074 |
6,358 |
| Securities
purchased under agreements to resell - Collateral held |
|
74,702 |
51,209 |
| Additional
information on cash flow (Mainly operating activities) |
|
|
|
| Interest
received |
|
108,131 |
107,756 |
| Interest
paid |
|
59,376 |
44,193 |
| Non-cash
transactions |
|
|
|
| Loans
transferred to assets held for sale |
|
- |
- |
| Increase
of Equity Interest in ITAÚ CHILE |
|
- |
961 |
| Dividends
and interest on capital declared and not yet paid |
|
4,865 |
3,376 |
| The accompanying notes
are an integral part of these consolidated financial statements. |
Itaú Unibanco Holding S.A.
Notes to the Consolidated Financial Statements
At 06/30/2023 and 12/31/2022 for
balance sheet accounts and from 01/01 to 06/30 of 2023 and 2022 for income statement
(In millions of reais, except when indicated)
Note 1 - Operations
Itaú Unibanco Holding S.A. (ITAÚ UNIBANCO
HOLDING) is a publicly held company, organized and existing under the laws of Brazil. The head office is located at Praça Alfredo
Egydio de Souza Aranha, n° 100, in the city of São Paulo, state of São Paulo, Brazil.
ITAÚ UNIBANCO HOLDING has a presence in 18 countries
and territories and offers a wide variety of financial products and services to personal and corporate customers in Brazil and abroad,
not necessarily related to Brazil, through its branches, subsidiaries and international affiliates. It offers a full range of banking
services, through its different portfolios: commercial banking; investment banking; real estate lending; loans, financing and investment;
leasing and foreign exchange business. Its operations are divided into three segments: Retail Business, Wholesale Business and Activities
with the Market + Corporation. Further detailed segment information is presented in Note 30.
ITAÚ UNIBANCO HOLDING is a financial holding
company controlled by Itaú Unibanco Participações S.A. (“IUPAR”), a holding company which owns 51.71%
of ITAU UNIBANCO HOLDING's common shares, and which is jointly controlled by (i) Itaúsa S.A. (“ITAÚSA”),
a holding company controlled by members of the Egydio de Souza Aranha family, and (ii) Companhia E. Johnston de Participações
(“E. JOHNSTON”), a holding company controlled by the Moreira Salles family. Itaúsa also directly holds 39.21%
of ITAÚ UNIBANCO HOLDING’s common shares.
These consolidated financial statements were approved by
the Board of Directors on August 07, 2023.
Note 2 - Significant accounting policies
a) Basis of preparation
The Consolidated Financial Statements of ITAÚ
UNIBANCO HOLDING were prepared in accordance with the requirements and guidelines of the National Monetary Council (CMN), which require
that as from December 31, 2010 annual Consolidated Financial Statements are prepared in accordance with the International Financial Reporting
Standards (IFRS), as issued by the International Accounting Standards Board (IASB).
These Consolidated Financial Statements were prepared in
accordance with IAS 34 – Interim Financial Reporting, with the option of presenting the Complete Consolidated Financial Statements
in lieu of the Condensed Consolidated Financial Statements.
In the preparation of these Consolidated Financial Statements, ITAÚ
UNIBANCO HOLDING adopted the criteria for recognition, measurement and disclosure established in the IFRS and in the interpretations
of the International Financial Reporting Interpretation Committee (IFRIC).
The information in the financial statements and accompanying
notes evidences all relevant information inherent in the financial statements, and only them, which is consistent with information used
by management in its administration.
b) New accounting standards changes and
interpretations of existing standards
I - Accounting standards applicable for
period ended June 30, 2023
• IFRS
17 – Insurance Contracts: The pronouncement replaces IFRS 4 – Insurance Contracts. IFRS 17 is applicable to all insurance
and reinsurance contracts held as from January 1, 2023, with a transition date of January 1, 2022 for comparative purposes. The modified
retrospective approach was adopted.
Transition to IFRS 17
The main changes identified by ITAÚ UNIBANCO
HOLDING due to the adoption of IFRS 17 are related to the aggregation and measurement of insurance contracts and private pension. Further
details on the material accounting policies adopted are included in Note 2d.
(i) Aggregation and Measurement
of Insurance Contracts and Private Pension
IFRS 17 requires that insurance contracts be grouped
in portfolios considering similar risks, their management, the contract issue period and the expected profitability at the time of initial
recognition. The groups of insurance contracts and private pension are made up of contracts issued in the quarter, which corresponds to
the publication period.
ITAÚ UNIBANCO HOLDING grouped insurance
and health products in the Insurance portfolio and supplementary pension plans in the Private Pension portfolio.
The Insurance portfolio is made up mainly of products
which cover life and property, divided into groups of contracts with the coverage period of each contract is one year or less and contracts
of the coverage period longer. The Private Pension portfolio is made up of products with coverage for survival and risk of death
and disability, comprising three groups: risk coverage plans and survival plans with and without direct participation features.
For measurement of the groups of insurance contracts
and private pension, ITAÚ UNIBANCO HOLDING adopts the three measurement approaches: BBA, VFA and PAA, considering the characteristics
of the existing insurance contracts and private pension:
• Building
Block Approach (BBA): applicable to all insurance contracts without direct participation features, corresponds to the standard model. ITAÚ
UNIBANCO HOLDING applied this approach to insurance contracts and private pension with coverage over 1 year or which are onerous.
• Variable
Fee Approach (VFA): applicable to insurance contracts with direct participation features that are substantially investment-related service
contracts with which an entity promises a return on investment based on the underlying items. ITAÚ UNIBANCO HOLDING applied
this approach to the Free Benefit Generating Plan (PGBL) and Free Benefit Generating Life Plan (VGBL) private pension plans, since the
contributions made by insured parties have a return based on the profitability of the investment fund specially organized in which funds
are invested.
• Premium
Allocation Approach (PAA): applicable to insurance contracts lasting up to 12 months or when they produce results similar to those that
would be obtained if the standard model were used. ITAÚ UNIBANCO HOLDING applied this approach to insurance contracts whose
coverage periods are equal to or less than one year.
The initial recognition of groups of insurance contracts
and private pension is performed by the total of:
• Contractual
service margin, which represents the unearned profit that will be recognized as it provides insurance contract service in the future.
• Fulfillment
cash flows, composed of the present value of estimated cash inflows and outflows of funds over the period covered by the portfolio, risk
adjusted for non-financial risk. The risk adjustment for non-financial risk is the compensation that the entity requires for bearing the
uncertainty about the amount and timing of the cash flows that arises from non-financial risk.
The Assets and Liabilities of insurance contracts and
private pension are subsequently segregated between:
• Asset
or Liability for Remaining Coverage: represented by the fulfillment cash flows related to future services and the contractual service
margin. The appropriation of the contractual service margin and losses (or reversals) in onerous contracts are recognized in the Operating
Income from Insurance Contracts and Private Pension, net of Reinsurance. In the Private Pension PGBL and VGBL portfolios, the contractual
service margin is recognized according to the provision of the management service and insurance risks, and in the other portfolios, recognition
is on a straight-line basis over the term of the contract.
• Asset
or Liability for Incurred Claims: represented by the fulfillment cash flows referring to services already provided, that are, amounts
pending financial settlement related to claims and other expenses incurred. Changes in the fulfillment cash flows, including those arising
from an increase in the amount recognized due to claims and expenses incurred in the period, are recognized in the Operating Income from
Insurance Contracts and Private Pension, net of Reinsurance.
ITAÚ UNIBANCO HOLDING opted for the modified
retrospective approach, using reasonable and supportable information to measure the insurance contracts and private pension in effect
on the transition date. ITAÚ UNIBANCO HOLDING used the permitted modification and opted for a single grouping of contracts
in accordance with its products and portfolios. In addition, ITAÚ UNIBANCO HOLDING estimated future cash flows on the transition
date, adjusting them with historical information prior to that date. Regarding discount rates, their averages for the period between 2015
and 2021 were considered. The insurance contractual margin was established after applying the risk adjustment for non-financial risk to
the future cash flows determined.
For portfolios of insurance contracts and private pension,
measured under the Building Block Approach - BBA, ITAÚ UNIBANCO HOLDING opted for recognizing changes in discount rates in
Other Comprehensive Income, that is, the Financial Income from Insurance Contracts and Private Pension will be segregated between Other
Comprehensive Income and income for the period, with no effect on the transition date. In the other approaches, VFA and PPA, the financial
income is fully recognized in income for the period.
(ii) Redesignation of Financial
Assets
As IFRS 17 changed the measurement of insurance contracts,
which are now recognized at the present value of the obligation, ITAÚ UNIBANCO HOLDING partially redesignated, on the transition
date and as permitted by the standard, the business model of financial instruments that were classified at Amortized Cost to Fair Value
through Other Comprehensive Income. This business model aims at maximizing the results of financial assets through sales in windows of
opportunity, in addition to the receipt of principal and interest, thus allowing for better symmetry between assets and liabilities.
| |
01/01/2022 |
|
01/01/2022
after redesignations |
| |
Classification |
Amortized
Cost |
|
Classification |
Gross
carrying amount |
Fair
value adjustments (in stockholders’ equity) |
Fair
Value |
| Securities |
|
|
|
|
|
|
|
| Brazilian
government securities |
At amortized cost |
5,371 |
|
At
fair value through other comprehensive income |
5,371 |
(260) |
5,111 |
| Reconciliation
of stockholders’ equity between IFRS 4 and IFRS 17 |
|
|
|
|
| |
06/30/2022 |
12/31/2022 |
01/01/2022 |
| |
Stockholders'
equity |
Net
income |
Stockholders'
equity |
Stockholders'
equity |
| Opening balance in accordance with IFRS
4 |
167,848 |
14,703 |
177,343 |
164,476 |
| Measurement of fulfillment cash flows
with insurance contracts and private pension portfolios (1) |
668 |
(222) |
236 |
(319) |
| Redesignation of financial assets related
to insurance contracts (2) |
(431) |
- |
(593) |
(260) |
| Deferred taxes on adjustments |
(112) |
81 |
121 |
261 |
| Total
adjustments |
125 |
(141) |
(236) |
(318) |
| Balance according to IFRS
17 |
167,973 |
14,562 |
177,107 |
164,158 |
1) Calculation of fulfillment
cash flows with contracts and contractual service margin according to the modified retrospective approach.
2) Change in the financial asset measurement model due to its redesignation with the adoption of IFRS 17. |
| Itaú
Unibanco Holding S.A. |
|
|
|
|
|
|
|
|
| Consolidated
Balance Sheet |
|
|
|
|
|
|
|
|
| (In
millions of reais) |
|
|
|
|
|
|
|
|
| Assets |
IFRS
4 |
Reclassifications
(1) |
Remeasurements
(2) |
IFRS
17 |
IFRS
4 |
Reclassifications
(1) |
Remeasurements
(2) |
IFRS
17 |
| 12/31/2022 |
12/31/2022 |
01/01/2022 |
01/01/2022 |
| Balance |
Balance |
Balance |
Balance |
| Cash |
35,381 |
- |
- |
35,381 |
44,512 |
- |
- |
44,512 |
| Financial
assets |
2,172,726 |
(1.914) |
(593) |
2,170,219 |
1,915,573 |
(1.579) |
(260) |
1,913,734 |
| At
Amortized Cost |
1,586,992 |
(8.203) |
- |
1,578,789 |
1,375,782 |
(6.950) |
- |
1,368,832 |
| At
Fair Value through Other Comprehensive Income |
121,052 |
6,289 |
(593) |
126,748 |
105,622 |
5,371 |
(260) |
110,733 |
| At
Fair Value through Profit or Loss |
464,682 |
- |
- |
464,682 |
434,169 |
- |
- |
434,169 |
| Insurance
contracts |
- |
23 |
- |
23 |
- |
68 |
- |
68 |
| Tax
assets |
59,480 |
- |
165 |
59,645 |
58,433 |
- |
261 |
58,694 |
| Income
tax and social contribution - current |
1,647 |
- |
- |
1,647 |
1,636 |
- |
- |
1,636 |
| Income
tax and social contribution - deferred |
51,469 |
- |
165 |
51,634 |
50,831 |
- |
261 |
51,092 |
| Other |
6,364 |
- |
- |
6,364 |
5,966 |
- |
- |
5,966 |
| Other
assets |
17,529 |
(55) |
- |
17,474 |
16,494 |
(53) |
- |
16,441 |
| Investments,
Fixed asseis, Goodwill and lntangible assets |
38,324 |
- |
- |
38,324 |
34,194 |
- |
- |
34,194 |
| Total
assets |
2,323,440 |
(1.946) |
(428) |
2,321,066 |
2,069,206 |
(1.564) |
1 |
2,067,643 |
| |
|
|
|
|
|
|
|
|
| Liabilities
and stockholders' equity |
IFRS
4 |
Reclassifications
(1) |
Remeasurements
(2) |
IFRS
17 |
IFRS
4 |
Reclassifications
(1) |
Remeasurements
(2) |
IFRS
17 |
| 12/31/2022 |
12/31/2022 |
01/01/2022 |
01/01/2022 |
| Balance |
Balance |
Balance |
Balance |
| Financial Liabilities |
1,836,690 |
- |
- |
1,836,690 |
1,621,786 |
- |
- |
1,621,786 |
| Insurance
contracts and private pension |
235,150 |
(1.788) |
(236) |
233,126 |
214,976 |
(1.439) |
319 |
213,856 |
| Provisions
and Other liabilities |
67,519 |
(149) |
- |
67,370 |
61,722 |
(125) |
- |
61,597 |
| Tax
liabilities |
6,738 |
(9) |
44 |
6,773 |
6,246 |
- |
- |
6,246 |
| Incarne
tax and social contribution - current |
2,950 |
- |
- |
2,950 |
2,450 |
- |
- |
2,450 |
| Incarne
tax and social contribution - deferred |
345 |
- |
- |
345 |
280 |
- |
- |
280 |
| Other |
3,443 |
(9) |
44 |
3,478 |
3,516 |
- |
- |
3,516 |
| Total
liabilities |
2,146,097 |
(1.946) |
(192) |
2,143,959 |
1,904,730 |
(1.564) |
319 |
1,903,485 |
| Total
stockholders' equity attributed to the owners of the parent company (3) |
167,953 |
- |
(236) |
167,717 |
152,864 |
- |
(318) |
152,546 |
| Non-controlling
interests |
9,390 |
- |
- |
9,390 |
11,612 |
- |
- |
11,612 |
| Total
stockholders' equity |
177,343 |
- |
(236) |
177,107 |
164,476 |
- |
(318) |
164,158 |
| Total
liabilities and stockholders' equity |
2,323,440 |
(1.946) |
(428) |
2,321,066 |
2,069,206 |
(1.564) |
1 |
2,067,643 |
1) Refer to the redesignation
of assets and liabilities related to the insurance and private pension contracts, as well as the redesignation of related financial
assets.
2) Refer to the calculation of cash flows from compliance with the portfolios of insurance and private pension contracts and adjustment
to the fair value of redesignated financial assets.
3) The effects arising from the adoption of IFRS 17 and Redesignation of Financial Assets, net of taxes, were recognized under Revenue
Reserves (R$ (815) at 12/31/2022 and R$ (319) at 01/01/2022) and Other Comprehensive Income (R$ 578 at 12/31/2022 and R$ 1 at 01/01/2022). |
• Amendments
to IAS 1 – Presentation of Financial Statements:
Information on accounting policies - requires
that only information about material accounting policies is disclosed, eliminating disclosures of information that duplicate or summarize
IFRS requirements. These amendments are effective for the years beginning January 1st, 2023 and they have no financial impacts.
• Amendments
to IAS 8 - Accounting Policies, Changes in Accounting Estimates and Errors – Include the definition of accounting estimates: monetary
amounts subject to uncertainties in their measurement. Expected credit loss and the fair value of an asset or liability are examples of
accounting estimates. This change is effective for the years beginning January 1st, 2023 and there are no impacts for the Consolidated
Financial Statements of ITAÚ UNIBANCO HOLDING.
• Amendments
to IAS 12 – Income Taxes:
Deferred taxes on leasing operations - Require that
the lessee recognizes deferred taxes arising from temporary differences generated in the initial recognition of right-of-use assets and
lease liabilities, in compliance with the tax legislation.
Pillar Two Model Rules - Introduces a temporary exception
to the recognition and disclosure of effects of the Pillar Two Model Rules issued by the Organization for Economic Cooperations and Development
(OECD), of which Brazil is not an effective member.
These amendments are effective for years beginning
January 1st, 2023 and there are no impacts on the Consolidated Financial Statements of ITAÚ UNIBANCO HOLDING.
II - Accounting standards recently issued
and applicable in future periods
• Amendments
to IAS 1 – Presentation of Financial Statements:
Segregation between Current and Non-current Liabilities
- clarifies when to consider contractual conditions (covenants) that may affect the unconditional right to defer the settlement of the
liabilities for at least 12 months after the reporting period and includes disclosure requirements for liabilities with covenants classified
as non-current. These changes are effective for fiscal years starting January 1st, 2024, with retrospective application. Analyses
regarding possible changes in disclosure will be completed by the date the standard becomes effective.
c) Critical accounting estimates and judgments
The preparation of Consolidated Financial Statements in accordance
with the IFRS requires Management to make estimates and assumptions that affect the reported amounts of assets, liabilities, and contingent liabilities
at the date of the Financial Statements, due to uncertainties and the high level of subjectivity involved in the recognition and measurement
of certain items. Estimates and judgments that present a significant risk and may have a material impact on the values of
assets and liabilities are disclosed below. Actual results may differ from those established by these estimates and judgments.
| Topic |
| Consolidation |
2c I and 3 |
| Fair value of financial instruments |
2c II and 28 |
| Effective interest rate |
2c III, 5, 8, 9 and 10 |
| Change to financial assets |
2c IV, 5, 8, 9 and 10 |
| Transfer and write-off of financial assets |
2c V, 5, 8, 9 and 10 |
| Expected credit loss |
2c VI, 8, 9, 10 and 32 |
| Goodwill impairment |
2c VII and 14 |
| Deferred income tax and social contribution |
2c VIII and 24 |
| Defined benefit pension plan |
2c IX and 26 |
| Provisions, contingencies and legal obligations |
2c X and 29 |
| Insurance and private pension contracts |
2c XI and 27 |
I - Consolidation
Subsidiaries are all those in which ITAÚ UNIBANCO
HOLDING’s involvement exposes it or entitles it to variable returns and where ITAÚ UNIBANCO HOLDING can affect
these returns through its influence on the entity. The existence of control is assessed continuously. Subsidiaries are consolidated from
the date control is established to the date on which it ceases to exist.
The consolidated financial statements are prepared using
consistent accounting policies. Intercompany asset and liability account balances, income accounts and transaction values have been eliminated.
II - Fair value of financial instruments
not traded in active markets, including derivatives
The fair value of financial instruments, including derivatives
that are not traded in active markets, is calculated by using valuation techniques based on assumptions that consider market information
and conditions. The main assumptions are: historical data and information on similar transactions. For more complex or illiquid instruments,
significant judgment is necessary to determine the model used with the selection of specific inputs and, in certain cases, evaluation
adjustments are applied to the model amount or price quoted for financial instruments that are not actively traded.
III - Effective interest rate
For the calculation of the effective interest rate,
ITAÚ UNIBANCO HOLDING estimates cash flows considering all contractual terms of the financial instrument, but without considering
future credit losses. The calculation includes all commissions paid or received between parties to the contract, transaction costs, and
all other premiums or discounts.
Interest revenue is calculated by applying the effective
interest rate to the gross carrying amount of a financial asset. In the case of purchased or originated credit impaired financial assets,
the adjusted effective interest rate is applied, taking into account the expected credit loss, to the amortized cost of the financial
asset.
IV - Modification of financial assets
The factors used to determine whether there has been substantial
modification of a contract are: evaluation if there is a renegotiation that is not part of the original contractual terms, significant change
to contractual cash flows and significant extensions of the term of the transaction due to the debtor's financial constraints, significant
changes to the interest rate and change to the currency in which the transaction is denominated.
V - Transfer and write-off of financial
assets
When there are no reasonable expectations of recovery of
a financial asset, considering historical curves, its total or partial write-off is carried out concurrently with the use of the related
allowance for expected credit loss, with no material effects on the Consolidated Statement of Income of ITAÚ UNIBANCO HOLDING.
Subsequent recoveries of amounts previously written off are accounted for as income in the Consolidated Statement of Income.
Thus, financial assets are written off, either totally or
partially, when there is no reasonable expectation of recovering a financial asset or when ITAÚ UNIBANCO HOLDING substantially
transfers all risks and benefits of ownership and said transfer is qualified to be written off.
VI - Expected credit loss
The measurement of expected credit loss requires the application
of significant assumptions and use of quantitative models. Management exercises its judgment in the assessment of the adequacy of the
expected loss amounts resulting from models and, according to its experience, makes adjustments that may result from certain client’
credit condition or temporary adjustments resulting from situations or new circumstances that have not been reflected in the modeling
yet.
The main assumptions are:
• Term
to maturity: ITAÚ UNIBANCO HOLDING considers the maximum contractual period during which it will be exposed to a financial
instrument’s credit risk. However, the estimated useful life of assets that do not have fixed maturity date is based on the period
of exposure to credit risk. Additionally, all contractual terms are taken into account when determining the expected life, including prepayment
and rollover options.
• Prospective
information: IFRS 9 requires a balanced and impartial estimate of credit loss that includes forecasts of future economic conditions.
ITAÚ UNIBANCO HOLDING uses macroeconomic forecasts and public information with projections prepared internally to determine the
impact of these estimates on the calculation of expected credit loss. The main prospective information used to determine the expected
loss is related to Selic Rate, Credit Default Swap (CDS), unemployment rate, Gross Domestic Product (GDP), wages, industrial production
and retail sales.
• Macroeconomic
scenarios: This information involves inherent risks, market uncertainties and other factors that may give rise to results different
from those expected.
• Probability-weighted
loss scenarios: ITAÚ UNIBANCO HOLDING uses weighted scenarios to determine credit loss expected over a suitable observation
horizon adequate to classification in stages, considering the projection based on economic variables.
• Determining
criteria for significant increase or decrease in credit risk: ITAÚ UNIBANCO HOLDING determines triggers (indicators) of significant
increase in the credit risk of a financial asset since its initial recognition. The migration of the financial asset to an earlier
stage occurs with a consistent reduction in credit risk, mainly characterized by the non-activation of credit deterioration triggers for
at least 6 months. Triggers are determined on
an individual or collective basis. For collective assessment
purposes, financial assets are grouped based on characteristics of shared credit risk, considering the type of instrument, credit risk
classifications, initial recognition date, remaining term, industry, among other significant factors.
VII - Goodwill impairment
The review of goodwill due to impairment reflects the Management's
best estimate for future cash flows of Cash Generating Units (CGU), with the identification of the CGU and estimate of their fair value
less costs to sell and/or value in use.
To determine this estimate, ITAÚ UNIBANCO HOLDING adopts
the discounted cash flow methodology for a period of 5 years, macroeconomic assumptions, growth rate and discount rate.
The discount rate generally reflects financial and economic
variables, such as the risk-free interest rate and a risk premium.
Cash-Generating Units or CGU groups are identified at the
lowest level at which goodwill is monitored for internal management purposes.
VIII - Deferred income tax and social
contribution
Deferred tax assets are recognized only in relation to deductible
temporary differences, tax losses and social contribution loss carryforwards for offset only to the extent that it is probable that ITAÚ
UNIBANCO HOLDING will generate future taxable profit for its use. The expected realization of deferred tax assets is based on the
projection of future taxable profits and technical studies.
IX - Defined benefit pension plans
The current amount of pension plans is obtained from actuarial
calculations, which use assumptions such as discount rate, which is appropriated at the end of each year and used to determine the present
value of estimated future cash outflows. To determine the appropriate discount rate, ITAÚ UNIBANCO HOLDING considers the interest
rates of National Treasury Notes that have maturity terms similar to the terms of the respective liabilities.
The main assumptions for Pension plan obligations are partly
based on current market conditions.
X - Provisions and contingencies
ITAÚ UNIBANCO HOLDING periodically reviews its
provisions and contingencies which are evaluated based on management´s best estimates, taking into account the opinion of legal
counsel when there is a likelihood that financial resources will be required to settle the obligations and the amounts may be reasonably
estimated.
Contingencies classified as probable losses are recognized
in the Balance Sheet under Provisions.
Contingent amounts are measured using appropriate models
and criteria that permit their measurement, despite the uncertainty inherent in timing and amounts.
XI - Insurance contracts and private pension
To estimate fulfillment cash flows and expected profitability
(contractual service margin), ITAÚ UNIBANCO HOLDING uses actuarial models and assumptions, exercising judgment mainly to establish:
(i) the aggregation of contracts; (ii) the period of service provided; (iii) discount rate; (iv) actuarial calculation models; (v) risk
adjustment for non-financial risk models and confidence levels; (vi) the group's level of profitability; and (vii) contract
coverage unit. The main assumptions used are: (i) inflow assumptions: contributions, grants, and premiums; (ii) outflow assumptions: conversion
rates into income, redemptions, cancellation rate and loss ratio; (iii) discount rate; (iv) biometric tables; and (v) risk adjustment
for non-financial risk.
Regarding the assessment components separation of an insurance
contract, the investment component that exists in ITAÚ UNIBANCO HOLDING’s private pension contracts of is highly interrelated
with the insurance component, that is, the investment component (accumulation phase) is necessary to measure the payments to be made to
the insured party (benefit granting phase).
The assumptions used in the measurement of insurance contracts
and private pension are reviewed periodically and are based on best practices and analysis of the experience of ITAÚ UNIBANCO HOLDING.
The discount rate used by ITAÚ UNIBANCO HOLDING
to bring the projected cash flows from insurance contracts and private pension to present value is obtained by building a Term Structure
of Free Interest Rates with internal modeling, which represents a set of vertices that contain the expectation of an interest rate associated
with a term (or maturity). In addition to considering the characteristics of the indexing units of each portfolio (IGPM, IPCA and TR),
the discount rate has a component that aims at reflecting the differences between the liquidity characteristics of the financial instruments
that substantiate the rates observed in the market and the liquidity characteristics of insurance contracts (a “bottom-up”
approach).
Specifically for insurance products, cash flows are projected
using the method known as the run-off triangle on a quarterly basis. For private pension plans, cash flows are projected based on assumptions
applicable to the product.
Risk adjustment for non-financial risk is obtained by resampling
based on claims data by grouping, using the Monte Carlo statistical method. Resampling is brought to present value using the discount
rate applied to future cash flows. Based on this, percentiles proportional to the confidence level are calculated, determined in an interval
between 60% and 70%, depending on the group.
Biometric tables represent the probability of death, survival
or disability of an insured party. For death and survival estimates, the latest Brazilian Market Insurer Experience tables (BR-EMS)
are used, adjusted by the criterion of development of longevity expectations of the G Scale, and for the estimates of entry into disability,
the Álvaro Vindas table is used.
The conversion rate into income reflects the historical expectation
of converting the balances accumulated by insured parties into retirement benefits, and the decision is influenced by behavioral, economic
and tax factors.
d) Summary of main accounting practices
I - Consolidation
I.I - Subsidiaries
In accordance with IFRS 10 - Consolidated Financial Statements,
subsidiaries are all entities in which ITAÚ UNIBANCO HOLDING holds control.
In the 3rd quarter of 2018, ITAÚ UNIBANCO HOLDING
started adjusting the financial statements of its subsidiaries in Argentina to reflect the effects of hyperinflation, pursuant to
IAS 29 - Financial Reporting in Hyperinflationary Economies.
| The following table shows
the main consolidated companies, which together represent over 95% of total consolidated assets, as well as the interests of ITAÚ
UNIBANCO HOLDONG in their voting capital: |
| |
|
Functional
Currency (1) |
Incorporation
Country |
Activity |
Interest
in voting capital % |
|
Interest
in total capital % |
| |
|
06/30/2023 |
12/31/2022 |
|
06/30/2023 |
12/31/2022 |
| In Brazil |
|
|
|
|
|
|
|
|
|
| Banco Itaú BBA S.A. |
|
Real |
Brazil |
Financial institution |
100.00% |
100.00% |
|
100.00% |
100.00% |
| Banco Itaú Consignado S.A. |
|
Real |
Brazil |
Financial institution |
100.00% |
100.00% |
|
100.00% |
100.00% |
| Banco Itaucard S.A. |
|
Real |
Brazil |
Financial institution |
100.00% |
100.00% |
|
100.00% |
100.00% |
| Cia. Itaú de Capitalização |
|
Real |
Brazil |
Premium Bonds |
100.00% |
100.00% |
|
100.00% |
100.00% |
| Dibens Leasing S.A. - Arrendamento Mercantil |
|
Real |
Brazil |
Leasing |
100.00% |
100.00% |
|
100.00% |
100.00% |
| Financeira Itaú CBD S.A. Crédito, Financiamento
e Investimento |
|
Real |
Brazil |
Consumer finance credit |
50.00% |
50.00% |
|
50.00% |
50.00% |
| Hipercard Banco Múltiplo S.A. |
|
Real |
Brazil |
Financial institution |
100.00% |
100.00% |
|
100.00% |
100.00% |
| Itaú Corretora de Valores S.A. |
|
Real |
Brazil |
Securities Broker |
100.00% |
100.00% |
|
100.00% |
100.00% |
| Itaú Seguros S.A. |
|
Real |
Brazil |
Insurance |
100.00% |
100.00% |
|
100.00% |
100.00% |
| Itaú Unibanco S.A. |
|
Real |
Brazil |
Financial institution |
100.00% |
100.00% |
|
100.00% |
100.00% |
| Itaú Vida e Previdência S.A. |
|
Real |
Brazil |
Pension plan |
100.00% |
100.00% |
|
100.00% |
100.00% |
| Luizacred S.A. Sociedade de Crédito, Financiamento
e Investimento |
|
Real |
Brazil |
Consumer finance credit |
50.00% |
50.00% |
|
50.00% |
50.00% |
| Redecard Instituição de Pagamento S.A. |
|
Real |
Brazil |
Acquirer |
100.00% |
100.00% |
|
100.00% |
100.00% |
| Foreign |
|
|
|
|
|
|
|
|
|
| Itaú Colombia S.A. |
|
Colombian peso |
Colombia |
Financial institution |
65.27% |
65.27% |
|
65.27% |
65.27% |
| Banco Itaú (Suisse) S.A. |
|
Swiss franc |
Switzerland |
Financial institution |
100.00% |
100.00% |
|
100.00% |
100.00% |
| Banco Itaú Argentina S.A. |
|
Argentine peso |
Argentina |
Financial institution |
100.00% |
100.00% |
|
100.00% |
100.00% |
| Banco Itaú Paraguay S.A. |
|
Guarani |
Paraguay |
Financial institution |
100.00% |
100.00% |
|
100.00% |
100.00% |
| Banco Itaú Uruguay S.A. |
|
Uruguayan peso |
Uruguay |
Financial institution |
100.00% |
100.00% |
|
100.00% |
100.00% |
| Itau Bank, Ltd. |
|
Real |
Cayman Islands |
Financial institution |
100.00% |
100.00% |
|
100.00% |
100.00% |
| Itau BBA International plc |
|
US Dollar |
United Kingdom |
Financial institution |
100.00% |
100.00% |
|
100.00% |
100.00% |
| Itau BBA USA Securities Inc. |
|
US Dollar |
United States |
Securities Broker |
100.00% |
100.00% |
|
100.00% |
100.00% |
| Banco Itaú Chile |
|
Chilean
peso |
Chile |
Financial
institution |
65.62% |
65.62% |
|
65.62% |
65.62% |
| 1) All overseas offices of
ITAÚ UNIBANCO HOLDING have the same functional currency as the parent company, except for Itaú Chile New York Branch
and Itaú Unibanco S.A. Miami Branch, which use the US dollar. |
I.II - Business combinations
In general, a business consists of an integrated set of activities
and assets that may be conducted and managed so as to provide a return, in the form of dividends, lower costs or other economic benefits,
to investors or other stockholders, members or participants. If there is goodwill in a set of activities and assets transferred, it is
presumed to be a business.
The acquisition method is used to account for business combinations,
except for those classified as under common control.
Acquisition cost is measured at the fair value of the assets
transferred, equity instruments issued and liabilities incurred or assumed at the acquisition date. Acquired assets and assumed liabilities
and contingent liabilities identifiable in a business combination are initially measured at fair value at the date of acquisition, regardless
of the existence of non-controlling interests. When the amount paid, plus non-controlling interests, is higher than the fair value of
identifiable net assets acquired, the difference will be accounted for as goodwill. On the other hand, if the difference is negative,
it will be treated as negative goodwill and the amount will be recognized directly in income.
I.III - Goodwill
Goodwill is not amortized, but its recoverable value is assessed
semiannually or when there is an indication of impairment loss using an approach that involves the identification of Cash Generating Units
(CGU) and the estimate of its fair value less the cost to sell and/or its value in use.
The breakdown of Goodwill and Intangible assets is described
in Note 14.
I.IV - Capital Transactions with non-controlling stockholders
Changes in an ownership interest in a subsidiary, which do
not result in a loss of control, are accounted for as capital transactions and any difference between the amount paid and the carrying
amount of non-controlling stockholders is recognized directly in stockholders' equity.
II - Foreign currency translation
II.I - Functional and presentation currency
The Consolidated Financial Statements of ITAÚ
UNIBANCO HOLDING are presented in Brazilian Reais, its functional and presentation currency. For each subsidiary, joint venture or investment
in associates, ITAÚ UNIBANCO HOLDING defines the functional currency as the currency of the primary economic environment
in which the entity operates.
II.II - Foreign currency operations
Foreign currency operations are translated into the functional
currency using the exchange rates prevailing on the dates of the transactions. Foreign exchange gains and losses are recognized in the
consolidated statement of income, unless they are related to cash flow hedges and hedges of net investment in foreign operations, which
are recognized in stockholders’ equity.
III - Cash and cash equivalents
Defined as cash and current accounts with banks, shown in
the Balance Sheet under the headings Cash, Interbank Deposits and Securities purchased under agreements to resell (Collateral Held) with
original maturities not exceeding 90 days.
IV - Financial assets and liabilities
Financial assets and liabilities are offset against each
other and the net amount is reported in the Balance Sheet only when there is a legally enforceable right to offset them and the intention
to settle them on a net basis, or to simultaneously realize the asset and settle the liability.
IV.I - Initial recognition and derecognition
Financial assets and liabilities are initially recognized
at fair value and subsequently measured at amortized cost or fair value.
Regular purchases and sales of financial assets are recognized
and derecognized, respectively, on the trading date.
Financial assets are partially or fully derecognized when:
• the
contractual rights to the cash flows of the financial asset expire, or
• ITAÚ
UNIBANCO HOLDING transfers the financial asset and this transfer qualifies for derecognition.
The financial liabilities are derecognized when they
are extinguished, i.e., when the obligation specified in the contract is discharged, cancelled or expires.
Derecognition of financial assets
Financial assets are derecognized when ITAÚ UNIBANCO
HOLDING substantially transfers all risks and benefits of its property. In the event it is not possible to identify the transfer
of all risks and benefits, the control should be assessed to determine the continuous involvement related to the transaction.
If there is a retention of risks and benefits, the financial
asset continues to be recorded and a liability is recognized for the consideration received.
IV.II Classification and subsequent measurement
of financial assets
Financial assets are classified in the following categories:
• Amortized
cost: used when financial assets are managed to obtain contractual cash flows, consisting solely of payments of principal and interest.
• Fair
value through other comprehensive income: used when financial assets are held both for obtaining contractual cash flows, consisting solely
of payments of principal and interest, and for sale.
• Fair
value through profit or loss: used for financial assets that do not meet the aforementioned criteria.
The classification and subsequent measurement of financial
assets depend on:
• The
business model under which they are managed.
• The
characteristics of their cash flows (Solely Payment of Principal and Interest Test – SPPI Test).
Business model: represents how financial assets are
managed to generate cash flows and does not depend on the Management’s intention regarding an individual instrument. Financial assets
may be managed with the purpose of: i) obtaining contractual cash flows; ii) obtaining contractual cash flows and sale; or iii) others.
To assess business models, ITAÚ UNIBANCO HOLDING considers risks that affect the performance of the business model; how the
managers of the business are compensated; and how the performance of the business model is assessed and reported to Management.
When a financial asset is subject to business models i) or
ii) the application of the SPPI Test is required.
SPPI Test: assessment of cash flows generated by a
financial instrument for the purpose of checking whether they represent solely payments of principal and interest. To fit into this concept,
cash flows should include only consideration for the time value of money and credit risk. If contractual terms introduce risk exposure
or cash flow volatilities, such as exposure to changes in prices of equity instruments or prices of commodities, the financial asset is
classified at fair value through profit or loss. Hybrid contracts must be assessed as a whole, including all embedded characteristics.
The accounting of a hybrid contract that contains an embedded derivative is performed on a joint basis, i.e. the whole instrument is measured
at fair value through profit or loss.
Amortized cost
Amortized cost is the amount at which the financial asset
or liability is measured at initial recognition, plus adjustments made under the effective interest method, less repayments of principal
and interest, and any provision for expected credit loss.
Fair value
Fair value is the price that would be received for the sale
of an asset or that would be paid for the transfer of a liability in an orderly transaction between market participants on the measurement
date.
ITAÚ UNIBANCO HOLDING classifies the fair value
hierarchy according to the relevance of data observed in the measurement process.
Details of the fair value of financial instruments, including
Derivatives, and of the hierarchy of fair value are given in Note 28.
The adjustment to fair value of financial assets and liabilities
is recognized:
• In
stockholders' equity for financial assets and liabilities measured at fair value through other comprehensive income.
• In
the Consolidated Statement of Income, under the heading Income of Financial Assets and Liabilities at Fair Value through Profit or Loss,
for the other financial assets and liabilities.
Average cost is used to determine the gains and losses realized
on disposal of financial assets at fair value, which are recorded in the Consolidated Statement of Income as Interest and similar income
and Income of Financial Assets and Liabilities at Fair Value through Profit or Loss. Dividends on assets at fair value through other comprehensive
income are recognized in the Consolidated Statement of Income as Interest and similar income when it is probable that ITAÚ UNIBANCO
HOLDING 's right to receive such dividends is assured.
Equity instruments
An equity instrument is any contract that evidences a residual
interest in an entity’s assets, after the deduction of all its liabilities, such as Shares and Units.
ITAÚ UNIBANCO HOLDING subsequently measures all
its equity instruments at fair value through profit or loss, except when Management opts, on initial recognition, to irrevocably designate
an equity instrument at fair value through other comprehensive income when it is held for a purpose other than only generating returns.
When this option is selected, gains and losses on the fair value of the instrument are recognized in the Consolidated Statement of Comprehensive
Income and are not subsequently reclassified to the Consolidated Statement of Income, even on sale. Dividends continue to be recognized
in the Consolidated Statement of Income as Interest and similar income, when ITAÚ UNIBANCO HOLDING’s right to receive them
is assured.
Gains and losses on equity instruments measured at fair value
through profit or loss are recorded in the Consolidated Statement of Income.
Expected credit loss
ITAÚ UNIBANCO HOLDING makes a forward-looking
assessment of the expected credit loss on financial assets measured at amortized cost or through other comprehensive income, loan commitments
and financial guarantee contracts:
• Financial
assets: loss is measured at present value of the difference between contractual cash flows and the cash flows that ITAÚ
UNIBANCO HOLDING expects to receive.
• Loan
commitments: expected loss is measured at present value of the difference between contractual cash flows that would be due if the
commitment was drawn down and the cash flows that ITAÚ UNIBANCO HOLDING expects to receive.
• Financial
guarantees: the loss is measured at the difference between the payments expected for refunding the counterparty and the amounts that
ITAÚ UNIBANCO HOLDING expects to recover.
ITAÚ UNIBANCO HOLDING applies a three-stage approach
to measuring the expected credit loss, in which financial assets migrate from one stage to the other in accordance with changes in credit
risk.
• Stage
1 – 12-month expected credit loss: represents default events possible within 12 months. Applicable to financial assets which are
not credit impaired when purchased or originated.
• Stage
2 – Lifetime expected credit loss of financial instrument: considers all possible default events. Applicable to financial assets
originated which are not credit impaired when originated or purchased but for which credit risk has increased significantly.
• Stage
3 – Credit loss expected for credit-impaired assets: considers all possible default events. Applicable to financial assets which
are credit impaired when purchased or originated. The measurement of assets classified in this stage is different from Stage 2 due to
the recognition of interest income by applying the effective interest rate to amortized cost (net of provision) rather than to the gross
carrying amount.
An asset will migrate between stages as its credit risk increases
or decreases. Therefore, a financial asset that migrated to stages 2 and 3 may return to stage 1, unless it was purchased or originated
as a credit impaired financial asset.
Macroeconomic scenarios
Forward-looking information is based on macroeconomic scenarios
that are reassessed annually or when market conditions so require. Additional information is described in Note 32.
Modification of contractual cash flows
When contractual cash flows of a financial asset are renegotiated
or otherwise modified and this does not substantially change its terms and conditions, ITAÚ UNIBANCO HOLDING does not derecognize
it. However, the gross carrying amount of this financial asset is recalculated as the present value of the renegotiated or changed contractual
cash flows, discounted at the original effective interest rate and a modification gain or loss is recognized in profit or loss. Any costs
or fees incurred adjust the modified carrying amount and are amortized over the remaining term of the financial asset.
If, on the other hand, the renegotiation or change substantially
modifies the terms and conditions of the financial asset, ITAÚ UNIBANCO HOLDING derecognizes the original asset and recognizes
a new one. Accordingly, the renegotiation date is taken as the initial recognition date of the new asset for expected credit loss calculation
purposes, and to determine significant increases in credit risk.
ITAÚ UNIBANCO HOLDING also assesses if the new
financial asset may be considered as a purchased or originated credit impaired financial asset, particularly when the renegotiation was
motivated by the debtor’s financial constraints. Differences between the carrying amount of the original asset and fair value of
the new asset are immediately recognized in the Consolidated Statement of Income.
The effects of changes in cash flows of financial assets
and other details about methodologies and assumptions adopted by Management to measure the allowance for expected credit loss, including
the use of prospective information, are detailed in Note 32.
IV.III - Classification and subsequent
measurement of financial liabilities
Financial liabilities are subsequently measured at amortized
cost, except for:
• Financial
liabilities at fair value through profit or loss: this classification applied to derivatives and other financial liabilities designated
at fair value through profit or loss to reduce “accounting mismatches”. ITAÚ UNIBANCO HOLDING irrevocably designates
financial liabilities at fair value through profit or loss in the initial recognition (fair value option), when the option eliminates
or significantly reduces measurement or recognition inconsistencies.
• Loan
commitments and financial guarantees: see details in Note 2d IV.VlIl.
Modification of financial liabilities
A debt instrument change or substantial terms modification
of a financial liability is accounted as a derecognition of the original financial liability and a new one is recognized.
A substantial change to contractual terms occurs when the
discounted present value of cash flows under the new terms, including any fees paid/received and discounted using the original effective
interest rate, is at least 10% different from discounted present value of the remaining cash flow of the original financial liabilities.
IV.IV - Securities purchased under agreements
to resell
ITAÚ UNIBANCO HOLDING purchases financial assets
with a resale commitment (resale agreements) and sells securities with a repurchase commitment (repurchase agreement) of financial assets.
Resale and repurchase agreements are accounted for under Securities purchased under agreements to resell and Securities sold under repurchase
agreements, respectively.
The difference between the sale and repurchase prices is
treated as interest and recognized over the life of the agreements using the effective interest rate method.
The financial assets taken as collateral in resale agreements
can be used as collateral for repurchase agreements if provided for in the agreements or can be sold.
IV.V - Derivatives
All derivatives are accounted for as financial assets when
the fair value is positive and as financial liabilities when the fair value is negative.
The valuation of active hybrid contracts that are subject
to IFRS 9 is carried out as a whole, including all embedded characteristics, whereas the accounting is carried out on a joint basis, i.e.
each instrument is measured at fair value through profit or loss.
When a contract has a main component outside the scope of
IFRS 9, such as a lease agreement receivable or an insurance contract, or even a financial liability, embedded derivatives are treated
as separate financial instruments if:
• Their
characteristics and economic risks are not closely related to those of the main component.
• The
separate instrument meets the definition of a derivative.
• The
underlying instrument is not booked at fair value through profit or loss.
These embedded derivatives are accounted for separately at
fair value, with variations recognized in the Consolidated Statement of Income as Adjustments to Fair Value of Financial Assets and Liabilities.
ITAÚ UNIBANCO HOLDING will continue applying all the
hedge accounting requirements of IAS 39; however, it may adopt the provisions of IFRS 9, if Management so decides.
According to this standard, derivatives may be designated
and qualified as hedging instruments for accounting purposes and, the method for recognizing gains or losses of fair value will depending
on the nature of the hedged item.
At the beginning of a hedging transaction, ITAÚ
UNIBANCO HOLDING documents the relationship between the hedging instrument and the hedged items, as well as its risk management objective
and strategy. The hedge is assessed on an ongoing basis to determine if it has been highly effective throughout all periods of the
Financial Statements for which it was designated.
IAS 39 describes three hedging strategies: fair value hedge,
cash flow hedge, and hedge of net investments in a foreign operation. ITAÚ UNIBANCO HOLDING uses derivatives as hedging
instruments under all three hedge strategies, as detailed in Note 7.
Fair value hedge
The following practices are adopted for these operations:
• The
gain or loss arising from the remeasurement of the hedging instrument at fair value is recognized in income.
• The
gain or loss arising from the hedged item, attributable to the effective portion of the hedged risk, is applied to the book value of the
hedged item and is also recognized in income.
When a derivative expires or is sold or a hedge no longer
meets the hedge accounting criteria or in the event the designation is revoked, the hedge accounting must be prospectively discontinued.
In addition, any adjustment to the book value of the hedged item must be amortized in income.
Cash flow hedge
For derivatives that are designated and qualify as hedging
instruments in a cash flow hedge, the practices are:
• The
effective portion of gains or losses on derivatives is recognized directly in Other comprehensive income – Cash flow hedge.
• The
portion of gain or loss on derivatives that represents the ineffective portion or on hedge components excluded from the assessment of
effectiveness is recognized in income.
Amounts originally recorded in Other comprehensive income
and subsequently reclassified to Income are recognized in the caption Income of financial assets and Liabilities at fair value through
profit or loss at the same time that the corresponding income or expense item of the financial hedge item affects income. For non-financial
hedge items, the amounts originally recognized in Other comprehensive income are included in the initial cost of the corresponding asset
or liability.
When a derivative expires or is sold, when hedge accounting
criteria are no longer met or when the entity revokes the hedge accounting designation, any cumulative gain or loss existing in Other
comprehensive income will be reclassified to income at the time the expected transaction occurs or is no longer expected to occur.
Hedge of net investments in foreign operations
The hedge of a net investment in a foreign operation, including
the hedge of a monetary item that is booked as part of the net investment, is accounted for in a manner similar to a cash flow hedge:
• The
portion of gain or loss on the hedging instrument determined as effective is recognized in Other comprehensive income.
• The
ineffective portion is recognized in income.
Gains or losses on the hedging instrument related to the
effective portion of the hedge which are recognized in Other comprehensive income are reclassified to income for the period when the foreign
operation is partially or totally sold.
IV.VI - Loan operations
ITAÚ UNIBANCO HOLDING classifies a loan as non-performing
if the payment of the principal or interest has been overdue for 60 days or more. In this case, accrual of interest is no longer recognized.
IV.VII - Premium bonds plans
In Brazil, Premium bonds plans are regulated by the insurance
regulator. These plans do not meet the definition of an insurance contract under IFRS 17, and therefore they are classified as a financial
liability at amortized cost under IFRS 9.
Revenue from premium bonds plans is recognized during the
period of the contract and measured as the difference between the amount deposited by the customer and the amount that ITAÚ UNIBANCO
HOLDING has to reimburse.
IV.VIII - Loan commitments and financial
guarantees
ITAÚ UNIBANCO HOLDING recognizes as an obligation
in the Balance Sheet, on the issue date, the fair value of commitments for loans and financial guarantees. The fair value is generally
represented by the fee charged to the customer. This amount is amortized over the term of the instrument and is recognized in the Statement
of Income under the heading Commissions and Banking Fees.
After issue, if ITAÚ UNIBANCO HOLDING concludes
based on the best estimate, that the expected credit loss in relation to the guarantee issued is higher than the fair value less accumulated
amortization, this amount is replaced by a provision for loss.
V - Investments in associates and joint
ventures
V.I - Associates
Associates are companies in which the investor has a significant
influence but does not hold control. Investments in these companies are initially recognized at cost of acquisition and subsequently accounted
for using the equity method. Investments in associates and joint ventures include the goodwill identified upon acquisition, net of any
cumulative impairment loss.
V.II - Joint ventures
ITAÚ UNIBANCO HOLDING has joint ventures whereby
the parties that have joint control of the arrangement have rights to the net assets.
ITAÚ UNIBANCO HOLDING’s share in profits or
losses of its associates and joint ventures after acquisition is recognized in the Consolidated statement of income. Its share of the
changes in the share in other comprehensive income of corresponding stockholders’ equity of its associates and joint ventures is
recognized in its own capital reserves. The cumulative changes after acquisition are adjusted against the carrying amount of the investment.
When the ITAÚ UNIBANCO HOLDING’s share of losses in associates and joint ventures is equal to or more than the value of its
interest, including any other receivables, ITAÚ UNIBANCO HOLDING does not recognize additional losses, unless it has incurred
any obligations or made payments on behalf of the associates and joint ventures.
Unrealized profits on transactions between ITAÚ UNIBANCO
HOLDING and its associates and joint ventures are eliminated to the extent of the interest of ITAÚ UNIBANCO HOLDING.
Unrealized losses are also eliminated, unless the transaction provides evidence of impairment of the transferred asset. The accounting
policies on associates and joint ventures entities are changed, as necessary, to ensure consistency with the policies adopted by ITAÚ
UNIBANCO HOLDING.
If its interest in the associates and joint ventures decreases,
but ITAÚ UNIBANCO HOLDING retains significant influence or joint control, only the proportional amount of the previously
recognized amounts in Other comprehensive income is reclassified in Income, when appropriate.
VI - Lease operations (Lessee)
ITAÚ UNIBANCO HOLDING leases mainly real estate
properties (underlying assets) to carry out its business activities. The initial recognition occurs when the agreement is signed, in the
heading Other Liabilities, which corresponds to the total future payments at present value as a counterparty to the right-of-use assets,
depreciated under the straight-line method for the lease term and tested semiannually to identify possible impairment losses.
The financial expense corresponding to interest on lease
liabilities is recognized in the heading Interest and Similar Expense in the Consolidated Statement of Income.
VII - Fixed assets
Fixed assets are booked at their acquisition cost less accumulated
depreciation, and adjusted for impairment, if applicable. Depreciation is calculated on the straight-line method using rates based on
the estimated useful lives of these assets. Such rates and other details are presented in Note 13.
The residual values and useful lives of assets are reviewed
and adjusted, if appropriate, at the end of each period.
ITAÚ UNIBANCO HOLDING reviews its assets in order
to identify indications of impairment in their recoverable amounts. The recoverable amount of an asset is defined as the higher of its
fair value less the cost to sell and its value in use. For the purposes of assessing impairment, assets are grouped at the lowest level
for which independent cash flows can be identified (cash-generating units). The assessment may be made at an individual asset level when
the fair value less the cost to sell can be reliably determined.
Gains and losses on disposals of fixed assets are recognized
in the Consolidated statement of income under Other income or General and administrative expenses.
VIII - Intangible assets
Intangible assets are non-physical assets, including software
and other assets, and are initially recognized at cost. Intangible assets are recognized when they arise from legal or contractual rights,
their costs can be reliably measured, and in the case of intangible assets not arising from separate acquisitions or business combinations,
it is probable that future economic benefits may arise from their use. The balance of intangible assets refers to acquired assets or those
internally generated.
Intangible assets may have definite or indefinite useful
lives. Intangible assets with definite useful lives are amortized using the straight-line method over their estimated useful lives. Intangible
assets with indefinite useful lives are not amortized, but periodically tested in order to identify any impairment.
ITAÚ UNIBANCO HOLDING semiannually assesses its
intangible assets in order to identify whether any indications of impairment exist, as well as possible reversal of previous impairment
losses. If such indications are found, intangible assets are tested for impairment. The recoverable amount of an asset is defined as the
higher of its fair value less the cost to sell and its value in use. For the purposes of assessing impairment, assets are grouped at the
lowest level for which independent cash flows can be identified (cash-generating units). The assessment may be made at an individual asset
level when the fair value less the cost to sell can be reliably determined.
ITAÚ UNIBANCO HOLDING uses the cost model to
measure its intangible assets after its initial recognition.
The breakdown of Goodwill and Intangible assets is described
in Note 14.
IX - Assets held for sale
Assets held for sale are recognized in the balance sheet
under the heading Other assets when they are actually repossessed or there is intention to sell. These assets are initially recorded
at the lower of: (i) the fair value of the asset less the estimated selling expenses, or (ii) the carrying amount of the related asset
held for sale.
X - Income tax and social contribution
There are two components of the provision for income tax
and social contribution: current and deferred.
The current component is approximately the total of taxes
to be paid or recovered during the reporting period.
Deferred income tax and social contribution, represented
by deferred tax assets and liabilities, is obtained based on the differences between the tax bases of assets and liabilities and the amounts
reported at the end of each period.
The income tax and social contribution expense is recognized
in the Consolidated statement of income under Income tax and social contribution, except when it refers to items directly recognized in
Other comprehensive income, such as: tax on fair value of financial assets measured at fair value through Other comprehensive income,
post-employment benefits and tax on cash flow hedges and hedges of net investment in foreign operations. Subsequently, these items are
recognized in income upon realization of the gain/loss on the instruments.
Changes in tax legislation and rates are recognized in the
Consolidated statement of income in the period in which they are enacted. Interest and fines are recognized in the Consolidated statement
of income under General and administrative expenses.
To determine the proper level of provisions for taxes to
be maintained for uncertain tax positions, the approach applied, is that a tax benefit is recognized if it is more likely than not that
a position can be sustained, under the assumptions for recognition, detailed in item 2d XIV.
XI - Insurance contracts and private pension
To measure the groups of insurance contracts and private
pension, ITAÚ UNIBANCO HOLDING will use the three measurement approaches below, considering the characteristics of the contracts:
• Standard
Model (Building Block Approach - BBA): insurance contracts without direct participation feature with coverage longer than 1 year or
that are onerous. The Insurance portfolio basically includes Life, Health, Credit Life and Housing, the first two of which are onerous.
The Private Pension portfolio includes Traditional Plans and Death and Disability Risk Coverage Plans, the former being onerous. Insurance
contracts and private pension classified as onerous are not actively sold, and the contractual conditions of the life insurance contracts
in force are different and classified as profitable.
• Variable
Fee Approach (VFA): PGBL and VGBL private pension plans, whose contributions are remunerated at the fair value of the investment fund
specially organized in which the funds are invested.
• Simplified
Model (Premium Allocation Approach - PAA): insurance contracts and reinsurance contracts held, whose coverage periods are equal to
or less than one year, comprising mainly: Personal Accidents and Protected Card. As these are short-term contracts, Liability for Remaining
Coverage are not discounted at present value. However, the cash flows of Liability for Incurred Claims are discounted at present value
and adjusted to reflect non-financial risks, since they have payments that are made one year after a claim occurs.
XII - Post-employment benefits
ITAÚ UNIBANCO HOLDING sponsors Defined Benefit Plans
and Defined Contribution Plans, which are accounted for in accordance with IAS 19 – Benefits to Employees.
ITAÚ UNIBANCO HOLDING is required to make contributions
to government social security and labor indemnity plans, in Brazil and in other countries where it operates.
Pension plans - Defined benefit plans
The liability or asset, as the case may be, recognized in
the Balance Sheet with respect to a defined benefit plan, corresponds to the present value of defined benefit obligations at the balance
sheet date less the fair value of plan assets. The defined benefit obligations are calculated annually using the projected unit credit
method.
Pension plans - Defined contribution
For defined contribution plans, contributions to plans made
by ITAÚ UNIBANCO HOLDING, through pension plan funds, are recognized as liabilities, with a counterparty to expenses, when due.
If contributions made exceed the liability for a service provided, it will be accounted for as an asset recognized at fair value, and
any adjustments are recognized in Stockholders’ equity, under Other comprehensive income, in the period when they occur.
Other post-employment obligations
Like defined benefit pension plans, these obligations are
assessed annually by actuarial specialists, and costs expected from these benefits are accrued over the period of employment. Gains and
losses arising from changes in practices and variations in actuarial assumptions are recognized in Stockholders’ equity, under Other
comprehensive income, in the period in which they occur.
XIII - Share-based payments
Share-based payments are booked for the value of equity instruments
granted based on their fair value at the grant date. This cost is recognized during the vesting period of the instruments right.
The total amount to be expensed is determined by reference
to the fair value of the equity instruments excluding the impact of any service commissions and fees and non-market performance vesting
conditions (in particular when an employee remains with the company for specific period of time).
XIV - Provisions, contingent assets and
contingent liabilities
These are possible rights and potential obligations arising
from past events for which realization depends on uncertain future events.
Contingent assets are not recognized in the Financial Statements,
except when the Management of ITAÚ UNIBANCO HOLDING considers that realization is practically certain. In general they
correspond to lawsuits with favorable outcomes in final and unappealable judgments and to the withdrawal of lawsuits as a result of a
settlement payment received or an agreement for set-off against an existing liability.
These contingencies are evaluated based on Management’s
best estimates, and are classified as:
• Probable:
in which liabilities are recognized in the balance sheet under Provisions.
• Possible:
which are disclosed in the Financial Statements, but no provision is recorded.
• Remote:
which require neither a provision nor disclosure.
The amount of deposits in guarantee is adjusted in accordance
with current legislation.
XV - Capital
Common and preferred shares, which for accounting purposes
are equivalent to common shares but without voting rights are classified in Stockholders’ equity. The additional costs directly
attributable to the issue of new shares are included in Stockholders’ equity as a deduction from the proceeds, net of taxes.
XVI - Treasury shares
Common and preferred shares repurchased are recorded in Stockholders’
equity under Treasury shares at their average purchase price.
Shares that are subsequently sold, such as those sold to
grantees under ITAÚ UNIBANCO HOLDING's share-based payment scheme, are recorded as a reduction in treasury shares, measured
at the average price of treasury stock held at that date.
The difference between the sale price and the average price
of the treasury shares is recorded as a reduction or increase in Capital Reserves. The cancellation of treasury shares is recorded as
a reduction in Treasury shares against Capital Reserves, at the average price of treasury shares at the cancellation date.
XVII - Dividends and interest on capital
Minimum dividend amounts established in the bylaws are recorded
as liabilities at the end of each year. Any other amount above the mandatory minimum dividend is accounted for as a liability when approved
by of the Board of Directors.
Interest on capital is treated for accounting purposes as
a dividend, and it is presented as a reduction of stockholders' equity in the consolidated financial statements.
Dividends have been and continue to be calculated and paid
on the basis of the financial statements prepared under Brazilian accounting standards and regulations for financial institutions, not
these Consolidated financial statements prepared according to the IFRS.
Dividends and interest on capital are presented in Note 19.
XVIII - Earnings per share
ITAÚ UNIBANCO HOLDING grants stock options whose
dilutive effect is reflected in diluted earnings per share, with the application of the “treasury stock method", whereby
earnings per share are calculated as if all the stock options had been exercised and the proceeds used to purchase shares of ITAÚ
UNIBANCO HOLDING.
Earnings per share are presented in Note 25.
XIX - Segment information
Segment information disclosed is consistent with the internal
reports prepared for the Executive Committee which makes the operational decisions ITAÚ UNIBANCO HOLDING.
ITAÚ UNIBANCO HOLDING has three reportable segments:
(i) Retail Business, (ii) Wholesale Business and (iii) Market + Corporation.
Segment information is presented in Note 30.
XX - Commissions and Banking Fees
Commissions and Banking Fees are recognized when ITAÚ
UNIBANCO HOLDING provides or offers services to customers, in an amount that reflects the consideration ITAÚ UNIBANCO
HOLDING expects to collect in exchange for those services. A five-step model is applied to account for revenues: i) identification
of the contract with a customer; ii) identification of the performance obligations in the contract; iii) determination of the transaction
price; iv) allocation of the transaction price to the performance obligations in the contract; and v) revenue recognition, when performance
obligations agreed upon in agreements with clients are met. Incremental costs and costs to fulfill agreements with clients are recognized
as an expense as incurred.
The main services provided by ITAÚ UNIBANCO HOLDING
are:
• Credit
and debit cards: refer mainly to fees charged by card issuers and acquirers for processing card transactions, annuities charged for
the availability and management of credit card; and the rental of Rede machines.
• Current
account services: substantially composed of current account maintenance fees, according to each service package granted to the customer;
transfers carried through PIX (Central Bank of Brazil's instant payments system) in corporate packages, withdrawals from demand deposit
account and money order.
• Economic,
Financial and Brokerage Advisory: refer mainly to financial transaction structuring services, placement of securities and intermediation
of operations on stock exchanges.
Service revenues related to credit, debit, current account
and economic, financial and brokerage advisory cards are recognized when said services are provided.
• Funds
management: refers to fees charged for the management and performance of investment funds and consortia administration.
• Credit
operations and financial guarantees provided: refer mainly to advance depositor fees, asset appraisal service and commission on guarantees
provided.
• Collection
services: refer to collection and charging services.
Revenue from certain services, such as fees from funds management,
collection and custody, are recognized over the life of the respective agreements, as services are provided.
Note 3 - Business development
Banco Itaú Chile
ITAÚ CHILE is controlled as of April 1st,
2016 by ITAÚ UNIBANCO HOLDING. On the same date, ITAÚ UNIBANCO HOLDING entered into a shareholders’ agreement with
Corp Group, which set forth, among others, the right of ITAÚ UNIBANCO HOLDING and Corp Group to appoint members for the Board of
Directors of ITAÚ CHILE in accordance with their interests in capital stock, and this group of shareholders had the right to appoint
the majority of members of the Board of Directors of ITAÚ CHILE and ITAÚ UNIBANCO HOLDING had the right to appoint
the majority of members elected by this block.
At the Extraordinary Stockholders' Meeting of ITAÚ
CHILE held on July 13, 2021, the capital increase of ITAÚ CHILE in the total amount of CLP 830 billion was approved, through the
issuance of 461,111,111,111 shares, which were fully subscribed, paid in and settled in October and November 2021, after regulatory approvals.
ITAÚ UNIBANCO HOLDING subscribed the total of 350,048,242,004 shares for the amount of CLP 630 billion (approximately R$ 4,296),
then holding 56.60% of the capital of ITAÚ CHILE.
On March 22, 2022, ITAÚ UNIBANCO HOLDING, through
its subsidiary CGB II SPA, sold 0.64% (6,266,019,265 shares) of its interest in ITAÚ CHILE for the amount of R$ 64 (CLP
9,912 million), then holding 55.96%.
On July 14, 2022, ITAÚ UNIBANCO HOLDING received,
through its affiliates, shares issued by ITAÚ CHILE within the scope of the debt restructuring of companies of the Corp Group,
as approved by the court-supervised reorganization proceeding in the United States (Chapter 11). Accordingly, the equity interest increased to
65.62% and the stockholders’ agreement of ITAÚ CHILE was fully terminated.
Itaú Colombia
S.A.
ITAÚ UNIBANCO
HOLDING, through its subsidiaries Banco Itaú Chile (ITAÚ CHILE) and Itaú Holding Colombia S.A.S., acquired additional
ownership interest of 12.36% (93,306,684 shares) in Itaú Colombia S.A.'s capital for the amount of R$ 2,219.
The effective acquisitions
and financial settlements occurred on February 22, 2022, after obtaining the regulatory authorizations.
Non-controlling interest in XP Inc.
During 2020 and 2021, ITAÚ UNIBANCO HOLDING carried
out the partial spin-off of the investment held in XP Inc. (XP INC) to a new company (XPart S.A.) which was subsequently merged into XP
INC on October 1, 2021.
On April 29, 2022, as set forth in the original agreement
entered into in May 2017 and after approval by BACEN and regulatory bodies abroad, ITAÚ UNIBANCO HOLDING, through its subsidiary
ITB Holding Brasil Participações Ltda., acquired a minority interest equivalent to 11.36% of XP INC’s capital, for
the amount of R$ 8,015, and these shares were designated at Fair Value through Other Comprehensive Income.
On June 7 and 9, 2022, shares were sold equivalent to 1.40%
of XP INC’s capital, for the amount of R$ 867 and their fair value of R$ 901.
In April 2023, XP INC cancelled treasury shares, resulting
in an increase in ITAÚ UNIBANCO HOLDING's ownership interest to 10.54% of XP INC's capital. And, on June 26, 2023,
shares equivalent to 1.89% of the XP INC's capital were sold for the amout of R$ 1,068 and their fair value of
R$ 1,121.
Acquisition of Ideal Holding Financeira S.A.
On January 13, 2022, ITAÚ UNIBANCO HOLDING,
through its subsidiary Itaú Corretora de Valores S.A., entered into a purchase and sale agreement of up to 100% of capital
of Ideal Holding Financeira S.A. (IDEAL). The purchase will be carried out in two phases over five years. In the first phase, ITAÚ
UNIBANCO HOLDING acquired 50.1% of IDEAL’s total voting capital for R$ 700, starting to hold control of the company. In
the second phase, after five years, ITAÚ UNIBANCO HOLDING may exercise the right to purchase the remaining ownership
interest, in order to reach 100% of IDEAL’s capital.
IDEAL is a 100% digital broker and currently offers electronic
trading and DMA (direct market access) solutions, within a flexible and cloud-based platform.
The management and development of IDEAL's business will continue
to be autonomous in relation to ITAÚ UNIBANCO HOLDING, according to the terms and conditions of the Shareholders' Agreement for
this transaction and ITAÚ UNIBANCO HOLDING will not have exclusivity in the provision of services.
The effective acquisitions and financial settlements occured
on March 31, 2023, after the required regulatory approvals are received.
Zup I.T. Serviços em Tecnologia e Inovação S.A.
ITAÚ UNIBANCO HOLDING, through its controlled company
Redecard Instituição de Pagamento S.A. (REDE), acquired, in the period, an additional ownership interest of 20.57%
(2,228,342 shares) in the capital of Zup I.T. Serviços em Tecnologia e Inovação S.A. (ZUP) for the amount of R$ 199.
The purchase and sale agreement, entered into on October 31, 2019, sets forth the acquisition of 100% of the ZUP's capital in
three phases; the first phase, which granted the control acquisition, was performed in March 2020. After the acquisitions in the period, ITAÚ
UNIBANCO HOLDING's final ownership interest in ZUP's total capital is 72.51%. The last phase is scheduled for 2024.
The effective acquisitions and financial settlements occurred
on May 31 and June 14, 2023 after the necessary regulatory authorizations were obtained.
Note 4 - Interbank deposits and securities
purchased under agreements to resell
| |
06/30/2023 |
|
12/31/2022 |
| |
Current |
Non-current |
Total |
|
Current |
Non-current |
Total |
| Securities purchased under agreements to resell (1) |
216,917 |
29 |
216,946 |
|
221,726 |
50 |
221,776 |
| Collateral held |
80,137 |
29 |
80,166 |
|
69,870 |
50 |
69,920 |
| Collateral repledge |
103,364 |
- |
103,364 |
|
128,542 |
- |
128,542 |
| Assets received as collateral with right to sell or repledge |
5,209 |
- |
5,209 |
|
14,846 |
- |
14,846 |
| Assets received as collateral without right to sell or repledge |
98,155 |
- |
98,155 |
|
113,696 |
- |
113,696 |
| Collateral sold |
33,416 |
- |
33,416 |
|
23,314 |
- |
23,314 |
| Interbank deposits |
45,106 |
8,213 |
53,319 |
|
56,672 |
2,914 |
59,586 |
| Total (2) |
262,023 |
8,242 |
270,265 |
|
278,398 |
2,964 |
281,362 |
1) The amounts of R$ 7,915 (R$ 14,576 at 12/31/2022) are pledged in guarantee of operations on B3 S.A. - Brasil, Bolsa, Balcão (B3) and Central Bank of Brazil and the amounts of R$ 136,780 (R$ 151,856 at 12/31/2022) are pledged in guarantee of repurchase commitment transactions.
2) Includes losses in the amounts of R$ (21) (R$ (9) at 12/31/2022). |
Note 5 - Financial assets at fair value
through profit or loss and designated at fair value through profit or loss - Securities
a) Financial assets at fair value through
profit or loss - Securities
| |
06/30/2023 |
|
12/31/2022 |
| |
Cost |
Adjustments to Fair Value (in Income) |
Fair value |
|
Cost |
Adjustments to Fair Value (in Income) |
Fair value |
| Investment funds |
23,870 |
(462) |
23,408 |
|
33,011 |
(520) |
32,491 |
| Brazilian government securities (1) |
309,494 |
1,303 |
310,797 |
|
230,924 |
(572) |
230,352 |
| Government securities – abroad (1) |
10,803 |
(48) |
10,755 |
|
8,007 |
10 |
8,017 |
| Argentina |
1,569 |
(51) |
1,518 |
|
669 |
4 |
673 |
| Chile |
3,794 |
- |
3,794 |
|
1,648 |
(1) |
1,647 |
| Colombia |
679 |
48 |
727 |
|
844 |
6 |
850 |
| United States |
2,533 |
(47) |
2,486 |
|
612 |
(2) |
610 |
| Israel |
456 |
4 |
460 |
|
852 |
8 |
860 |
| Mexico |
24 |
(2) |
22 |
|
15 |
(2) |
13 |
| Paraguay |
35 |
- |
35 |
|
40 |
- |
40 |
| Peru |
6 |
(1) |
5 |
|
7 |
(1) |
6 |
| Switzerland |
1,399 |
1 |
1,400 |
|
3,059 |
(1) |
3,058 |
| Uruguay |
308 |
- |
308 |
|
261 |
(1) |
260 |
| Corporate securities (1) |
125,591 |
(3,984) |
121,607 |
|
117,572 |
(4,893) |
112,679 |
| Shares |
25,592 |
(755) |
24,837 |
|
16,931 |
(1,394) |
15,537 |
| Rural product note |
1,955 |
5 |
1,960 |
|
2,484 |
33 |
2,517 |
| Bank deposit certificates |
246 |
- |
246 |
|
360 |
- |
360 |
| Real estate receivables certificates |
1,611 |
(70) |
1,541 |
|
1,580 |
(100) |
1,480 |
| Debentures |
70,166 |
(3,066) |
67,100 |
|
66,223 |
(3,281) |
62,942 |
| Eurobonds and other |
2,690 |
(62) |
2,628 |
|
4,499 |
(126) |
4,373 |
| Financial bills |
18,857 |
- |
18,857 |
|
19,409 |
(31) |
19,378 |
| Promissory and commercial notes |
2,835 |
(13) |
2,822 |
|
3,888 |
12 |
3,900 |
| Other |
1,639 |
(23) |
1,616 |
|
2,198 |
(6) |
2,192 |
| Total |
469,758 |
(3,191) |
466,567 |
|
389,514 |
(5,975) |
383,539 |
| 1) Financial assets at fair value through profit or loss – Securities pledged as Guarantee of Funding of Financial Institutions and Customers and Post-employment benefits (Note 26b), were: a) Brazilian government securities R$ 85,220 (R$ 45,746 at 12/31/2022), b) Government securities - abroad R$ 2,617 (R$ 317 at 12/31/2022) and c) Corporate securities R$ 5,522 (R$ 14,199 at 12/31/2022), totaling R$ 93,359 (R$ 60,262 at 12/31/2022). |
| The cost and fair value per maturity of Financial Assets at Fair Value Through Profit or Loss - Securities were as follows: |
| |
06/30/2023 |
|
12/31/2022 |
| |
Cost |
Fair value |
|
Cost |
Fair value |
| Current |
107,179 |
105,764 |
|
147,563 |
145,722 |
| Non-stated maturity |
39,567 |
38,349 |
|
39,137 |
37,223 |
| Up to one year |
67,612 |
67,415 |
|
108,426 |
108,499 |
| Non-current |
362,579 |
360,803 |
|
241,951 |
237,817 |
| From one to five years |
271,600 |
270,890 |
|
170,372 |
169,113 |
| From five to ten years |
65,340 |
65,129 |
|
49,186 |
47,916 |
| After ten years |
25,639 |
24,784 |
|
22,393 |
20,788 |
| Total |
469,758 |
466,567 |
|
389,514 |
383,539 |
Financial Assets at Fair Value Through Profit or Loss -
Securities include assets with a fair value of R$ 232,498 (R$ 216,467 at 12/31/2022) that belong to investment funds wholly owned by Itaú
Vida e Previdência S.A. The return of those assets (positive or negative) is fully transferred to customers of our PGBL and VGBL
private pension plans whose premiums (net of fees) are used by our subsidiary to purchase quotas of those investment funds.
b) Financial assets designated at fair
value through profit or loss - Securities
| |
|
06/30/2023 |
| |
|
Cost |
Adjustments to Fair Value (in Income) |
Fair value |
| Brazilian government securities |
|
- |
- |
|
|
- |
| Total |
|
- |
- |
|
|
- |
| |
|
|
|
|
| |
|
12/31/2022 |
| |
|
Cost |
Adjustments to Fair Value (in Income) |
Fair value |
| Brazilian government securities |
|
1,505 |
55 |
1,560 |
| Total |
|
1,505 |
55 |
1,560 |
| The cost and fair value by maturity of financial assets designated as fair value through profit or loss - Securities were as follows: |
| 01/01/2023 |
|
06/30/2023 |
|
12/31/2022 |
| 01/01/2022 |
|
Cost |
Fair Value |
|
Cost |
Fair Value |
| Current |
|
- |
- |
|
1,505 |
1,560 |
| Up to one year |
|
- |
- |
|
1,505 |
1,560 |
| Total |
|
- |
- |
|
1,505 |
1,560 |
Note 6 - Derivatives
ITAÚ UNIBANCO HOLDING trades in derivative financial
instruments with various counterparties to manage its overall exposures and to assist its customers in managing their own exposures.
Futures - Interest rate and foreign currency futures
contracts are commitments to buy or sell a financial instrument at a future date, at an agreed price or yield, and may be settled in cash
or through delivery. The notional amount represents the face value of the underlying instrument. Commodity futures contracts or financial
instruments are commitments to buy or sell commodities (mainly gold, coffee and orange juice) on a future date, at an agreed price, which
are settled in cash. The notional amount represents the quantity of such commodities multiplied by the future price on the contract date.
Daily cash settlements of price movements are made for all instruments.
Forwards - Interest rate forward contracts are
agreements to exchange payments on a specified future date, based on the variation in market interest rates from trade date to contract
settlement date. Foreign exchange forward contracts represent agreements to exchange the currency of one country for the currency of another
at an agreed price, on an agreed settlement date. Financial instrument forward contracts are commitments to buy or sell a financial instrument
on a future date at an agreed price and are settled in cash.
Swaps - Interest rate and foreign exchange swap contracts
are commitments to settle in cash on a future date or dates the differentials between two specific financial indices (either two different
interest rates in a single currency or two different rates each in a different currency), as applied to a notional principal amount. Swap
contracts shown under Other in the table below correspond substantially to inflation rate swap contracts.
Options - Option contracts give the purchaser, for
a fee, the right, but not the obligation, to buy or sell a financial instrument within a limited time, including a flow of interest, foreign
currencies, commodities, or financial instruments at an agreed price that may also be settled in cash, based on the differential between
specific indices.
Credit Derivatives - Credit derivatives are financial
instruments with value deriving from the credit risk on debt issued by a third party (the reference entity), which permit one party (the
buyer of the hedge) to transfer the risk to the counterparty (the seller of the hedge). The seller of the hedge must pay out as provided
for in the contract if the reference entity undergoes a credit event, such as bankruptcy, default or debt restructuring. The seller of
the hedge receives a premium for the hedge but, on the other hand, assumes the risk that the underlying instrument referenced in the contract
undergoes a credit event, and the seller may have to make payment to the purchaser of the hedge for up to the notional amount of the credit
derivative.
The total value of margins pledged in guarantee by ITAÚ
UNIBANCO HOLDING was R$ 23,314 (R$ 13,504 at 12/31/2022) and was basically composed of government securities.
Further information on parameters used to manage risks, may
be found in Note 32 – Risk and Capital Management.
a) Derivatives Summary
| See below the composition of the Derivative financial instruments portfolio (assets and liabilities) by type of instrument, stated fair value and maturity date. |
| |
06/30/2023 |
| |
Fair value (1) |
% |
0-30 |
31-90 |
91-180 |
181-365 |
366-720 |
Over 720 days |
| Assets |
|
|
|
|
|
|
|
|
| Swaps – adjustment receivable |
43,471 |
59.6% |
1,330 |
2,459 |
1,828 |
6,351 |
9,040 |
22,463 |
| Option agreements |
11,046 |
15.2% |
2,264 |
745 |
6,059 |
956 |
631 |
391 |
| Forwards |
7,225 |
9.9% |
6,914 |
261 |
32 |
1 |
- |
17 |
| Credit derivatives |
319 |
0.4% |
4 |
- |
7 |
18 |
15 |
275 |
| NDF - Non Deliverable Forward |
9,871 |
13.6% |
1,313 |
1,374 |
1,902 |
3,966 |
970 |
346 |
| Other Derivative Financial Instruments |
913 |
1.3% |
676 |
3 |
6 |
2 |
11 |
215 |
| Total |
72,845 |
100.0% |
12,501 |
4,842 |
9,834 |
11,294 |
10,667 |
23,707 |
| % per maturity date |
|
|
17.2% |
6.7% |
13.5% |
15.5% |
14.6% |
32.5% |
| |
|
|
|
|
|
|
|
|
| |
06/30/2023 |
| |
Fair value (1) |
% |
0-30 |
31-90 |
91-180 |
181-365 |
366-720 |
Over 720 days |
| Liabilities |
|
|
|
|
|
|
|
|
| Swaps – adjustment payable |
(39,339) |
58.4% |
(838) |
(1,656) |
(1,968) |
(5,409) |
(7,001) |
(22,467) |
| Option agreements |
(12,814) |
19.0% |
(242) |
(620) |
(9,716) |
(1,012) |
(668) |
(556) |
| Forwards |
(6,909) |
10.3% |
(6,909) |
- |
- |
- |
- |
- |
| Credit derivatives |
(295) |
0.4% |
- |
- |
(1) |
(1) |
(3) |
(290) |
| NDF - Non Deliverable Forward |
(7,648) |
11.4% |
(1,133) |
(1,385) |
(1,516) |
(2,268) |
(888) |
(458) |
| Other Derivative Financial Instruments |
(321) |
0.5% |
(29) |
(2) |
(13) |
(10) |
(101) |
(166) |
| Total |
(67,326) |
100.0% |
(9,151) |
(3,663) |
(13,214) |
(8,700) |
(8,661) |
(23,937) |
| % per maturity date |
|
|
13.6% |
5.4% |
19.6% |
12.9% |
12.9% |
35.6% |
| 1) Comprises R$ (65) pegged to Libor. |
| |
12/31/2022 |
| |
Fair value (1) |
% |
0-30 |
31-90 |
91-180 |
181-365 |
366-720 |
Over 720 days |
| Assets |
|
|
|
|
|
|
|
|
| Swaps – adjustment receivable |
46,902 |
59.9% |
4,866 |
1,022 |
1,635 |
2,842 |
8,261 |
28,276 |
| Option agreements |
23,671 |
30.3% |
15,610 |
923 |
1,443 |
4,283 |
802 |
610 |
| Forwards |
601 |
0.8% |
460 |
74 |
58 |
3 |
- |
6 |
| Credit derivatives |
492 |
0.6% |
3 |
- |
10 |
9 |
9 |
461 |
| NDF - Non Deliverable Forward |
6,140 |
7.9% |
1,632 |
1,095 |
926 |
1,220 |
995 |
272 |
| Other Derivative Financial Instruments |
402 |
0.5% |
1 |
28 |
1 |
5 |
26 |
341 |
| Total |
78,208 |
100.0% |
22,572 |
3,142 |
4,073 |
8,362 |
10,093 |
29,966 |
| % per maturity date |
|
|
28.9% |
4.0% |
5.2% |
10.7% |
12.9% |
38.3% |
| |
|
|
|
|
|
|
|
|
| |
12/31/2022 |
| |
Fair value (1) |
% |
0-30 |
31-90 |
91-180 |
181-365 |
366-720 |
Over 720 days |
| Liabilities |
|
|
|
|
|
|
|
|
| Swaps – adjustment payable |
(39,068) |
50.8% |
(2,835) |
(881) |
(1,241) |
(2,992) |
(7,344) |
(23,775) |
| Option agreements |
(29,882) |
38.9% |
(3,221) |
(2,973) |
(9,214) |
(12,900) |
(901) |
(673) |
| Forwards |
(65) |
0.1% |
(55) |
(5) |
- |
(5) |
- |
- |
| Credit derivatives |
(604) |
0.8% |
- |
- |
(2) |
(1) |
(7) |
(594) |
| NDF - Non Deliverable Forward |
(6,626) |
8.6% |
(1,672) |
(1,722) |
(863) |
(1,213) |
(707) |
(449) |
| Other Derivative Financial Instruments |
(616) |
0.8% |
(219) |
(37) |
(12) |
(53) |
(97) |
(198) |
| Total |
(76,861) |
100.0% |
(8,002) |
(5,618) |
(11,332) |
(17,164) |
(9,056) |
(25,689) |
| % per maturity date |
|
|
10.4% |
7.3% |
14.7% |
22.3% |
11.8% |
33.5% |
| 1) Comprises R$ 24 pegged to Libor. |
b) Derivatives by index and Risk Factor
| |
|
Off-balance sheet notional amount |
Balance sheet account receivable / (received) (payable) / paid |
Adjustment to fair value (in income / stockholders' equity) |
Fair value |
| |
|
06/30/2023 |
| Future contracts |
|
787,988 |
- |
- |
- |
| Purchase commitments |
|
206,287 |
- |
- |
- |
| Shares |
|
384 |
- |
- |
- |
| Commodities |
|
501 |
- |
- |
- |
| Interest |
|
185,296 |
- |
- |
- |
| Foreign currency |
|
20,106 |
- |
- |
- |
| Commitments to sell |
|
581,701 |
- |
- |
- |
| Shares |
|
585 |
- |
- |
- |
| Commodities |
|
4,304 |
- |
- |
- |
| Interest |
|
561,747 |
- |
- |
- |
| Foreign currency |
|
15,065 |
- |
- |
- |
| Swap contracts |
|
|
1,217 |
2,915 |
4,132 |
| Asset position |
|
1,964,744 |
22,079 |
21,392 |
43,471 |
| Shares |
|
129 |
- |
- |
- |
| Commodities |
|
649 |
1 |
1 |
2 |
| Interest |
|
1,778,541 |
20,464 |
17,740 |
38,204 |
| Foreign currency |
|
185,425 |
1,614 |
3,651 |
5,265 |
| Liability position |
|
1,964,744 |
(20,862) |
(18,477) |
(39,339) |
| Shares |
|
2,632 |
(383) |
266 |
(117) |
| Commodities |
|
2,063 |
(19) |
9 |
(10) |
| Interest |
|
1,752,479 |
(19,647) |
(14,498) |
(34,145) |
| Foreign currency |
|
207,570 |
(813) |
(4,254) |
(5,067) |
| Option contracts |
|
1,961,252 |
(1,145) |
(623) |
(1,768) |
| Purchase commitments – long position |
|
288,057 |
4,879 |
371 |
5,250 |
| Shares |
|
94,065 |
3,659 |
1,170 |
4,829 |
| Commodities |
|
1,625 |
65 |
(17) |
48 |
| Interest |
|
161,120 |
303 |
(107) |
196 |
| Foreign currency |
|
31,247 |
852 |
(675) |
177 |
| Commitments to sell – long position |
|
685,276 |
10,990 |
(5,194) |
5,796 |
| Shares |
|
94,732 |
9,971 |
(5,582) |
4,389 |
| Commodities |
|
602 |
21 |
13 |
34 |
| Interest |
|
569,328 |
275 |
46 |
321 |
| Foreign currency |
|
20,614 |
723 |
329 |
1,052 |
| Purchase commitments – short position |
|
280,017 |
(4,603) |
(1,361) |
(5,964) |
| Shares |
|
89,648 |
(3,523) |
(2,032) |
(5,555) |
| Commodities |
|
1,015 |
(28) |
12 |
(16) |
| Interest |
|
160,806 |
(212) |
133 |
(79) |
| Foreign currency |
|
28,548 |
(840) |
526 |
(314) |
| Commitments to sell – short position |
|
707,902 |
(12,411) |
5,561 |
(6,850) |
| Shares |
|
96,856 |
(11,144) |
6,386 |
(4,758) |
| Commodities |
|
1,155 |
(51) |
(47) |
(98) |
| Interest |
|
586,926 |
(284) |
(37) |
(321) |
| Foreign currency |
|
22,965 |
(932) |
(741) |
(1,673) |
| Forward operations |
|
10,202 |
310 |
6 |
316 |
| Purchases receivable |
|
2,216 |
2,940 |
7 |
2,947 |
| Shares |
|
34 |
34 |
(1) |
33 |
| Interest |
|
2,182 |
2,906 |
8 |
2,914 |
| Purchases payable obligations |
|
- |
(2,182) |
- |
(2,182) |
| Interest |
|
- |
(2,182) |
- |
(2,182) |
| Sales receivable |
|
311 |
4,276 |
2 |
4,278 |
| Shares |
|
199 |
193 |
1 |
194 |
| Commodities |
|
16 |
16 |
1 |
17 |
| Interest |
|
- |
4,065 |
- |
4,065 |
| Foreign currency |
|
96 |
2 |
- |
2 |
| Sales deliverable obligations |
|
7,675 |
(4,724) |
(3) |
(4,727) |
| Interest |
|
4,065 |
(4,722) |
(3) |
(4,725) |
| Foreign currency |
|
3,610 |
(2) |
- |
(2) |
| Credit derivatives |
|
47,568 |
(82) |
106 |
24 |
| Asset position |
|
33,430 |
396 |
(77) |
319 |
| Shares |
|
3,158 |
79 |
41 |
120 |
| Commodities |
|
12 |
- |
- |
- |
| Interest |
|
30,259 |
317 |
(118) |
199 |
| Foreign currency |
|
1 |
- |
- |
- |
| Liability position |
|
14,138 |
(478) |
183 |
(295) |
| Shares |
|
1,782 |
(45) |
(41) |
(86) |
| Commodities |
|
4 |
- |
- |
- |
| Interest |
|
12,351 |
(433) |
224 |
(209) |
| Foreign currency |
|
1 |
- |
- |
- |
| NDF - Non Deliverable Forward |
|
348,335 |
1,829 |
394 |
2,223 |
| Asset position |
|
192,437 |
9,034 |
837 |
9,871 |
| Commodities |
|
2,662 |
375 |
12 |
387 |
| Foreign currency |
|
189,775 |
8,659 |
825 |
9,484 |
| Liability position |
|
155,898 |
(7,205) |
(443) |
(7,648) |
| Commodities |
|
1,448 |
(118) |
17 |
(101) |
| Foreign currency |
|
154,450 |
(7,087) |
(460) |
(7,547) |
| Other derivative financial instruments |
|
10,022 |
80 |
512 |
592 |
| Asset position |
|
6,917 |
210 |
703 |
913 |
| Shares |
|
1,250 |
- |
49 |
49 |
| Commodities |
|
225 |
- |
2 |
2 |
| Interest |
|
5,424 |
210 |
(24) |
186 |
| Foreign currency |
|
18 |
- |
676 |
676 |
| Liability position |
|
3,105 |
(130) |
(191) |
(321) |
| Shares |
|
885 |
(1) |
(8) |
(9) |
| Commodities |
|
146 |
(16) |
(2) |
(18) |
| Interest |
|
247 |
(106) |
(18) |
(124) |
| Foreign currency |
|
1,827 |
(7) |
(163) |
(170) |
| |
|
|
|
|
|
| |
|
Asset |
54,804 |
18,041 |
72,845 |
| |
|
Liability |
(52,595) |
(14,731) |
(67,326) |
| |
|
Total |
2,209 |
3,310 |
5,519 |
| |
|
|
|
|
|
| Derivative contracts mature as follows (in days): |
| Off-balance sheet – notional amount (1) |
0 - 30 |
31 - 180 |
181 - 365 |
Over 365 days |
06/30/2023 |
| Future contracts |
143,025 |
323,582 |
144,670 |
176,711 |
787,988 |
| Swap contracts |
214,798 |
365,181 |
423,939 |
960,826 |
1,964,744 |
| Option contracts |
319,907 |
682,413 |
932,156 |
26,776 |
1,961,252 |
| Forwards (onshore) |
6,377 |
3,150 |
659 |
16 |
10,202 |
| Credit derivatives |
8,099 |
4,547 |
6,493 |
28,429 |
47,568 |
| NDF - Non Deliverable Forward |
114,344 |
119,973 |
82,098 |
31,920 |
348,335 |
| Other derivative financial instruments |
1,781 |
1,219 |
528 |
6,494 |
10,022 |
| 1) Comprises R$ 211,249 pegged to Libor. |
| |
|
Off-balance sheet notional amount |
Balance sheet account receivable / (received) (payable) / paid |
Adjustment to fair value (in income / stockholders' equity) |
Fair value |
| |
|
12/31/2022 |
| Future contracts |
|
1,020,605 |
- |
- |
- |
| Purchase commitments |
|
418,886 |
- |
- |
- |
| Shares |
|
3,395 |
- |
- |
- |
| Commodities |
|
503 |
- |
- |
- |
| Interest |
|
385,229 |
- |
- |
- |
| Foreign currency |
|
29,759 |
- |
- |
- |
| Commitments to sell |
|
601,719 |
- |
- |
- |
| Shares |
|
11,702 |
- |
- |
- |
| Commodities |
|
3,896 |
- |
- |
- |
| Interest |
|
557,806 |
- |
- |
- |
| Foreign currency |
|
28,315 |
- |
- |
- |
| Swap contracts |
|
|
2,948 |
4,886 |
7,834 |
| Asset position |
|
1,571,025 |
22,396 |
24,506 |
46,902 |
| Commodities |
|
222 |
1 |
1 |
2 |
| Interest |
|
1,509,045 |
20,913 |
23,502 |
44,415 |
| Foreign currency |
|
61,758 |
1,482 |
1,003 |
2,485 |
| Liability position |
|
1,571,025 |
(19,448) |
(19,620) |
(39,068) |
| Shares |
|
1,604 |
(180) |
59 |
(121) |
| Commodities |
|
609 |
(5) |
1 |
(4) |
| Interest |
|
1,491,476 |
(18,130) |
(18,487) |
(36,617) |
| Foreign currency |
|
77,336 |
(1,133) |
(1,193) |
(2,326) |
| Option contracts |
|
1,352,201 |
(5,960) |
(251) |
(6,211) |
| Purchase commitments – long position |
|
267,199 |
3,071 |
(665) |
2,406 |
| Shares |
|
131,529 |
1,786 |
(131) |
1,655 |
| Commodities |
|
2,347 |
43 |
(7) |
36 |
| Interest |
|
93,795 |
156 |
4 |
160 |
| Foreign currency |
|
39,528 |
1,086 |
(531) |
555 |
| Commitments to sell – long position |
|
419,044 |
20,238 |
1,027 |
21,265 |
| Shares |
|
138,899 |
19,592 |
1,094 |
20,686 |
| Commodities |
|
904 |
18 |
(6) |
12 |
| Interest |
|
256,483 |
51 |
6 |
57 |
| Foreign currency |
|
22,758 |
577 |
(67) |
510 |
| Purchase commitments – short position |
|
223,496 |
(7,997) |
444 |
(7,553) |
| Shares |
|
131,361 |
(4,448) |
155 |
(4,293) |
| Commodities |
|
2,000 |
(15) |
5 |
(10) |
| Interest |
|
64,256 |
(181) |
(5) |
(186) |
| Foreign currency |
|
25,879 |
(3,353) |
289 |
(3,064) |
| Commitments to sell – short position |
|
442,462 |
(21,272) |
(1,057) |
(22,329) |
| Shares |
|
137,322 |
(17,467) |
(1,087) |
(18,554) |
| Commodities |
|
963 |
(32) |
10 |
(22) |
| Interest |
|
270,585 |
(66) |
(13) |
(79) |
| Foreign currency |
|
33,592 |
(3,707) |
33 |
(3,674) |
| Forward operations |
|
4,755 |
549 |
(13) |
536 |
| Purchases receivable |
|
187 |
452 |
(4) |
448 |
| Shares |
|
157 |
157 |
(5) |
152 |
| Interest |
|
30 |
295 |
1 |
296 |
| Purchases payable obligations |
|
- |
(30) |
- |
(30) |
| Interest |
|
- |
(30) |
- |
(30) |
| Sales receivable |
|
3,901 |
153 |
- |
153 |
| Shares |
|
126 |
124 |
- |
124 |
| Commodities |
|
6 |
6 |
- |
6 |
| Interest |
|
- |
23 |
- |
23 |
| Foreign currency |
|
3,769 |
- |
- |
- |
| Sales deliverable obligations |
|
667 |
(26) |
(9) |
(35) |
| Interest |
|
23 |
(26) |
1 |
(25) |
| Foreign currency |
|
644 |
- |
(10) |
(10) |
| Credit derivatives |
|
43,808 |
(101) |
(11) |
(112) |
| Asset position |
|
28,724 |
542 |
(50) |
492 |
| Shares |
|
2,192 |
71 |
15 |
86 |
| Interest |
|
26,532 |
471 |
(65) |
406 |
| Liability position |
|
15,084 |
(643) |
39 |
(604) |
| Shares |
|
2,846 |
(58) |
(58) |
(116) |
| Interest |
|
12,238 |
(585) |
97 |
(488) |
| NDF - Non Deliverable Forward |
|
326,100 |
(936) |
450 |
(486) |
| Asset position |
|
162,554 |
5,808 |
332 |
6,140 |
| Shares |
|
2,943 |
343 |
(2) |
341 |
| Foreign currency |
|
159,611 |
5,465 |
334 |
5,799 |
| Liability position |
|
163,546 |
(6,744) |
118 |
(6,626) |
| Commodities |
|
867 |
(81) |
(4) |
(85) |
| Foreign currency |
|
162,679 |
(6,663) |
122 |
(6,541) |
| Other derivative financial instruments |
|
8,170 |
44 |
(258) |
(214) |
| Asset position |
|
7,261 |
255 |
147 |
402 |
| Shares |
|
1,096 |
- |
61 |
61 |
| Commodities |
|
72 |
- |
1 |
1 |
| Interest |
|
6,093 |
255 |
85 |
340 |
| Liability position |
|
909 |
(211) |
(405) |
(616) |
| Shares |
|
467 |
(1) |
(4) |
(5) |
| Commodities |
|
47 |
(6) |
(1) |
(7) |
| Interest |
|
301 |
(201) |
(15) |
(216) |
| Foreign currency |
|
94 |
(3) |
(385) |
(388) |
| |
|
Asset |
52,915 |
25,293 |
78,208 |
| |
|
Liability |
(56,371) |
(20,490) |
(76,861) |
| |
|
Total |
(3,456) |
4,803 |
1,347 |
| |
|
|
|
|
|
| Derivative contracts mature as follows (in days): |
| Off-balance sheet – notional amount (1) |
0 - 30 |
31 - 180 |
181 - 365 |
Over 365 days |
12/31/2022 |
| Future contracts |
227,878 |
423,571 |
216,999 |
152,157 |
1,020,605 |
| Swap contracts |
267,484 |
151,436 |
176,320 |
975,785 |
1,571,025 |
| Option contracts |
456,100 |
462,790 |
374,678 |
58,633 |
1,352,201 |
| Forwards |
1,406 |
2,637 |
706 |
6 |
4,755 |
| Credit derivatives |
3,912 |
9,578 |
5,144 |
25,174 |
43,808 |
| NDF - Non Deliverable Forward |
116,901 |
111,325 |
55,411 |
42,463 |
326,100 |
| Other derivative financial instruments |
131 |
637 |
1,012 |
6,390 |
8,170 |
| 1) Comprises R$ 247,631 pegged to Libor. |
c) Derivatives by notional amount
| See below the composition of the Derivative Financial Instruments portfolio by type of instrument, stated at their notional amounts, per trading location (organized or over-the-counter market) and counterparties. |
| |
06/30/2023 |
| |
Future contracts |
Swap contracts |
Option contracts |
Forwards |
Credit derivatives |
NDF - Non Deliverable Forward |
Other derivative financial instruments |
| Stock exchange |
787,988 |
1,293,401 |
1,866,888 |
3,937 |
21,135 |
89,150 |
- |
| Over-the-counter market |
- |
671,343 |
94,364 |
6,265 |
26,433 |
259,185 |
10,022 |
| Financial institutions |
- |
543,789 |
59,103 |
6,247 |
26,433 |
127,447 |
5,523 |
| Companies |
- |
114,049 |
33,728 |
18 |
- |
129,791 |
4,499 |
| Individuals |
- |
13,505 |
1,533 |
- |
- |
1,947 |
- |
| Total |
787,988 |
1,964,744 |
1,961,252 |
10,202 |
47,568 |
348,335 |
10,022 |
| |
|
|
|
|
|
|
|
| |
12/31/2022 |
| |
Future contracts |
Swap contracts |
Option contracts |
Forwards |
Credit derivatives |
NDF - Non Deliverable Forward |
Other derivative financial instruments |
| Stock exchange |
1,020,604 |
991,559 |
1,255,056 |
4,696 |
17,806 |
70,562 |
- |
| Over-the-counter market |
1 |
579,466 |
97,145 |
59 |
26,002 |
255,538 |
8,170 |
| Financial institutions |
- |
465,917 |
52,177 |
53 |
26,002 |
117,077 |
5,938 |
| Companies |
1 |
105,076 |
43,949 |
6 |
- |
137,091 |
2,227 |
| Individuals |
- |
8,473 |
1,019 |
- |
- |
1,370 |
5 |
| Total |
1,020,605 |
1,571,025 |
1,352,201 |
4,755 |
43,808 |
326,100 |
8,170 |
d) Credit derivatives
| ITAÚ UNIBANCO HOLDING buys and sells credit protection in order to meet the needs of its customers, to manage and mitigate its portfolios' risk. |
| CDS (credit default swap) is a credit derivative in which, upon a default related to the reference entity, the protection buyer is entitled to receive the amount equivalent to the difference between the face value of the CDS contract and the fair value of the liability on the date the contract was settled, also known as the recovered amount. The protection buyer does not need to hold the reference entity's debt instrument in order to receive the amounts due when a credit event occurs, as per the terms of the CDS contract. |
| TRS (total return swap) is a transaction in which a party swaps the total return of an asset or of a basket of assets for regular cash flows, usually interest and a guarantee against capital loss. In a TRS contract, the parties do not transfer the ownership of the assets. |
| ITAÚ UNIBANCO HOLDING assesses the risk of a credit derivative based on the credit ratings attributed to the reference entity by independent credit rating agencies. Investment grade entities are those for which credit risk is rated as Baa3 or higher, as rated by Moody's, and BBB- or higher, by Standard & Poor’s and Fitch Ratings. |
| |
06/30/2023 |
| |
Maximum potential of future payments, gross |
Up to 1 year |
From 1 to 3 years |
From 3 to 5 years |
Over 5 years |
| By instrument |
|
|
|
|
|
| CDS |
18,464 |
1,399 |
6,255 |
10,715 |
95 |
| TRS |
17,709 |
17,709 |
- |
- |
- |
| Total by instrument |
36,173 |
19,108 |
6,255 |
10,715 |
95 |
| By risk rating |
|
|
|
|
|
| Investment grade |
2,450 |
68 |
1,122 |
1,237 |
23 |
| Below investment grade |
33,723 |
19,040 |
5,133 |
9,478 |
72 |
| Total by risk |
36,173 |
19,108 |
6,255 |
10,715 |
95 |
| By reference entity |
|
|
|
|
|
| Brazilian government |
31,026 |
18,478 |
4,300 |
8,176 |
72 |
| Governments – abroad |
187 |
6 |
66 |
115 |
- |
| Private entities |
4,960 |
624 |
1,889 |
2,424 |
23 |
| Total by entity |
36,173 |
19,108 |
6,255 |
10,715 |
95 |
| |
|
|
|
|
|
| |
12/31/2022 |
| |
Maximum potential of future payments, gross |
Up to 1 year |
From 1 to 3 years |
From 3 to 5 years |
Over 5 years |
| By instrument |
|
|
|
|
|
| CDS |
18,156 |
2,534 |
6,368 |
9,176 |
78 |
| TRS |
16,000 |
16,000 |
- |
- |
- |
| Total by instrument |
34,156 |
18,534 |
6,368 |
9,176 |
78 |
| By risk rating |
|
|
|
|
|
| Investment grade |
1,944 |
218 |
850 |
876 |
- |
| Below investment grade |
32,212 |
18,316 |
5,518 |
8,300 |
78 |
| Total by risk |
34,156 |
18,534 |
6,368 |
9,176 |
78 |
| By reference entity |
|
|
|
|
|
| Brazilian government |
28,988 |
17,195 |
4,543 |
7,172 |
78 |
| Governments – abroad |
280 |
91 |
73 |
116 |
- |
| Private entities |
4,888 |
1,248 |
1,752 |
1,888 |
- |
| Total by entity |
34,156 |
18,534 |
6,368 |
9,176 |
78 |
| The following table presents the notional amount of credit derivatives purchased. The underlying amounts are identical to those for which ITAÚ UNIBANCO HOLDING has sold credit protection. |
| |
06/30/2023 |
| |
Notional amount of credit protection sold |
Notional amount of credit protection purchased with identical underlying amount |
Net position |
| CDS |
(18,464) |
11,395 |
(7,069) |
| TRS |
(17,709) |
- |
(17,709) |
| Total |
(36,173) |
11,395 |
(24,778) |
| |
|
|
|
| |
12/31/2022 |
| |
Notional amount of credit protection sold |
Notional amount of credit protection purchased with identical underlying amount |
Net position |
| CDS |
(18,156) |
9,652 |
(8,504) |
| TRS |
(16,000) |
- |
(16,000) |
| Total |
(34,156) |
9,652 |
(24,504) |
e) Financial instruments subject to offsetting,
enforceable master netting arrangements and similar agreements
| The following tables set forth the financial assets and liabilities that are subject to offsetting, enforceable master netting arrangements and similar agreements, as well as how these financial assets and liabilities have been presented in ITAÚ UNIBANCO HOLDING's consolidated financial statements. These tables also reflect the amounts of collateral pledged or received in relation to financial assets and liabilities subject to enforceable arrangements that have not been presented on a net basis in accordance with IAS 32. |
| Financial assets subject to offsetting, enforceable master netting arrangements and similar agreements: |
| |
06/30/2023 |
| |
Gross amount of recognized financial assets (1) |
Gross amount offset in the Balance Sheet |
Net amount of financial assets presented in the Balance Sheet |
Related amounts not offset in the Balance Sheet (2) |
Total |
| |
Financial instruments (3) |
Cash collateral received |
| Securities purchased under agreements to resell |
216,946 |
- |
216,946 |
(690) |
- |
216,256 |
| Derivative financial instruments |
72,845 |
- |
72,845 |
(18,860) |
(321) |
53,664 |
| |
|
|
|
|
|
|
| |
12/31/2022 |
| |
Gross amount of recognized financial assets (1) |
Gross amount offset in the Balance Sheet |
Net amount of financial assets presented in the Balance Sheet |
Related amounts not offset in the Balance Sheet (2) |
Total |
| |
Financial instruments (3) |
Cash collateral received |
| Securities purchased under agreements to resell |
221,776 |
- |
221,776 |
(3,930) |
- |
217,846 |
| Derivative financial instruments |
78,208 |
- |
78,208 |
(17,507) |
(1,005) |
59,696 |
| Financial liabilities subject to offsetting, enforceable master netting arrangements and similar agreements: |
| |
06/30/2023 |
| |
Gross amount of recognized financial liabilities (1) |
Gross amount offset in the Balance Sheet |
Net amount of financial liabilities presented in the Balance Sheet |
Related amounts not offset in the Balance Sheet (2) |
Total |
| |
Financial instruments (3) |
Cash collateral pledged |
| Securities sold under repurchase agreements |
319,099 |
- |
319,099 |
(19,133) |
- |
299,966 |
| Derivative financial instruments |
67,326 |
- |
67,326 |
(18,860) |
- |
48,466 |
| |
|
|
|
|
|
|
| |
12/31/2022 |
| |
Gross amount of recognized financial liabilities (1) |
Gross amount offset in the Balance Sheet |
Net amount of financial liabilities presented in the Balance Sheet |
Related amounts not offset in the Balance Sheet (2) |
Total |
| |
Financial instruments (3) |
Cash collateral pledged |
| Securities sold under repurchase agreements |
293,440 |
- |
293,440 |
(40,156) |
- |
253,284 |
| Derivative financial instruments |
76,861 |
- |
76,861 |
(17,507) |
- |
59,354 |
1) Includes amounts of master offset agreements and other such agreements, both enforceable and unenforceable.
2) Limited to amounts subject to enforceable master offset agreements and other such agreements.
3) Includes amounts subject to enforceable master offset agreements and other such agreements, and guarantees in financial instruments. |
| Financial assets and financial liabilities are offset in the balance sheet only when there is a legally enforceable right to offset the recognized amounts and there is an intention to settle on a net basis, or realize the asset and settle the liability simultaneously. |
| Derivative financial instruments and repurchased agreements not set off in the balance sheet relate to transactions in which there are enforceable master netting agreements or similar agreements, but the offset criteria have not been met in accordance with paragraph 42 of IAS 32 mainly because ITAÚ UNIBANCO HOLDING has no intention to settle on a net basis, or realize the asset and settle the liability simultaneously. |
Note 7 - Hedge accounting
There are three types of hedge relations: Fair value hedge,
Cash flow hedge and Hedge of net investment in foreign operations.
In hedge accounting, the groups of risk factors measured
by ITAÚ UNIBANCO HOLDING are:
• Interest
Rate: Risk of loss in transactions subject to interest rate variations.
• Currency:
Risk of loss in transactions subject to foreign exchange variation.
The structure of risk limits is extended to the risk factor
level, where specific limits aim at improving the monitoring and understanding process, as well as avoiding concentration of these risks.
The structures designed for interest rate and exchange rate
categories take into account total risk when there are compatible hedging instruments. In certain cases, management may decide to hedge
a risk for the risk factor term and limit of the hedging instrument.
The other risk factors hedged by the institution are shown
in Note 32.
To protect cash flows and fair value of instruments designated
as hedged items, ITAÚ UNIBANCO HOLDING uses derivative financial instruments and financial assets. Currently Futures
Contracts, NDF (Non Deliverable Forwards), Forwards, Swaps and Financial Assets are used.
ITAÚ UNIBANCO HOLDING manages risks through the
economic relationship between hedging instruments and hedged items, where the expectation is that these instruments will move in opposite
directions and in the same proportion, with the purpose of neutralizing risk factors.
The designated coverage ratio is always 100% of the risk
factor eligible for coverage. Sources of ineffectiveness are in general related to the counterparty’s credit risk and possible mismatches
of terms between the hedging instrument and the hedged item.
a) Cash flow hedge
The cash flow hedge strategies of ITAÚ UNIBANCO HOLDING
consist of hedging exposure to variations in cash flows, in interest payment and currency exposure which are attributable to changes in
interest rates on recognized and unrecognized assets and liabilities.
ITAÚ UNIBANCO HOLDING applies cash flow hedge
strategies as follows:
Interest rate risks:
• Hedge
of time deposits and repurchase agreements: to hedge fluctuations in cash flows of interest payments resulting from changes in the DI
interest rate, through futures contracts.
• Hedge
of asset transactions: to hedge fluctuations in cash flows of interest receipts resulting from changes in the DI rate, through futures
contracts.
• Hedge
of assets denominated in UF*: to hedge fluctuations in cash flows of interest receipts resulting from changes in the UF*, through swap
contracts.
• Hedge
of Funding: to hedge fluctuations in cash flows of interest payments resulting from changes in the TPM* rate, through swap contracts.
• Hedge
of loan operations: to hedge fluctuations in cash flows of interest receipts resulting from changes in the TPM* rate, through swap
contracts.
• Hedge
of repurchase agreements: to hedge fluctuations in cash flows of interest received from changes in Selic (benchmark interest rate), through
futures contracts.
• Hedging
of expected highly probable transactions: to hedge the risk of variation in the amount of the commitments assumed when resulting from
variation in the exchange rates.
*UF – Chilean unit of account / TPM – Monetary policy rate
ITAÚ UNIBANCO HOLDING does not use the qualitative
method to evaluate the effectiveness or to measure the ineffectiveness of these strategies.
For cash flow hedge strategies, ITAÚ UNIBANCO
HOLDING uses the hypothetical derivative method. This method is based on a comparison of the change in the fair value of a hypothetical
derivative with terms identical to the critical terms of the variable-rate liability, and this change in the fair value is considered
a proxy of the present value of the cumulative change in the future cash flow expected for the hedged liability.
| Strategies |
Heading |
06/30/2023 |
| Hedged item |
|
Hedge instrument |
| Book Value |
Variation in value recognized in Other comprehensive income |
Cash flow hedge reserve |
|
Notional Amount |
Variation in fair value used to calculate hedge ineffectiveness |
| Assets |
Liabilities |
|
| Interest rate risk |
|
|
|
|
|
|
|
|
| Hedge of deposits and repurchase agreements |
Securities sold under agreements to resell |
- |
106,589 |
(725) |
(489) |
|
107,315 |
(725) |
| Hedge of assets transactions |
Loans and lease operations and Securities |
7,138 |
- |
(175) |
(175) |
|
6,966 |
(175) |
| Hedge of asset-backed securities under repurchase agreements |
Securities purchased under agreements to resell |
33,440 |
- |
888 |
225 |
|
34,169 |
888 |
| Hedge of loan operations |
Loans and lease operations |
12,453 |
- |
26 |
26 |
|
12,426 |
27 |
| Hedge of funding |
Deposits |
- |
9,389 |
(33) |
(21) |
|
9,356 |
(34) |
| Hedge of assets denominated in UF |
Securities |
15,350 |
- |
135 |
135 |
|
15,215 |
135 |
| Foreign exchange risk |
|
|
|
|
|
|
|
|
| Hedge of highly probable forecast transactions |
|
- |
300 |
(20) |
162 |
|
274 |
(20) |
| Hedge of funding |
Deposits |
- |
120 |
1 |
1 |
|
121 |
1 |
| Total |
|
68,381 |
116,398 |
97 |
(136) |
|
185,842 |
97 |
| |
|
|
|
|
|
|
|
|
| Strategies |
Heading |
12/31/2022 |
| Hedged item |
|
Hedge instrument |
| Book Value |
Variation in value recognized in Other comprehensive income |
Cash flow hedge reserve |
|
Notional Amount |
Variation in fair value used to calculate hedge ineffectiveness |
| Assets |
Liabilities |
|
| Interest rate risk |
|
|
|
|
|
|
|
|
| Hedge of deposits and repurchase agreements |
Securities sold under agreements to resell |
- |
149,300 |
1,169 |
1,169 |
|
149,210 |
1,222 |
| Hedge of assets transactions |
Loans and lease operations and Securities |
6,894 |
- |
(367) |
(367) |
|
6,528 |
(367) |
| Hedge of asset-backed securities under repurchase agreements |
Securities purchased under agreements to resell |
52,916 |
- |
(1,508) |
(1,508) |
|
50,848 |
(1,508) |
| Hedge of loan operations |
Loans and lease operations |
3,283 |
- |
(6) |
(6) |
|
3,288 |
(6) |
| Hedge of funding |
Deposits |
- |
6,881 |
86 |
86 |
|
6,967 |
86 |
| Hedge of assets denominated in UF |
Securities |
7,871 |
- |
16 |
16 |
|
7,853 |
16 |
| Foreign exchange risk |
|
|
|
|
|
|
|
|
| Hedge of highly probable forecast transactions |
|
- |
343 |
4 |
191 |
|
343 |
4 |
| Hedge of funding |
Deposits |
- |
360 |
(1) |
(1) |
|
359 |
(1) |
| Total |
|
70,964 |
156,884 |
(607) |
(420) |
|
225,396 |
(554) |
For strategies of deposits and repurchase agreements to resell,
asset transactions and asset-backed securities under repurchase agreements, the entity frequently reestablishes the coverage ratio, since
both the hedged item and the instruments change over time. This occurs because they are portfolio strategies that reflect the risk management
strategy guidelines approved in the proper authority level.
The remaining balance in the reserve of cash flow hedge for
which the hedge accounting is no longer applied is R$ (233) (R$ 187 at 12/31/2022).
| Hedge Instruments |
06/30/2023 |
| Notional amount |
Book Value (1) |
Variations in fair value used to calculate hedge ineffectiveness |
Variation in value recognized in Other comprehensive income |
Hedge ineffectiveness recognized in income |
Amount reclassified from Cash flow hedge reserve to income |
| Assets |
Liabilities |
| Interest rate risk |
|
|
|
|
|
|
|
| Futures |
148,450 |
104 |
92 |
(12) |
(12) |
- |
(28) |
| Forward |
17,739 |
44 |
289 |
138 |
138 |
- |
- |
| Swaps |
19,258 |
49 |
59 |
(10) |
(10) |
- |
5 |
| Foreign exchange risk |
|
|
|
|
|
|
|
| Futures |
202 |
- |
9 |
(12) |
(12) |
- |
4 |
| Forward |
72 |
- |
10 |
(8) |
(8) |
- |
- |
| Swaps |
121 |
5 |
- |
1 |
1 |
- |
- |
| Total |
185,842 |
202 |
459 |
97 |
97 |
- |
(19) |
| |
|
|
|
|
|
|
|
| Hedge Instruments |
12/31/2022 |
| Notional amount |
Book Value (1) |
Variations in fair value used to calculate hedge ineffectiveness |
Variation in value recognized in Other comprehensive income |
Hedge ineffectiveness recognized in income |
Amount reclassified from Cash flow hedge reserve to income |
| Assets |
Liabilities |
| Interest rate risk |
|
|
|
|
|
|
|
| Futures |
206,586 |
31 |
27 |
(653) |
(706) |
53 |
- |
| Forward |
10,037 |
136 |
646 |
11 |
11 |
- |
1 |
| Swaps |
8,071 |
201 |
11 |
85 |
85 |
- |
- |
| Foreign exchange risk |
|
|
|
|
|
|
|
| Futures |
249 |
2 |
- |
- |
- |
- |
378 |
| Forward |
94 |
- |
1 |
4 |
4 |
- |
- |
| Swaps |
359 |
54 |
- |
(1) |
(1) |
- |
- |
| Total |
225,396 |
424 |
685 |
(554) |
(607) |
53 |
379 |
| 1) Amounts recorded under heading Derivatives. |
b) Hedge of net investment in foreign
operations
| ITAÚ UNIBANCO HOLDING's strategies for net investments in foreign operations consist of hedging the exposure in the functional currency of the foreign operation against the functional currency of head office. |
| The risk hedged in this type of strategy is the currency risk. |
| ITAÚ UNIBANCO HOLDING does not use the qualitative method to evaluate the effectiveness or to measure the ineffectiveness of these strategies. |
| Instead, ITAÚ UNIBANCO HOLDING uses the Dollar Offset Method, which is based on a comparison of the change in fair value (cash flow) of the hedging instrument, attributable to changes in the exchange rate and the gain (loss) arising from variations in exchange rates on the amount of investment abroad designated as the object of the hedge. |
| Strategies |
06/30/2023 |
| Hedged item |
|
Hedge instrument |
| Book Value (2) |
Variation in value recognized in Other comprehensive income |
Foreign currency conversion reserve |
|
Notional amount |
Variation in fair value used to calculate hedge ineffectiveness |
| Assets |
Liabilities |
|
| Foreign exchange risk |
|
|
|
|
|
|
|
| Hedge of net investment in foreign operations (1) |
9,560 |
- |
(14,454) |
(14,454) |
|
9,818 |
(14,680) |
| Total |
9,560 |
- |
(14,454) |
(14,454) |
|
9,818 |
(14,680) |
| |
|
|
|
|
|
|
|
| Strategies |
12/31/2022 |
| Hedged item |
|
Hedge instrument |
| Book Value (2) |
Variation in value recognized in Other comprehensive income |
Foreign currency conversion reserve |
|
Notional amount |
Variation in fair value used to calculate hedge ineffectiveness |
| Assets |
Liabilities |
|
| Foreign exchange risk |
|
|
|
|
|
|
|
| Hedge of net investment in foreign operations (1) |
8,983 |
- |
(14,836) |
(14,836) |
|
9,933 |
(14,996) |
| Total |
8,983 |
- |
(14,836) |
(14,836) |
|
9,933 |
(14,996) |
1) Hedge instruments consider the gross tax position.
2) Amounts recorded under heading Derivatives. |
At 12/31/2022 the amount of R$ 7,049 was reversed
from the hedge relationship, the remaining balance of which in the Foreign currency conversion reserve (Stockholders' equity) is R$
(3,116), with no effect on the result as foreign investments were maintained.
| Hedge instruments |
06/30/2023 |
| Notional amount |
Book Value (1) |
Variations in fair value used to calculate hedge ineffectiveness |
Variation in the value recognized in Other comprehensive income |
Hedge ineffectiveness recognized in income |
Amount reclassified from foreign currency conversion reserve into income |
| Assets |
Liabilities |
| Foreign exchange risk |
|
|
|
|
|
|
|
| Future |
1,025 |
14 |
- |
(5,667) |
(5,626) |
(41) |
- |
| Future / NDF - Non Deliverable Forward |
5,459 |
100 |
21 |
(2,550) |
(2,373) |
(177) |
- |
| Future / Financial Assets |
3,334 |
4,534 |
1,893 |
(6,463) |
(6,455) |
(8) |
- |
| Total |
9,818 |
4,648 |
1,914 |
(14,680) |
(14,454) |
(226) |
- |
| |
|
|
|
|
|
|
|
| Hedge instruments |
12/31/2022 |
| Notional amount |
Book Value (1) |
Variations in fair value used to calculate hedge ineffectiveness |
Variation in the value recognized in Other comprehensive income |
Hedge ineffectiveness recognized in income |
Amount reclassified from foreign currency conversion reserve into income |
| Assets |
Liabilities |
| Foreign exchange risk |
|
|
|
|
|
|
|
| Future |
1,673 |
- |
- |
(5,751) |
(5,710) |
(41) |
- |
| Future / NDF - Non Deliverable Forward |
5,186 |
176 |
126 |
(2,521) |
(2,411) |
(110) |
- |
| Future / Financial Assets |
3,074 |
4,380 |
1,839 |
(6,724) |
(6,715) |
(9) |
- |
| Total |
9,933 |
4,556 |
1,965 |
(14,996) |
(14,836) |
(160) |
- |
| 1) Amounts recorded under heading Derivatives. |
c) Fair value hedge
The fair value hedging strategy of ITAÚ UNIBANCO
HOLDING consists of hedging the exposure to variation in fair value on the receipt and payment of interest on recognized assets and
liabilities.
ITAÚ UNIBANCO HOLDING applies fair value hedges
as follows:
Interest rate risk:
• To
protect the risk of variation in the fair value of receipt and payment of interest resulting from variations in the fair value of the
variable rates involved, by contracting swaps and futures.
ITAÚ UNIBANCO HOLDING does not use the qualitative
method to evaluate the effectiveness or to measure the ineffectiveness of these strategies.
Instead, ITAÚ UNIBANCO HOLDING uses the
percentage approach and dollar offset method:
• The
percentage approach is based on the calculation of change in the fair value of the revised estimate for the hedged position (hedged item)
attributable to the protected risk versus the change in the fair value of the derivative hedging instrument.
• The
dollar offset method is based on the difference between the variation in the fair value of the hedging instrument and the variation in
the fair value of the hedged item attributed to changes in the interest rate.
The effects of hedge accounting on the financial position
and performance of ITAÚ UNIBANCO HOLDING are presented below:
| Strategies |
06/30/2023 |
| Hedge Item |
|
Hedge Instruments (2) |
| Book Value (1) |
Fair Value |
Variation in fair value recognized in income |
|
Notional amount |
Variation in fair value used to calculate hedge ineffectiveness |
| Assets |
Liabilities |
Assets |
Liabilities |
|
| Interest rate risk |
|
|
|
|
|
|
|
|
| Hedge of loan operations |
11,443 |
- |
11,205 |
- |
(238) |
|
11,443 |
237 |
| Hedge of funding |
- |
13,752 |
- |
13,424 |
328 |
|
13,752 |
(328) |
| Hedge of securities |
11,352 |
- |
11,233 |
- |
(119) |
|
11,372 |
131 |
| Total |
22,795 |
13,752 |
22,438 |
13,424 |
(29) |
|
36,567 |
40 |
| |
|
|
|
|
|
|
|
|
| Strategies |
12/31/2022 |
| Hedge Item |
|
Hedge Instruments (2) |
| Book Value (1) |
Fair Value |
Variation in fair value recognized in income |
|
Notional amount |
Variation in fair value used to calculate hedge ineffectiveness |
| Assets |
Liabilities |
Assets |
Liabilities |
|
| Interest rate risk |
|
|
|
|
|
|
|
|
| Hedge of loan operations |
16,031 |
- |
15,582 |
- |
(449) |
|
16,031 |
448 |
| Hedge of funding |
- |
14,603 |
- |
13,905 |
698 |
|
14,603 |
(703) |
| Hedge of securities |
7,363 |
- |
7,134 |
- |
(229) |
|
7,317 |
225 |
| Total |
23,394 |
14,603 |
22,716 |
13,905 |
20 |
|
37,951 |
(30) |
1) Amounts recorded under heading Deposits, Securities, Funds from Interbank Markets and Loan and Lease Operations.
2) Comprises the amount of R$ 4,427 (R$ 4,349 at 12/31/2022), related to instruments exposed by the change in reference interest rates - IBORs. |
In the period, there was revocation of fair value hedge
relationships in the instrument's notional amount of R$ 7,856 and with an effective portion of R$ 69, deferred in income over the
period of the hedged item.
For loan operations strategies, the entity reestablishes
the coverage ratio, since both the hedged item and the instruments change over time. This occurs because they are portfolio strategies
that reflect the risk management strategy guidelines approved in the proper authority level.
| Hedge Instruments |
06/30/2023 |
| Notional amount |
Book value (1) |
Variation in fair value used to calculate hedge ineffectiveness |
Hedge ineffectiveness recognized in income |
| Assets |
Liabilities |
| Interest rate risk |
|
|
|
|
|
| Swaps |
32,451 |
782 |
730 |
46 |
11 |
| Futures |
4,116 |
- |
6 |
(6) |
- |
| Total |
36,567 |
782 |
736 |
40 |
11 |
| |
|
|
|
|
|
| Hedge Instruments |
12/31/2022 |
| Notional amount |
Book value (1) |
Variation in fair value used to calculate hedge ineffectiveness |
Hedge ineffectiveness recognized in income |
| Assets |
Liabilities |
| Interest rate risk |
|
|
|
|
|
| Swaps |
35,091 |
1,002 |
929 |
(49) |
(10) |
| Futures |
2,860 |
4 |
- |
19 |
- |
| Total |
37,951 |
1,006 |
929 |
(30) |
(10) |
| 1) Amounts recorded under heading Derivatives. |
| The table below presents, for each strategy, the notional amount and the fair value adjustments of hedge instruments and the book value of the hedged item: |
| |
|
|
|
|
|
|
|
| |
06/30/2023 |
|
12/31/2022 |
| Hedge instruments |
Hedged item |
|
Hedge instruments |
Hedged item |
| Notional amount |
Fair value adjustments |
Book Value |
|
Notional amount |
Fair value adjustments |
Book Value |
| Hedge of deposits and repurchase agreements |
107,315 |
(93) |
106,589 |
|
149,210 |
(27) |
149,300 |
| Hedge of highly probable forecast transactions |
274 |
(18) |
300 |
|
343 |
1 |
343 |
| Hedge of net investment in foreign operations |
9,818 |
2,734 |
9,560 |
|
9,933 |
2,591 |
8,983 |
| Hedge of loan operations (Fair value) |
11,443 |
607 |
11,443 |
|
16,031 |
820 |
16,031 |
| Hedge of loan operations (Cash flow) |
12,426 |
(58) |
12,453 |
|
3,288 |
(11) |
3,283 |
| Hedge of funding (Fair value) |
13,752 |
(502) |
13,752 |
|
14,603 |
(762) |
14,603 |
| Hedge of funding (Cash flow) |
9,477 |
(236) |
9,509 |
|
7,326 |
391 |
7,241 |
| Hedge of assets transactions |
6,966 |
2 |
7,138 |
|
6,528 |
1 |
6,894 |
| Hedge of asset-backed securities under repurchase agreements |
34,169 |
102 |
33,440 |
|
50,848 |
30 |
52,916 |
| Hedge of assets denominated in UF |
15,215 |
44 |
15,350 |
|
7,853 |
(646) |
7,871 |
| Hedge of securities |
11,372 |
(59) |
11,352 |
|
7,317 |
19 |
7,363 |
| Total |
|
2,523 |
|
|
|
2,407 |
|
| The table below shows the breakdown by maturity of the hedging strategies: |
| |
|
|
|
|
|
|
|
|
| |
06/30/2023 |
| |
0-1 year |
1-2 years |
2-3 years |
3-4 years |
4-5 years |
5-10 years |
Over 10 years |
Total |
| Hedge of deposits and repurchase agreements |
90,693 |
4,083 |
1,644 |
8,779 |
900 |
1,216 |
- |
107,315 |
| Hedge of highly probable forecast transactions |
274 |
- |
- |
- |
- |
- |
- |
274 |
| Hedge of net investment in foreign operations (1) |
9,818 |
- |
- |
- |
- |
- |
- |
9,818 |
| Hedge of loan operations (Fair value) |
1,444 |
2,316 |
2,016 |
1,406 |
2,849 |
1,412 |
- |
11,443 |
| Hedge of loan operations (Cash flow) |
6,381 |
2,782 |
1,684 |
- |
1,579 |
- |
- |
12,426 |
| Hedge of funding (Fair value) |
3,935 |
1,900 |
1,100 |
826 |
500 |
3,581 |
1,910 |
13,752 |
| Hedge of funding (Cash flow) |
3,369 |
3,608 |
- |
663 |
1,494 |
343 |
- |
9,477 |
| Hedge of assets transactions |
6,966 |
- |
- |
- |
- |
- |
- |
6,966 |
| Hedge of asset-backed securities under repurchase agreements |
- |
9,005 |
17,411 |
7,753 |
- |
- |
- |
34,169 |
| Hedge of assets denominated in UF |
15,215 |
- |
- |
- |
- |
- |
- |
15,215 |
| Hedge of securities |
4,516 |
2,721 |
834 |
214 |
168 |
2,279 |
640 |
11,372 |
| Total |
142,611 |
26,415 |
24,689 |
19,641 |
7,490 |
8,831 |
2,550 |
232,227 |
| |
|
|
|
|
|
|
|
|
| |
12/31/2022 |
| |
0-1 year |
1-2 years |
2-3 years |
3-4 years |
4-5 years |
5-10 years |
Over 10 years |
Total |
| Hedge of deposits and repurchase agreements |
108,499 |
26,120 |
9,110 |
- |
4,726 |
755 |
- |
149,210 |
| Hedge of highly probable forecast transactions |
343 |
- |
- |
- |
- |
- |
- |
343 |
| Hedge of net investment in foreign operations (1) |
9,933 |
- |
- |
- |
- |
- |
- |
9,933 |
| Hedge of loan operations (Fair value) |
2,351 |
3,395 |
1,244 |
2,539 |
2,749 |
3,753 |
- |
16,031 |
| Hedge of loan operations (Cash flow) |
- |
1,577 |
1,161 |
- |
550 |
- |
- |
3,288 |
| Hedge of funding (Fair value) |
1,673 |
885 |
1,288 |
3,091 |
579 |
4,981 |
2,106 |
14,603 |
| Hedge of funding (Cash flow) |
5,776 |
578 |
- |
675 |
- |
297 |
- |
7,326 |
| Hedge of assets transactions |
- |
6,528 |
- |
- |
- |
- |
- |
6,528 |
| Hedge of asset-backed securities under repurchase agreements |
16,696 |
9,705 |
22,740 |
1,085 |
622 |
- |
- |
50,848 |
| Hedge of assets denominated in UF |
7,853 |
- |
- |
- |
- |
- |
- |
7,853 |
| Hedge of securities |
3,215 |
660 |
1,547 |
180 |
346 |
673 |
696 |
7,317 |
| Total |
156,339 |
49,448 |
37,090 |
7,570 |
9,572 |
10,459 |
2,802 |
273,280 |
| 1) Classified as current, since instruments are frequently renewed. |
Note 8 - Financial assets at fair value
through other comprehensive income - Securities
| The fair value and corresponding
gross carrying amount of Financial Assets at Fair Value through Other Comprehensive Income - Securities assets are as follows: |
| |
06/30/2023 |
|
12/31/2022 |
| |
Gross
carrying amount |
Fair
value adjustments (in stockholders' equity) |
Expected
loss |
Fair
value |
|
Gross
carrying amount |
Fair
value adjustments (in stockholders' equity) |
Expected
loss |
Fair
value |
| Brazilian
government securities (1) |
79,901 |
-1,558 |
0 |
78,343 |
|
79,844 |
-3,165 |
0 |
76,679 |
| Other government securities |
36 |
0 |
-36 |
0 |
|
36 |
0 |
-36 |
0 |
| Government
securities – abroad (1) |
44,361 |
-134 |
-4 |
44,223 |
|
38,397 |
-486 |
-1 |
37,910 |
| Argentina |
1,784 |
-1 |
0 |
1,783 |
|
2,791 |
-11 |
0 |
2,780 |
| Colombia |
1,136 |
-32 |
0 |
1,104 |
|
1,766 |
-284 |
0 |
1,482 |
| Chile |
25,396 |
-28 |
0 |
25,368 |
|
18,358 |
-129 |
0 |
18,229 |
| United States |
8,561 |
-102 |
0 |
8,459 |
|
9,104 |
-49 |
0 |
9,055 |
| Mexico |
501 |
1 |
0 |
502 |
|
760 |
-3 |
0 |
757 |
| Paraguay |
3,623 |
24 |
-4 |
3,643 |
|
3,362 |
3 |
-1 |
3,364 |
| Switzerland |
0 |
0 |
0 |
0 |
|
1,356 |
-11 |
0 |
1,345 |
| Uruguay |
3,360 |
4 |
0 |
3,364 |
|
900 |
-2 |
0 |
898 |
| Corporate
securities (1) |
13,556 |
-1,667 |
-108 |
11,781 |
|
16,027 |
-3,791 |
-77 |
12,159 |
| Shares |
7,341 |
-1,581 |
0 |
5,760 |
|
8,571 |
-3,686 |
0 |
4,885 |
| Rural product note |
0 |
0 |
0 |
0 |
|
373 |
18 |
-1 |
390 |
| Bank deposit certificates |
60 |
0 |
-8 |
52 |
|
714 |
0 |
0 |
714 |
| Real estate receivables certificates |
389 |
-13 |
0 |
376 |
|
0 |
0 |
0 |
0 |
| Debentures |
1,620 |
-28 |
-72 |
1,520 |
|
1,231 |
-3 |
-45 |
1,183 |
| Eurobonds and other |
3,790 |
-57 |
-24 |
3,709 |
|
4,418 |
-112 |
-27 |
4,279 |
| Financial bills |
0 |
0 |
0 |
0 |
|
13 |
0 |
0 |
13 |
| Other |
356 |
12 |
-4 |
364 |
|
707 |
-8 |
-4 |
695 |
| Total |
137,854 |
-3,359 |
-148 |
134,347 |
|
134,304 |
-7,442 |
-114 |
126,748 |
| 1) Financial assets at fair
value through other comprehensive income - Securities pledged in guarantee of funding transactions of financial institutions and
customers and Post-employment benefits (Note 26b), were: a) Brazilian government securities R$ 52,903 (R$ 50,918 at 12/31/2022),
b) Government securities - abroad R$ 6,923 (R$ 6,662 at 12/31/2022) and c) Corporate securities R$ 573 (720 at 12/31/2022), totaling
R$ 60,399 (R$ 58,300 at 12/31/2022). |
| The gross carrying amount and
the fair value of financial assets through other comprehensive income - securities by maturity are as follows: |
| |
06/30/2023 |
|
12/31/2022 |
| |
Gross
carrying amount |
Fair
value |
|
Gross
carrying amount |
Fair
value |
| Current |
53,512 |
51,771 |
|
59,304 |
55,517 |
| Non-stated maturity |
7,341 |
5,760 |
|
8,571 |
4,885 |
| Up to one year |
46,171 |
46,011 |
|
50,733 |
50,632 |
| Non-current |
84,342 |
82,576 |
|
75,000 |
71,231 |
| From one to five years |
57,183 |
56,613 |
|
49,068 |
47,705 |
| From five to ten years |
16,705 |
16,195 |
|
17,458 |
16,340 |
| After ten years |
10,454 |
9,768 |
|
8,474 |
7,186 |
| Total |
137,854 |
134,347 |
|
134,304 |
126,748 |
| Equity instruments at fair value
through other comprehensive income - securities are presented in the table below: |
| |
06/30/2023 |
|
12/31/2022 |
| |
Gross
carrying amount |
Adjustments
to fair value (in Stockholders' equity) |
Expected
loss |
Fair
value |
|
Gross
carrying amount |
Adjustments
to fair value (in Stockholders' equity) |
Expected
loss |
Fair
value |
| Current |
|
|
|
|
|
|
|
|
|
| Non-stated maturity |
|
|
|
|
|
|
|
|
|
| Shares |
7,341 |
(1,581) |
- |
5,760 |
|
8,571 |
(3,686) |
- |
4,885 |
| Total |
7,341 |
(1,581) |
- |
5,760 |
|
8,571 |
(3,686) |
- |
4,885 |
ITAÚ UNIBANCO HOLDING adopted the option of designating
equity instruments at fair value through other comprehensive income due to the particularities of a certain market.
In the periods, there was no receipt of dividends and at
06/30/2023 there were reclassifications of R$ (89.7) (R$ (48.3) at 12/31/2022) in Stockholders' equity, due to
partial sales of XP INC shares (Note 3).
| Reconciliation of expected loss for Other financial assets,
segregated by stages: |
| 01/01/2023 |
|
|
|
|
|
|
|
|
|
|
| Stage
1 |
|
Expected
loss |
Gains
/ (Losses) |
Purchases |
Settlements |
Transfer
to stage 2 |
Transfer
to stage 3 |
Cure
from stage 2 |
Cure
from stage 3 |
Expected
loss |
| |
12/31/2022 |
06/30/2023 |
| Financial assets at fair
value through other comprehensive income |
|
(114) |
(14) |
(3) |
6 |
4 |
8 |
(3) |
- |
(116) |
| Brazilian government securities |
|
(36) |
- |
- |
- |
- |
- |
- |
- |
(36) |
| Other |
|
(36) |
- |
- |
- |
- |
- |
- |
- |
(36) |
| Government securities -
abroad |
|
(1) |
(3) |
- |
- |
- |
- |
- |
- |
(4) |
| Corporate securities |
|
(77) |
(11) |
(3) |
6 |
4 |
8 |
(3) |
- |
(76) |
| Rural product note |
|
(1) |
- |
- |
1 |
- |
- |
- |
- |
- |
| Bank deposit certificate |
|
- |
(12) |
- |
4 |
- |
8 |
- |
- |
- |
| Debentures |
|
(45) |
(3) |
(2) |
1 |
4 |
- |
(3) |
- |
(48) |
| Eurobonds and other |
|
(27) |
4 |
(1) |
- |
- |
- |
- |
- |
(24) |
| Other |
|
(4) |
- |
- |
- |
- |
- |
- |
- |
(4) |
| |
|
|
|
|
|
|
|
|
|
|
| Stage
2 |
|
Expected
loss |
Gains
/ (Losses) |
Purchases |
Settlements |
Cure
to stage 1 |
Transfer
to stage 3 |
Transfer
from stage 1 |
Cure
from stage 3 |
Expected
loss |
| |
12/31/2022 |
06/30/2023 |
| Financial assets at fair
value through other comprehensive income |
|
- |
(23) |
- |
- |
3 |
- |
(4) |
- |
(24) |
| Corporate securities |
|
- |
(23) |
- |
- |
3 |
- |
(4) |
- |
(24) |
| Debentures |
|
- |
(23) |
- |
- |
3 |
- |
(4) |
- |
(24) |
| |
|
|
|
|
|
|
|
|
|
|
| Stage
3 |
|
Expected
loss |
Gains
/ (Losses) |
Purchases |
Settlements |
Cure
to stage 1 |
Cure
to stage 2 |
Transfer
from stage 1 |
Transfer
from stage 2 |
Expected
loss |
| |
12/31/2022 |
06/30/2023 |
| Financial assets at fair
value through other comprehensive income |
|
- |
- |
- |
- |
- |
- |
(8) |
- |
(8) |
| Corporate securities |
|
- |
- |
- |
- |
- |
- |
(8) |
- |
(8) |
| Bank deposit
certificate |
|
- |
- |
- |
- |
- |
- |
(8) |
- |
(8) |
| 01/01/2022 |
|
|
|
|
|
|
|
|
|
|
| Stage
1 |
|
Expected
loss |
Gains
/ (Losses) |
Purchases |
Settlements |
Transfer
to stage 2 |
Transfer
to stage 3 |
Cure
from stage 2 |
Cure
from stage 3 |
Expected
loss |
| |
12/31/2021 |
12/31/2022 |
| Financial assets at fair
value through other comprehensive income |
|
(84) |
(14) |
(16) |
- |
- |
- |
- |
- |
(114) |
| Brazilian government securities |
|
(36) |
- |
- |
- |
- |
- |
- |
- |
(36) |
| Other |
|
(36) |
- |
- |
- |
- |
- |
- |
- |
(36) |
| Government securities -
abroad |
|
- |
- |
(1) |
- |
- |
- |
- |
- |
(1) |
| Corporate securities |
|
(48) |
(14) |
(15) |
- |
- |
- |
- |
- |
(77) |
| Rural product note |
|
- |
(1) |
- |
- |
- |
- |
- |
- |
(1) |
| Debentures |
|
(44) |
(1) |
- |
- |
- |
- |
- |
- |
(45) |
| Eurobonds and other |
|
(1) |
(13) |
(13) |
- |
- |
- |
- |
- |
(27) |
| Other |
|
(3) |
1 |
(2) |
- |
- |
- |
- |
- |
(4) |
Note 9 - Financial assets at amortized
cost - Securities
| The Financial assets at amortized cost - Securities are as
follows: |
| |
06/30/2023 |
|
12/31/2022 |
| |
Amortized
Cost |
Expected
Loss |
Net
Amortized Cost |
|
Amortized
Cost |
Expected
Loss |
Net
Amortized Cost |
| Brazilian
government securities (1) |
84,130 |
(26) |
84,104 |
|
85,521 |
(30) |
85,491 |
| Government securities
– abroad |
42,126 |
(8) |
42,118 |
|
39,243 |
(11) |
39,232 |
| Colombia |
1,872 |
(1) |
1,871 |
|
820 |
(1) |
819 |
| Chile |
5,144 |
- |
5,144 |
|
4,805 |
- |
4,805 |
| Korea |
10,766 |
- |
10,766 |
|
10,365 |
(2) |
10,363 |
| Spain |
9,957 |
(1) |
9,956 |
|
9,924 |
(2) |
9,922 |
| United States |
27 |
- |
27 |
|
- |
- |
- |
| Mexico |
12,471 |
(6) |
12,465 |
|
13,246 |
(6) |
13,240 |
| Paraguay |
117 |
- |
117 |
|
59 |
- |
59 |
| Czech Republic |
1,725 |
- |
1,725 |
|
- |
- |
- |
| Uruguay |
47 |
- |
47 |
|
24 |
- |
24 |
| Corporate
securities (1) |
109,755 |
(1,709) |
108,046 |
|
88,262 |
(1,997) |
86,265 |
| Rural product note |
38,256 |
(219) |
38,037 |
|
26,129 |
(140) |
25,989 |
| Bank deposit certificates |
30 |
- |
30 |
|
98 |
- |
98 |
| Real estate receivables certificates |
5,058 |
(5) |
5,053 |
|
5,738 |
(4) |
5,734 |
| Debentures |
53,615 |
(1,448) |
52,167 |
|
47,785 |
(1,835) |
45,950 |
| Eurobonds and other |
462 |
(1) |
461 |
|
118 |
- |
118 |
| Financial bills |
756 |
- |
756 |
|
113 |
- |
113 |
| Promissory and commercial notes |
9,234 |
(28) |
9,206 |
|
7,363 |
(13) |
7,350 |
| Other |
2,344 |
(8) |
2,336 |
|
918 |
(5) |
913 |
| Total |
236,011 |
(1,743) |
234,268 |
|
213,026 |
(2,038) |
210,988 |
| 1) Financial
Assets at Amortized Cost – Securities Pledged as Collateral of Funding Transactions of Financial Institutions and Customers
and Post-employment benefits (Note 26b), were: a) Brazilian government securities R$ 23,464 (R$ 23,639 at 12/31/2022), b) Government
securities - abroad R$ 508 (R$ 0 at 12/31/2022); and c) Corporate securities R$ 13,975 (R$ 12,718 at 12/31/2022), totaling R$ 37,947
(R$ 36,357 at 12/31/2022). |
On January 1, 2023, a new business model was used, classified
as Amortized Cost, for capital management of a company in Colombia (Itaú Colombia S.A.), in which Foreign Government Securities
in the amount of R$ 1,026 were to be classified, previously classified in the Fair Value business model through Other Comprehensive
Income.
On the same date, there was a change of Global Bonds, in
the amount of R$ 408, from the business model Fair Value through Profit or Loss to Amortized Cost, referring to a company located in the
Bahamas (Itaú Unibanco S.A., Nassau Branch) for compliance with a regulatory change related to the risk management of the trading
portfolio and the banking portfolio.
On 06/30/2023, the fair value of reclassified assets would be R$ 1,287, the adjustment
to fair value that would have been recognized in Other Comprehensive Income would be R$ (107) and the adjustment to fair value that would
have been recognized in Income would be R$ (6).
| The amortized cost of Financial assets at amortized cost
- Securities by maturity is as follows: |
| |
06/30/2023 |
|
12/31/2022 |
| |
Amortized
Cost |
Net
Amortized Cost |
|
Amortized
Cost |
Net
Amortized Cost |
| Current |
78,997 |
78,624 |
|
62,125 |
61,528 |
| Up to one year |
78,997 |
78,624 |
|
62,125 |
61,528 |
| Non-current |
157,014 |
155,644 |
|
150,901 |
149,460 |
| From one to five years |
111,256 |
110,289 |
|
107,970 |
107,431 |
| From five to ten years |
41,869 |
41,466 |
|
38,526 |
37,625 |
| After ten years |
3,889 |
3,889 |
|
4,405 |
4,404 |
| Total |
236,011 |
234,268 |
|
213,026 |
210,988 |
| Reconciliation of expected loss to financial assets at amortized
cost - securities, segregated by stages: |
| |
|
|
|
|
|
|
|
|
|
| Stage
1 |
Expected
loss |
Gains
/ (Losses) |
Purchases |
Settlements |
Transfer
to Stage 2 |
Transfer
to Stage 3 |
Cure
from Stage 2 |
Cure
from Stage 3 |
Expected
loss |
| 12/31/2022 |
06/30/2023 |
| Financial assets at amortized cost |
(208) |
6 |
(241) |
20 |
14 |
141 |
(6) |
(18) |
(292) |
| Brazilian government securities |
(30) |
4 |
- |
- |
- |
- |
- |
- |
(26) |
| Government securities -
abroad |
(11) |
10 |
(8) |
1 |
- |
- |
- |
- |
(8) |
| Colombia |
(1) |
- |
- |
- |
- |
- |
- |
- |
(1) |
| Korea |
(2) |
2 |
- |
- |
- |
- |
- |
- |
- |
| Spain |
(2) |
1 |
- |
- |
- |
- |
- |
- |
(1) |
| Mexico |
(6) |
7 |
(8) |
1 |
- |
- |
- |
- |
(6) |
| Corporate securities |
(167) |
(8) |
(233) |
19 |
14 |
141 |
(6) |
(18) |
(258) |
| Rural product note |
(105) |
33 |
(78) |
7 |
13 |
6 |
(6) |
(18) |
(148) |
| Real estate receivables certificates |
(4) |
(7) |
- |
6 |
- |
- |
- |
- |
(5) |
| Debentures |
(44) |
(18) |
(146) |
4 |
1 |
135 |
- |
- |
(68) |
| Eurobond and other |
- |
(2) |
- |
1 |
- |
- |
- |
- |
(1) |
| Promissory and commercial notes |
(13) |
(11) |
(5) |
1 |
- |
- |
- |
- |
(28) |
| Other |
(1) |
(3) |
(4) |
- |
- |
- |
- |
- |
(8) |
| |
|
|
|
|
|
|
|
|
|
| Stage
2 |
Expected
loss |
Gains
/ (Losses) |
Purchases |
Settlements |
Cure
to Stage 1 |
Transfer
to Stage 3 |
Transfer
from Stage 1 |
Cure
from Stage 3 |
Expected
loss |
| 12/31/2022 |
06/30/2023 |
| Financial assets at amortized cost |
(114) |
(8) |
(9) |
14 |
6 |
101 |
(14) |
(5) |
(29) |
| Corporate securities |
(114) |
(8) |
(9) |
14 |
6 |
101 |
(14) |
(5) |
(29) |
| Rural product note |
(24) |
(20) |
(9) |
5 |
6 |
39 |
(13) |
(5) |
(21) |
| Debentures |
(86) |
8 |
- |
9 |
- |
62 |
(1) |
- |
(8) |
| Other |
(4) |
4 |
- |
- |
- |
- |
- |
- |
- |
| |
|
|
|
|
|
|
|
|
|
| Stage
3 |
Expected
loss |
Gains
/ (Losses) |
Purchases |
Settlements |
Cure
to Stage 1 |
Cure
to Stage 2 |
Transfer
from Stage 1 |
Transfer
from Stage 2 |
Expected
loss |
| 12/31/2022 |
06/30/2023 |
| Financial assets at amortized cost |
(1,716) |
(267) |
(31) |
811 |
18 |
5 |
(141) |
(101) |
(1,422) |
| Corporate securities |
(1,716) |
(267) |
(31) |
811 |
18 |
5 |
(141) |
(101) |
(1,422) |
| Rural product note |
(11) |
(2) |
(27) |
12 |
18 |
5 |
(6) |
(39) |
(50) |
| Debentures |
(1,705) |
(265) |
(4) |
799 |
- |
- |
(135) |
(62) |
(1,372) |
| Stage
1 |
Expected
loss |
Gains
/ (Losses) |
Purchases |
Settlements |
Transfer
to Stage 2 |
Transfer
to Stage 3 |
Cure
from Stage 2 |
Cure
from Stage 3 |
Expected
loss |
| 12/31/2021 |
12/31/2022 |
| Financial assets at amortized cost |
(74) |
(80) |
(149) |
42 |
53 |
3 |
(3) |
- |
(208) |
| Brazilian government securities |
(37) |
7 |
- |
- |
- |
- |
- |
- |
(30) |
| Government securities -
abroad |
(7) |
8 |
(18) |
6 |
- |
- |
- |
- |
(11) |
| Colombia |
(1) |
1 |
(1) |
- |
- |
- |
- |
- |
(1) |
| Korea |
- |
(2) |
- |
- |
- |
- |
- |
- |
(2) |
| Spain |
(1) |
- |
(1) |
- |
- |
- |
- |
- |
(2) |
| Mexico |
(5) |
9 |
(16) |
6 |
- |
- |
- |
- |
(6) |
| Corporate securities |
(30) |
(95) |
(131) |
36 |
53 |
3 |
(3) |
- |
(167) |
| Rural product note |
(5) |
(65) |
(64) |
8 |
21 |
3 |
(3) |
- |
(105) |
| Bank deposit certificate |
(1) |
1 |
- |
- |
- |
- |
- |
- |
- |
| Real estate receivables certificates |
(1) |
14 |
(19) |
2 |
- |
- |
- |
- |
(4) |
| Debentures |
(18) |
(42) |
(31) |
15 |
32 |
- |
- |
- |
(44) |
| Eurobond and other |
(2) |
- |
- |
2 |
- |
- |
- |
- |
- |
| Promissory and commercial notes |
(2) |
(1) |
(14) |
4 |
- |
- |
- |
- |
(13) |
| Other |
(1) |
(2) |
(3) |
5 |
- |
- |
- |
- |
(1) |
| 01/01/2022 |
|
|
|
|
|
|
|
|
|
| Stage
2 |
Expected
loss |
Gains
/ (Losses) |
Purchases |
Settlements |
Cure
to Stage 1 |
Transfer
to Stage 3 |
Transfer
from Stage 1 |
Cure
from Stage 3 |
Expected
loss |
| 12/31/2021 |
12/31/2022 |
| Financial assets at amortized cost |
(38) |
(136) |
(3) |
104 |
3 |
9 |
(53) |
- |
(114) |
| Corporate securities |
(38) |
(136) |
(3) |
104 |
3 |
9 |
(53) |
- |
(114) |
| Rural product note |
- |
(12) |
(3) |
- |
3 |
9 |
(21) |
- |
(24) |
| Debentures |
(38) |
(120) |
- |
104 |
- |
- |
(32) |
- |
(86) |
| Other |
- |
(4) |
- |
- |
- |
- |
- |
- |
(4) |
| |
|
|
|
|
|
|
|
|
|
| Stage
3 |
Expected
loss |
Gains
/ (Losses) |
Purchases |
Settlements |
Cure
to Stage 1 |
Cure
to Stage 2 |
Transfer
from Stage 1 |
Transfer
from Stage 2 |
Expected
loss |
| 12/31/2021 |
12/31/2022 |
| Financial assets at amortized
cost |
(1,836) |
(244) |
(27) |
403 |
- |
- |
(3) |
(9) |
(1,716) |
| Corporate securities |
(1,836) |
(244) |
(27) |
403 |
- |
- |
(3) |
(9) |
(1,716) |
| Rural product note |
(9) |
7 |
(6) |
9 |
- |
- |
(3) |
(9) |
(11) |
| Debentures |
(1,827) |
(251) |
(21) |
394 |
- |
- |
- |
- |
(1,705) |
Note 10 - Loan and lease operations
a) Composition of loans and lease operations
portfolio
| Below is the composition of the
carrying amount of loan operations and lease operations by type, sector of debtor, maturity and concentration: |
| Loans
and lease operations by type |
06/30/2023 |
12/31/2022 |
| Individuals |
406,948 |
400,103 |
| Credit card |
129,403 |
135,855 |
| Personal loan |
59,181 |
53,945 |
| Payroll loans |
75,203 |
73,633 |
| Vehicles |
32,440 |
31,606 |
| Mortgage loans |
110,721 |
105,064 |
| Corporate |
134,017 |
139,268 |
| Micro / small and medium companies |
161,532 |
164,896 |
| Foreign loans
- Latin America |
198,688 |
205,155 |
| Total loans
and lease operations |
901,185 |
909,422 |
| Provision
for Expected Loss (1) |
(54,046) |
(52,324) |
| Total
loans and lease operations, net of Expected Credit Loss |
847,139 |
857,098 |
| 1) Comprises
Expected Credit Loss for Financial Guarantees Pledged R$ (778) (R$ (810) at 12/31/2022) and Loan Commitments R$ (3,094) (R$ (2,874)
at 12/31/2022). |
| By
maturity |
06/30/2023 |
12/31/2022 |
| Overdue as from 1 day |
29,984 |
30,656 |
| Falling due up to 3 months |
238,153 |
247,233 |
| Falling due from 3 months to 12 months |
231,089 |
228,942 |
| Falling due after 1 year |
401,959 |
402,591 |
| Total
loans and lease operations |
901,185 |
909,422 |
| |
|
|
| By
concentration |
06/30/2023 |
12/31/2022 |
| Largest debtor |
5,569 |
5,916 |
| 10 largest debtors |
33,586 |
33,265 |
| 20 largest debtors |
51,263 |
50,714 |
| 50 largest debtors |
83,562 |
85,427 |
| 100 largest
debtors |
116,068 |
118,015 |
The breakdown of the loans and lease operations portfolio
by debtor’s industry is described in Note 32, item 1.4.1 - By business sector.
b) Gross Carrying Amount (Loan Portfolio)
| Reconciliation of gross portfolio of loans and lease operations, segregated by stages: |
| 01/01/2023 |
|
|
|
|
|
|
|
|
| Stage 1 |
Balance at |
Transfer to Stage 2 |
Transfer to Stage 3 (1) |
Cure from Stage 2 |
Cure from Stage 3 |
Derecognition |
Acquisition / (Settlement) |
Closing balance |
| 12/31/2022 |
06/30/2023 |
| Individuals |
305,210 |
(24,803) |
(1,139) |
14,513 |
81 |
- |
14,728 |
308,590 |
| Corporate |
133,205 |
(441) |
(16) |
220 |
116 |
- |
(5,053) |
128,031 |
| Micro / Small and medium companies |
142,621 |
(7,580) |
(659) |
2,600 |
81 |
- |
(384) |
136,679 |
| Foreign loans - Latin America |
182,516 |
(5,108) |
(424) |
2,580 |
6 |
- |
(3,227) |
176,343 |
| Total |
763,552 |
(37,932) |
(2,238) |
19,913 |
284 |
- |
6,064 |
749,643 |
| |
|
|
|
|
|
|
|
|
| Stage 2 |
Balance at |
Cure to Stage 1 |
Transfer to Stage 3 |
Transfer from Stage 1 |
Cure from Stage 3 |
Derecognition |
Acquisition / (Settlement) |
Closing balance |
| 12/31/2022 |
06/30/2023 |
| Individuals |
59,639 |
(14,513) |
(7,184) |
24,803 |
625 |
- |
(2,805) |
60,565 |
| Corporate |
901 |
(220) |
(137) |
441 |
13 |
- |
(6) |
992 |
| Micro / Small and medium companies |
12,299 |
(2,600) |
(2,656) |
7,580 |
288 |
- |
(951) |
13,960 |
| Foreign loans - Latin America |
13,863 |
(2,580) |
(2,175) |
5,108 |
149 |
- |
(1,371) |
12,994 |
| Total |
86,702 |
(19,913) |
(12,152) |
37,932 |
1,075 |
- |
(5,133) |
88,511 |
| |
|
|
|
|
|
|
|
|
| Stage 3 |
Balance at |
Cure to Stage 1 |
Cure to Stage 2 |
Transfer from Stage 1 |
Transfer from Stage 2 |
Derecognition |
Acquisition / (Settlement) |
Closing balance |
| 12/31/2022 |
06/30/2023 |
| Individuals |
35,254 |
(81) |
(625) |
1,139 |
7,184 |
(11,156) |
6,078 |
37,793 |
| Corporate |
5,162 |
(116) |
(13) |
16 |
137 |
42 |
(234) |
4,994 |
| Micro / Small and medium companies |
9,976 |
(81) |
(288) |
659 |
2,656 |
(2,256) |
227 |
10,893 |
| Foreign loans - Latin America |
8,776 |
(6) |
(149) |
424 |
2,175 |
(1,193) |
(676) |
9,351 |
| Total |
59,168 |
(284) |
(1,075) |
2,238 |
12,152 |
(14,563) |
5,395 |
63,031 |
| |
|
|
|
|
|
|
|
|
| Consolidated 3 Stages |
|
|
|
|
Balance at |
Derecognition |
Acquisition / (Settlement) |
Closing balance |
| |
|
|
|
12/31/2022 |
06/30/2023 |
| Individuals |
|
|
|
|
400,103 |
(11,156) |
18,001 |
406,948 |
| Corporate |
|
|
|
|
139,268 |
42 |
(5,293) |
134,017 |
| Micro / Small and medium companies |
|
|
|
|
164,896 |
(2,256) |
(1,108) |
161,532 |
| Foreign loans - Latin America |
|
|
|
|
205,155 |
(1,193) |
(5,274) |
198,688 |
| Total (2) |
|
|
|
|
909,422 |
(14,563) |
6,326 |
901,185 |
1) In the movement of transfer of operations from stage 1 to stage 3 over the period, a representative part there of have first gone through stage 2.
2) Comprises R$ 7,019 pegged to Libor. |
| Reconciliation of gross portfolio of loans and lease operations, segregated by stages: |
| 01/01/2022 |
|
|
|
|
|
|
|
|
| Stage 1 |
Balance at |
Transfer to Stage 2 (3) |
Transfer to Stage 3 (1) |
Cure from Stage 2 (3) |
Cure from Stage 3 |
Derecognition |
Acquisition / (Settlement) |
Closing balance |
| 12/31/2021 |
12/31/2022 |
| Individuals |
270,371 |
(65,771) |
(2,966) |
29,153 |
61 |
- |
74,362 |
305,210 |
| Corporate |
128,519 |
(626) |
(2,360) |
1,098 |
137 |
- |
6,437 |
133,205 |
| Micro / Small and medium companies |
124,555 |
(18,158) |
(1,600) |
16,215 |
170 |
- |
21,439 |
142,621 |
| Foreign loans - Latin America |
178,719 |
(7,720) |
(1,014) |
2,426 |
19 |
- |
10,086 |
182,516 |
| Total |
702,164 |
(92,275) |
(7,940) |
48,892 |
387 |
- |
112,324 |
763,552 |
| |
|
|
|
|
|
|
|
|
| Stage 2 |
Balance at |
Cure to Stage 1 (3) |
Transfer to Stage 3 |
Transfer from Stage 1 (3) |
Cure from Stage 3 |
Derecognition |
Acquisition / (Settlement) |
Closing balance |
| 12/31/2021 |
12/31/2022 |
| Individuals |
38,168 |
(29,153) |
(13,041) |
65,771 |
1,392 |
- |
(3,498) |
59,639 |
| Corporate |
1,600 |
(1,098) |
(173) |
626 |
19 |
- |
(73) |
901 |
| Micro / Small and medium companies |
16,749 |
(16,215) |
(4,310) |
18,158 |
1,167 |
- |
(3,250) |
12,299 |
| Foreign loans - Latin America |
13,389 |
(2,426) |
(3,388) |
7,720 |
831 |
- |
(2,263) |
13,863 |
| Total |
69,906 |
(48,892) |
(20,912) |
92,275 |
3,409 |
- |
(9,084) |
86,702 |
| |
|
|
|
|
|
|
|
|
| Stage 3 |
Balance at |
Cure to Stage 1 |
Cure to Stage 2 |
Transfer from Stage 1 |
Transfer from Stage 2 |
Derecognition |
Acquisition / (Settlement) |
Closing balance |
| 12/31/2021 |
12/31/2022 |
| Individuals |
23,997 |
(61) |
(1,392) |
2,966 |
13,041 |
(13,876) |
10,579 |
35,254 |
| Corporate |
4,915 |
(137) |
(19) |
2,360 |
173 |
(822) |
(1,308) |
5,162 |
| Micro / Small and medium companies |
8,666 |
(170) |
(1,167) |
1,600 |
4,310 |
(3,661) |
398 |
9,976 |
| Foreign loans - Latin America |
12,942 |
(19) |
(831) |
1,014 |
3,388 |
(1,783) |
(5,935) |
8,776 |
| Total |
50,520 |
(387) |
(3,409) |
7,940 |
20,912 |
(20,142) |
3,734 |
59,168 |
| |
|
|
|
|
|
|
|
|
| Consolidated 3 Stages |
|
|
|
|
Balance at |
Derecognition |
Acquisition / (Settlement) |
Closing balance |
| |
|
|
|
12/31/2021 |
12/31/2022 |
| Individuals |
|
|
|
|
332,536 |
(13,876) |
81,443 |
400,103 |
| Corporate |
|
|
|
|
135,034 |
(822) |
5,056 |
139,268 |
| Micro / Small and medium companies |
|
|
|
|
149,970 |
(3,661) |
18,587 |
164,896 |
| Foreign loans - Latin America |
|
|
|
|
205,050 |
(1,783) |
1,888 |
205,155 |
| Total (2) |
|
|
|
|
822,590 |
(20,142) |
106,974 |
909,422 |
1) In the movement of transfer of operations from stage 1 to stage 3 over the period, a representative part thereof have first gone through stage 2.
2) Comprises R$ 14,052 pegged to Libor.
3) The change in the period of the parameter used to estimate the significant increase/reduction in credit risk caused an effect on the transfer from stage 1 to stage 2 in the amount of R$ 26,005 and in the transfer from stage 2 to 1 in the amount if R$ 27,155. |
Modification of contractual cash flows
The amortized cost of financial assets classified in stages
2 and stage 3, which had their contractual cash flows modified was R$ 2,056 (R$ 1,949 at 12/31/2022) before the modification,
which gave rise to an effect on profit or loss of R$ 9 (R$ 7 from 01/01 to 06/30/2022). At 06/30/2023, the
gross carrying amount of financial assets which had their contractual cash flows modified in the period and were transferred to stage
1 corresponds to R$ 244 (R$ 601 at 12/31/2022).
c) Expected credit loss
| Reconciliation of expected credit loss of loans and lease operations, segregated by stages: |
| 01/01/2023 |
|
|
|
|
|
|
|
|
| Stage 1 |
Balance at |
Transfer to Stage 2 |
Transfer to Stage 3 (1) |
Cure from Stage 2 |
Cure from Stage 3 |
Derecognition |
(Increase) / Reversal |
Closing balance |
| 12/31/2022 |
06/30/2023 |
| Individuals |
(5,414) |
459 |
26 |
(572) |
(4) |
- |
(93) |
(5,598) |
| Corporate |
(480) |
5 |
1 |
(13) |
(3) |
- |
- |
(490) |
| Micro / Small and medium companies |
(1,431) |
137 |
11 |
(187) |
(16) |
- |
(272) |
(1,758) |
| Foreign loans - Latin America |
(2,339) |
114 |
11 |
(93) |
(1) |
- |
327 |
(1,981) |
| Total |
(9,664) |
715 |
49 |
(865) |
(24) |
- |
(38) |
(9,827) |
| |
|
|
|
|
|
|
|
|
| Stage 2 |
Balance at |
Cure to Stage 1 |
Transfer to Stage 3 |
Transfer from Stage 1 |
Cure from Stage 3 |
Derecognition |
(Increase) / Reversal |
Closing balance |
| 12/31/2022 |
06/30/2023 |
| Individuals |
(5,647) |
572 |
2,368 |
(459) |
(64) |
- |
(2,420) |
(5,650) |
| Corporate |
(503) |
13 |
28 |
(5) |
(4) |
- |
(261) |
(732) |
| Micro / Small and medium companies |
(2,227) |
187 |
652 |
(137) |
(55) |
- |
(647) |
(2,227) |
| Foreign loans - Latin America |
(1,546) |
93 |
426 |
(114) |
(46) |
- |
(310) |
(1,497) |
| Total |
(9,923) |
865 |
3,474 |
(715) |
(169) |
- |
(3,638) |
(10,106) |
| |
|
|
|
|
|
|
|
|
| Stage 3 |
Balance at |
Cure to Stage 1 |
Cure to Stage 2 |
Transfer from Stage 1 |
Transfer from Stage 2 |
Derecognition |
(Increase) / Reversal |
Closing balance |
| 12/31/2022 |
06/30/2023 |
| Individuals |
(19,220) |
4 |
64 |
(26) |
(2,368) |
11,156 |
(9,720) |
(20,110) |
| Corporate |
(4,470) |
3 |
4 |
(1) |
(28) |
(42) |
(168) |
(4,702) |
| Micro / Small and medium companies |
(5,932) |
16 |
55 |
(11) |
(652) |
2,256 |
(1,770) |
(6,038) |
| Foreign loans - Latin America |
(3,115) |
1 |
46 |
(11) |
(426) |
1,193 |
(951) |
(3,263) |
| Total |
(32,737) |
24 |
169 |
(49) |
(3,474) |
14,563 |
(12,609) |
(34,113) |
| |
|
|
|
|
|
|
|
|
| Consolidated 3 Stages |
|
|
|
|
Balance at |
Derecognition |
(Increase) / Reversal |
Closing balance |
| |
|
|
|
12/31/2022 |
06/30/2023 (2) |
| Individuals |
|
|
|
|
(30,281) |
11,156 |
(12,233) |
(31,358) |
| Corporate |
|
|
|
|
(5,453) |
(42) |
(429) |
(5,924) |
| Micro / Small and medium companies |
|
|
|
|
(9,590) |
2,256 |
(2,689) |
(10,023) |
| Foreign loans - Latin America |
|
|
|
|
(7,000) |
1,193 |
(934) |
(6,741) |
| Total |
|
|
|
|
(52,324) |
14,563 |
(16,285) |
(54,046) |
1) In the movement of transfer of operations from stage 1 to stage 3 over the period, a representative part thereof have first gone through stage 2.
2) Comprises Expected Credit Loss for Financial Guarantees R$ (778) and Loan Commitments R$ (3,094). |
| Reconciliation of expected credit loss of loans and lease operations, segregated by stages: |
| 01/01/2022 |
|
|
|
|
|
|
|
|
| Stage 1 |
Balance at |
Transfer to Stage 2 (3) |
Transfer to Stage 3 (1) |
Cure from Stage 2 (3) |
Cure from Stage 3 |
Derecognition |
(Increase) / Reversal |
Closing balance |
| 12/31/2021 |
12/31/2022 |
| Individuals |
(6,851) |
2,045 |
222 |
(1,445) |
(3) |
- |
618 |
(5,414) |
| Corporate |
(413) |
6 |
1 |
(127) |
(3) |
- |
56 |
(480) |
| Micro / Small and medium companies |
(1,812) |
767 |
98 |
(806) |
(33) |
- |
355 |
(1,431) |
| Foreign loans - Latin America |
(2,373) |
179 |
18 |
(91) |
(5) |
- |
(67) |
(2,339) |
| Total |
(11,449) |
2,997 |
339 |
(2,469) |
(44) |
- |
962 |
(9,664) |
| |
|
|
|
|
|
|
|
|
| Stage 2 |
Balance at |
Cure to Stage 1 (3) |
Transfer to Stage 3 |
Transfer from Stage 1 (3) |
Cure from Stage 3 |
Derecognition |
(Increase) / Reversal |
Closing balance |
| 12/31/2021 |
12/31/2022 |
| Individuals |
(4,501) |
1,445 |
4,648 |
(2,045) |
(122) |
- |
(5,072) |
(5,647) |
| Corporate |
(865) |
127 |
31 |
(6) |
(9) |
- |
219 |
(503) |
| Micro / Small and medium companies |
(1,556) |
806 |
1,055 |
(767) |
(201) |
- |
(1,564) |
(2,227) |
| Foreign loans - Latin America |
(1,353) |
91 |
592 |
(179) |
(219) |
- |
(478) |
(1,546) |
| Total |
(8,275) |
2,469 |
6,326 |
(2,997) |
(551) |
- |
(6,895) |
(9,923) |
| |
|
|
|
|
|
|
|
|
| Stage 3 |
Balance at |
Cure to Stage 1 |
Cure to Stage 2 |
Transfer from Stage 1 |
Transfer from Stage 2 |
Derecognition |
(Increase) / Reversal |
Closing balance |
| 12/31/2021 |
12/31/2022 |
| Individuals |
(12,868) |
3 |
122 |
(222) |
(4,648) |
13,876 |
(15,483) |
(19,220) |
| Corporate |
(3,529) |
3 |
9 |
(1) |
(31) |
822 |
(1,743) |
(4,470) |
| Micro / Small and medium companies |
(4,023) |
33 |
201 |
(98) |
(1,055) |
3,661 |
(4,651) |
(5,932) |
| Foreign loans - Latin America |
(4,172) |
5 |
219 |
(18) |
(592) |
1,783 |
(340) |
(3,115) |
| Total |
(24,592) |
44 |
551 |
(339) |
(6,326) |
20,142 |
(22,217) |
(32,737) |
| |
|
|
|
|
|
|
|
|
| Consolidated 3 Stages |
|
|
|
|
Balance at |
Derecognition |
(Increase) / Reversal |
Closing balance |
| |
|
|
|
12/31/2021 |
12/31/2022 (2) |
| Individuals |
|
|
|
|
(24,220) |
13,876 |
(19,937) |
(30,281) |
| Corporate |
|
|
|
|
(4,807) |
822 |
(1,468) |
(5,453) |
| Micro / Small and medium companies |
|
|
|
|
(7,391) |
3,661 |
(5,860) |
(9,590) |
| Foreign loans - Latin America |
|
|
|
|
(7,898) |
1,783 |
(885) |
(7,000) |
| Total |
|
|
|
|
(44,316) |
20,142 |
(28,150) |
(52,324) |
1) In the movement of transfer of operations from stage 1 to stage 3 over the period, a representative part thereof have first gone through stage 2.
2) Comprises Expected Credit Loss for Financial Guarantees R$ (810) and Loan Commitments R$ (2,874).
3) Reflects the expected credit loss arising from the change in the period of the parameter used to estimate the significant increase/decrease in credit risk. |
d) Lease operations - Lessor
| Finance leases are composed of vehicles, machines, equipment and real estate in Brazil and abroad. The analysis of portfolio maturities is presented below: |
| |
06/30/2023 |
|
12/31/2022 |
| |
Payments receivable |
Future financial income |
Present value |
|
Payments receivable |
Future financial income |
Present value |
| Current |
2,361 |
(622) |
1,739 |
|
2,273 |
(617) |
1,656 |
| Up to 1 year |
2,361 |
(622) |
1,739 |
|
2,273 |
(617) |
1,656 |
| Non-current |
9,253 |
(3,057) |
6,196 |
|
9,087 |
(2,894) |
6,193 |
| From 1 to 2 years |
1,951 |
(629) |
1,322 |
|
1,888 |
(596) |
1,292 |
| From 2 to 3 years |
1,472 |
(473) |
999 |
|
1,455 |
(449) |
1,006 |
| From 3 to 4 years |
1,044 |
(356) |
688 |
|
1,026 |
(339) |
687 |
| From 4 to 5 years |
802 |
(285) |
517 |
|
814 |
(271) |
543 |
| Over 5 years |
3,984 |
(1,314) |
2,670 |
|
3,904 |
(1,239) |
2,665 |
| Total |
11,614 |
(3,679) |
7,935 |
|
11,360 |
(3,511) |
7,849 |
| Financial lease revenues are composed of: |
| |
04/01 to 06/30/2023 |
04/01 to 06/30/2022 |
01/01 to 06/30/2023 |
01/01 to 06/30/2022 |
| Financial income |
238 |
238 |
467 |
435 |
| Variable payments |
2 |
2 |
4 |
3 |
| Total |
240 |
240 |
471 |
438 |
e) Operations of securitization or transfer
and acquisition of financial assets
| ITAÚ UNIBANCO HOLDING carried out operations of securitization or transfer of financial assets in which there was retention of credit risks of financial assets transferred under co-obligation covenants. Thus, these credits are still recorded in the Balance Sheet and are represented as follows: |
| Nature of operation |
06/30/2023 |
|
12/31/2022 |
| Assets |
Liabilities (1) |
|
Assets |
Liabilities (1) |
| Book value |
Fair value |
Book value |
Fair value |
|
Book value |
Fair value |
Book value |
Fair value |
| Mortgage loan |
154 |
154 |
154 |
154 |
|
170 |
168 |
170 |
168 |
| Working capital |
552 |
552 |
552 |
552 |
|
602 |
602 |
602 |
602 |
| Total |
706 |
706 |
706 |
706 |
|
772 |
770 |
772 |
770 |
| 1) Under Other liabilities. |
From 01/01 to 06/30/2023 operations of transfer of financial
assets with no retention of risks and benefits generated impact on the result of R$ 132 (R$ 71 from 01/01 to 06/30/2022), net of the Allowance
for Loan Losses.
Note 11 - Investments in associates and
joint ventures
a) Non-material individual investments
of ITAÚ UNIBANCO HOLDING
| |
06/30/2023 |
|
01/01 to 06/30/2023 |
| |
Investment |
|
Equity in earnings |
Other comprehensive income |
Total Income |
| Associates (1) |
7,620 |
|
420 |
17 |
437 |
| Joint ventures (2) |
260 |
|
(28) |
- |
(28) |
| Total |
7,880 |
|
392 |
17 |
409 |
| |
|
|
|
|
|
| |
12/31/2022 |
|
01/01 to 06/30/2022 |
| |
Investment |
|
Equity in earnings |
Other comprehensive income |
Total Income |
| Associates (1) |
7,187 |
|
331 |
(4) |
327 |
| Joint ventures (2) |
256 |
|
(35) |
- |
(35) |
| Total |
7,443 |
|
296 |
(4) |
292 |
1) At 06/30/2023, this includes interest in total capital and voting capital of the following companies: Pravaler S.A. (51.27% total capital and 41.67% voting capital; 51.94% total capital and 41.97% voting capital at 12/31/2022); Porto Seguro Itaú Unibanco Participações S.A. (42.93% total and voting capital; 42.93% at 12/31/2022); BSF Holding S.A. (49% total and voting capital; 49% at 12/31/2022); Gestora de Inteligência de Crédito S.A (15.71% total capital and 16% voting capital; 15.71% total and 16% voting capital at 12/31/2022); Compañia Uruguaya de Medios de Procesamiento S.A. (31.42% total and voting capital; 31.42% at 12/31/2022); Rias Redbanc S.A. (25% total and voting capital; 25% at 12/31/2022); Kinea Private Equity Investimentos S.A. (80% total capital and 49% voting capital; 80% total capital and 49% voting capital at 12/31/2022); Tecnologia Bancária S.A. (28.05% total capital and 28.95% voting capital; 28.05% total capital and 28.95% voting capital at 12/31/2022); CIP S.A. (23.33% total and voting capital; 23.33% at 12/31/2022); Prex Holding LLC (30% total and voting capital; 30% at 12/31/2022); Banfur International S.A. (30% total and voting capital; 30% at 12/31/2022); Biomas - Serviços Ambientais, Restauração e Carbono S.A. (16.67% total and voting capital) and Rede Agro Fidelidade e Intermediação S.A. (12.82% total and voting capital).
2) At 06/30/2023, this includes interest in total and voting capital of the following companies: Olímpia Promoção e Serviços S.A. (50% total and voting capital; 50% at 12/31/2022); ConectCar Soluções de Mobilidade Eletrônica S.A. (50% total and voting capital; 50% at 12/31/2022) and includes result not arising from subsidiaries' net income. |
Note 12 - Lease Operations - Lessee
ITAÚ UNIBANCO HOLDING is the lessee mainly of
properties for use in its operations, which include renewal options and restatement clauses. During the period ended 06/30/2023, total
cash outflow with lease amounted to R$ 720 and lease agreements in the amount of R$ 95 were renewed. There are no relevant sublease
agreements.
Total liabilities in accordance with remaining contractual
maturities, considering their undiscounted flows, are presented below:
| |
06/30/2023 |
12/31/2022 |
| Up to 3 months |
270 |
283 |
| 3 months to 1 year |
702 |
790 |
| From 1 to 5 years |
2,377 |
2,716 |
| Over 5 years |
973 |
930 |
| Total Financial Liability |
4,322 |
4,719 |
| Lease amounts recognized in the Consolidated Statement of Income: |
| |
04/01 to
06/30/2023 |
04/01 to
06/30/2022 |
01/01 to
06/30/2023 |
01/01 to
06/30/2022 |
| Sublease revenues |
6 |
5 |
13 |
10 |
| Depreciation expenses |
(214) |
(106) |
(421) |
(339) |
| Interest expenses |
(91) |
(15) |
(191) |
(138) |
| Lease expenses for low value assets |
(26) |
(21) |
(51) |
(38) |
| Variable expenses not include in lease liabilities |
(15) |
(13) |
(30) |
(27) |
| Total |
(340) |
(150) |
(680) |
(532) |
In the periods from 01/01 to 06/30/2023 and from 01/01
to 06/30/2022, there was no impairment adjustment.
Note 13 - Fixed assets
| Fixed assets (1) |
06/30/2023 |
| Anual depreciation rates |
Cost |
Depreciation |
Impairment |
Residual |
| Real Estate |
|
7,529 |
(4,010) |
(182) |
3,337 |
| Land |
|
1,240 |
- |
- |
1,240 |
| Buildings and Improvements |
4% to 10% |
6,289 |
(4,010) |
(182) |
2,097 |
| Other fixed assets |
|
16,736 |
(12,090) |
(45) |
4,601 |
| Installations and furniture |
10% to 20% |
3,605 |
(2,749) |
(14) |
842 |
| Data processing systems |
20% to 50% |
10,101 |
(8,049) |
(31) |
2,021 |
| Other (2) |
10% to 20% |
3,030 |
(1,292) |
- |
1,738 |
| Total |
|
24,265 |
(16,100) |
(227) |
7,938 |
1) The contractual commitments for purchase of the fixed assets totaled R$ 3, achievable by 2024 (Note 32b III.II - Off balance commitments).
2) Other refers to negotiations of Fixed assets in progress and other Communication, Security and Transportation equipments. |
| |
|
|
|
|
|
| Fixed assets (1) |
12/31/2022 |
| Anual depreciation rates |
Cost |
Depreciation |
Impairment |
Residual |
| Real Estate |
|
7,132 |
(3,835) |
(151) |
3,146 |
| Land |
|
1,199 |
- |
- |
1,199 |
| Buildings and Improvements |
4% to 10% |
5,933 |
(3,835) |
(151) |
1,947 |
| Other fixed assets |
|
16,254 |
(11,588) |
(45) |
4,621 |
| Installations and furniture |
10% to 20% |
3,559 |
(2,655) |
(14) |
890 |
| Data processing systems |
20% to 50% |
9,786 |
(7,659) |
(31) |
2,096 |
| Other (2) |
10% to 20% |
2,909 |
(1,274) |
- |
1,635 |
| Total |
|
23,386 |
(15,423) |
(196) |
7,767 |
1) The contractual commitments for purchase of the fixed assets totaled R$ 3, achievable by 2024 (Note 32b III.II - Off balance commitments).
2) Other refers to negotiations of Fixed assets in progress and other Communication, Security and Transportation equipments. |
Note 14 - Goodwill and Intangible assets
| |
|
|
|
|
|
|
|
| |
Note |
Goodwill and intangible from acquisition |
Intangible assets |
Total |
| |
Association for the promotion and offer of financial products and services |
Software acquired |
Internally developed software |
Other intangible assets (1) |
| Annual amortization rates |
|
|
8% |
20% |
20% |
10% to 20% |
|
| Cost |
|
|
|
|
|
|
|
| Balance at 12/31/2022 |
|
12,431 |
2,366 |
5,423 |
16,088 |
7,634 |
43,942 |
| Acquisitions |
|
603 |
- |
218 |
1,906 |
272 |
2,999 |
| Rescissions / disposals |
|
- |
(41) |
(6) |
(1) |
(144) |
(192) |
| Exchange variation |
|
(134) |
68 |
(47) |
(16) |
(37) |
(166) |
| Other (3) |
|
(4) |
(8) |
141 |
(3) |
- |
126 |
| Balance at 06/30/2023 |
|
12,896 |
2,385 |
5,729 |
17,974 |
7,725 |
46,709 |
| Amortization |
|
|
|
|
|
|
|
| Balance at 12/31/2022 |
|
- |
(1,357) |
(3,737) |
(6,133) |
(3,166) |
(14,393) |
| Amortization expense (2) |
|
- |
(45) |
(226) |
(1,180) |
(637) |
(2,088) |
| Rescissions / disposals |
|
- |
22 |
3 |
- |
114 |
139 |
| Exchange variation |
|
- |
(27) |
22 |
10 |
35 |
40 |
| Other (3) |
|
- |
8 |
(91) |
- |
- |
(83) |
| Balance at 06/30/2023 |
|
- |
(1,399) |
(4,029) |
(7,303) |
(3,654) |
(16,385) |
| Impairment |
|
|
|
|
|
|
|
| Balance at 12/31/2022 |
|
(4,881) |
(559) |
(171) |
(824) |
- |
(6,435) |
| Increase |
2d VIII |
- |
- |
- |
(7) |
- |
(7) |
| Exchange variation |
|
80 |
(41) |
- |
- |
- |
39 |
| Balance at 06/30/2023 |
|
(4,801) |
(600) |
(171) |
(831) |
- |
(6,403) |
| Book value |
|
|
|
|
|
|
|
| Balance at 06/30/2023 |
|
8,095 |
386 |
1,529 |
9,840 |
4,071 |
23,921 |
1) Includes amounts paid to the rights for acquisition of payrolls, proceeds, retirement and pension benefits and similar benefits.
2) Amortization expenses related to the rights for acquisition of payrolls and associations, in the amount of R$ (622) are disclosed in the General and administrative expenses (Note 23).
3) Includes the total amount of R$ 44 related to the hyperinflationary for Argentina. |
Goodwill and Intangible Assets from Acquisition are mainly
represented by Banco Itaú Chile’s goodwill in the amount of R$ 2,962 (R$ 3,015 at 12/31/2022).
| |
|
|
|
|
|
|
|
| |
Note |
Goodwill and intangible from acquisition |
Intangible assets |
Total |
| |
Association for the promotion and offer of financial products and services |
Software acquired |
Internally developed software |
Other intangible assets (1) |
| Annual amortization rates |
|
|
8% |
20% |
20% |
10% to 20% |
|
| Cost |
|
|
|
|
|
|
|
| Balance at 12/31/2021 |
|
13,031 |
2,657 |
6,476 |
11,157 |
6,431 |
39,752 |
| Acquisitions |
|
- |
- |
519 |
4,208 |
1,041 |
5,768 |
| Rescissions / disposals |
|
- |
- |
(23) |
(1) |
(480) |
(504) |
| Exchange variation |
|
(600) |
(276) |
(339) |
- |
(41) |
(1,256) |
| Other (3) |
|
- |
(15) |
(1,210) |
724 |
683 |
182 |
| Balance at 12/31/2022 |
|
12,431 |
2,366 |
5,423 |
16,088 |
7,634 |
43,942 |
| Amortization |
|
|
|
|
|
|
|
| Balance at 12/31/2021 |
|
- |
(1,374) |
(4,149) |
(4,220) |
(1,984) |
(11,727) |
| Amortization expense (2) |
|
- |
(115) |
(517) |
(1,511) |
(1,200) |
(3,343) |
| Rescissions / disposals |
|
- |
- |
7 |
- |
480 |
487 |
| Exchange variation |
|
- |
116 |
188 |
(3) |
28 |
329 |
| Other (3) |
|
- |
16 |
734 |
(399) |
(490) |
(139) |
| Balance at 12/31/2022 |
|
- |
(1,357) |
(3,737) |
(6,133) |
(3,166) |
(14,393) |
| Impairment |
|
|
|
|
|
|
|
| Balance at 12/31/2021 |
|
(5,209) |
(712) |
(171) |
(823) |
- |
(6,915) |
| Increase |
2d VIII |
- |
- |
- |
(1) |
- |
(1) |
| Exchange variation |
|
328 |
153 |
- |
- |
- |
481 |
| Balance at 12/31/2022 |
|
(4,881) |
(559) |
(171) |
(824) |
- |
(6,435) |
| Book value |
|
|
|
|
|
|
|
| Balance at 12/31/2022 |
|
7,550 |
450 |
1,515 |
9,131 |
4,468 |
23,114 |
1) Includes amounts paid to the rights for acquisition of payrolls, proceeds, retirement and pension benefits and similar benefits.
2) Amortization expenses related to the rights for acquisition of payrolls and associations, in the amount of R$ (1,202) are disclosed in the General and administrative expenses (Note 23).
3) Includes the total amount of R$ 61 related to the hyperinflationary adjustment for Argentina. |
Note 15 - Deposits
| |
06/30/2023 |
|
12/31/2022 |
| |
Current |
Non-current |
Total |
|
Current |
Non-current |
Total |
| Interest-bearing deposits |
310,001 |
492,473 |
802,474 |
|
376,238 |
372,635 |
748,873 |
| Savings deposits |
174,464 |
- |
174,464 |
|
179,764 |
- |
179,764 |
| Interbank deposits |
6,934 |
853 |
7,787 |
|
4,821 |
73 |
4,894 |
| Time deposits |
128,603 |
491,620 |
620,223 |
|
191,653 |
372,562 |
564,215 |
| Non-interest bearing deposits |
120,807 |
- |
120,807 |
|
122,565 |
- |
122,565 |
| Demand deposits |
114,061 |
- |
114,061 |
|
117,587 |
- |
117,587 |
| Other deposits |
6,746 |
- |
6,746 |
|
4,978 |
- |
4,978 |
| Total |
430,808 |
492,473 |
923,281 |
|
498,803 |
372,635 |
871,438 |
Note 16 - Financial liabilities designated
at fair value through profit or loss
| |
06/30/2023 |
|
12/31/2022 |
| |
Current |
Non-current |
Total |
|
Current |
Non-current |
Total |
| Structured notes |
|
|
|
|
|
|
|
| Debt securities |
- |
86 |
86 |
|
2 |
62 |
64 |
| Total |
- |
86 |
86 |
|
2 |
62 |
64 |
The effect of credit risk of these instruments is not significant at 06/30/2023 and 12/31/2022.
Debt securities do not have a defined amount on maturity,
since they vary according to market quotation and an exchange variation component, respectively.
Note 17 - Securities sold under repurchase
agreements and interbank and institutional market funds
a) Securities sold under repurchase agreements
| The table below shows the breakdown of funds: |
| |
Interest rate (p.a.) |
06/30/2023 |
|
12/31/2022 |
| |
Current |
Non-current |
Total |
|
Current |
Non-current |
Total |
| Assets pledged as collateral |
|
137,059 |
88 |
137,147 |
|
90,700 |
119 |
90,819 |
| Government securities |
12.86% to 100% of SELIC |
115,728 |
- |
115,728 |
|
66,665 |
- |
66,665 |
| Corporate securities |
30% to 95% of CDI |
19,369 |
- |
19,369 |
|
22,562 |
- |
22,562 |
| Own issue |
12.8% to 15.75% |
1 |
6 |
7 |
|
2 |
6 |
8 |
| Foreign |
1% to 85% |
1,961 |
82 |
2,043 |
|
1,471 |
113 |
1,584 |
| Assets received as collateral |
13.3% to 13.65% |
104,753 |
- |
104,753 |
|
127,375 |
- |
127,375 |
| Right to sell or repledge the collateral |
4.95% to 100% of SELIC |
26,618 |
50,581 |
77,199 |
|
52,723 |
22,523 |
75,246 |
| Total |
|
268,430 |
50,669 |
319,099 |
|
270,798 |
22,642 |
293,440 |
b) Interbank market funds
| |
Interest rate (p.a.) |
06/30/2023 |
|
12/31/2022 |
| |
Current |
Non-current |
Total |
|
Current |
Non-current |
Total |
| Financial bills |
4.49% to 10.76% |
11,879 |
64,926 |
76,805 |
|
3,842 |
62,763 |
66,605 |
| Real estate credit bills |
5.49% to 15.28% |
28,004 |
11,142 |
39,146 |
|
24,274 |
3,843 |
28,117 |
| Rural credit bills |
4.22% to 13.9% |
22,752 |
20,718 |
43,470 |
|
26,547 |
9,736 |
36,283 |
| Guaranteed real estate bills |
4.34% to 103% of CDI |
4,348 |
51,470 |
55,818 |
|
4,908 |
45,667 |
50,575 |
| Import and export financing |
0% to 11.2% |
84,727 |
6,316 |
91,043 |
|
74,304 |
26,848 |
101,152 |
| Onlending domestic |
0% to 18% |
3,727 |
8,373 |
12,100 |
|
3,553 |
8,302 |
11,855 |
| Total (1) |
|
155,437 |
162,945 |
318,382 |
|
137,428 |
157,159 |
294,587 |
| 1) Comprises R$ 67 (R$ 1,032 at 12/31/2022) pegged to Libor. |
| Funding for import and export financing represents credit facilities available for financing of imports and exports of Brazilian companies, in general denominated in foreign currency. |
c) Institutional market funds
| |
Interest rate (p.a.) |
06/30/2023 |
|
12/31/2022 |
| |
Current |
Non-current |
Total |
|
Current |
Non-current |
Total |
| Subordinated debt |
LIB to 114% of SELIC |
844 |
43,340 |
44,184 |
|
9,851 |
44,689 |
54,540 |
| Foreign loans through securities |
0.09% to 5.61% |
8,320 |
58,529 |
66,849 |
|
10,333 |
60,188 |
70,521 |
| Funding from structured operations certificates (1) |
5.74% to 21.38% |
665 |
6,991 |
7,656 |
|
547 |
3,774 |
4,321 |
| Total |
|
9,829 |
108,860 |
118,689 |
|
20,731 |
108,651 |
129,382 |
| 1) The fair value of Funding from structured operations certificates issued is R$ 8,592 (R$ 4,949 at 12/31/2022). |
d) Subordinated debt, including perpetual
debts
| |
|
|
|
|
|
|
| Name of security / currency |
Principal amount (original currency) |
Issue |
Maturity |
Return p.a. |
06/30/2023 |
12/31/2022 |
| |
|
|
|
|
|
| Subordinated financial bills - BRL |
|
|
|
|
|
|
| |
2,146 |
2019 |
Perpetual |
114% of SELIC |
2,416 |
2,249 |
| |
935 |
2019 |
Perpetual |
SELIC + 1.17% to 1.19% |
985 |
1,047 |
| |
50 |
2019 |
2028 |
CDI + 0.72% |
66 |
62 |
| |
2,281 |
2019 |
2029 |
CDI + 0.75% |
3,028 |
2,834 |
| |
450 |
2020 |
2029 |
CDI + 1.85% |
591 |
550 |
| |
106 |
2020 |
2030 |
IPCA + 4.64% |
146 |
138 |
| |
1,556 |
2020 |
2030 |
CDI + 2% |
2,051 |
1,907 |
| |
5,488 |
2021 |
2031 |
CDI + 2% |
6,965 |
6,478 |
| |
1,005 |
2022 |
Perpetual |
CDI + 2.4% |
1,122 |
1,041 |
| |
|
|
|
Total |
17,370 |
16,306 |
| |
|
|
|
|
|
|
| Subordinated euronotes - USD |
|
|
|
|
|
|
| |
1,870 |
2012 |
2023 |
5.13% |
- |
9,735 |
| |
1,250 |
2017 |
Perpetual |
7.72% |
3,694 |
6,516 |
| |
750 |
2018 |
Perpetual |
6.50% |
3,632 |
3,985 |
| |
750 |
2019 |
2029 |
4.50% |
3,427 |
3,932 |
| |
700 |
2020 |
Perpetual |
4.63% |
2,423 |
3,708 |
| |
501 |
2021 |
2031 |
3.88% |
6,021 |
2,623 |
| |
200 |
2022 |
Perpetual |
6.80% |
- |
3 |
| |
|
|
|
Total |
19,197 |
30,502 |
| |
|
|
|
|
|
|
| Subordinated bonds - CLP |
|
|
|
|
|
|
| |
180,351 |
2008 |
2033 |
3.50% to 4.92% |
1,476 |
1,476 |
| |
97,962 |
2009 |
2035 |
4.75% |
1,141 |
1,133 |
| |
1,060,250 |
2010 |
2032 |
4.35% |
113 |
112 |
| |
1,060,250 |
2010 |
2035 |
3.90% to 3.96% |
259 |
257 |
| |
1,060,250 |
2010 |
2036 |
4.48% |
1,236 |
1,225 |
| |
1,060,250 |
2010 |
2038 |
3.93% |
901 |
892 |
| |
1,060,250 |
2010 |
2040 |
4.15% to 4.29% |
694 |
687 |
| |
1,060,250 |
2010 |
2042 |
4.45% |
338 |
335 |
| |
57,168 |
2014 |
2034 |
3.80% |
442 |
438 |
| |
|
|
|
Total |
6,600 |
6,555 |
| |
|
|
|
|
|
|
| Subordinated bonds - COP |
|
|
|
|
|
|
| |
104,000 |
2013 |
2023 |
IPC + 2% |
- |
115 |
| |
146,000 |
2013 |
2028 |
IPC + 2% |
173 |
161 |
| |
780,392 |
2014 |
2024 |
LIB |
844 |
901 |
| |
|
|
|
Total |
1,017 |
1,177 |
| |
|
|
|
|
|
|
| Total |
|
|
|
|
44,184 |
54,540 |
Note 18 - Other assets and liabilities
a) Other assets
| |
Note |
06/30/2023 |
12/31/2022 |
| Financial |
|
115,619 |
111,284 |
| At amortized cost |
|
113,957 |
109,909 |
| Receivables from credit card issuers |
|
66,546 |
65,852 |
| Deposits in guarantee for contingent liabilities, provisions and legal obligations |
29d |
13,396 |
13,001 |
| Trading and intermediation of securities |
|
20,231 |
17,969 |
| Income receivable |
|
3,251 |
3,610 |
| Operations without credit granting characteristics, net of provisions |
|
9,506 |
7,900 |
| Net amount receivables from reimbursement of provisions |
29c |
971 |
899 |
| Deposits in guarantee of fund raisings abroad |
|
52 |
648 |
| Other |
|
4 |
30 |
| At fair value through profit or loss |
|
1,662 |
1,375 |
| Other financial assets |
|
1,662 |
1,375 |
| Non-financial |
|
19,719 |
17,474 |
| Sundry foreign |
|
1,936 |
965 |
| Prepaid expenses |
|
7,099 |
6,338 |
| Sundry domestic |
|
4,376 |
3,653 |
| Assets of post-employment benefit plans |
26e |
387 |
411 |
| Lease right-of-use |
|
3,348 |
3,863 |
| Other |
|
2,573 |
2,244 |
| Current |
|
114,840 |
109,569 |
| Non-current |
|
20,498 |
19,189 |
b) Other liabilities
| |
Note |
06/30/2023 |
12/31/2022 |
| Financial |
|
161,787 |
167,234 |
| At amortized cost |
|
160,968 |
166,651 |
| Credit card operations |
|
130,879 |
138,300 |
| Trading and intermediation of securities |
|
19,197 |
17,744 |
| Foreign exchange portfolio |
|
3,491 |
2,580 |
| Finance leases |
|
3,452 |
3,929 |
| Other |
|
3,949 |
4,098 |
| At fair value through profit or loss |
|
819 |
583 |
| Other financial liabilities |
|
819 |
583 |
| Non-financial |
|
55,476 |
47,895 |
| Funds in transit |
|
21,514 |
19,737 |
| Charging and collection of taxes and similar |
|
8,596 |
551 |
| Social and statutory |
|
8,601 |
10,375 |
| Deferred income |
|
2,070 |
2,737 |
| Sundry domestic |
|
3,860 |
4,730 |
| Personnel provision |
|
2,882 |
2,403 |
| Provision for sundry payments |
|
2,180 |
2,055 |
| Obligations on official agreements and rendering of payment services |
|
2,126 |
1,725 |
| Liabilities from post-employment benefit plans |
26e |
2,253 |
2,320 |
| Other |
|
1,394 |
1,262 |
| Current |
|
208,211 |
205,883 |
| Non-current |
|
9,052 |
9,246 |
Note 19 - Stockholders’ equity
a) Capital
Capital is represented by 9,804,135,348 book-entry shares
with no par value, of which 4,958,290,359 are common shares and 4,845,844,989 are preferred shares with no voting rights, but
with tag-along rights in a public offering of shares, in a possible transfer of control, assuring them a price equal to 80% (eighty per
cent) of the amount paid per voting share in the controlling block, and a dividend at least equal to that of the common shares.
The breakdown and change in shares of paid-in capital in
the beginning and end of the period are shown below:
| |
|
06/30/2023 |
| |
|
Number |
Amount |
| |
|
Common |
Preferred |
Total |
| Residents in Brazil |
12/31/2022 |
4,927,867,243 |
1,629,498,182 |
6,557,365,425 |
60,683 |
| Residents abroad |
12/31/2022 |
30,423,116 |
3,216,346,807 |
3,246,769,923 |
30,046 |
| Shares of capital stock |
12/31/2022 |
4,958,290,359 |
4,845,844,989 |
9,804,135,348 |
90,729 |
| Shares of capital stock |
06/30/2023 |
4,958,290,359 |
4,845,844,989 |
9,804,135,348 |
90,729 |
| Residents in Brazil |
06/30/2023 |
4,925,857,160 |
1,610,108,080 |
6,535,965,240 |
60,485 |
| Residents abroad |
06/30/2023 |
32,433,199 |
3,235,736,909 |
3,268,170,108 |
30,244 |
| Treasury shares (1) |
12/31/2022 |
- |
3,268,688 |
3,268,688 |
(71) |
| Acquisition of treasury shares |
|
- |
26,000,000 |
26,000,000 |
(689) |
| Result from delivery of treasury shares |
|
- |
(25,077,613) |
(25,077,613) |
651 |
| Treasury shares (1) |
06/30/2023 |
- |
4,191,075 |
4,191,075 |
(109) |
| Number of total shares at the end of the period (2) |
06/30/2023 |
4,958,290,359 |
4,841,653,914 |
9,799,944,273 |
|
| Number of total shares at the end of the period (2) |
12/31/2022 |
4,958,290,359 |
4,842,576,301 |
9,800,866,660 |
|
| |
|
|
|
|
|
| |
|
12/31/2022 |
| |
|
Number |
Amount |
| |
|
Common |
Preferred |
Total |
| Residents in Brazil |
12/31/2021 |
4,929,997,183 |
1,771,808,645 |
6,701,805,828 |
62,020 |
| Residents abroad |
12/31/2021 |
28,293,176 |
3,074,036,344 |
3,102,329,520 |
28,709 |
| Shares of capital stock |
12/31/2021 |
4,958,290,359 |
4,845,844,989 |
9,804,135,348 |
90,729 |
| Shares of capital stock |
12/31/2022 |
4,958,290,359 |
4,845,844,989 |
9,804,135,348 |
90,729 |
| Residents in Brazil |
12/31/2022 |
4,927,867,243 |
1,629,498,182 |
6,557,365,425 |
60,683 |
| Residents abroad |
12/31/2022 |
30,423,116 |
3,216,346,807 |
3,246,769,923 |
30,046 |
| Treasury shares (1) |
12/31/2021 |
- |
24,244,725 |
24,244,725 |
(528) |
| Result from delivery of treasury shares |
|
- |
(20,976,037) |
(20,976,037) |
457 |
| Treasury shares (1) |
12/31/2022 |
- |
3,268,688 |
3,268,688 |
(71) |
| Number of total shares at the end of the period (2) |
12/31/2022 |
4,958,290,359 |
4,842,576,301 |
9,800,866,660 |
|
| Number of total shares at the end of the period (2) |
12/31/2021 |
4,958,290,359 |
4,821,600,264 |
9,779,890,623 |
|
1) Own shares, purchased based on authorization of the Board of Directors, to be held in Treasury, for subsequent cancellation or replacement in the market.
2) Shares representing total capital stock net of treasury shares. |
| We detail below the cost of shares purchased in the period, as well the average cost of treasury shares and their market price: |
| Cost / market value |
06/30/2023 |
12/31/2022 |
| Common |
|
Preferred |
Common |
|
Preferred |
| Minimum |
|
- |
|
25.52 |
- |
|
- |
| Weighted Average |
|
- |
|
26.49 |
- |
|
- |
| Maximum |
|
- |
|
27.13 |
- |
|
- |
| Treasury Shares |
|
|
|
|
|
|
|
| Average cost |
|
- |
|
25.98 |
- |
|
21.76 |
| Market value on the last day of the base date |
24.52 |
|
28.42 |
21.89 |
|
25.00 |
b) Dividends
Shareholders are entitled to a mandatory minimum dividend
in each fiscal year, corresponding to 25% of adjusted net income, as set forth in the Bylaws. Common and preferred shares participate
equally in income distributed, after common shares have received dividends equal to the minimum annual priority dividend payable to preferred
shares (R$ 0.022 non-cumulative per share).
ITAÚ UNIBANCO HOLDING monthly advances the mandatory
minimum dividend, using the share position of the last day of the previous month as the calculation basis, and the payment made on the
first business day of the subsequent month in the amount of R$ 0.015 per share.
I - Calculation of dividends and interest
on capital
| |
06/30/2023 |
06/30/2022 |
| Statutory net income |
16,365 |
14,462 |
| Adjustments: |
|
|
| (-) Legal reserve - 5% |
(818) |
(723) |
| Dividend calculation basis |
15,547 |
13,739 |
| Minimum mandatory dividend - 25% |
3,887 |
3,435 |
| Dividends and interest on capital paid / accrued |
5,283 |
3,435 |
II - Stockholders' compensation
| |
|
06/30/2023 |
| |
|
Gross value per share (R$) |
Value |
WHT (With holding tax) |
Net |
| Paid / prepaid |
|
864 |
(129) |
735 |
| Interest on capital - 5 monthly installments paid from February to June 2023 |
0.0150 |
864 |
(129) |
735 |
| Accrued (Recorded in Other liabilities - Social and statutory) |
|
5,350 |
(802) |
4,548 |
| Interest on capital - 1 monthly installment paid on 07/03/2023 |
0.0150 |
173 |
(26) |
147 |
| Interest on capital - credited on 03/13/2023 to be paid until 08/25/2023 |
0.2227 |
2,567 |
(385) |
2,182 |
| Interest on capital - credited on 06/07/2023 to be paid until 08/25/2023 |
0.2264 |
2,610 |
(391) |
2,219 |
| Total - 01/01 to 06/30/2023 |
|
6,214 |
(931) |
5,283 |
| |
|
|
|
|
|
| |
|
06/30/2022 |
| |
|
Gross value per share (R$) |
Value |
WHT (With holding tax) |
Net |
| Paid / prepaid |
|
864 |
(130) |
734 |
| Interest on capital - 5 monthly installments paid from February to June 2022 |
0.0150 |
864 |
(130) |
734 |
| Accrued (Recorded in Other liabilities - Social and statutory) |
|
3,177 |
(476) |
2,701 |
| Interest on capital - 1 monthly installment paid on 07/01/2022 |
0.0150 |
173 |
(26) |
147 |
| Interest on capital |
0.2605 |
3,004 |
(450) |
2,554 |
| Total - 01/01 to 06/30/2022 |
|
4,041 |
(606) |
3,435 |
c) Capital reserves and profit reserves
| |
|
06/30/2023 |
|
12/31/2022 |
|
| Capital reserves |
|
2,273 |
|
2,480 |
|
| Premium on subscription of shares |
|
284 |
|
284 |
|
| Share-based payment |
|
1,985 |
|
2,192 |
|
| Reserves from tax incentives, restatement of equity securities and other |
|
4 |
|
4 |
|
| Profit reserves |
|
96,273 |
|
86,209 |
|
| Legal (1) |
|
15,889 |
|
15,071 |
|
| Statutory (2,3) |
|
80,384 |
|
71,138 |
|
| Total reserves at parent company |
|
98,546 |
|
88,689 |
|
1) Its purpose is to ensure the integrity of capital, compensate loss or increase capital.
2) Its main purpose is to ensure the yield flow to shareholders.
3) Includes R$ (683) which refers to net income remaining after the distribuition of dividends and appropriations to statutory reserves in the statutory accounts of ITAÚ UNIBANCO HOLDING. |
d) Non-controlling interests
| |
Stockholders’ equity |
|
Income |
| |
06/30/2023 |
12/31/2022 |
|
01/01 to 06/30/2023 |
01/01 to 06/30/2022 |
| Banco Itaú Chile |
7,317 |
6,926 |
|
442 |
541 |
| Itaú Colombia S.A. |
17 |
14 |
|
- |
3 |
| Financeira Itaú CBD S.A. Crédito, Financiamento e Investimento |
795 |
769 |
|
62 |
51 |
| Luizacred S.A. Soc. Cred. Financiamento Investimento |
326 |
377 |
|
(51) |
(28) |
| Other |
1,633 |
1,304 |
|
36 |
29 |
| Total |
10,088 |
9,390 |
|
489 |
596 |
Note 20 - Share-based payment
| ITAÚ UNIBANCO HOLDING and its subsidiaries have share-based payment plans aimed at involving their management members and employees in the medium and long term corporate development process. |
| The grant of these benefits is only made in years in which there are sufficient profits to permit the distribution of mandatory dividends, limiting dilution to 0.5% of the total shares held by the controlling and minority stockholders at the balance sheet date. These programs are settled through the delivery of ITUB4 treasury shares to stockholders. |
| Expenses on share-based payment plans are presented in the table below: |
| |
04/01 to 06/30/2023 |
04/01 to 06/30/2022 |
01/01 to 06/30/2023 |
01/01 to 06/30/2022 |
| Partner plan |
(73) |
(58) |
(109) |
(58) |
| Share-based plan |
(135) |
(123) |
(237) |
(169) |
| Total |
(208) |
(181) |
(346) |
(227) |
a) Partner plan
| The program enables employees and managers of ITAÚ UNIBANCO HOLDING to invest a percentage of their bonus to acquire shares and share-based instruments. There is a lockup period of from three to five years, counted from the initial investment date, and the shares are thus subject to market price variations. After complying with the preconditions outlined in the program, beneficiaries are entitled to receive shares as consideration, in accordance with the number of shares indicated in the regulations. |
| The acquisition price of shares and share-based instruments is established every six months as the average of the share price over the last 30 days, which is performed on the seventh business day prior to the remuneration grant date. |
| The fair value of the consideration in shares is the market price at the grant date, less expected dividends. |
| Change in the partner program |
|
|
| |
01/01 to 06/30/2023 |
|
01/01 to 06/30/2022 |
| |
Quantity |
|
Quantity |
| Opening balance |
48,253,812 |
|
36,943,996 |
| New |
24,920,268 |
|
21,488,000 |
| Delivered |
(9,533,753) |
|
(9,226,877) |
| Cancelled |
(710,274) |
|
(582,431) |
| Closing balance |
62,930,053 |
|
48,622,688 |
| Weighted average of remaining contractual life (years) |
2.84 |
|
2.72 |
| Market value weighted average (R$) |
21.87 |
|
22.21 |
b) Variable compensation
| In this plan, part of the administrators variable remuneration is paid in cash and part in shares during a period of three years. Shares are delivered on a deferred basis, of which one-third per year, upon compliance with the conditions provided for in internal regulation. The deferred unpaid portions may be reversed proportionally to a significant reduction in the recurring income realized or the negative income for the period. |
| Management members become eligible for the receipt of these benefits according to individual performance, business performance or both. The benefit amount is established according to the activities of each management member who meets at least the performance and conduct requirements. |
| The fair value of the share is the market price at its grant date. |
| Change in share-based variable compensation |
|
|
|
| |
01/01 to 06/30/2023 |
|
01/01 to 06/30/2022 |
| |
Quantity |
|
Quantity |
| Opening balance |
44,230,077 |
|
36,814,248 |
| New |
21,199,342 |
|
21,609,092 |
| Delivered |
(17,573,649) |
|
(14,263,138) |
| Cancelled |
(303,410) |
|
(568,571) |
| Closing balance |
47,552,360 |
|
43,591,631 |
| Weighted average of remaining contractual life (years) |
1.27 |
|
1.41 |
| Market value weighted average (R$) |
25.68 |
|
24.82 |
Note 21 - Interest and similar income
and expenses and income of financial assets and liabilities at fair value through profit or loss
a) Interest and similar income
| |
04/01 to 06/30/2023 |
04/01 to 06/30/2022 |
01/01 to 06/30/2023 |
01/01 to 06/30/2022 |
| Compulsory deposits in the Central Bank of Brazil |
3,135 |
2,373 |
6,113 |
4,399 |
| Interbank deposits |
924 |
728 |
1,867 |
1,194 |
| Securities purchased under agreements to resell |
9,222 |
4,515 |
19,497 |
8,694 |
| Financial assets at fair value through other comprehensive income |
6,292 |
7,168 |
12,828 |
9,304 |
| Financial assets at amortized cost |
2,879 |
2,987 |
6,388 |
5,717 |
| Loan operations |
31,724 |
28,947 |
64,399 |
54,076 |
| Other financial assets |
127 |
530 |
457 |
743 |
| Total |
54,303 |
47,248 |
111,549 |
84,127 |
b) Interest and similar expense
| |
04/01 to 06/30/2023 |
04/01 to 06/30/2022 |
01/01 to 06/30/2023 |
01/01 to 06/30/2022 |
| Deposits |
(17,842) |
(10,917) |
(35,019) |
(19,509) |
| Securities sold under repurchase agreements |
(11,890) |
(5,954) |
(22,695) |
(10,914) |
| Interbank market funds |
(9,417) |
(917) |
(18,260) |
(9,011) |
| Institutional market funds |
(2,687) |
(3,692) |
(5,419) |
(6,442) |
| Other |
(87) |
(63) |
(183) |
(149) |
| Total |
(41,923) |
(21,543) |
(81,576) |
(46,025) |
c) Income of financial assets and liabilities
at fair value through profit or loss
| |
04/01 to 06/30/2023 |
04/01 to 06/30/2022 |
01/01 to 06/30/2023 |
01/01 to 06/30/2022 |
| Securities |
10,069 |
3,138 |
15,713 |
4,330 |
| Derivatives (1) |
(1,551) |
5,477 |
(4,426) |
(20) |
| Financial assets designated at fair value through profit or loss |
264 |
(201) |
469 |
499 |
| Other financial assets at fair value through profit or loss |
309 |
258 |
807 |
733 |
| Financial liabilities at fair value through profit or loss |
(292) |
(212) |
(667) |
(662) |
| Financial liabilities designated at fair value |
6 |
17 |
21 |
(1) |
| Total |
8,805 |
8,477 |
11,917 |
4,879 |
| 1) Includes the ineffective derivatives portion related to hedge accounting. |
During the period ended 06/30/2023, ITAÚ UNIBANCO
HOLDING derecognized/(recognized) R$ (1,891) (R$ 85 from 01/01 to 06/30/2022) of expected losses, R$ (148) (R$
(24) from 01/01 to 06/30/2022) for Financial assets – Fair value through other comprehensive income and R$ (1,743) (R$
109 from 01/01 to 06/30/2022) for Financial assets – Amortized cost.
Note 22 - Commissions and banking fees
| |
04/01 to 06/30/2023 |
04/01 to 06/30/2022 |
01/01 to 06/30/2023 |
01/01 to 06/30/2022 |
| Credit and debit cards |
5,211 |
4,801 |
10,362 |
9,422 |
| Current account services |
1,740 |
1,926 |
3,522 |
3,886 |
| Asset management |
1,366 |
1,595 |
2,743 |
3,004 |
| Funds |
1,054 |
1,469 |
2,127 |
2,626 |
| Consortia |
312 |
126 |
616 |
378 |
| Credit operations and financial guarantees provided |
638 |
657 |
1,268 |
1,291 |
| Credit operations |
279 |
323 |
556 |
647 |
| Financial guarantees provided |
359 |
334 |
712 |
644 |
| Collection services |
510 |
484 |
1,014 |
976 |
| Advisory services and brokerage |
825 |
1,011 |
1,519 |
1,779 |
| Custody services |
144 |
154 |
293 |
315 |
| Other |
740 |
654 |
1,508 |
1,285 |
| Total |
11,174 |
11,282 |
22,229 |
21,958 |
Note 23 - General and administrative expenses
| |
04/01 to 06/30/2023 |
04/01 to 06/30/2022 |
01/01 to 06/30/2023 |
01/01 to 06/30/2022 |
| Personnel expenses |
(8,081) |
(7,179) |
(15,719) |
(15,130) |
| Compensation, Payroll charges, Welfare benefits, Provision for labor claims, Dismissals, Training and Other (1) |
(6,376) |
(5,650) |
(12,495) |
(12,252) |
| Employees’ profit sharing and Share-based payment |
(1,705) |
(1,529) |
(3,224) |
(2,878) |
| Administrative expenses |
(4,540) |
(4,523) |
(9,024) |
(8,390) |
| Third-Party and Financial System Services, Security, Transportation and Travel expenses |
(1,951) |
(1,921) |
(3,893) |
(3,648) |
| Data processing and telecommunications |
(1,225) |
(1,026) |
(2,420) |
(1,958) |
| Installations and Materials |
(577) |
(730) |
(1,188) |
(1,321) |
| Advertising, promotions and publicity |
(481) |
(423) |
(893) |
(773) |
| Other |
(306) |
(423) |
(630) |
(690) |
| Depreciation and amortization |
(1,679) |
(1,294) |
(3,324) |
(2,696) |
| Other expenses |
(4,668) |
(3,413) |
(8,231) |
(7,013) |
| Selling - credit cards |
(1,453) |
(1,457) |
(3,050) |
(3,096) |
| Claims losses |
(241) |
(351) |
(469) |
(629) |
| Selling of non-financial products |
(147) |
(43) |
(277) |
(145) |
| Loss on sale of other assets, fixed assets and investments in associates and joint ventures |
(46) |
(17) |
(77) |
(31) |
| Provision for lawsuits civil |
(642) |
(283) |
(913) |
(540) |
| Provision for tax and social security lawsuits |
(278) |
(345) |
(396) |
(666) |
| Refund of interbank costs |
(102) |
(91) |
(193) |
(182) |
| Impairment |
(24) |
- |
(38) |
- |
| Other |
(1,735) |
(826) |
(2,818) |
(1,724) |
| Total |
(18,968) |
(16,409) |
(36,298) |
(33,229) |
| 1) Includes the effects of the Voluntary Severance Program. |
Note 24 - Taxes
| ITAÚ
UNIBANCO HOLDING and each one of its subsidiaries calculate separately, in each fiscal year, Income tax and social contribution on
net income. |
| |
|
| Taxes are calculated
at the rates shown below and consider, for effects of respective calculation bases, the legislation in force applicable to each charge. |
| |
|
| Income tax |
15.00% |
| Additional income tax |
10.00% |
| Social contribution
on net income |
20.00% |
a) Expenses for taxes and contributions
| Breakdown of income tax and social contribution calculation on net income: |
| Due on operations for the period |
04/01 to 06/30/2023 |
04/01 to 06/30/2022 |
01/01 to 06/30/2023 |
01/01 to 06/30/2022 |
| Income / (loss) before income tax and social contribution |
10,907 |
9,892 |
19,144 |
19,054 |
| Charges (income tax and social contribution) at the rates in effect |
(4,908) |
(4,451) |
(8,615) |
(8,574) |
| Increase / decrease in income tax and social contribution charges arising from: |
|
|
|
|
| Share of profit or (loss) of associates and joint ventures |
239 |
234 |
320 |
318 |
| Foreign exchange variation on investments abroad |
17 |
77 |
16 |
(24) |
| Interest on capital |
1,362 |
232 |
2,749 |
525 |
| Other nondeductible expenses net of non taxable income (1) |
(297) |
1,274 |
(302) |
2,986 |
| Income tax and social contribution expenses |
(3,587) |
(2,634) |
(5,832) |
(4,769) |
| Related to temporary differences |
|
|
|
|
| Increase / (reversal) for the period |
1,609 |
352 |
3,151 |
277 |
| (Expenses) / Income from deferred taxes |
1,609 |
352 |
3,151 |
277 |
| Total income tax and social contribution expenses |
(1,978) |
(2,282) |
(2,681) |
(4,492) |
| 1) Includes temporary (additions) and exclusions. |
b) Deferred taxes
I - The deferred tax asset balance and
its changes, segregated based on its origin and disbursements, are represented by:
| 01/01/2023 |
12/31/2022 |
Realization / Reversal |
Increase |
06/30/2023 |
| Reflected in income |
55,806 |
(9,389) |
12,649 |
59,066 |
| Provision for expected loss |
34,160 |
(2,792) |
6,584 |
37,952 |
| Related to tax losses and social contribution loss carryforwards |
2,496 |
(392) |
256 |
2,360 |
| Provision for profit sharing |
2,635 |
(2,635) |
1,838 |
1,838 |
| Provision for devaluation of securities with permanent impairment |
812 |
(382) |
498 |
928 |
| Provisions |
5,734 |
(1,032) |
1,152 |
5,854 |
| Civil lawsuits |
1,230 |
(349) |
404 |
1,285 |
| Labor claims |
3,010 |
(599) |
690 |
3,101 |
| Tax and social security lawsuits |
1,494 |
(84) |
58 |
1,468 |
| Legal obligations |
464 |
(39) |
18 |
443 |
| Adjustments of operations carried out on the futures settlement market |
171 |
(171) |
271 |
271 |
| Adjustment to fair value of financial assets - At fair value through profit or loss |
804 |
(804) |
885 |
885 |
| Provision relating to health insurance operations |
400 |
(2) |
- |
398 |
| Other |
8,130 |
(1,140) |
1,147 |
8,137 |
| Reflected in stockholders’ equity |
3,453 |
(447) |
149 |
3,155 |
| Adjustment to fair value of financial assets - At fair value through other comprehensive income |
2,546 |
(312) |
141 |
2,375 |
| Cash flow hedge |
342 |
(135) |
- |
207 |
| Other |
565 |
- |
8 |
573 |
| Total (1,2) |
59,259 |
(9,836) |
12,798 |
62,221 |
1) Deferred income tax and social contribution assets and liabilities are recorded in the balance sheet offset by a taxable entity and amounting to R$ 54,044 and R$ 494, respectively.
2) The accounting records of deferred tax assets on income tax losses and/or social contribution loss carryforwards, as well as those arising from temporary differences, are based on technical feasibility studies which consider the expected generation of future taxable income, considering the history of profitability for each subsidiary individually, and for the consolidated taken as a whole. |
| 01/01/2022 |
12/31/2021 |
Realization / Reversal |
Increase |
12/31/2022 |
| Reflected in income |
53,135 |
(19,244) |
21,915 |
55,806 |
| Provision for expected loss |
28,428 |
(7,622) |
13,354 |
34,160 |
| Related to tax losses and social contribution loss carryforwards |
3,751 |
(1,518) |
263 |
2,496 |
| Provision for profit sharing |
2,265 |
(2,265) |
2,635 |
2,635 |
| Provision for devaluation of securities with permanent impairment |
998 |
(595) |
409 |
812 |
| Provisions |
5,848 |
(1,699) |
1,585 |
5,734 |
| Civil lawsuits |
1,257 |
(400) |
373 |
1,230 |
| Labor claims |
3,175 |
(1,204) |
1,039 |
3,010 |
| Tax and social security lawsuits |
1,416 |
(95) |
173 |
1,494 |
| Legal obligations |
822 |
(379) |
21 |
464 |
| Adjustments of operations carried out on the futures settlement market |
- |
- |
171 |
171 |
| Adjustment to fair value of financial assets - At fair value through profit or loss |
2,726 |
(2,726) |
804 |
804 |
| Provision relating to health insurance operations |
437 |
(59) |
22 |
400 |
| Other |
7,860 |
(2,381) |
2,651 |
8,130 |
| Reflected in stockholders’ equity |
2,447 |
(1,249) |
2,255 |
3,453 |
| Adjustment to fair value of financial assets - At fair value through other comprehensive income |
1,445 |
(1,127) |
2,228 |
2,546 |
| Cash flow hedge |
461 |
(122) |
3 |
342 |
| Other |
541 |
- |
24 |
565 |
| Total (1,2) |
55,582 |
(20,493) |
24,170 |
59,259 |
1) Deferred income tax and social contribution assets and liabilities are recorded in the balance sheet offset by a taxable entity and amounting to R$ 51,634 and R$ 345, respectively.
2) The accounting records of deferred tax assets on income tax losses and/or social contribution loss carryforwards, as well as those arising from temporary differences, are based on technical feasibility studies which consider the expected generation of future taxable income, considering the history of profitability for each subsidiary individually, and for the consolidated taken as a whole. |
II - The deferred tax liabilities balance
and its changes are represented by:
| 01/01/2023 |
12/31/2022 |
Realization / reversal |
Increase |
06/30/2023 |
| Reflected in income |
7,111 |
(1,908) |
2,017 |
7,220 |
| Depreciation in excess finance lease |
141 |
(13) |
- |
128 |
| Adjustment of deposits in guarantee and provisions |
1,439 |
(92) |
81 |
1,428 |
| Post-employment benefits |
17 |
(11) |
22 |
28 |
| Adjustments of operations carried out on the futures settlement market |
42 |
(42) |
63 |
63 |
| Adjustment to fair value of financial assets - At fair value through profit or loss |
1,554 |
(1,554) |
1,550 |
1,550 |
| Taxation of results abroad – capital gains |
734 |
- |
236 |
970 |
| Other |
3,184 |
(196) |
65 |
3,053 |
| Reflected in stockholders’ equity |
859 |
(217) |
809 |
1,451 |
| Adjustment to fair value of financial assets - At fair value through other comprehensive income |
854 |
(217) |
809 |
1,446 |
| Post-employment benefits |
5 |
- |
- |
5 |
| Total (1) |
7,970 |
(2,125) |
2,826 |
8,671 |
| 1) Deferred income tax and social contribution asset and liabilities are recorded in the balance sheet offset by a taxable entity and amounting to R$ 54,044 and R$ 494, respectively. |
| 01/01/2022 |
|
|
|
|
| |
12/31/2021 |
Realization / reversal |
Increase |
12/31/2022 |
| Reflected in income |
4,580 |
(592) |
3,123 |
7,111 |
| Depreciation in excess finance lease |
137 |
- |
4 |
141 |
| Adjustment of deposits in guarantee and provisions |
1,422 |
(156) |
173 |
1,439 |
| Post-employment benefits |
6 |
(6) |
17 |
17 |
| Adjustments of operations carried out on the futures settlement market |
237 |
(237) |
42 |
42 |
| Adjustment to fair value of financial assets - At fair value through profit or loss |
71 |
(71) |
1,554 |
1,554 |
| Taxation of results abroad – capital gains |
834 |
(104) |
4 |
734 |
| Other |
1,873 |
(18) |
1,329 |
3,184 |
| Reflected in stockholders’ equity |
189 |
(116) |
786 |
859 |
| Adjustment to fair value of financial assets - At fair value through other comprehensive income |
182 |
(114) |
786 |
854 |
| Cash flow hedge |
1 |
(1) |
- |
- |
| Post-employment benefits |
6 |
(1) |
- |
5 |
| Total (1) |
4,769 |
(708) |
3,909 |
7,970 |
| 1) Deferred income tax and social contribution asset and liabilities are recorded in the balance sheet offset by a taxable entity and amounting to R$ 51,634 and R$ 345, respectively. |
III - The estimate of realization and
present value of deferred tax assets and deferred tax liabilities are:
| |
Deferred tax assets |
Deferred tax liabilities |
% |
Net deferred taxes |
% |
| Year of realization |
Temporary differences |
% |
Tax loss / social contribution loss carryforwards |
% |
Total |
% |
| 2023 |
10,951 |
18.3% |
636 |
26.9% |
11,587 |
18.6% |
(362) |
4.2% |
11,225 |
21.0% |
| 2024 |
16,777 |
28.0% |
368 |
15.6% |
17,145 |
27.6% |
(701) |
8.1% |
16,444 |
30.7% |
| 2025 |
7,187 |
12.0% |
167 |
7.1% |
7,354 |
11.8% |
(264) |
3.0% |
7,090 |
13.2% |
| 2026 |
6,495 |
10.9% |
243 |
10.3% |
6,738 |
10.8% |
(189) |
2.2% |
6,549 |
12.2% |
| 2027 |
7,306 |
12.2% |
162 |
6.9% |
7,468 |
12.0% |
(221) |
2.5% |
7,247 |
13.5% |
| After 2027 |
11,145 |
18.6% |
784 |
33.2% |
11,929 |
19.2% |
(6,934) |
80.0% |
4,995 |
9.4% |
| Total |
59,861 |
100.0% |
2,360 |
100.0% |
62,221 |
100.0% |
(8,671) |
100.0% |
53,550 |
100.0% |
| Present value (1) |
52,896 |
|
2,090 |
|
54,986 |
|
(6,583) |
|
48,403 |
|
| 1) The average funding rate, net of tax effects, was used to determine the present value. |
| Projections of future taxable income include estimates of macroeconomic variables, exchange rates, interest rates, volumes of financial operations and service fees and other factors, which can vary in relation to actual data and amounts. |
| Net income in the financial statements is not directly related to the taxable income for income tax and social contribution, due to differences between accounting criteria and the tax legislation, in addition to corporate aspects. Accordingly, it is recommended that changes in realization of deferred tax assets presented above are not considered as an indication of future net income. |
IV - Deferred tax assets not accounted
At 06/30/2023, deferred tax assets not accounted for correspond
to R$ 640 (R$ 642 at 12/31/2022) and result from Management’s evaluation of their perspectives of realization in the long term.
c) Tax liabilities
| |
Note |
06/30/2023 |
12/31/2022 |
| Taxes and contributions on income payable |
|
2,826 |
2,950 |
| Deferred tax liabilities |
24b II |
494 |
345 |
| Other |
|
4,040 |
3,478 |
| Total |
|
7,360 |
6,773 |
| Current |
|
6,336 |
5,964 |
| Non-current |
|
1,024 |
809 |
Note 25 - Earnings per share
a) Basic earnings per share
| Net income attributable to ITAÚ UNIBANCO HOLDING's shareholders is divided by the average number of outstanding shares in the period, excluding treasury shares. |
| |
04/01 to 06/30/2023 |
04/01 to 06/30/2022 |
01/01 to 06/30/2023 |
01/01 to 06/30/2022 |
| Net income attributable to owners of the parent company |
8,619 |
7,298 |
15,974 |
13,966 |
| Minimum non-cumulative dividends on preferred shares |
(106) |
(107) |
(107) |
(106) |
| Retained earnings to be distributed to common equity owners in an amount per share equal to the minimum dividend payable to preferred equity owners |
(109) |
(109) |
(109) |
(109) |
| Retained earnings to be distributed, on a pro rata basis, to common and preferred equity owners: |
|
|
|
|
| Common |
4,252 |
3,583 |
7,976 |
6,959 |
| Preferred |
4,152 |
3,499 |
7,782 |
6,792 |
| Total net income available to equity owners |
|
|
|
|
| Common |
4,361 |
3,692 |
8,085 |
7,068 |
| Preferred |
4,258 |
3,606 |
7,889 |
6,898 |
| Weighted average number of outstanding shares |
|
|
|
|
| Common |
4,958,290,359 |
4,958,290,359 |
4,958,290,359 |
4,958,290,359 |
| Preferred |
4,841,653,914 |
4,842,752,798 |
4,837,567,276 |
4,838,833,377 |
| Basic earnings per share – R$ |
|
|
|
|
| Common |
0.88 |
0.74 |
1.63 |
1.43 |
| Preferred |
0.88 |
0.74 |
1.63 |
1.43 |
b) Diluted earnings per share
| Calculated similarly to the basic earnings per share; however, it includes the conversion of all preferred shares potentially dilutable in the denominator. |
| |
04/01 to 06/30/2023 |
04/01 to 06/30/2022 |
01/01 to 06/30/2023 |
01/01 to 06/30/2022 |
| Net income available to preferred equity owners |
4,258 |
3,606 |
7,889 |
6,898 |
| Dividends on preferred shares after dilution effects |
31 |
21 |
44 |
27 |
| Net income available to preferred equity owners considering preferred shares after the dilution effect |
4,289 |
3,627 |
7,933 |
6,925 |
| Net income available to ordinary equity owners |
4,361 |
3,692 |
8,085 |
7,068 |
| Dividend on preferred shares after dilution effects |
(31) |
(21) |
(44) |
(27) |
| Net income available to ordinary equity owners considering preferred shares after the dilution effect |
4,330 |
3,671 |
8,041 |
7,041 |
| Adjusted weighted average of shares |
|
|
|
|
| Common |
4,958,290,359 |
4,958,290,359 |
4,958,290,359 |
4,958,290,359 |
| Preferred |
4,912,392,609 |
4,899,092,078 |
4,891,767,691 |
4,875,507,563 |
| Preferred |
4,841,653,914 |
4,842,752,798 |
4,837,567,276 |
4,838,833,377 |
| Incremental as per share-based payment plans |
70,738,695 |
56,339,280 |
54,200,415 |
36,674,186 |
| Diluted earnings per share – R$ |
|
|
|
|
| Common |
0.87 |
0.74 |
1.62 |
1.42 |
| Preferred |
0.87 |
0.74 |
1.62 |
1.42 |
| There was no potentially antidulitive effect of the shares in share-based payment plans, in both periods. |
Note 26 - Post-employment benefits
ITAÚ UNIBANCO HOLDING, through its subsidiaries, sponsors
retirement plans for its employees.
Retirement plans are managed by Closed-end Private Pension
Entities (EFPC) and are closed to new applicants. These entities have an independent structure and manage their plans according to the
characteristics of their regulations.
There are three types of retirement plan:
• Defined
Benefit Plans (BD): plans for which scheduled benefits have their value established in advance, based on salaries and/or length of service
of employees, and the cost is actuarially determined. The plans classified in this category are: Plano de Aposentadoria Complementar;
Plano de Aposentadoria Complementar Móvel Vitalícia; Plano de Benefício Franprev; Plano de Benefício 002;
Plano de Benefícios Prebeg; Plano BD UBB PREV; Plano de Benefícios II; Plano Básico Itaulam; Plano BD Itaucard; Plano
de Aposentadoria Principal Itaú Unibanco managed by Fundação Itaú Unibanco - Previdência Complementar
(FIU); and Plano de Benefícios I, managed by Fundo de Pensão Multipatrocinado (FUNBEP).
• Defined
Contribution Plans (CD): plans for which scheduled benefits have their value permanently adjusted to the investments balance, kept
in favor of the participant, including in the benefit concession phase, considering net proceedings of its investment, amounts contributed
and benefits paid. Defined Contribution plans include pension funds consisting of the portions of sponsor's contributions not included
in a participant's account balance due to loss of eligibility for the benefit, and of monies arising from the migration of retirement
plans in defined benefit modality. These funds are used for future contributions to individual participant's accounts, according to the
respective benefit plan regulations. The plans classified in this category are: Plano Itaubanco CD; Plano de Aposentadoria Itaubank; Plano
de Previdência REDECARD managed by FIU.
• Variable
Contribution Plans (CV): in this type of plan, scheduled benefits present a combination of characteristics of defined contribution and
defined benefit modalities, and the benefit is actuarially determined based on the investments balance accumulated by the participant
on the retirement date. The plans classified in this category are: Plano de Previdência Unibanco Futuro Inteligente; Plano
Suplementar Itaulam; Plano CV Itaucard; Plano de Aposentadoria Suplementar Itaú Unibanco managed by FIU and Plano de Benefícios
II managed by FUNBEP.
a) Main actuarial assumptions
| Actuarial assumptions of demographic and financial nature should reflect the best estimates about the variables that determine the post-employment benefit obligations. |
| The most relevant demographic assumption comprise of mortality table and the most relevant financial assumptions include: discount rate and inflation. |
| |
06/30/2023 |
06/30/2022 |
| Mortality table (1) |
AT-2000 |
AT-2000 |
| Discount rate (2) |
10.34% p.a. |
9.46% p.a. |
| Inflation (3) |
4.00% p.a. |
4.00% p.a. |
| Actuarial method |
Projected Unit Credit |
Projected Unit Credit |
1) Correspond to those disclosed by SOA (Society of Actuaries), that reflect a 10% increase in the probabilities of survival regarding the respective basic tables.
2) Determined based on market yield relating to National Treasury Notes (NTN-B) and compatible with the economic scenario observed on the balance sheet closing date, considering the volatility of interest market and models used.
3) Refers to estimated long-term projection. |
| Retirement plans sponsored by foreign subsidiaries - Banco Itaú (Suisse) S.A., Itaú Colombia S.A. and PROSERV - Promociones y Servicios S.A. de C.V. - are structured as Defined Benefit modality and adopt actuarial assumptions adequate to masses of participants and the economic scenario of each country. |
b) Risk management
The EFPCs sponsored by ITAÚ UNIBANCO HOLDING are
regulated by the National Council for Complementary Pension (CNPC) and PREVIC, and have an Executive Board, Advisory and Tax Councils.
Benefits offered have long-term characteristics and the main
factors involved in the management and measurement of their risks are financial risk, inflation risk and demographic risk.
• Financial
risk – the actuarial liability is calculated by adopting a discount, which may differ from rates earned in investments.
If real income from plan investments is lower than yield expected, this may give rise to a deficit. To mitigate this risk and assure the
capacity to pay long-term benefits, the plans have a significant percentage of fixed-income securities pegged to the plan commitments,
aiming at minimizing volatility and risk of mismatch between assets and liabilities. Additionally, adherence tests are carried out in
financial assumptions to ensure their adequacy to obligations of respective plans.
• Inflation
risk - a large part of liabilities is pegged to inflation risk, making actuarial liabilities sensitive to increase in rates.
To mitigate this risk, the same financial risks mitigation strategies are used.
• Demographic
risk - plans that have any obligation actuarially assessed are exposed to demographic risk. In the event the mortality tables
used are not adherent to the mass of plan participants, a deficit or surplus may arise in actuarial evaluation. To mitigate this risk,
adherence tests to demographic assumptions are conducted to ensure their adequacy to liabilities of respective plans.
For purposes of registering in the balance sheet of the EFPCs
that manage them, actuarial liabilities of plans use discount rate adherent to their asset portfolio and income and expense flows,
according to a study prepared by an independent actuarial consulting company. The actuarial method used is the aggregate method,
through which the plan costing is defined by the difference between its equity coverage and the current value of its future liabilities,
observing the methodology established in the respective actuarial technical note.
When a deficit in the concession period above the legally
defined limits is noted, debt agreements are entered into with the sponsor according to costing policies, which affect the future contributions
of the plan, and a plan for solving such deficit is established respecting the guarantees set forth by the legislation in force. The plans
that are in this situation are resolved through extraordinary contributions that affect the values of the future contribution of the plan.
c) Asset management
| The purpose of the management of the funds is the long-term balance between pension assets and liabilities with payment of benefits by exceeding actuarial goals(discount rate plus benefit adjustment index, established in the plan regulations). |
| Below is a table with the allocation of assets by category, segmented into Quoted in an active market and Not quoted in an active market: |
| Types |
Fair value |
|
% Allocation |
| 06/30/2023 |
12/31/2022 |
|
06/30/2023 |
12/31/2022 |
| Fixed income securities |
20,987 |
20,684 |
|
94.1% |
94.4% |
| Quoted in an active market |
20,368 |
20,102 |
|
91.3% |
91.7% |
| Non quoted in an active market |
619 |
582 |
|
2.8% |
2.7% |
| Variable income securities |
590 |
515 |
|
2.7% |
2.3% |
| Quoted in an active market |
578 |
508 |
|
2.6% |
2.3% |
| Non quoted in an active market |
12 |
7 |
|
0.1% |
- |
| Structured investments |
141 |
138 |
|
0.6% |
0.6% |
| Non quoted in an active market |
141 |
138 |
|
0.6% |
0.6% |
| Real estate |
514 |
527 |
|
2.3% |
2.4% |
| Loans to participants |
77 |
69 |
|
0.3% |
0.3% |
| Total |
22,309 |
21,933 |
|
100.0% |
100.0% |
The defined benefit plan assets include shares of ITAÚ
UNIBANCO HOLDING, its main parent company (ITAÚSA) and of subsidiaries of the latter, with a fair value of R$ 1 (R$ 1 at
12/31/2022), and real estate rented to group companies, with a fair value of R$ 411 (R$ 420 at 12/31/2022).
d) Other post-employment benefits
ITAÚ UNIBANCO HOLDING and its subsidiaries do not
have additional liabilities related to post-employment benefits, except in cases arising from maintenance commitments assumed in acquisition
agreements which occurred over the years, as well as those benefits originated from court decision in the terms and conditions established,
in which there is total or partial sponsorship of health care plans for a specific group of former employees and their beneficiaries.
Its costing is actuarially determined so as to ensure coverage maintenance. These plans are closed to new applicants.
Assumptions for discount rate, inflation, mortality table
and actuarial method are the same as those used for retirement plans. ITAÚ UNIBANCO HOLDING used the percentage of 4% p.a.
for medical inflation, additionally considering, inflation rate of 4% p.a.
Particularly in other post-employment benefits, there is
medical inflation risk associated with above expectation increases in medical costs. To mitigate this risk, the same financial risks
mitigation strategies are used.
e) Change in the net amount recognized
in the balance sheet
| The net amount recognized in the Balance Sheet is limited
by the asset ceiling and it is computed based on estimated future contributions to be realized by the sponsor, so that it represents
the maximum reduction amount in the contributions to be made. |
| |
|
06/30/2023 |
| |
Note |
BD and
CV plans |
|
CD plans |
|
Other post-employment
benefits |
|
Total |
| |
|
Net asset |
Actuarial
liabilities |
Asset ceiling |
Recognized
amount |
|
Pension
plan fund |
Asset ceiling |
Recognized
amount |
|
Liabilities |
|
Recognized
amount |
| Amounts at the beginning of the period |
|
21,933 |
(19,637) |
(3,734) |
(1,438) |
|
420 |
(42) |
378 |
|
(849) |
|
(1,909) |
| Amounts recognized in income (1+2+3+4) |
|
1,090 |
(980) |
(189) |
(79) |
|
(22) |
(2) |
(24) |
|
(41) |
|
(144) |
| 1 - Cost of current service |
|
- |
(14) |
- |
(14) |
|
- |
- |
- |
|
- |
|
(14) |
| 2 - Cost of past service |
|
- |
- |
- |
- |
|
- |
- |
- |
|
- |
|
- |
| 3 - Net interest (1) |
|
1,090 |
(966) |
(189) |
(65) |
|
20 |
(2) |
18 |
|
(41) |
|
(88) |
| 4 - Other expenses (2) |
|
- |
- |
- |
- |
|
(42) |
- |
(42) |
|
- |
|
(42) |
| Amount recognized in stockholders' equity - other comprehensive income
(5+6+7) |
|
(6) |
(11) |
(19) |
(36) |
|
- |
- |
- |
|
- |
|
(36) |
| 5 - Effects on asset ceiling |
|
- |
- |
(19) |
(19) |
|
- |
- |
- |
|
- |
|
(19) |
| 6 - Remeasurements |
|
- |
(8) |
- |
(8) |
|
- |
- |
- |
|
- |
|
(8) |
| Changes in demographic assumptions |
|
- |
- |
- |
- |
|
- |
- |
- |
|
- |
|
- |
| Changes in financial assumptions |
|
- |
- |
- |
- |
|
- |
- |
- |
|
- |
|
- |
| Experience
of the plan (3) |
|
- |
(8) |
- |
(8) |
|
- |
- |
- |
|
- |
|
(8) |
| 7 - Exchange variation |
|
(6) |
(3) |
- |
(9) |
|
- |
- |
- |
|
- |
|
(9) |
| Other (8+9+10) |
|
(708) |
838 |
- |
130 |
|
- |
- |
- |
|
93 |
|
223 |
| 8 - Receipt by Destination of Resources |
|
- |
- |
- |
- |
|
- |
- |
- |
|
- |
|
- |
| 9 - Benefits paid |
|
(838) |
838 |
- |
- |
|
- |
- |
- |
|
93 |
|
93 |
| 10 - Contributions and investments from sponsor |
|
130 |
- |
- |
130 |
|
- |
- |
- |
|
- |
|
130 |
| Amounts at the end of period |
|
22,309 |
(19,790) |
(3,942) |
(1,423) |
|
398 |
(44) |
354 |
|
(797) |
|
(1,866) |
| Amount recognized in Assets |
18a |
|
|
|
33 |
|
|
|
354 |
|
- |
|
387 |
| Amount recognized in Liabilities |
18b |
|
|
|
(1,456) |
|
|
|
- |
|
(797) |
|
(2,253) |
| |
|
12/31/2022 |
| |
|
BD and
CV plans |
|
CD plans |
|
Other post-employment
benefits |
|
Total |
| |
|
Net assets |
Actuarial liabilities |
Asset ceiling |
Recognized amount |
|
Pension plan fund |
Asset ceiling |
Recognized amount |
|
Liabilities |
|
Recognized amount |
| Amounts at the beginning of the period |
|
21,912 |
(20,039) |
(3,255) |
(1,382) |
|
447 |
(2) |
445 |
|
(779) |
|
(1,716) |
| Amounts recognized in income (1+2+3+4) |
|
1,995 |
(1,845) |
(308) |
(158) |
|
(36) |
- |
(36) |
|
(246) |
|
(440) |
| 1 - Cost of current service |
|
- |
(33) |
- |
(33) |
|
- |
- |
- |
|
- |
|
(33) |
| 2 - Cost of past service |
|
- |
- |
- |
- |
|
- |
- |
- |
|
(155) |
|
(155) |
| 3 - Net interest (1) |
|
1,995 |
(1,812) |
(308) |
(125) |
|
39 |
- |
39 |
|
(91) |
|
(177) |
| 4 - Other expenses (2) |
|
- |
- |
- |
- |
|
(75) |
- |
(75) |
|
- |
|
(75) |
| Amount recognized in stockholders' equity - other comprehensive income
(5+6+7) |
|
(447) |
596 |
(171) |
(22) |
|
9 |
(40) |
(31) |
|
25 |
|
(28) |
| 5 - Effects on asset ceiling |
|
- |
- |
(171) |
(171) |
|
- |
(40) |
(40) |
|
- |
|
(211) |
| 6 - Remeasurements |
|
(441) |
557 |
- |
116 |
|
9 |
- |
9 |
|
25 |
|
150 |
| Changes in demographic assumptions |
|
- |
29 |
- |
29 |
|
- |
- |
- |
|
- |
|
29 |
| Changes in financial assumptions |
|
- |
1,499 |
- |
1,499 |
|
9 |
- |
9 |
|
46 |
|
1,554 |
| Experience
of the plan (3) |
|
(441) |
(971) |
- |
(1,412) |
|
- |
- |
- |
|
(21) |
|
(1,433) |
| 7 - Exchange variation |
|
(6) |
39 |
- |
33 |
|
- |
- |
- |
|
- |
|
33 |
| Other (8+9+10) |
|
(1,527) |
1,651 |
- |
124 |
|
- |
- |
- |
|
151 |
|
275 |
| 8 - Receipt by Destination of Resources |
|
- |
- |
- |
- |
|
- |
- |
- |
|
- |
|
- |
| 9 - Benefits paid |
|
(1,651) |
1,651 |
- |
- |
|
- |
- |
- |
|
151 |
|
151 |
| 10 - Contributions and investments from sponsor |
|
124 |
- |
- |
124 |
|
- |
- |
- |
|
- |
|
124 |
| Amounts at the end of period |
|
21,933 |
(19,637) |
(3,734) |
(1,438) |
|
420 |
(42) |
378 |
|
(849) |
|
(1,909) |
| Amount recognized in Assets |
18a |
|
|
|
33 |
|
|
|
378 |
|
- |
|
411 |
| Amount recognized in Liabilities |
18b |
|
|
|
(1,471) |
|
|
|
- |
|
(849) |
|
(2,320) |
1) Corresponds to the amount calculated on 01/01/2023 based on the initial amount (Net Assets, Actuarial Liabilities and Restriction of Assets), taking into account the estimated amount of payments / receipts of benefits / contributions, multiplied by the discount rate of 10.34% p.a. (On 01/01/2022 the rate used was 9.46% p.a.)
2) Corresponds to the use of asset amounts allocated in pension funds of the defined contribution plans.
3) Correspond to the income obtained above / below the expected return and comprise the contributions made by participants. |
f) Defined benefit contributions
| |
Estimated contributions |
|
Contributions made |
| |
2023 |
|
01/01 to
06/30/2023 |
|
01/01 to
06/30/2022 |
| Retirement plan - FIU |
39 |
|
26 |
|
26 |
| Retirement plan - FUNBEP |
85 |
|
88 |
|
7 |
| Total (1) |
124 |
|
114 |
|
33 |
| 1) Include extraordinary contributions agreed upon in deficit equation plans. |
g) Maturity profile of defined benefit
liabilities
| |
Duration (1) |
2023 |
2024 |
2025 |
2026 |
2027 |
2028 |
to |
2032 |
| Pension plan - FIU |
9.12 |
1,136 |
1,072 |
1,110 |
1,151 |
1,186 |
6,388 |
| Pension plan - FUNBEP |
8.51 |
656 |
676 |
694 |
711 |
728 |
3,846 |
| Other post-employment benefits |
6.13 |
196 |
189 |
80 |
85 |
68 |
235 |
| Total |
|
1,988 |
1,937 |
1,884 |
1,947 |
1,982 |
10,469 |
| 1) Average duration of plan´s actuarial liabilities. |
h) Sensitivity analysis
| To measure the effects of changes in the key assumptions, sensitivity tests are conducted in actuarial liabilities annually. The sensitivity analysis considers a vision of the impacts caused by changes in assumptions, which could affect the income for the period and stockholders’ equity at the balance sheet date. This type of analysis is usually carried out under the ceteris paribus condition, in which the sensitivity of a system is measured when only one variable of interest is changed and all the others remain unchanged. The results obtained are shown in the table below: |
| Main assumptions |
BD and CV plans |
|
Other post-employment benefits |
| Present value of liability |
Income |
Stockholders´ equity (Other comprehensive income) (1) |
|
Present value of liability |
Income |
Stockholders´ equity (Other comprehensive income) (1) |
| Discount rate |
|
|
|
|
|
|
|
| Increase by 0.5% |
(763) |
- |
284 |
|
(23) |
- |
23 |
| Decrease by 0.5% |
824 |
- |
(311) |
|
25 |
- |
(25) |
| Mortality table |
|
|
|
|
|
|
|
| Increase by 5% |
(218) |
- |
82 |
|
(10) |
- |
10 |
| Decrease by 5% |
228 |
- |
(87) |
|
11 |
- |
(11) |
| Medical inflation |
|
|
|
|
|
|
|
| Increase by 1% |
- |
- |
- |
|
56 |
- |
(56) |
| Decrease by 1% |
- |
- |
- |
|
(48) |
- |
48 |
| 1) Net of effects of asset ceiling |
Note 27 - Insurance contracts and private
pension
Insurance products sold by ITAÚ UNIBANCO HOLDING are
divided into (i) non-life insurance, which guarantees loss, damage or liability for objects or people; and (ii) life insurance, which
includes coverage against the risk of death and personal accidents. Insurance products are substantially offered through the electronic
channels and branches of ITAÚ UNIBANCO HOLDING.
ITAÚ UNIBANCO HOLDING reinsures the portion of
the underwritten risks that exceed the maximum liability limits it deems to be appropriate for each segment and product. These reinsurance
contracts allow the recovery of a portion of the losses with the reinsurer, although they do not release ITAÚ UNIBANCO HOLDING
from the main obligation.
Private pension products are essentially divided into: (i)
Free Benefit Generating Plan (PGBL) and Free Benefit Generating Life Plan (VGBL): whose main objective is to accumulate financial resources,
the payment of which is made by means of income; and (ii) traditional: pension plan with a minimum guarantee of profitability, which is
no longer sold.
Insurance contracts and private pension portfolios and
measurement approach are presented below:
| |
Note |
06/30/2023 |
12/31/2022 |
| |
(Assets) / Liabilities |
Income |
|
(Assets) / Liabilities |
Income |
| |
Operating |
Financial |
|
Operating |
Financial |
| General Model (BBA) |
|
14,946 |
1,321 |
(131) |
|
14,320 |
1,691 |
(1,251) |
| lnsurance (1) |
27a I |
4,654 |
1,297 |
(110) |
|
4,496 |
1,776 |
(196) |
| Private pension |
27a II |
10,292 |
24 |
(21) |
|
9,824 |
(85) |
(1,055) |
| Variable Fee Approach (VFA) |
27a II |
234,314 |
842 |
(13,852) |
|
218,398 |
1,745 |
(20,605) |
| Private pension |
|
234,314 |
842 |
(13,852) |
|
218,398 |
1,745 |
(20,605) |
| Simplified Model (PAA) |
27a I |
423 |
991 |
(7) |
|
385 |
1,892 |
(17) |
| lnsurance |
|
462 |
986 |
(8) |
|
408 |
1,898 |
(14) |
| Reinsurance |
|
(39) |
5 |
1 |
|
(23) |
(6) |
(3) |
| Total Insurance contracts and private pension |
|
249,683 |
3,154 |
(13,990) |
|
233,103 |
5,328 |
(21,873) |
| lnsurance |
|
5,116 |
2,283 |
(118) |
|
4,904 |
3,674 |
(210) |
| Reinsurance |
|
(39) |
5 |
1 |
|
(23) |
(6) |
(3) |
| Private pension |
|
244,606 |
866 |
(13,873) |
|
228,222 |
1,660 |
(21,660) |
| Current |
|
423 |
|
|
|
385 |
|
|
| Non-current |
|
249,260 |
|
|
|
232,718 |
|
|
| 1) Composed of assets of R$ (47) and liabilities of R$ 4,701 (R$ 4,496 at 12/31/2022). |
a) Reconciliation of insurance and private
pension portfolios
I - Insurance
| |
06/30/2023 |
|
12/31/2022 |
| |
Liability for Remaining Coverage |
Loss Component of the Liability for Remaining Coverage |
Liability for Incurred Claims |
Total |
|
Liability for Remaining Coverage |
Loss Component of the Liability for Remaining Coverage |
Liability for Incurred Claims |
Total |
| Opening Balance - 01/01 |
2,248 |
1,936 |
697 |
4,881 |
|
1,384 |
2,065 |
679 |
4,128 |
| Operating Income from Insurance Contracts and Private Pension |
(2,908) |
(57) |
677 |
(2,288) |
|
(5,124) |
(104) |
1,560 |
(3,668) |
| Financial Income from Insurance Contracts and Private Pension |
43 |
63 |
17 |
123 |
|
123 |
(25) |
32 |
130 |
| Premiums Received, Claims and Other Expenses Paid |
3,130 |
- |
(769) |
2,361 |
|
5,865 |
- |
(1,574) |
4,291 |
| Closing Balance |
2,513 |
1,942 |
622 |
5,077 |
|
2,248 |
1,936 |
697 |
4,881 |
| |
|
|
|
|
|
|
|
|
|
| |
06/30/2023 |
|
12/31/2022 |
| |
Estimate of Present Value of Future Cash Flows |
Contractual Service Margin |
Risk Adjustment for Non-financial Risk |
Total |
|
Estimate of Present Value of Future Cash Flows |
Contractual Service Margin |
Risk Adjustment for Non-financial Risk |
Total |
| Opening Balance - 01/01 |
(145) |
4,756 |
270 |
4,881 |
|
866 |
2,964 |
298 |
4,128 |
| Realization of Insurance Contractual Margin |
- |
(2,242) |
- |
(2,242) |
|
- |
(3,766) |
- |
(3,766) |
| Actuarial Remeasurements |
391 |
(419) |
(18) |
(46) |
|
(676) |
804 |
(30) |
98 |
| Operating Income from Insurance Contracts and Private Pension |
391 |
(2,661) |
(18) |
(2,288) |
|
(676) |
(2,962) |
(30) |
(3,668) |
| New Recognized Insurance Contracts |
(2,699) |
2,688 |
11 |
- |
|
(4,569) |
4,565 |
4 |
- |
| Financial Income from Insurance Contracts and Private Pension |
(15) |
127 |
11 |
123 |
|
(57) |
189 |
(2) |
130 |
| Recognized in Income for the period |
(17) |
127 |
7 |
117 |
|
11 |
189 |
13 |
213 |
| Recognized in Other Comprehensive Income |
2 |
- |
4 |
6 |
|
(68) |
- |
(15) |
(83) |
| Premiums Received, Claims and Other Expenses Paid |
2,361 |
- |
- |
2,361 |
|
4,291 |
- |
- |
4,291 |
| Closing Balance |
(107) |
4,910 |
274 |
5,077 |
|
(145) |
4,756 |
270 |
4,881 |
II - Private pension
| |
06/30/2023 |
|
12/31/2022 |
| |
Liability for Remaining Coverage |
Loss Component of the Liability for Remaining Coverage |
Liability for Incurred Claims |
Total |
|
Liability for Remaining Coverage |
Loss Component of the Liability for Remaining Coverage |
Liability for Incurred Claims |
Total |
| Opening Balance - 01/01 |
227,952 |
184 |
86 |
228,222 |
|
209,463 |
110 |
87 |
209,660 |
| Operating Income from Insurance Contracts and Private Pension |
(38,829) |
6 |
37,957 |
(866) |
|
(83,040) |
164 |
81,216 |
(1,660) |
| Financial Income from Insurance Contracts and Private Pension |
14,528 |
169 |
3 |
14,700 |
|
20,483 |
(90) |
2 |
20,395 |
| Premiums Received, Claims and Other Expenses Paid |
40,504 |
- |
(37,954) |
2,550 |
|
81,046 |
- |
(81,219) |
(173) |
| Closing Balance |
244,155 |
359 |
92 |
244,606 |
|
227,952 |
184 |
86 |
228,222 |
| |
|
|
|
|
|
|
|
|
|
| |
06/30/2023 |
|
12/31/2022 |
| |
Estimate of Present Value of Future Cash Flows |
Contractual Service Margin |
Risk Adjustment for Non-financial Risk |
Total |
|
Estimate of Present Value of Future Cash Flows |
Contractual Service Margin |
Risk Adjustment for Non-financial Risk |
Total |
| Opening balance - 01/01 |
210,255 |
17,696 |
271 |
228,222 |
|
188,469 |
20,891 |
300 |
209,660 |
| Realization of Insurance Contractual Margin |
- |
(904) |
- |
(904) |
|
- |
(1,870) |
- |
(1,870) |
| Actuarial Remeasurements |
(1,642) |
1,680 |
- |
38 |
|
3,701 |
(3,466) |
(25) |
210 |
| Operating Income from Insurance Contracts and Private Pension |
(1,642) |
776 |
- |
(866) |
|
3,701 |
(5,336) |
(25) |
(1,660) |
| New Recognized Insurance Contracts |
(1,323) |
1,320 |
3 |
- |
|
(2,127) |
2,120 |
7 |
- |
| Financial Income from Insurance Contracts and Private Pension |
14,672 |
11 |
17 |
14,700 |
|
20,385 |
21 |
(11) |
20,395 |
| Recognized in Income for the period |
13,857 |
11 |
5 |
13,873 |
|
21,630 |
21 |
9 |
21,660 |
| Recognized in Other Comprehensive Income |
815 |
- |
12 |
827 |
|
(1,245) |
- |
(20) |
(1,265) |
| Premiums Received, Claims and Other Expenses Paid |
2,550 |
- |
- |
2,550 |
|
(173) |
- |
- |
(173) |
| Closing Balance |
224,512 |
19,803 |
291 |
244,606 |
|
210,255 |
17,696 |
271 |
228,222 |
The underlying assets of the portfolio of private pension
contracts with direct participation features (PGBL and VGBL) are composed of specially organized investment funds, which are mostly consolidated
in ITAÚ UNIBANCO HOLDING, whose fair value of the quotas is R$ 232,498 (R$ 216,467 at 12/31/2022).
b) Contractual service margin
| ITAÚ UNIBANCO HOLDING expects to recognize the Contractual Service Margin in income according to the terms and amounts shown below: |
| |
|
|
|
|
|
|
|
| Period |
06/30/2023 |
|
12/31/2022 |
| lnsurance |
Private Pension |
Total |
|
lnsurance |
Private Pension |
Total |
| 1 year |
1,767 |
1,737 |
3,504 |
|
1,767 |
1,756 |
3,523 |
| 2 years |
1,100 |
1,836 |
2,936 |
|
1,067 |
1,854 |
2,921 |
| 3 years |
899 |
1,883 |
2,782 |
|
830 |
1,868 |
2,698 |
| 4 years |
712 |
1,894 |
2,606 |
|
631 |
1,856 |
2,487 |
| 5 years |
362 |
1,798 |
2,160 |
|
361 |
1,745 |
2,106 |
| Over 5 years |
70 |
10,655 |
10,725 |
|
100 |
8,617 |
8,717 |
| Total |
4,910 |
19,803 |
24,713 |
|
4,756 |
17,696 |
22,452 |
During the period, the recognized amount of revenue from
insurance contracts and private pension referring to groups of contracts measured by the modified retrospective approach (contracts in
force on the transition date) is R$ 1,329 (R$ 3,128 from 01/01 to 12/31/2022), with the balance of margin of these contracts
corresponding to R$ 20,822 (R$ 19,042 at 12/31/2022).
c) Discount rates
The rates used by indexing unit to discount cash flows from
insurance contracts and private pension are as follows:
| |
06/30/2023 |
|
12/31/2022 |
| Indexes |
1 year |
3 years |
5 years |
10 years |
20 years |
|
1 year |
3 years |
5 years |
10 years |
20 years |
| IGPM |
8.72% |
5.66% |
6.25% |
6.45% |
5.76% |
|
6.72% |
6.24% |
6.20% |
6.33% |
6.44% |
| IPCA |
7.65% |
5.25% |
5.02% |
5.05% |
5.22% |
|
6.86% |
6.06% |
5.98% |
5.92% |
5.90% |
| TR |
10.34% |
9.32% |
9.51% |
9.73% |
9.76% |
|
11.34% |
10.91% |
10.97% |
11.02% |
11.06% |
d) Claims development
| Occurrence date |
|
12/31/2019 |
12/31/2020 |
12/31/2021 |
12/31/2022 |
06/30/2023 |
Total |
| At the end of event period |
|
930 |
1,026 |
1,267 |
1,171 |
497 |
|
| After 1 year |
|
1,156 |
1,253 |
1,536 |
1,372 |
|
|
| After 2 years |
|
1,187 |
1,288 |
1,574 |
|
|
|
| After 3 years |
|
1,205 |
1,296 |
|
|
|
|
| After 4 years |
|
1,210 |
|
|
|
|
|
| Accumulated payments through base date |
1,190 |
1,275 |
1,527 |
1,352 |
412 |
5,756 |
| Liabilities recognized in the balance sheet |
|
|
|
|
|
634 |
| Liabilities in relation to prior periods |
|
|
|
|
|
|
28 |
| Other estimates |
|
|
|
|
|
|
17 |
| Adjustment to present value |
|
|
|
|
|
|
(9) |
| Risk adjustment to non-financial risk |
|
|
|
|
|
|
44 |
| Liability for Claims incurred at 06/30/2023 |
|
|
|
|
|
714 |
Note 28 - Fair value of financial instruments
The fair value is a measurement based on market. In cases
where market prices are not available, fair values are based on estimates using discounted cash flows or other valuation techniques. These
techniques are significantly affected by the assumptions adopted, including the discount rate and estimate of future cash flows. The estimated
fair value obtained through these techniques cannot be substantiated by comparison with independent markets and, in many cases, cannot
be realized on immediate settlement of the instrument.
To increase consistency and comparability in fair value measurements
and the corresponding disclosures, a fair value hierarchy is established that classifies into three levels the information for the valuation
techniques used in the fair value measurement.
Level 1: Observable inputs that reflect quoted prices
(unadjusted) for identical assets or liabilities in active markets. An active market is a market in which transactions for the asset or
liability being measured occur often enough and with sufficient volume to provide pricing information on an ongoing basis.
Level 2: Input that is not observable for the asset
or liability either directly or indirectly. Level 2 generally includes: (i) quoted prices for similar assets or liabilities in active
markets; (ii) quoted prices for identical or similar assets or liabilities in markets that are not active, that is, markets in which there
are few transactions for the asset or liability, the prices are not current, or quoted prices vary substantially either over time or among
market makers, or in which little information is released publicly; (iii) inputs other than quoted prices that are observable for the
asset or liability (for example, interest rates and yield curves observable at commonly quoted intervals, volatilities, etc.); (iv) inputs
that are mainly derived from or corroborated by observable market data through correlation or by other means.
Level 3: Inputs are not observable for the asset or
liability. Unobservable information is used to measure fair value to the extent that observable information is not available, thus allowing
for situations in which there is little, or no market activity for the asset or liability at the measurement date.
The methods and assumptions used to estimate the fair value
are defined below:
• Central
Bank deposits, Securities purchased under agreements to resell and Securities sold under repurchase agreements - The carrying
amounts for these instruments are close to their fair values.
• Interbank
deposits, Deposits, Interbank and Institutional Market Funds - They are calculated
by discounting estimated cash flows at market interest rates.
• Securities
and Derivatives - Under normal conditions, the prices quoted in the market are the best indicators of the fair values
of these financial instruments. However, not all instruments have liquidity or quoted market prices and, in such cases, it is necessary
to adopt present value estimates and other techniques to establish their fair value. In the absence of prices quoted by the Brazilian
Association of Financial and Capital Markets Entities (ANBIMA), the fair values of government securities are calculated by discounting
estimated cash flows at market interest rates, as well as corporate securities.
• Loans
and financial leases - Fair value is estimated for groups of loans with similar financial and risk characteristics, using
valuation models. The fair value of fixed-rate loans was determined by discounting estimated cash flows, at interest rates applicable
to similar loans. For the majority of loans at floating rates, the carrying amount was considered to be close to their market value. The
fair value of loan and lease operations not overdue was calculated by discounting the expected payments of principal and interest to maturity.
The fair value of overdue loan and lease transactions was based on the discount of estimated cash flows, using a rate proportional to
the risk associated with the estimated cash flows, or on the underlying collateral. The assumptions for cash flows and discount rates
rely on information available in the market and knowledge of the individual debtor.
• Other
financial assets / liabilities - Primarily composed of receivables from credit card issuers, deposits in guarantee for
contingent liabilities, provisions and legal obligations and trading and intermediation of securities. The carrying amounts for these
assets/liabilities substantially approximate to their fair values, since they principally represent amounts to be received in the short
term from credit card holders and to be paid to credit card issuers, deposits in guarantee (indexed to market rates) made by ITAÚ
UNIBANCO HOLDING to secure lawsuits or very short-term receivables (generally with a maturity of approximately 5 business days).
All of these items represent assets / liabilities without significant associated market, credit or liquidity risks.
Financial instruments not included in the Balance Sheet (Note
32) are represented by Standby letters of credit and financial guarantees provided, which amount to R$ 126,069 (R$ 139,133 at
12/31/2022) with an estimated fair value of R$ 147 (R$ 161 at 12/31/2022).
a) Financial assets and liabilities measured
at fair value
| The following table presents the financial assets and liabilities measured at fair value on a recurring basis, segregated between levels of the fair value hierarchy. |
| |
|
|
|
|
|
|
|
|
|
| |
06/30/2023 |
|
12/31/2022 |
| |
Level 1 |
Level 2 |
Level 3 |
Book Value / Fair Value |
|
Level 1 |
Level 2 |
Level 3 |
Book Value / Fair Value |
| Financial Assets |
494,147 |
106,780 |
1,649 |
602,576 |
|
396,993 |
115,792 |
437 |
513,222 |
| Financial assets at fair value through profit or loss |
362,113 |
104,509 |
1,607 |
468,229 |
|
274,659 |
111,436 |
379 |
386,474 |
| Investment funds |
276 |
23,132 |
- |
23,408 |
|
954 |
31,537 |
- |
32,491 |
| Brazilian government securities |
304,164 |
6,633 |
- |
310,797 |
|
226,056 |
5,856 |
- |
231,912 |
| Government securities – other countries |
10,755 |
- |
- |
10,755 |
|
8,017 |
- |
- |
8,017 |
| Corporate securities |
46,918 |
73,167 |
1,522 |
121,607 |
|
39,632 |
72,708 |
339 |
112,679 |
| Shares |
8,885 |
15,844 |
108 |
24,837 |
|
5,817 |
9,634 |
86 |
15,537 |
| Rural product note |
- |
1,951 |
9 |
1,960 |
|
- |
2,510 |
7 |
2,517 |
| Bank deposit certificates |
- |
246 |
- |
246 |
|
- |
360 |
- |
360 |
| Real estate receivables certificates |
154 |
1,222 |
165 |
1,541 |
|
- |
1,329 |
151 |
1,480 |
| Debentures |
34,595 |
31,282 |
1,223 |
67,100 |
|
29,446 |
33,412 |
84 |
62,942 |
| Eurobonds and other |
2,623 |
- |
5 |
2,628 |
|
4,369 |
- |
4 |
4,373 |
| Financial bills |
- |
18,845 |
12 |
18,857 |
|
- |
19,371 |
7 |
19,378 |
| Promissory and commercial notes |
- |
2,822 |
- |
2,822 |
|
- |
3,900 |
- |
3,900 |
| Other |
661 |
955 |
- |
1,616 |
|
- |
2,192 |
- |
2,192 |
| Other Financial Assets |
- |
1,577 |
85 |
1,662 |
|
- |
1,335 |
40 |
1,375 |
| Financial assets at fair value through other comprehensive income |
132,034 |
2,271 |
42 |
134,347 |
|
122,334 |
4,356 |
58 |
126,748 |
| Brazilian government securities |
78,116 |
227 |
- |
78,343 |
|
75,647 |
1,032 |
- |
76,679 |
| Government securities – other countries |
44,223 |
- |
- |
44,223 |
|
37,910 |
- |
- |
37,910 |
| Corporate securities |
9,695 |
2,044 |
42 |
11,781 |
|
8,777 |
3,324 |
58 |
12,159 |
| Shares |
5,664 |
54 |
42 |
5,760 |
|
4,770 |
70 |
45 |
4,885 |
| Rural product note |
- |
- |
- |
- |
|
- |
390 |
- |
390 |
| Bank deposit certificates |
12 |
40 |
- |
52 |
|
551 |
150 |
13 |
714 |
| Real estate receivables certificates |
118 |
258 |
- |
376 |
|
- |
- |
- |
- |
| Debentures |
900 |
620 |
- |
1,520 |
|
538 |
645 |
- |
1,183 |
| Eurobonds and other |
2,637 |
1,072 |
- |
3,709 |
|
2,918 |
1,361 |
- |
4,279 |
| Financial credit bills |
- |
- |
- |
- |
|
- |
13 |
- |
13 |
| Other |
364 |
- |
- |
364 |
|
- |
695 |
- |
695 |
| Financial liabilities at fair value through profit or loss |
- |
880 |
25 |
905 |
|
- |
647 |
- |
647 |
| Structured notes |
- |
86 |
- |
86 |
|
- |
64 |
- |
64 |
| Other financial liabilities |
- |
794 |
25 |
819 |
|
- |
583 |
- |
583 |
| The following table presents the breakdown of fair value hierarchy levels for derivative assets and liabilities. |
| |
06/30/2023 |
|
12/31/2022 |
| |
Level 1 |
Level 2 |
Level 3 |
Total |
|
Level 1 |
Level 2 |
Level 3 |
Total |
| Assets |
7 |
72,304 |
534 |
72,845 |
|
29 |
77,508 |
671 |
78,208 |
| Swap Contracts – adjustment receivable |
- |
42,960 |
511 |
43,471 |
|
- |
46,271 |
631 |
46,902 |
| Option Contracts |
- |
11,040 |
6 |
11,046 |
|
- |
23,637 |
34 |
23,671 |
| Forward Contracts |
- |
7,208 |
17 |
7,225 |
|
- |
595 |
6 |
601 |
| Credit derivatives |
- |
319 |
- |
319 |
|
- |
492 |
- |
492 |
| NDF - Non Deliverable Forward |
- |
9,871 |
- |
9,871 |
|
- |
6,140 |
- |
6,140 |
| Other derivative financial instruments |
7 |
906 |
- |
913 |
|
29 |
373 |
- |
402 |
| Liabilities |
(152) |
(66,687) |
(487) |
(67,326) |
|
(186) |
(76,106) |
(569) |
(76,861) |
| Swap Contracts – adjustment payable |
- |
(38,870) |
(469) |
(39,339) |
|
- |
(38,507) |
(561) |
(39,068) |
| Option Contracts |
- |
(12,812) |
(2) |
(12,814) |
|
- |
(29,880) |
(2) |
(29,882) |
| Forward Contracts |
- |
(6,909) |
- |
(6,909) |
|
- |
(65) |
- |
(65) |
| Credit derivatives |
- |
(295) |
- |
(295) |
|
- |
(604) |
- |
(604) |
| NDF - Non Deliverable Forward |
- |
(7,648) |
- |
(7,648) |
|
- |
(6,626) |
- |
(6,626) |
| Other derivative financial instruments |
(152) |
(153) |
(16) |
(321) |
|
(186) |
(424) |
(6) |
(616) |
| In all periods, there was no significant transfer between Level 1 and Level 2. Transfers to and from Level 3 are presented in movements of Level 3. |
The methods and assumptions used to measurement the fair
value are defined below:
Level 1: Securities with liquid prices available
in an active market and derivatives traded on stock exchanges. This classification level includes most of the Brazilian government securities,
government securities from other countries, shares, debentures with price published by ANBIMA and other securities traded in an active
market.
Level 2: Bonds, securities, derivatives and others
that do not have price information available and are priced based on conventional or internal models. The inputs used by these models
are captured directly or built from observations of active markets. Most derivatives traded over-the-counter, certain Brazilian government
bonds, debentures and other private securities whose credit component effect is not considered relevant, are at this level.
Level 3: Bonds, securities and derivatives for
which pricing inputs are generated by statistical and mathematical models. Debentures and other private securities that do not fit into
level 2 rule and derivatives with maturities greater than the last observable vertices of the discount curves are at this level.
All the above methods may result in a fair value that is
not indicative of the net realizable value or future fair values. However, ITAÚ UNIBANCO HOLDING believes that all the methods
used are appropriate and consistent with other market participants. Moreover, the adoption of different methods or assumptions to estimate
fair value may result in different fair value estimates at the balance sheet date.
Governance of Level 3 recurring fair value measurement
The departments in charge of defining and applying the pricing
models are segregated from the business areas. The models are documented, submitted to validation by an independent area and approved
by a specific committee. The daily processes of price capture, calculation and disclosure are periodically checked according to formally
defined tests and criteria and the information is stored in a single corporate data base.
The most frequent cases of assets classified as Level 3 are
justified by the discount factors used and corporate bonds whose credit component is relevant. Factors such as the fixed interest curve
in Brazilian Reais and the TR coupon curve – and, as a result, their related factors – have inputs with terms shorter than
the maturities of fixed-income assets.
Level 3 recurring fair value changes
The tables below show balance sheet changes for financial
instruments classified by ITAÚ UNIBANCO HOLDING in Level 3 of the fair value hierarchy. Derivative financial instruments classified
in Level 3 correspond to swap and option.
| |
Fair value at |
Total gains or losses (realized / unrealized) |
Purchases |
Settlements |
Transfers in and / or out of Level |
Fair value at |
Total Gains or Losses (unrealized) |
| |
| 01/01/2023 |
12/31/2022 |
Recognized in income |
Recognized in other comprehensive income |
06/30/2023 |
| |
|
|
| Financial assets at fair value through profit or loss |
379 |
(29) |
- |
89 |
(18) |
1,186 |
1,607 |
(907) |
| Corporate securities |
339 |
(60) |
- |
87 |
(16) |
1,172 |
1,522 |
(992) |
| Shares |
86 |
23 |
- |
9 |
(10) |
- |
108 |
(52) |
| Real estate receivables certificates |
151 |
(9) |
- |
- |
- |
23 |
165 |
(58) |
| Debentures |
84 |
(78) |
- |
65 |
(2) |
1,154 |
1,223 |
(879) |
| Rural Product Note |
7 |
5 |
- |
- |
- |
(3) |
9 |
(3) |
| Eurobonds and other |
4 |
(1) |
- |
3 |
(1) |
- |
5 |
- |
| Financial bills |
7 |
- |
- |
10 |
(3) |
(2) |
12 |
- |
| Other financial assets |
40 |
31 |
- |
2 |
(2) |
14 |
85 |
85 |
| Financial assets at fair value through other comprehensive income |
58 |
(16) |
- |
- |
- |
- |
42 |
- |
| Corporate securities |
58 |
(16) |
- |
- |
- |
- |
42 |
- |
| Shares |
45 |
(3) |
- |
- |
- |
- |
42 |
- |
| Bank deposit certificates |
13 |
(13) |
- |
- |
- |
- |
- |
- |
| |
Fair value at |
Total gains or losses (realized / unrealized) |
Purchases |
Settlements |
Transfers in and / or out of Level |
Fair value at |
Total Gains or Losses (unrealized) |
| |
| |
12/31/2022 |
Recognized in income |
Recognized in other comprehensive income |
06/30/2023 |
| |
|
|
| Derivatives - assets |
671 |
(79) |
- |
113 |
(93) |
(78) |
534 |
484 |
| Swap Contracts – adjustment receivable |
631 |
(49) |
- |
94 |
(87) |
(78) |
511 |
492 |
| Option Contracts |
34 |
(31) |
- |
9 |
(6) |
- |
6 |
(8) |
| Foiward contracts |
6 |
1 |
- |
10 |
- |
- |
17 |
- |
| Derivatives - liabilities |
(569) |
118 |
- |
(121) |
6 |
79 |
(487) |
(230) |
| Swap Contracts – adjustment payable |
(561) |
116 |
- |
(109) |
6 |
79 |
(469) |
(228) |
| Option Contracts |
(2) |
2 |
- |
(2) |
- |
- |
(2) |
(2) |
| Other derivative financial instruments |
(6) |
- |
- |
(10) |
- |
- |
(16) |
- |
| |
Fair value at |
Total gains or losses (realized / unrealized) |
Purchases |
Settlements |
Transfers in and / or out of Level |
Fair value at |
Total Gains or Losses (unrealized) |
| |
| 01/01/2022 |
12/31/2021 |
Recognized in income |
Recognized in other comprehensive income |
12/31/2022 |
| |
|
|
| Financial assets at fair value through profit or loss |
1,563 |
46 |
- |
143 |
(49) |
(1,324) |
379 |
(98) |
| Corporate securities |
1,563 |
21 |
- |
128 |
(49) |
(1,324) |
339 |
(138) |
| Shares |
- |
(54) |
- |
- |
- |
140 |
86 |
(62) |
| Real estate receivables certificates |
3 |
(36) |
- |
2 |
(2) |
184 |
151 |
(60) |
| Debentures |
1,478 |
109 |
- |
96 |
- |
(1,599) |
84 |
(7) |
| Rural Product Note |
61 |
3 |
- |
- |
(1) |
(56) |
7 |
(9) |
| Eurobonds and other |
8 |
(1) |
- |
11 |
(14) |
- |
4 |
- |
| Financial bills |
13 |
- |
- |
19 |
(32) |
7 |
7 |
- |
| Other financial assets |
- |
25 |
- |
15 |
- |
- |
40 |
40 |
| Financial assets at fair value through other comprehensive income |
- |
(2) |
- |
47 |
- |
13 |
58 |
- |
| Corporate securities |
- |
(2) |
- |
47 |
- |
13 |
58 |
- |
| Shares |
- |
(2) |
- |
47 |
- |
- |
45 |
- |
| Bank deposit certificates |
- |
- |
- |
- |
- |
13 |
13 |
- |
| |
Fair value at |
Total gains or losses (realized / unrealized) |
Purchases |
Settlements |
Transfers in and / or out of Level |
Fair value at |
Total Gains or Losses (unrealized) |
| |
| |
12/31/2021 |
Recognized in income |
Recognized in other comprehensive income |
12/31/2022 |
| |
|
|
| Derivatives - assets |
152 |
178 |
- |
298 |
(552) |
595 |
671 |
588 |
| Swap Contracts – adjustment receivable |
90 |
151 |
- |
64 |
(73) |
399 |
631 |
608 |
| Option Contracts |
62 |
27 |
- |
228 |
(479) |
196 |
34 |
(20) |
| Foiward contracts |
- |
- |
- |
6 |
- |
- |
6 |
- |
| Derivatives - liabilities |
(125) |
48 |
- |
(217) |
38 |
(313) |
(569) |
(349) |
| Swap Contracts – adjustment payable |
(111) |
(25) |
- |
(132) |
21 |
(314) |
(561) |
(350) |
| Option Contracts |
(14) |
73 |
- |
(79) |
17 |
1 |
(2) |
1 |
| Other derivative financial instruments |
- |
- |
- |
(6) |
- |
- |
(6) |
- |
| Sensitivity analysis of Level 3 operations |
| The fair value of financial instruments classified in Level 3 is measured through valuation techniques based on correlations and associated products traded in active markets, internal estimates and internal models. |
| Significant unobservable inputs used for measurement of the fair value of instruments classified in Level 3 are: interest rates, underlying asset prices and volatility. Significant variations in any of these inputs separately may give rise to substantial changes in the fair value. |
| The table below shows the sensitivity of these fair values in scenarios of changes of interest rates or, asset prices, or in scenarios with varying shocks to prices and volatilities for nonlinear assets: |
| Sensitivity – Level 3 Operations |
|
06/30/2023 |
|
12/31/2022 |
| Market risk factor groups |
Scenarios |
Impact |
|
Impact |
| Income |
Stockholders' equity |
|
Income |
Stockholders' equity |
| Interest rates |
I |
(1.3) |
- |
|
(2.2) |
- |
| II |
(32.7) |
- |
|
(56.9) |
- |
| III |
(65.4) |
- |
|
(113.3) |
- |
| Commodities, Indexes and Shares |
I |
(7.7) |
(2.0) |
|
(6.7) |
- |
| II |
(15.5) |
(4.1) |
|
(13.4) |
- |
| Nonlinear |
I |
(1.6) |
- |
|
(24.8) |
- |
| II |
(2.2) |
- |
|
(37.8) |
- |
| The following scenarios are used to measure sensitivity: |
| Interest rate |
| Based on reasonably possible changes in assumptions of 1, 25 and 50 basis points (scenarios I, II and III respectively) applied to the interest curves, both up and down, taking the largest losses resulting in each scenario. |
| Commodities, Index and Shares |
| Based on reasonably possible changes in assumptions of 5 and 10 percentage points (scenarios I and II respectively) applied to share prices, both up and down, taking the largest losses resulting in each scenario. |
| Nonlinear |
| Scenario I: Based on reasonably possible changes in assumptions of 5 percentage points on prices and 25 percentage points on the volatility level, both up and down, taking the largest losses resulting in each scenario. |
| Scenario II: Based on reasonably possible changes in assumptions of 10 percentage points on prices and 25 percentage points on the volatility level, both up and down, taking the largest losses resulting in each scenario. |
b) Financial assets and liabilities not
measured at fair value
| The following table presents the financial assets and liabilities not measured at fair value on a recurring basis. |
| |
|
|
|
|
|
| |
06/30/2023 |
|
12/31/2022 |
| |
Book value |
Fair value |
|
Book value |
Fair value |
| Financial assets |
1,606,250 |
1,612,575 |
|
1,578,789 |
1,580,793 |
| At Amortized Cost |
1,606,250 |
1,612,575 |
|
1,578,789 |
1,580,793 |
| Central Bank compulsory deposits |
136,749 |
136,749 |
|
115,748 |
115,748 |
| Interbank deposits |
53,326 |
54,214 |
|
59,592 |
59,868 |
| Securities purchased under agreements to resell |
216,959 |
216,959 |
|
221,779 |
221,779 |
| Securities |
236,011 |
234,774 |
|
213,026 |
213,438 |
| Loan and financial lease |
901,185 |
907,859 |
|
909,422 |
910,738 |
| Other financial assets |
113,957 |
113,957 |
|
109,909 |
109,909 |
| (-) Provision for expected loss |
(51,937) |
(51,937) |
|
(50,687) |
(50,687) |
| Financial liabilities |
1,844,291 |
1,843,916 |
|
1,759,182 |
1,758,475 |
| At Amortized Cost |
1,840,419 |
1,840,044 |
|
1,755,498 |
1,754,791 |
| Deposits |
923,281 |
923,285 |
|
871,438 |
871,370 |
| Securities sold under repurchase agreements |
319,099 |
319,099 |
|
293,440 |
293,440 |
| Interbank market funds |
318,382 |
318,385 |
|
294,587 |
294,573 |
| Institutional market funds |
118,689 |
118,307 |
|
129,382 |
128,757 |
| Other financial liabilities |
160,968 |
160,968 |
|
166,651 |
166,651 |
| Provision for Expected Loss |
3,872 |
3,872 |
|
3,684 |
3,684 |
| Loan commitments |
3,094 |
3,094 |
|
2,874 |
2,874 |
| Financial guarantees |
778 |
778 |
|
810 |
810 |
Note 29 - Provisions, contingent assets
and contingent liabilities
In the ordinary course of its business, ITAÚ
UNIBANCO HOLDING may be a party to legal proceedings labor, civil and tax nature. The contingencies related to these lawsuits are
classified as follows:
a) Contingent assets
There are no contingent assets recorded.
b) Provisions and contingencies
ITAÚ UNIBANCO HOLDING’s provisions for judicial
and administrative challenges are long-term, considering the time required for their questioning, and this prevents the disclosure of
a deadline for their conclusion.
The legal advisors believe that ITAÚ UNIBANCO
HOLDING is not a party to this or any other administrative proceedings or lawsuits, in addition to those highlighted throughout this
note, that could significantly affect the results of its operations.
Civil lawsuits
In general, provisions and contingencies arise from claims
related to the revision of contracts and compensation for material and moral damages. The lawsuits are classified as follows:
Collective lawsuits: Related to claims of a similar
nature and with individual amounts that are not considered significant. Provisions are calculated on a monthly basis and the expected
amount of losses is accrued according to statistical references that take into account the nature of the lawsuit and the characteristics
of the court (Small Claims Court or Regular Court). Contingencies and provisions are adjusted to reflect the amounts deposited into court
as guarantee for their execution when realized.
Individual lawsuits: Related to claims with unusual
characteristics or involving significant amounts. The probability of loss is ascertained periodically, based on the amount claimed and
the special nature of each case. The probability of loss is estimated according to the peculiarities of the lawsuits.
ITAÚ UNIBANCO HOLDING, despite having complied with
the rules in force at the time, is a defendant in lawsuits filed by individuals referring to payment of inflation adjustments to savings
accounts resulting from economic plans implemented in the 1980s and the 1990s, as well as in collective lawsuits filed by: (i) consumer
protection
associations; and (ii) the Public Attorney’s Office,
on behalf of the savings accounts holders. ITAÚ UNIBANCO HOLDING recognizes provisions upon receipt of summons, and when individuals
demand the enforcement of a ruling handed down by the courts, using the same criteria as for provisions for individual lawsuits.
The Federal Supreme Court (STF) has issued some decisions
favorable to savings account holders, but it has not established its understanding with respect to the constitutionality of the economic
plans and their applicability to savings accounts. Currently, the appeals involving these matters are suspended, by order of the STF,
until it pronounces its final decision.
In December 2017, through mediation of the Federal Attorney’s
Office (AGU) and supervision of the BACEN, savers (represented by two civil associations, FEBRAPO and IDEC) and FEBRABAN entered into
an instrument of agreement aiming at resolving lawsuits related to the economic plans, and ITAÚ UNIBANCO HOLDING has already
accepted its terms. Said agreement was approved on March 1, 2018, by the Plenary Session of the Federal Supreme Court (STF) and savers
could adhere to its terms for a 24-month period.
Due to the end of this term, the parties signed an amendment
to the instrument of agreement to extend this period in order to contemplate a higher number of holders of savings accounts and, consequently,
to extend the end of lawsuits. In May, 2020 the Federal Supreme Court (STF) approved this amendment and granted a 30-month term for new
adhesions, and this term may be extended for another 30 months, subject to the reporting of the number of adhesions over the first period.
Labor claims
Provisions and contingencies arise from lawsuits in which
labor rights provided for in labor legislation specific to the related profession are discussed, such as: overtime, salary equalization,
reinstatement, transfer allowance, and pension plan supplement, among others. These lawsuits are classified as follows:
Collective lawsuits: related to claims considered
similar and with individual amounts that are not considered significant. The expected amount of loss is determined and accrued on a monthly
basis in accordance with a statistical model which calculates the amount of the claims and it is reassessed taking into account court
rulings. Provisions for contingencies are adjusted to reflect the amounts deposited into court as security for execution.
Individual lawsuits: related to claims with unusual
characteristics or involving significant amounts. These are periodically calculated based on the amounts claimed. The probability of loss
is estimated in accordance with the actual and legal characteristics of each lawsuit.
Other risks
These are quantified and accrued on the basis of the amount
of rural credit transactions with joint liability and FCVS (salary variations compensation fund) credits assigned to Banco Nacional.
I - Civil, labor and other risks provisions
| Below are the changes in civil, labor and other risks provisions: |
|
|
| |
|
|
06/30/2023 |
| |
|
Note |
Civil |
Labor |
Other Risks |
Total |
| Opening balance - 01/01 |
|
3,231 |
8,186 |
1,844 |
13,261 |
| (-) Provisions guaranteed by indemnity clause |
2d XIV |
(207) |
(952) |
- |
(1,159) |
| Subtotal |
|
3,024 |
7,234 |
1,844 |
12,102 |
| Adjustment / Interest |
23 |
94 |
256 |
- |
350 |
| Changes in the period reflected in income |
23 |
609 |
1,317 |
277 |
2,203 |
| Increase |
|
852 |
1,456 |
302 |
2,610 |
| Reversal |
|
(243) |
(139) |
(25) |
(407) |
| Payment |
|
(585) |
(1,399) |
(12) |
(1,996) |
| Subtotal |
|
3,142 |
7,408 |
2,109 |
12,659 |
| (+) Provisions guaranteed by indemnity clause |
2d XIV |
204 |
970 |
- |
1,174 |
| Closing balance |
|
3,346 |
8,378 |
2,109 |
13,833 |
| Current |
|
1,410 |
3,012 |
2,109 |
6,531 |
| Non-current |
|
1,936 |
5,366 |
- |
7,302 |
| |
|
|
|
|
|
|
| |
|
|
12/31/2022 |
| |
|
Note |
Civil |
Labor |
Other Risks |
Total |
| Opening balance - 01/01 |
|
3,317 |
8,219 |
1,558 |
13,094 |
| (-) Provisions guaranteed by indemnity clause |
2d XIV |
(225) |
(879) |
- |
(1,104) |
| Subtotal |
|
3,092 |
7,340 |
1,558 |
11,990 |
| Adjustment / Interest |
23 |
169 |
491 |
- |
660 |
| Changes in the period reflected in income |
23 |
903 |
2,339 |
469 |
3,711 |
| Increase (1) |
|
1,403 |
2,663 |
469 |
4,535 |
| Reversal |
|
(500) |
(324) |
- |
(824) |
| Payment |
|
(1,140) |
(2,936) |
(183) |
(4,259) |
| Subtotal |
|
3,024 |
7,234 |
1,844 |
12,102 |
| (+) Provisions guaranteed by indemnity clause |
2d XIV |
207 |
952 |
- |
1,159 |
| Closing balance |
|
3,231 |
8,186 |
1,844 |
13,261 |
| Current |
|
1,157 |
2,949 |
605 |
4,711 |
| Non-current |
|
2,074 |
5,237 |
1,239 |
8,550 |
| 1) Includes, in the labor provision, the effects of the Voluntary Severance Program at 12/31/2022. |
II - Tax and social security provisions
| Tax and social security provisions correspond to the principal amount of taxes involved in administrative or judicial tax lawsuits, subject to tax assessment notices, plus interest and, when applicable, fines and charges. |
| The table below shows the change in the provisions: |
|
|
|
| |
|
Note |
06/30/2023 |
12/31/2022 |
| Opening balance - 01/01 |
|
6,214 |
6,498 |
| (-) Provisions guaranteed by indemnity clause |
2d XIV |
(75) |
(71) |
| Subtotal |
|
6,139 |
6,427 |
| Adjustment / Interest (1) |
|
191 |
628 |
| Changes in the period reflected in income |
|
(62) |
(829) |
| Increase (1) |
|
88 |
156 |
| Reversal (1) |
|
(150) |
(985) |
| Payment |
|
(38) |
(86) |
| Subtotal |
|
6,230 |
6,140 |
| (+) Provisions guaranteed by indemnity clause |
2d XIV |
77 |
74 |
| Closing balance |
|
6,307 |
6,214 |
| Current |
|
- |
4 |
| Non-current |
|
6,307 |
6,210 |
| 1) The amounts are included in the headings Tax Expenses, General and Administrative Expenses and Current Income Tax and Social Contribution. |
The main discussions related to tax and social security provisions
are described below:
• INSS
– Non-compensatory Amounts – R$ 1,913: the non-levy of social security contribution on amounts paid as profit sharing
is defended. The balance of the deposits in guarantee is R$ 1,229.
• PIS
and COFINS – Calculation Basis – R$ 689: defending the levy of PIS and COFINS on revenue, a tax on revenue from the sales
of assets and services. The balance of the deposits in guarantee is R$ 675.
III - Contingencies not provided for in
the balance sheet
Amounts involved in administrative and judicial arguments
with the risk of loss estimated as possible are not provided for. They are mainly composed of:
Civil lawsuits and labor claims
In Civil Lawsuits with possible loss, total estimated risk
is R$ 5,386 (R$ 5,087 at 12/31/2022), and in this total there are no amounts arising from interests in Joint Ventures.
For Labor Claims with possible loss, estimated risk is R$
731 (R$ 637 at 12/31/2022).
Tax and social security obligations
Tax and social security obligations of possible loss totaled R$ 43,248
(R$ 40,958 at 12/31/2022), and the main cases are described below:
• INSS
– Non-compensatory Amounts – R$ 10,277: defends the non-levy of this contribution on these amounts, among which are profit
sharing and stock options.
• ISS
– Banking Activities/Provider Establishment – R$ 6,692: the levy and/or payment place of ISS for certain banking revenues
are discussed.
• IRPJ,
CSLL, PIS and COFINS – Funding Expenses – R$ 5,570: the deductibility of raising costs (Interbank deposits rates) for
funds that were capitalized between group companies.
• IRPJ
and CSLL – Goodwill – Deduction – R$ 3,795: the deductibility of goodwill for future expected profitability on
the acquisition of investments.
• PIS
and COFINS - Reversal of Revenues from Depreciation in Excess – R$ 3,532 : discussing the accounting and tax treatment
of PIS and COFINS upon settlement of leasing operations.
• IRPJ,
CSLL, PIS and COFINS – Requests for Offsetting Dismissed – R$ 2,339: cases in which the liquidity and the certainty of
credits offset are discussed.
• IRPJ
and CSLL – Disallowance of Losses – R$ 1,207: discussion on the amount of tax loss (IRPJ) and/or social contribution
(CSLL) tax loss carryforwards used by the Federal Revenue Service when drawing up tax assessment notes that are still pending a final
decision.
• IRPJ
and CSLL - Deductibility of Loss in Loan Operations - R$ 954: assessments drawn up for the requirement of IRPJ and CSLL due
to the alleged noncompliance with legal criteria for deducting losses in receipt of loans.
c) Accounts receivable – Reimbursement
of provisions
The receivables balance arising from reimbursements of contingencies
totals R$ 971 (R$ 899 at 12/31/2022) (Note 18a) , arising mainly from the collateral established in Banco Banerj S.A.
privatization process occurred in 1997, when the State of Rio de Janeiro created a fund to guarantee the equity recomposition in provisions
for civil, labor and tax and social security claims.
d) Guarantees of contingencies, provisions
and legal obligations
| The guarantees related to legal proceedings involving ITAÚ UNIBANCO HOLDING and basically consist of: |
| |
|
06/30/2023 |
|
12/31/2022 |
| |
Note |
Civil |
Labor |
Tax |
Total |
|
Total |
| Deposits in guarantee |
18a |
1,853 |
2,154 |
9,389 |
13,396 |
|
13,001 |
| Investment fund quotas |
|
435 |
123 |
18 |
576 |
|
615 |
| Surety |
|
65 |
54 |
5,419 |
5,538 |
|
5,262 |
| Insurance bond |
|
1,747 |
1,499 |
17,408 |
20,654 |
|
19,256 |
| Guarantee by government securities |
|
- |
- |
312 |
312 |
|
292 |
| Total |
|
4,100 |
3,830 |
32,546 |
40,476 |
|
38,426 |
Note 30 - Segment Information
The current operational and reporting segments of ITAÚ
UNIBANCO HOLDING are described below:
• Retail
Business
The segment comprises retail customers, account holders
and non-account holders, individuals and legal entities, high income clients (Itaú Uniclass and Personnalité) and the companies
segment (microenterprises and small companies). It includes financing and credit offers made outside the branch network, in addition to
credit cards and payroll loans.
• Wholesale
Business
It comprises products and services offered to middle-market
companies, high net worth clients (Private Banking), and the operation of Latin American units and Itaú BBA, which is the unit
responsible for business with large companies and Investment Banking operations.
• Activities
with the Market + Corporation
Basically, corresponds to the result arising from
capital surplus, subordinated debt surplus and the net balance of tax credits and debits. It also includes the financial margin on market
trading, Treasury operating costs, and equity in earnings of companies not included in either of the other segments.
a) Basis of Presentation
Segment information is based on the reports used by
senior management of ITAÚ UNIBANCO HOLDING to assess performance and to make decisions about allocation of funds for
investment and other purposes.
These reports use a variety of information for management
purposes, including financial and non-financial information supported by bases different from information prepared according to accounting
practices adopted in Brazil. The main indicators used for monitoring business performance are Recurring Income, and Return on Economic
Capital allocated to each business segment.
Information by segment has been prepared in accordance
with accounting practices adopted in Brazil and is adjusted by the items below:
Allocated capital: The statements for each
segment consider capital allocation based on a proprietary model and consequent impacts on results arising from this allocation. This
model includes the following components: Credit risk, operating risk, market risk and insurance underwriting risk.
Income tax rate: We take the total income
tax rate, net of the tax effect from the payment of interest on capital, for the Retail Business, Wholesale Business and Activities with
the Market + Corporation. The difference between the income tax amount calculated by segment and the effective income tax amount, as stated
in the consolidated financial statements, is allocated to the Trading + Institutional column.
• Reclassification
and application of managerial criteria
The managerial statement of income was used to prepare
information per segment. These statements were obtained based on the statement of income adjusted by the impact of non-recurring events
and the managerial reclassifications in income.
The main reclassifications between the accounting and
managerial results are:
Operating revenues: Considers the opportunity
cost for each operation. The financial statements were adjusted so that the stockholders' equity was replaced by funding at market price.
Subsequently, the financial statements were adjusted to include revenues related to capital allocated to each segment. The cost of subordinated
debt and the respective remuneration at market price were proportionally allocated to the segments, based on the economic capital allocated.
Tax effects of hedging: The tax effects
of hedging of investments abroad were adjusted – they were originally recorded as tax expenses (PIS and COFINS) and Income Tax and
Social Contribution on Net Income – and are now reclassified to financial margin.
Insurance: The main reclassifications of
revenues refer to the financial margins obtained from technical provisions for insurance, pension plans and premium bonds, in addition
to revenue from management of pension plan funds.
Other reclassifications: Other Income, Share
of profit or (loss) in Associates and joint ventures, Non-Operating Income, Profit Sharing of Management Members and Expenses for Credit
Card Reward Program were reclassified to those lines representing the way the ITAÚ UNIBANCO HOLDING manages its business, to provide
a clearer understanding of our performance.
The adjustments and reclassifications column shows the
effects of the differences between the accounting principles followed for the presentation of segment information, which are substantially
in line with the accounting practices adopted for financial institutions in Brazil, except as described above, and the policies used in
the preparation of these consolidated financial statements according to IFRS. Significant adjustments are as follows:
• Requirements
for impairment testing of financial assets are based on the expected loan losses model.
• Adjustment
to fair value due to reclassifications of financial assets to categories of measurement at amortized cost, at fair value through profit
and loss or at fair value through other comprehensive income, as a result of the concept of business models of IFRS 9.
• Financial
assets modified and not written-off, with their balances recalculated in accordance with the requirements of IFRS 9.
• Effective
interest rate of financial assets and liabilities measured at amortized cost, appropriating revenues and costs directly attributable to
their acquisition, issue or disposal over the transaction term, whereas in the standards adopted in Brazil, recognition of expenses and
revenues from fees occurs at the time these transactions are contracted.
• Goodwill
generated in a business combination is not amortized, whereas in the standards adopted in Brazil, it is amortized.
b) Consolidated Statement of Managerial
Result
| |
|
04/01 to 06/30/2023 |
| |
Retail Business |
Wholesale Business |
Activities with the Market + Corporation |
ITAÚ UNIBANCO |
Adjustments |
IFRS consolidated (3) |
| Operating revenues |
|
24,030 |
13,507 |
1,290 |
38,827 |
1,295 |
40,122 |
| Interest margin (1) |
|
14,910 |
9,917 |
1,170 |
25,997 |
(245) |
25,752 |
| Commissions and Banking Fees |
|
6,787 |
3,501 |
75 |
10,363 |
811 |
11,174 |
| Income from insurance and private pension operations before claim and selling expenses |
2,333 |
89 |
45 |
2,467 |
(769) |
1,698 |
| Other revenues |
|
- |
- |
- |
- |
1,498 |
1,498 |
| Cost of Credit |
|
(8,281) |
(1,160) |
- |
(9,441) |
1,584 |
(7,857) |
| Claims |
|
(379) |
(4) |
- |
(383) |
383 |
- |
| Operating margin |
|
15,370 |
12,343 |
1,290 |
29,003 |
3,262 |
32,265 |
| Other operating income / (expenses) |
|
(11,193) |
(5,097) |
(409) |
(16,699) |
(4,659) |
(21,358) |
| Non-interest expenses (2) |
|
(9,567) |
(4,414) |
(297) |
(14,278) |
(4,690) |
(18,968) |
| Tax expenses for ISS, PIS and COFINS and Other |
|
(1,626) |
(683) |
(112) |
(2,421) |
(214) |
(2,635) |
| Share of profit or (loss) in associates and joint ventures |
- |
- |
- |
- |
245 |
245 |
| Income before income tax and social contribution |
4,177 |
7,246 |
881 |
12,304 |
(1,397) |
10,907 |
| Income tax and social contribution |
|
(990) |
(2,143) |
(255) |
(3,388) |
1,410 |
(1,978) |
| Non-controlling interests |
|
5 |
(173) |
(6) |
(174) |
(136) |
(310) |
| Net income |
|
3,192 |
4,930 |
620 |
8,742 |
(123) |
8,619 |
| |
|
|
|
|
|
|
|
| 06/30/2023 |
Total assets (*) - |
1,597,790 |
1,212,708 |
171,309 |
2,585,768 |
(151,560) |
2,434,208 |
| Total liabilities - |
1,523,960 |
1,132,982 |
146,442 |
2,407,345 |
(162,078) |
2,245,267 |
| (*) Includes: |
|
|
|
|
|
|
| Investments in associates and joint ventures |
|
2,102 |
- |
4,852 |
6,954 |
926 |
7,880 |
| Fixed assets, net |
|
5,815 |
1,309 |
- |
7,124 |
814 |
7,938 |
| Goodwill and Intangible assets, net |
|
9,104 |
8,933 |
- |
18,037 |
5,884 |
23,921 |
1) Includes interest and similar income and expenses of R$ 12,380, result of financial assets and liabilities at fair value through profit or loss of R$ 8,805 and foreign exchange results and exchange variations in foreign transactions of R$ 4,567.
2) Refers to general and administrative expenses including depreciation and amortization expenses of R$ (1,679).
3) The IFRS Consolidated figures do not represent the sum of the parties because there are intercompany transactions that were eliminated only in the consolidated statements. Segments are assessed by top management, net of income and expenses between related parties. |
| |
|
04/01 to 06/30/2022 |
| |
|
Retail Business |
Wholesale Business |
Activities with the Market + Corporation |
ITAÚ UNIBANCO |
Adjustments |
IFRS consolidated (3) |
| Operating revenues |
|
22,387 |
12,389 |
473 |
35,249 |
197 |
35,446 |
| Interest margin (1) |
|
13,499 |
8,558 |
581 |
22,638 |
(540) |
22,098 |
| Commissions and Banking Fees |
|
6,696 |
3,763 |
40 |
10,499 |
783 |
11,282 |
| Income from insurance and private pension operations before claim and selling expenses |
2,192 |
68 |
(148) |
2,112 |
(899) |
1,213 |
| Other revenues |
|
- |
- |
- |
- |
853 |
853 |
| Cost of Credit |
|
(7,479) |
(56) |
- |
(7,535) |
516 |
(7,019) |
| Claims |
|
(332) |
(5) |
- |
(337) |
337 |
- |
| Operating margin |
|
14,576 |
12,328 |
473 |
27,377 |
1,050 |
28,427 |
| Other operating income / (expenses) |
|
(10,803) |
(4,696) |
(66) |
(15,565) |
(2,970) |
(18,535) |
| Non-interest expenses (2) |
|
(9,236) |
(4,036) |
(42) |
(13,314) |
(3,095) |
(16,409) |
| Tax expenses for ISS, PIS and COFINS and Other |
|
(1,567) |
(660) |
(24) |
(2,251) |
(6) |
(2,257) |
| Share of profit or (loss) in associates and joint ventures |
- |
- |
- |
- |
131 |
131 |
| Income before income tax and social contribution |
3,773 |
7,632 |
407 |
11,812 |
(1,920) |
9,892 |
| Income tax and social contribution |
|
(1,111) |
(2,627) |
(72) |
(3,810) |
1,528 |
(2,282) |
| Non-controlling interests |
|
8 |
(264) |
(67) |
(323) |
11 |
(312) |
| Net income |
|
2,670 |
4,741 |
268 |
7,679 |
(381) |
7,298 |
| |
|
|
|
|
|
|
|
| 12/31/2022 |
Total assets (*) - |
1,524,983 |
1,175,209 |
171,983 |
2,469,958 |
(148,892) |
2,321,066 |
| Total liabilities - |
1,455,227 |
1,102,834 |
144,379 |
2,300,224 |
(156,265) |
2,143,959 |
| (*) Includes: |
|
|
|
|
|
|
| Investments in associates and joint ventures |
|
2,114 |
- |
4,798 |
6,912 |
531 |
7,443 |
| Fixed assets, net |
|
5,781 |
1,282 |
- |
7,063 |
704 |
7,767 |
| Goodwill and Intangible assets, net |
|
8,660 |
9,062 |
- |
17,722 |
5,392 |
23,114 |
1) Includes interest and similar income and expenses of R$ 25,705, result of financial assets and liabilities at fair value through profit or loss of R$ 8,477 and foreign exchange results and exchange variations in foreign transactions of R$ (12,084).
2) Refers to general and administrative expenses including depreciation and amortization expenses of R$ (1,294).
3) The IFRS Consolidated figures do not represent the sum of all parties because there are intercompany transactions that were eliminated only in the consolidated statements. Segments are assessed by top management, net of income and expenses between related parties. |
| |
|
01/01 to 06/30/2023 |
| |
Retail Business |
Wholesale Business |
Activities with the Market + Corporation |
ITAÚ UNIBANCO |
Adjustments |
IFRS consolidated (3) |
| Operating revenues |
47,644 |
26,466 |
2,167 |
76,277 |
(104) |
76,173 |
| Interest margin (1) |
29,315 |
19,418 |
1,957 |
50,690 |
(2,958) |
47,732 |
| Commissions and Banking Fees |
13,699 |
6,878 |
132 |
20,709 |
1,520 |
22,229 |
| Income from insurance and private pension operations before claim and selling expenses |
4,630 |
170 |
78 |
4,878 |
(1,447) |
3,431 |
| Other revenues |
- |
- |
- |
- |
2,781 |
2,781 |
| Cost of Credit |
(16,462) |
(2,067) |
- |
(18,529) |
2,500 |
(16,029) |
| Claims |
(761) |
(7) |
- |
(768) |
768 |
- |
| Operating margin |
30,421 |
24,392 |
2,167 |
56,980 |
3,164 |
60,144 |
| Other operating income / (expenses) |
(22,102) |
(9,983) |
(779) |
(32,864) |
(8,136) |
(41,000) |
| Non-interest expenses (2) |
(18,836) |
(8,665) |
(570) |
(28,071) |
(8,227) |
(36,298) |
| Tax expenses for ISS, PIS and COFINS and Other |
(3,266) |
(1,318) |
(209) |
(4,793) |
(301) |
(5,094) |
| Share of profit or (loss) in associates and joint ventures |
- |
- |
- |
- |
392 |
392 |
| Income before income tax and social contribution |
8,319 |
14,409 |
1,388 |
24,116 |
(4,972) |
19,144 |
| Income tax and social contribution |
(2,004) |
(4,247) |
(306) |
(6,557) |
3,876 |
(2,681) |
| Non-controlling interests |
(19) |
(370) |
7 |
(382) |
(107) |
(489) |
| Net income |
6,296 |
9,792 |
1,089 |
17,177 |
(1,203) |
15,974 |
| |
|
|
|
|
|
|
|
| 06/30/2023 |
Total assets (*) - |
1,597,790 |
1,212,708 |
171,309 |
2,585,768 |
(151,560) |
2,434,208 |
| Total liabilities - |
1,523,960 |
1,132,982 |
146,442 |
2,407,345 |
(162,078) |
2,245,267 |
| (*) Includes: |
|
|
|
|
|
|
| Investments in associates and joint ventures |
2,102 |
- |
4,852 |
6,954 |
926 |
7,880 |
| Fixed assets, net |
|
5,815 |
1,309 |
- |
7,124 |
814 |
7,938 |
| Goodwill and Intangible assets, net |
|
9,104 |
8,933 |
- |
18,037 |
5,884 |
23,921 |
1) Includes interest and similar income and expenses of R$ 29,973, result of financial assets and liabilities at fair value through profit or loss of R$ 11,917 and foreign exchange results and exchange variations in foreign transactions of R$ 5,842.
2) Refers to general and administrative expenses including depreciation and amortization expenses of R$ (3,324).
3) The IFRS Consolidated figures do not represent the sum of the parties because there are intercompany transactions that were eliminated only in the consolidated statements. Segments are assessed by top management, net of income and expenses between related parties. |
| |
|
01/01 to 06/30/2022 |
| |
Retail Business |
Wholesale Business |
Activities with the Market + Corporation |
ITAÚ UNIBANCO |
Adjustments |
IFRS consolidated (3) |
| Operating revenues |
|
43,550 |
23,072 |
1,662 |
68,284 |
1,727 |
70,011 |
| Interest margin (1) |
|
26,184 |
15,756 |
1,745 |
43,685 |
(353) |
43,332 |
| Commissions and Banking Fees |
|
13,126 |
7,074 |
70 |
20,270 |
1,688 |
21,958 |
| Income from insurance and private pension operations before claim and selling expenses |
4,240 |
242 |
(153) |
4,329 |
(1,871) |
2,458 |
| Other revenues |
|
- |
- |
- |
- |
2,263 |
2,263 |
| Cost of Credit |
|
(13,925) |
(577) |
- |
(14,502) |
1,267 |
(13,235) |
| Claims |
|
(719) |
(7) |
- |
(726) |
726 |
- |
| Operating margin |
|
28,906 |
22,488 |
1,662 |
53,056 |
3,720 |
56,776 |
| Other operating income / (expenses) |
|
(21,060) |
(9,192) |
(103) |
(30,355) |
(7,367) |
(37,722) |
| Non-interest expenses (2) |
|
(18,048) |
(7,992) |
(83) |
(26,123) |
(7,106) |
(33,229) |
| Tax expenses for ISS, PIS and COFINS and Other |
(3,012) |
(1,200) |
(20) |
(4,232) |
(557) |
(4,789) |
| Share of profit or (loss) in associates and joint ventures |
- |
- |
- |
- |
296 |
296 |
| Income before income tax and social contribution |
7,846 |
13,296 |
1,559 |
22,701 |
(3,647) |
19,054 |
| Income tax and social contribution |
|
(2,416) |
(4,398) |
(175) |
(6,989) |
2,497 |
(4,492) |
| Non-controlling interests |
(31) |
(502) |
(140) |
(673) |
77 |
(596) |
| Net income |
|
5,399 |
8,396 |
1,244 |
15,039 |
(1,073) |
13,966 |
| |
|
|
|
|
|
|
|
| 12/31/2022 |
Total assets (*) - |
1,524,983 |
1,175,209 |
171,983 |
2,469,958 |
(148,892) |
2,321,066 |
| Total liabilities - |
1,455,227 |
1,102,834 |
144,379 |
2,300,224 |
(156,265) |
2,143,959 |
| (*) Includes: |
|
|
|
|
|
|
|
| Investments in associates and joint ventures |
2,114 |
- |
4,798 |
6,912 |
531 |
7,443 |
| Fixed assets, net |
|
5,781 |
1,282 |
- |
7,063 |
704 |
7,767 |
| Goodwill and Intangible assets, net |
|
8,660 |
9,062 |
- |
17,722 |
5,392 |
23,114 |
1) Includes interest and similar income and expenses of R$ 38,102, result of financial assets and liabilities at fair value through profit or loss of R$ 4,879 and foreign exchange results and exchange variations in foreign transactions of R$ 351.
2) Refers to general and administrative expenses including depreciation and amortization expenses of R$ (2,696).
3) The IFRS Consolidated figures do not represent the sum of the parties because there are intercompany transactions that were eliminated only in the consolidated statements. Segments are assessed by top management, net of income and expenses between related parties. |
c) Result of Non-Current Assets and Main
Services and Products by Geographic Region
| |
06/30/2023 |
|
12/31/2022 |
| |
Brazil |
Abroad |
Total |
|
Brazil |
Abroad |
Total |
| Non-current assets |
25,812 |
6,047 |
31,859 |
|
24,808 |
6,073 |
30,881 |
| |
|
|
|
|
|
|
|
| - |
04/01 to 06/30/2023 |
|
04/01 to 06/30/2022 |
| - |
Brazil |
Abroad |
Total |
|
Brazil |
Abroad |
Total |
| Income related to financial operations (1,2) |
60,414 |
7,261 |
67,675 |
|
35,765 |
7,876 |
43,641 |
| Income from insurance contracts and private pension (3) |
1,698 |
- |
1,698 |
|
1,213 |
- |
1,213 |
| Comissions and Banking Fees |
10,019 |
1,155 |
11,174 |
|
10,196 |
1,086 |
11,282 |
| - |
|
|
|
|
|
|
|
| |
01/01 to 06/30/2023 |
|
01/01 to 06/30/2022 |
| |
Brazil |
Abroad |
Total |
|
Brazil |
Abroad |
Total |
| Income related to interest and similar (1,2,3) |
114,319 |
14,989 |
129,308 |
|
81,441 |
7,916 |
89,357 |
| Income from insurance contracts and private pension (3) |
3,431 |
- |
3,431 |
|
2,458 |
- |
2,458 |
| Commissions and Banking Fees (3) |
19,861 |
2,368 |
22,229 |
|
19,750 |
2,208 |
21,958 |
1) Includes interest and similar income, result of financial assets and liabilities at fair value through profit or loss and foreign exchange results and exchange variations in foreign transactions.
2) ITAÚ UNIBANCO HOLDING does not have customers representing 10% or higher of its revenues.
3) In "Brazil" geographic region the companies headquartered in the country and "Abroad" are considered; the other companies, the amounts consider the already eliminated values. |
Note 31 - Related parties
Transactions between related parties are carried out for
amounts, terms and average rates in accordance with normal market practices during the period, and under reciprocal conditions.
Transactions between companies and investment funds, included
in consolidation (Note 2d I), have been eliminated and do not affect the consolidated statements.
The principal unconsolidated related parties are as follows:
• Itaú
Unibanco Participações S.A. (IUPAR), Companhia E. Johnston de Participações S.A. (shareholder of IUPAR) and
ITAÚSA, direct and indirect shareholders of ITAÚ UNIBANCO HOLDING.
• The
associates, non-financial subsidiaries and joint ventures of ITAÚSA, in particular Dexco S.A., Copagaz – Distribuidora de
Gás S.A., Aegea Saneamento e Participações S.A., Águas do Rio 1 SPE S.A., Águas do Rio 4 SPE S.A.,
Alpargatas S.A., CCR S.A. and XP Inc. (Note 3).
• Investments
in associates and joint ventures, in particular Porto Seguro Itaú Unibanco Participações S.A., BSF Holding S.A. and
XP Inc. (Note 3).
• Pension
Plans: Fundação Itaú Unibanco – Previdência Complementar and FUNBEP – Fundo de Pensão Multipatrocinado,
closed-end supplementary pension entities, that administer retirement plans sponsored by ITAÚ UNIBANCO HOLDING, created exclusively
for employees.
• Associations:
Associação Cubo Coworking Itaú – a partner entity of ITAÚ UNIBANCO HOLDING its purpose is to encourage
and promote the discussion and development of alternative and innovative technologies, business models and solutions; to produce and disseminate
the resulting technical and scientific knowledge; to attract and bring in new information technology talents that may be characterized
as startups; and to research, develop and establish ecosystems for entrepreneur and startups.
• Foundations
and Institutes maintained by donations from ITAÚ UNIBANCO HOLDING and by the proceeds generated by their assets, so that they
can accomplish their objectives and to maintain their operational and administrative structure:
Fundação Itaú para a Educação
e Cultura – promotes education, culture, social assistance, defense and guarantee of rights, and strengthening of civil society.
Instituto Unibanco – supports projects
focused on social assistance, particularly education, culture, promotion of integration into the labor market, and environmental protection,
directly or as a supplement to civil institutions.
Instituto Unibanco de Cinema – promotes
culture in general and provides access of low-income population to cinematography, videography and similar productions, for which it should
maintain movie theaters and movie clubs owned or managed by itself to screen films, videos and video-laser discs it owns and other
related activities, as well as to screen and disseminate movies in general, especially those produced in Brazil.
Associação Itaú Viver Mais
– provides social services for the welfare of beneficiaries, on the terms defined in its Internal Regulations, and according to
the funds available. These services may include the promotion of cultural, educational, sports, entertainment and healthcare activities.
a) Transactions with related parties:
| |
Annual rate |
Assets / (Liabilities) |
|
Revenues / (Expenses) |
| |
06/30/2023 |
12/31/2022 |
|
04/01 to 06/30/2023 |
04/01 to 06/30/2022 |
01/01 to 06/30/2023 |
01/01 to 06/30/2022 |
| Interbank investments |
|
1,834 |
3,835 |
|
1 |
61 |
1 |
121 |
| Other |
13.65% |
1,834 |
3,835 |
|
1 |
61 |
1 |
121 |
| Loan operations |
|
57 |
668 |
|
- |
19 |
19 |
34 |
| Alpargatas S.A. |
1.14% to 6% |
14 |
28 |
|
- |
- |
- |
- |
| Dexco S.A. |
1.28% to 19.61% |
30 |
623 |
|
- |
19 |
19 |
34 |
| Other |
1.52% to 18.93% |
13 |
17 |
|
- |
- |
- |
- |
| Securities and derivative financial instruments (assets and liabilities) |
|
5,638 |
6,013 |
|
205 |
165 |
371 |
375 |
| Investment funds |
|
211 |
230 |
|
7 |
11 |
17 |
22 |
| CCR S.A. |
CDI + 1.2% / 9.76% |
1,852 |
2,138 |
|
73 |
- |
105 |
- |
| Copagaz – Distribuidora de Gás S.A. |
CDI + 1.7% to 2.95% |
945 |
1,024 |
|
28 |
37 |
65 |
68 |
| Itaúsa S.A. |
CDI + 2% to 2.4% |
1,197 |
1,199 |
|
44 |
40 |
88 |
76 |
| Águas do Rio 4 SPE S.A. |
CDI + 3.5% |
704 |
706 |
|
39 |
10 |
65 |
99 |
| Águas do Rio 1 SPE S.A. |
CDI + 3.5% |
270 |
272 |
|
10 |
12 |
21 |
28 |
| Aegea Saneamento e Participações S.A. |
CDI + 1.8% / 16.76% |
69 |
306 |
|
1 |
55 |
2 |
82 |
| Other |
CDI + 1.35% to 1.71% |
390 |
138 |
|
3 |
- |
8 |
- |
| Deposits |
|
(2,269) |
(2,491) |
|
(22) |
(1) |
(87) |
(3) |
| CCR S.A. |
98% to 102.5% CDI |
(1,453) |
(2,026) |
|
(19) |
- |
(68) |
- |
| Aegea Saneamento e Participações S.A. |
100% CDI |
(427) |
(11) |
|
(1) |
- |
(2) |
- |
| Other |
75% to 101% CDI |
(389) |
(454) |
|
(2) |
(1) |
(17) |
(3) |
| Deposits received under securities repurchase agreements |
|
(732) |
(19) |
|
(17) |
(8) |
(18) |
(27) |
| CCR S.A. |
100% CDI |
(125) |
- |
|
- |
- |
(1) |
- |
| Other |
13.55% |
(607) |
(19) |
|
(17) |
(8) |
(17) |
(27) |
| Funds from acceptances and issuance of securities |
|
(35) |
(49) |
|
- |
- |
(4) |
- |
| Copagaz – Distribuidora de Gás S.A. |
100% CDI |
(27) |
(49) |
|
- |
- |
(3) |
- |
| Other |
100% CDI |
(8) |
- |
|
- |
- |
(1) |
- |
| Amounts receivable (payable) / Commissions and/or Other General and Administrative expenses |
|
(590) |
(136) |
|
(24) |
(11) |
(63) |
(20) |
| Fundação Itaú Unibanco - Previdência Complementar |
|
(104) |
(81) |
|
8 |
7 |
17 |
15 |
| Olímpia Promoção e Serviços S.A. |
|
(4) |
(4) |
|
(15) |
(16) |
(27) |
(30) |
| FUNBEP - Fundo de Pensão Multipatrocinado |
|
(829) |
(196) |
|
(21) |
(6) |
(48) |
(14) |
| Other |
|
347 |
145 |
|
4 |
4 |
(5) |
9 |
| Rent |
|
- |
- |
|
(8) |
(7) |
(16) |
(16) |
| Fundação Itaú Unibanco - Previdência Complementar |
|
- |
- |
|
(7) |
(7) |
(15) |
(15) |
| FUNBEP - Fundo de Pensão Multipatrocinado |
|
- |
- |
|
(1) |
- |
(1) |
(1) |
| Sponsorship |
|
19 |
28 |
|
(4) |
(8) |
(9) |
(12) |
| Associação Cubo Coworking Itaú |
|
19 |
28 |
|
(4) |
(8) |
(9) |
(12) |
Operations with Key Management Personnel of ITAÚ
UNIBANCO HOLDING present Assets of R$ 174, Liabilities of R$ (6,907) and Results of R$ (60) (R$ 162, R$ (6,427) at 12/31/2022 and R$
(1) from 01/01 to 06/30/2022, respectively).
b) Compensation and Benefits of Key Management
Personnel
| Compensation and benefits attributed to Managers Members, members of the Audit Committee and the Board of Directors of ITAÚ UNIBANCO HOLDING in the period correspond to: |
| |
04/01 to
06/30/2023 |
04/01 to
06/30/2022 |
01/01 to
06/30/2023 |
01/01 to
06/30/2022 |
| Fees |
(160) |
(149) |
(377) |
(320) |
| Profit sharing |
(80) |
(55) |
(139) |
(121) |
| Post-employment benefits |
- |
(1) |
(4) |
(4) |
| Share-based payment plan |
(56) |
(47) |
(78) |
(42) |
| Total |
(296) |
(252) |
(598) |
(487) |
Total amount related to share-based payment plans, personnel
expenses and post-employment benefits is detailed in Notes 20, 23 and 26, respectively.
Note 32 - Risk and Capital Management
a) Corporate Governance
ITAÚ UNIBANCO HOLDING invests in robust risk
management processes and capital management that are the basis for its strategic decisions to ensure business sustainability and maximize
shareholder value creation.
These processes are aligned with the guidelines of the Board
of Directors and Executive which, through collegiate bodies, define the global objectives expressed as targets and limits for the business
units that manage risk. Control and capital management units, in turn, support ITAÚ UNIBANCO HOLDING’s management by
monitoring and analyzing risk and capital.
The Board of Directors is the main body responsible for establishing
guidelines, policies and approval levels for risk and capital management. The Capital and Risk Management Committee (CGRC), in turn, is
responsible for supporting the Board of Directors in managing capital and risk. At the executive level, collegiate bodies, presided over
by the Chief Executive Officer (CEO) of ITAÚ UNIBANCO HOLDING, are responsible for capital and risk management, and their
decisions are monitored by the CGRC.
Additionally, ITAÚ UNIBANCO HOLDING has collegiate
bodies with capital and risk management responsibilities delegated to them, under the responsibility of the CRO (Chief Risk Officer).
To support this structure, the Risk Department has departments to ensure, on an independent and centralized basis, that the institution’s
risks and capital are managed in compliance with the defined policies and procedures.
ITAÚ UNIBANCO HOLDING's management model is made up
of:
•
1st line of defense: business areas, which have primary responsibility for managing the risk they originate.
•
2nd line of defense: risk area, which ensures that risks are managed and are supported by risk management principles (risk appetite, policies,
procedures and dissemination of the risk culture in the business).
• 3rd
line of defense: internal audit, which is linked to the Board of Directors and makes an independent assessment of the activities developed
by the other areas.
b) Risk Management
Risk Appetite
The risk appetite of ITAÚ UNIBANCO HOLDING is
based on the Board of Director’s statement:
“We are a universal bank, operating predominantly
in Latin America. Supported by our risk culture, we operate based on rigorous ethical and regulatory compliance standards, seeking high
and growing results, with low volatility, by means of the long-lasting relationship with clients, correctly pricing risks, well-distributed
fund-raising and proper use of capital.”
Based on this statement, six dimensions have been defined,
each dimension consists of a set of metrics associated with the main risks involved, combining supplementary measurement methods, to give
a comprehensive vision of our exposure.
The Board of Directors is responsible for approving guidelines
and limits for risk appetite, with the support of CGRC and the CRO.
The limits for risk appetite are monitored regularly and
reported to risk committees and to the Board of Directors, which will oversee the preventive measures to be taken to ensure that exposure
is aligned with the strategies of ITAÚ UNIBANCO HOLDING.
Foremost among processes for proper risk and capital management
are the Risk Appetite Statement (RAS) and the implementation of a continuous, integrated risk management structure, the stress test program,
the establishment of a Risk Committee, and the nomination at BACEN of a Chief Risk Officer (CRO), with roles and responsibilities assigned,
and requirements for independence.
The six dimensions of risk appetite are:
• Capitalization: establishes
that ITAÚ UNIBANCO HOLDING must have capital sufficient to face any serious recession period or a stress event without
the need to adjust its capital structure under unfavorable circumstances. It is monitored by tracking ITAÚ UNIBANCO HOLDING’s
capital ratios, both in normal and stress scenarios, and of the ratings of the institution's debt issues.
• Liquidity:
establishes that the liquidity of ITAÚ UNIBANCO HOLDING must withstand long periods of stress. It is monitored by tracking
liquidity indicators.
• Composition
of results: establishes that business will mainly focus on Latin America, where Itaú Unibanco will have a diversified range
of customers and products, with low appetite for results volatility and high risk. This dimension includes business and profitability,
as well as market risk and IRRBB, underwriting and credit risk, including social, environmental and climate dimensions. The metrics monitored
by the bank seek to ensure, by means of exposure concentration limits such as, for example, industry sectors, quality of counterparties,
countries and geographic regions and risk factors, a suitable composition of the bank’s portfolios, aiming at low volatility of
results and business sustainability.
• Operational
risk: focuses on the control of operating risk events that may adversely impact business and operating strategy, and involves
monitoring the main operational risk events and losses incurred.
• Reputation: addresses
risks that may impact the institution’s brand value and reputation with customers, employees, regulatory bodies, investors and the
general public. The risk monitoring in this dimension is carried in addition to monitoring the institution’s conduct.
• Customer:
addresses risks that may compromise customer satisfaction and experience, and is monitored by tracking customer satisfaction, direct impacts
on customers and suitability indicators.
Risk appetite, risk management and guidelines for employees
of ITAÚ UNIBANCO HOLDING for routine decision-making purposes are based on:
• Sustainability
and customer satisfaction: ITAÚ UNIBANCO HOLDING's vision is to be the leading bank in sustainable performance and customer
satisfaction and, accordingly, it is committed to creating shared value for staff, customers, stockholders and society, ensuring the continuity
of the business. ITAÚ UNIBANCO HOLDING is committed to doing business that is good both for the customer and the institution itself.
• Risk
culture: ITAÚ UNIBANCO HOLDING’s risk culture goes beyond policies, procedures or processes, reinforcing the individual
and collective responsibility of all employees so that they will do the right thing at the right time and in the proper manner, respecting
the ethical way of doing business.
• Risk
pricing: ITAÚ UNIBANCO HOLDING ’s operates and assumes risks in businesses that it knows and understands, avoids
the ones that are unknown or that do not provide competitive advantages, and carefully assesses risk-return ratios.
• Diversification: ITAÚ
UNIBANCO HOLDING has little appetite for volatility in earnings, and it therefore operates with a diverse base of customers, products
and business, seeking to diversify risks and giving priority to lower risk business.
• Operational
excellence: It is the wish of ITAÚ UNIBANCO HOLDING to be an agile bank, with a robust and stable infrastructure enabling
us to offer top quality services.
• Ethics
and respect for regulations: for ITAÚ UNIBANCO HOLDING, ethics is non-negotiable, and it therefore promotes an institutional
environment of integrity, encouraging staff to cultivate ethics in relationships and business and to respect the rules, thus caring for
the institution’s reputation.
ITAÚ UNIBANCO HOLDING has various ways of disseminating
risk culture, based on four principles: conscious risk-taking, discussion of the risks the institution faces, the corresponding action
taken, and the responsibility of everyone for managing risk.
These principles serve as a basis for ITAÚ UNIBANCO
HOLDING guidelines, helping employees to conscientiously understand, identify, measure, manage and mitigate risks.
I - Credit risk
The possibility of losses arising from failure by a borrower,
issuer or counterparty to meet their financial obligations, the impairment of a loan due to downgrading of the risk rating of the borrower,
the issuer or the counterparty, a decrease in earnings or remuneration, advantages conceded on renegotiation or the costs of recovery.
There is a credit risk control and management structure,
centralized and independent from the business units, that provides for operating limits and risk mitigation mechanisms, and also establishes
processes and tools to measure, monitor and control the credit risk inherent in all products, portfolio concentrations and impacts of
potential changes in the economic environment.
The credit policy of ITAÚ UNIBANCO HOLDING is
based on internal criteria such as: classification of customers, portfolio performance and changes, default levels, rate of return and
economic capital allocated, among others, and also take into account external factors such as interest rates, market default indicators,
inflation, changes in consumption, and so on.
For personal customers and small and middle-market companies,
credit rating is based on statistical application models (at the early stages of the relationship with a customer) and behavior score
(used for customers with which ITAÚ UNIBANCO HOLDING already has a relationship).
For large companies, the rating is based on information such
as economic and financial condition of the counterparty, their cash-generating capability, the economic group to which they belong, and
the current and prospective situation of the economic sector in which they operate, in accordance with the guidelines of the Sustainability
and Social and Environmental Responsibility Policy (PRSA) and specific manuals and procedures of ITAÚ UNIBANCO HOLDING. Credit
proposals are analyzed on a case by case basis, through an approval-level mechanism.
ITAÚ UNIBANCO HOLDING strictly controls the credit
exposure of customers and counterparties, taking action to address situations in which the current exposure exceeds what is desirable.
For this purpose, measures provided for in loan agreements are available, such as accelerated maturity or a requirement for additional
collateral.
I.I - Collateral and policies for mitigating credit risk
ITAÚ UNIBANCO HOLDING uses guarantees to increase
its capacity for recovery in operations exposed to credit risk. The guarantees may be personal, secured, legal structures with mitigating
power and offset agreements.
For collateral to be considered instruments that mitigate
credit risk, it must comply with the requirements and standards that regulate such instruments, both internal and external ones, and they
must be legally valid (effective), enforceable, and assessed on a regular basis.
ITAÚ UNIBANCO HOLDING also uses credit derivatives,
to mitigate credit risk of its portfolios of loans and securities. These instruments are priced based on models that use the fair value
of market inputs, such as credit spreads, recovery rates, correlations and interest rates.
I.II - Policy for Provisioning and Economic Scenarios
Both the credit risk and the finance areas are responsible
for defining the methods used to measure expected loan losses and for periodically assessing changes in the provision amounts.
These areas monitor the trends observed in provisions for
expected credit losses by segment, in addition to establishing an initial understanding of the variables that may trigger changes in the
allowance for loan losses, the probability of default (PD) or the loss given default (LGD).
Once the trends have been identified and an initial assessment
of the variables has been made at the corporate level, the business areas are responsible for further analyzing these trends in more detail
and for each segment, in order to understand the underlying reasons for the trends and to decide whether changes are required in credit
policies.
Provisions for expected losses take into account the expected
risk linked to contracts with similar characteristics and in anticipation of signs of deterioration, over a loss horizon suitable for
the remaining period of the contract to maturity. For contracts of products with no determined termination date, average results of deterioration
and default are used to determine the loss horizon.
Additionally, information on economic scenarios and public
data with internal projections are used to determine and adjust the expected credit loss in line with expected macroeconomic realities.
| |
|
|
|
|
|
|
|
|
|
| Sensitivity analysis |
| ITAÚ UNIBANCO HOLDING prepares studies on the impact of estimates in the calculation of expected credit loss. The expected loss models use three different scenarios: Optimistic, Base and Pessimistic. In Brazil, where operations are substantially carried out, these scenarios are combined by weighting their probabilities: 10%, 50% and 40%, respectively, which are updated so as to reflect the new economic conditions. For loan portfolios originated in other countries, the scenarios are weighted by different probabilities, considering regional economic aspects and conditions. |
| The table below shows the amount of financial assets at amortized cost and at fair value through other comprehensive income, expected loss and the impacts on the calculation of expected credit loss in the adoption of 100% of each scenario: |
| 06/30/2023 |
|
12/31/2022 |
| Financial Assets
(1) |
Expected Loss
(2) |
Reduction/(Increase)
of Expected Loss |
|
Financial Assets
(1) |
Expected Loss
(2) |
Reduction/(Increase)
of Expected Loss |
| Pessimistic scenario |
Base scenario |
Optimistic scenario |
|
Pessimistic scenario |
Base scenario |
Optimistic scenario |
| 1,275,050 |
(55,937) |
(388) |
142 |
447 |
|
1,256,752 |
(54,476) |
(530) |
198 |
530 |
1) Composed of Loan operations, lease operations
and securities.
2) Comprises expected credit loss for Financial Guarantees R$ (778) (R$ (810) at 12/31/2022) and Loan Commitments R$ (3,094) (R$
(2,874) at 12/31/2022). |
I.III - Classification of Stages of Credit Impairment
ITAÚ UNIBANCO HOLDING uses customers’ internal
information, statistic models, days of default and quantitative analysis in order to determine the credit status of portfolio agreements.
Rules for changing stages take into account:
• Stage
1 to stage 2: delay or evaluation of probability of default (PD) triggers.
For Retail market portfolios, ITAÚ UNIBANCO HOLDING classifies
loan agreements which are over 30 days overdue in stage 2, except payroll loans for government agency, for which the figure is 45 days, due
to the dynamics of payment for transfer of the product. For agreements with delay less than 30 days, the migration to stage 2 occurs
if the financial asset exceeds the allowance for loan losses established by the risk appetite approved by ITAÚ UNIBANCO HOLDING’s
Management for each portfolio, whereas the others remain in stage 1.
For the Wholesale business portfolio, information on arrears
is taken into account when assessing the counterparty rating.
• Stage
3: default parameters are used to identify stage 3: 90 days without payment noted, except for the mortgage loan portfolio, which are
considered 180 days; debt restructuring; filing for bankruptcy; loss; and court-supervised recovery. The financial asset, at any stage,
can migrate to stage 3 when showing default parameters.
Information on days of delay, used on an absolute basis,
is one important factor for the classification of stages, and after a certain credit status has been defined for an agreement, it is classified
in one of the three stages of credit deterioration. Based on this classification, rules for measuring expected credit loss in each stage
are used, as described in Note 2d IV.
| I.IV - Maximum Exposure of Financial Assets to Credit Risk |
| |
06/30/2023 |
|
12/31/2022 |
| |
Brazil |
Abroad |
Total |
|
Brazil |
Abroad |
Total |
| Financial Assets |
1,661,729 |
483,193 |
2,144,922 |
|
1,543,194 |
511,277 |
2,054,471 |
| At Amortized Cost |
1,138,013 |
331,488 |
1,469,501 |
|
1,112,594 |
350,447 |
1,463,041 |
| Interbank deposits |
19,042 |
34,284 |
53,326 |
|
18,955 |
40,637 |
59,592 |
| Securities purchased under agreements to resell |
214,981 |
1,978 |
216,959 |
|
218,339 |
3,440 |
221,779 |
| Securities |
210,297 |
25,714 |
236,011 |
|
185,658 |
27,368 |
213,026 |
| Loan and lease operations |
641,595 |
259,590 |
901,185 |
|
636,836 |
272,586 |
909,422 |
| Other financial assets |
96,983 |
16,974 |
113,957 |
|
96,081 |
13,828 |
109,909 |
| (-) Provision for Expected Loss |
(44,885) |
(7,052) |
(51,937) |
|
(43,275) |
(7,412) |
(50,687) |
| At Fair Value Through Other Comprehensive Income |
52,164 |
82,183 |
134,347 |
|
54,134 |
72,614 |
126,748 |
| Securities |
52,164 |
82,183 |
134,347 |
|
54,134 |
72,614 |
126,748 |
| At Fair Value Through Profit or Loss |
471,552 |
69,522 |
541,074 |
|
376,466 |
88,216 |
464,682 |
| Securities |
448,322 |
18,245 |
466,567 |
|
364,039 |
21,060 |
385,099 |
| Derivatives |
21,568 |
51,277 |
72,845 |
|
11,052 |
67,156 |
78,208 |
| Other financial assets |
1,662 |
- |
1,662 |
|
1,375 |
- |
1,375 |
| Financial liabilities - provision for expected loss |
3,265 |
607 |
3,872 |
|
3,040 |
644 |
3,684 |
| Loan Commitments |
2,839 |
255 |
3,094 |
|
2,622 |
252 |
2,874 |
| Financial Guarantees |
426 |
352 |
778 |
|
418 |
392 |
810 |
| Off balance sheet |
473,184 |
69,880 |
543,064 |
|
472,372 |
72,005 |
544,377 |
| Financial Guarantees |
73,955 |
19,950 |
93,905 |
|
71,524 |
20,255 |
91,779 |
| Letters of credit to be released |
32,164 |
- |
32,164 |
|
47,354 |
- |
47,354 |
| Loan commitments |
367,065 |
49,930 |
416,995 |
|
353,494 |
51,750 |
405,244 |
| Mortgage loans |
13,384 |
- |
13,384 |
|
15,423 |
- |
15,423 |
| Overdraft accounts |
162,296 |
- |
162,296 |
|
157,408 |
- |
157,408 |
| Credit cards |
188,318 |
3,394 |
191,712 |
|
177,658 |
3,754 |
181,412 |
| Other pre-approved limits |
3,067 |
46,536 |
49,603 |
|
3,005 |
47,996 |
51,001 |
| Total |
2,131,648 |
552,466 |
2,684,114 |
|
2,012,526 |
582,638 |
2,595,164 |
| Amounts shown for credit risk exposure are based on gross book value and do not take into account any collateral received or other added credit improvements. |
| The contractual amounts of financial guarantees and letters of credit cards represent the maximum potential of credit risk in the event that a counterparty does not meet the terms of the agreement. The vast majority of loan commitments (mortgage loans, overdraft accounts and other pre-approved limits) mature without being drawn, since they are renewed monthly and can be cancelled unilaterally. |
| As a result, the total contractual amount does not represent our real future exposure to credit risk or the liquidity needs arising from such commitments. |
| I.IV.I - By business sector |
|
|
|
|
| Loans and Financial Lease Operations |
|
|
|
|
| |
06/30/2023 |
% |
12/31/2022 |
% |
| Industry and commerce |
190,328 |
21.1% |
197,351 |
21.7% |
| Services |
176,652 |
19.6% |
177,180 |
19.5% |
| Other sectors |
37,254 |
4.1% |
37,072 |
4.1% |
| Individuals |
496,951 |
55.2% |
497,819 |
54.7% |
| Total |
901,185 |
100.0% |
909,422 |
100.0% |
| Other financial assets (1) |
| |
|
|
|
|
| |
06/30/2023 |
% |
12/31/2022 |
% |
| Public sector |
746,789 |
63.3% |
691,371 |
63.8% |
| Services |
168,265 |
14.3% |
167,176 |
15.4% |
| Other sectors |
129,038 |
10.9% |
119,436 |
11.0% |
| Financial |
135,963 |
11.5% |
106,469 |
9.8% |
| Total |
1,180,055 |
100.0% |
1,084,452 |
100.0% |
| 1) Includes Financial Assets at Fair Value through Profit and Loss, Financial Assets at Fair Value through Other Comprehensive Income and Financial Assets at Amortized Cost, except for Loan and Lease Operations and Other Financial Assets. |
| |
|
|
|
|
| The exposure of Off Balance financial instruments (Financial Collaterals and Loan Commitments) is neither categorized nor managed by business sector. |
| I.IV.II - By type and classification of credit risk |
| Loan and lease operations |
| |
|
06/30/2023 |
| |
|
Stage 1 |
|
Stage 2 |
|
Stage 3 |
|
Total Consolidated of 3 Stages |
| |
|
Loan Operations |
Loan commitments |
Financial Guarantees |
Total |
|
Loan Operations |
Loan commitments |
Financial Guarantees |
Total |
|
Loan Operations |
Loan commitments |
Financial Guarantees |
Total |
|
Loan Operations |
Loan commitments |
Financial Guarantees |
Total |
| Individuals |
308,590 |
245,636 |
453 |
554,679 |
|
60,565 |
8,501 |
- |
69,066 |
|
37,793 |
186 |
- |
37,979 |
|
406,948 |
254,323 |
453 |
661,724 |
| Corporate |
128,031 |
26,212 |
63,042 |
217,285 |
|
992 |
40 |
607 |
1,639 |
|
4,994 |
28 |
2,565 |
7,587 |
|
134,017 |
26,280 |
66,214 |
226,511 |
| Micro/Small and medium companies |
136,679 |
89,253 |
8,855 |
234,787 |
|
13,960 |
1,128 |
55 |
15,143 |
|
10,893 |
150 |
176 |
11,219 |
|
161,532 |
90,531 |
9,086 |
261,149 |
| Foreign loans - Latin America |
176,343 |
44,053 |
16,851 |
237,247 |
|
12,994 |
1,688 |
1,209 |
15,891 |
|
9,351 |
120 |
92 |
9,563 |
|
198,688 |
45,861 |
18,152 |
262,701 |
| Total |
749,643 |
405,154 |
89,201 |
1,243,998 |
|
88,511 |
11,357 |
1,871 |
101,739 |
|
63,031 |
484 |
2,833 |
66,348 |
|
901,185 |
416,995 |
93,905 |
1,412,085 |
| % |
60.2% |
32.6% |
7.2% |
100.0% |
|
87.0% |
11.2% |
1.8% |
100.0% |
|
95.0% |
0.7% |
4.3% |
100.0% |
|
63.8% |
29.5% |
6.7% |
100.0% |
| |
|
|
|
|
|
|
|
|
|
|
|
|
|
|
|
|
|
|
|
|
| |
|
12/31/2022 |
| |
|
Stage 1 |
|
Stage 2 |
|
Stage 3 |
|
Total Consolidated of 3 Stages |
| |
|
Loan Operations |
Loan commitments |
Financial Guarantees |
Total |
|
Loan Operations |
Loan commitments |
Financial Guarantees |
Total |
|
Loan Operations |
Loan commitments |
Financial Guarantees |
Total |
|
Loan Operations |
Loan commitments |
Financial Guarantees |
Total |
| Individuals |
305,210 |
233,996 |
511 |
539,717 |
|
59,639 |
8,538 |
1 |
68,178 |
|
35,254 |
226 |
- |
35,480 |
|
400,103 |
242,760 |
512 |
643,375 |
| Corporate |
133,205 |
29,853 |
60,209 |
223,267 |
|
901 |
32 |
444 |
1,377 |
|
5,162 |
11 |
2,551 |
7,724 |
|
139,268 |
29,896 |
63,204 |
232,368 |
| Micro/Small and medium companies |
142,621 |
84,619 |
9,520 |
236,760 |
|
12,299 |
1,494 |
115 |
13,908 |
|
9,976 |
265 |
123 |
10,364 |
|
164,896 |
86,378 |
9,758 |
261,032 |
| Foreign loans - Latin America |
182,516 |
44,542 |
16,912 |
243,970 |
|
13,863 |
1,544 |
1,279 |
16,686 |
|
8,776 |
124 |
114 |
9,014 |
|
205,155 |
46,210 |
18,305 |
269,670 |
| Total |
763,552 |
393,010 |
87,152 |
1,243,714 |
|
86,702 |
11,608 |
1,839 |
100,149 |
|
59,168 |
626 |
2,788 |
62,582 |
|
909,422 |
405,244 |
91,779 |
1,406,445 |
| % |
61.4% |
31.6% |
7.0% |
100.0% |
|
86.6% |
11.6% |
1.8% |
100.0% |
|
94.5% |
1.0% |
4.5% |
100.0% |
|
64.7% |
28.8% |
6.5% |
100.0% |
| Internal rating |
06/30/2023 |
|
12/31/2022 |
| Stage 1 |
Stage 2 |
Stage 3 |
Total loan operations |
|
Stage 1 |
Stage 2 |
Stage 3 |
Total loan operations |
| Low |
698,298 |
63,323 |
- |
761,621 |
|
705,625 |
62,501 |
- |
768,126 |
| Medium |
51,149 |
13,410 |
- |
64,559 |
|
57,508 |
14,095 |
- |
71,603 |
| High |
196 |
11,778 |
- |
11,974 |
|
419 |
10,106 |
- |
10,525 |
| Credit-Impaired |
- |
- |
63,031 |
63,031 |
|
- |
- |
59,168 |
59,168 |
| Total |
749,643 |
88,511 |
63,031 |
901,185 |
|
763,552 |
86,702 |
59,168 |
909,422 |
| % |
83.2% |
9.8% |
7.0% |
100.0% |
|
84.0% |
9.5% |
6.5% |
100.0% |
| Other financial assets |
| |
06/30/2023 |
| |
Fair value |
|
Stage 1 |
|
Stage 2 |
|
Stage 3 |
| |
Cost |
Fair value |
|
Cost |
Fair value |
|
Cost |
Fair value |
| Investment funds |
23,408 |
|
23,721 |
23,259 |
|
90 |
90 |
|
59 |
59 |
| Government securities |
570,340 |
|
570,851 |
570,340 |
|
- |
- |
|
- |
- |
| Brazilian government |
473,244 |
|
473,525 |
473,244 |
|
- |
- |
|
- |
- |
| Other Public |
- |
|
36 |
- |
|
- |
- |
|
- |
- |
| Abroad |
97,096 |
|
97,290 |
97,096 |
|
- |
- |
|
- |
- |
| Argentina |
3,301 |
|
3,353 |
3,301 |
|
- |
- |
|
- |
- |
| United States |
10,972 |
|
11,121 |
10,972 |
|
- |
- |
|
- |
- |
| Israel |
460 |
|
456 |
460 |
|
- |
- |
|
- |
- |
| Mexico |
12,989 |
|
12,996 |
12,989 |
|
- |
- |
|
- |
- |
| Spain |
9,956 |
|
9,957 |
9,956 |
|
- |
- |
|
- |
- |
| Korea |
10,766 |
|
10,766 |
10,766 |
|
- |
- |
|
- |
- |
| Chile |
34,306 |
|
34,334 |
34,306 |
|
- |
- |
|
- |
- |
| Paraguay |
3,795 |
|
3,775 |
3,795 |
|
- |
- |
|
- |
- |
| Uruguay |
3,719 |
|
3,715 |
3,719 |
|
- |
- |
|
- |
- |
| Colombia |
3,702 |
|
3,687 |
3,702 |
|
- |
- |
|
- |
- |
| Peru |
5 |
|
6 |
5 |
|
- |
- |
|
- |
- |
| Czech Republic |
1,725 |
|
1,725 |
1,725 |
|
- |
- |
|
- |
- |
| Switzerland |
1,400 |
|
1,399 |
1,400 |
|
- |
- |
|
- |
- |
| Corporate securities |
241,434 |
|
242,926 |
238,340 |
|
3,900 |
2,630 |
|
2,076 |
464 |
| Rural product note |
39,997 |
|
39,567 |
39,427 |
|
434 |
412 |
|
210 |
158 |
| Real estate receivables certificates |
6,970 |
|
7,058 |
6,970 |
|
- |
- |
|
- |
- |
| Bank deposit certificate |
328 |
|
317 |
317 |
|
11 |
11 |
|
8 |
- |
| Debentures |
120,787 |
|
121,042 |
118,994 |
|
2,645 |
1,513 |
|
1,714 |
280 |
| Eurobonds and other |
6,798 |
|
6,915 |
6,789 |
|
4 |
4 |
|
23 |
5 |
| Financial bills |
19,613 |
|
19,608 |
19,608 |
|
5 |
5 |
|
- |
- |
| Promissory and commercial notes |
12,028 |
|
12,069 |
12,028 |
|
- |
- |
|
- |
- |
| Other |
34,913 |
|
36,350 |
34,207 |
|
801 |
685 |
|
121 |
21 |
| Total |
835,182 |
|
837,498 |
831,939 |
|
3,990 |
2,720 |
|
2,135 |
523 |
| |
12/31/2022 |
| |
Fair value |
|
Stage 1 |
|
Stage 2 |
|
Stage 3 |
| |
Cost |
Fair value |
|
Cost |
Fair value |
|
Cost |
Fair value |
| Investment funds |
32,491 |
|
27,660 |
27,140 |
|
5,259 |
5,259 |
|
92 |
92 |
| Government securities |
479,241 |
|
483,477 |
479,241 |
|
- |
- |
|
- |
- |
| Brazilian government |
394,082 |
|
397,794 |
394,082 |
|
- |
- |
|
- |
- |
| Other Public |
- |
|
36 |
- |
|
- |
- |
|
- |
- |
| Abroad |
85,159 |
|
85,647 |
85,159 |
|
- |
- |
|
- |
- |
| Argentina |
3,453 |
|
3,460 |
3,453 |
|
- |
- |
|
- |
- |
| United States |
9,665 |
|
9,716 |
9,665 |
|
- |
- |
|
- |
- |
| Mexico |
14,010 |
|
14,021 |
14,010 |
|
- |
- |
|
- |
- |
| Spain |
9,922 |
|
9,924 |
9,922 |
|
- |
- |
|
- |
- |
| Korea |
10,363 |
|
10,365 |
10,363 |
|
- |
- |
|
- |
- |
| Chile |
24,681 |
|
24,811 |
24,681 |
|
- |
- |
|
- |
- |
| Paraguay |
3,463 |
|
3,461 |
3,463 |
|
- |
- |
|
- |
- |
| Uruguay |
1,182 |
|
1,185 |
1,182 |
|
- |
- |
|
- |
- |
| Colombia |
3,151 |
|
3,430 |
3,151 |
|
- |
- |
|
- |
- |
| Peru |
6 |
|
7 |
6 |
|
- |
- |
|
- |
- |
| Israel |
860 |
|
852 |
860 |
|
- |
- |
|
- |
- |
| Switzerland |
4,403 |
|
4,415 |
4,403 |
|
- |
- |
|
- |
- |
| Corporate securities |
211,103 |
|
216,005 |
208,241 |
|
3,559 |
2,512 |
|
2,297 |
350 |
| Rural product note |
28,896 |
|
28,670 |
28,618 |
|
287 |
262 |
|
29 |
16 |
| Real estate receivables certificates |
7,214 |
|
7,318 |
7,214 |
|
- |
- |
|
- |
- |
| Bank deposit certificate |
1,172 |
|
1,172 |
1,172 |
|
- |
- |
|
- |
- |
| Debentures |
110,075 |
|
110,732 |
108,140 |
|
2,470 |
1,610 |
|
2,037 |
325 |
| Eurobonds and other |
8,770 |
|
9,035 |
8,770 |
|
- |
- |
|
- |
- |
| Financial bills |
19,504 |
|
19,535 |
19,504 |
|
- |
- |
|
- |
- |
| Promissory and commercial notes |
11,250 |
|
11,251 |
11,250 |
|
- |
- |
|
- |
- |
| Other |
24,222 |
|
28,292 |
23,573 |
|
802 |
640 |
|
231 |
9 |
| Total |
722,835 |
|
727,142 |
714,622 |
|
8,818 |
7,771 |
|
2,389 |
442 |
| Other Financial Assets - Internal Classification by Level of Risk |
| |
|
|
|
|
|
| 06/30/2023 |
| Internal
rating |
Financial
Assets - At Amortized Cost |
Financial
assets at fair value through profit or loss (1) |
Financial
Assets at fair value through other comprehensive income |
Total |
| Interbank deposits and securities purchased under
agreements to resell |
Securities |
| Low |
270,285 |
231,718 |
536,578 |
134,279 |
1,172,860 |
| Medium |
- |
3,139 |
2,721 |
68 |
5,928 |
| High |
- |
1,154 |
113 |
- |
1,267 |
| Total |
270,285 |
236,011 |
539,412 |
134,347 |
1,180,055 |
| % |
22.9% |
20.0% |
45.7% |
11.4% |
100.0% |
| 1) Includes Derivatives in the amount of R$ 72,845. |
| |
|
|
|
|
|
| 12/31/2022 |
| Internal
rating |
Financial
Assets - At Amortized Cost |
Financial
assets at fair value through profit or loss (1) |
Financial
Assets at fair value through other comprehensive income |
Total |
| Interbank deposits
and securities purchased under agreements to resell |
Securities |
| Low |
281,371 |
208,605 |
461,153 |
126,673 |
1,077,802 |
| Medium |
- |
3,816 |
2,104 |
75 |
5,995 |
| High |
- |
605 |
50 |
- |
655 |
| Total |
281,371 |
213,026 |
463,307 |
126,748 |
1,084,452 |
| % |
25.9% |
19.6% |
42.7% |
11.8% |
100.0% |
| 1) Includes Derivatives in the amount of R$ 78,208. |
| I.IV.III - Collateral for loan and lease operations |
| |
|
|
|
|
|
|
|
|
|
| |
06/30/2023 |
|
12/31/2022 |
| Over-collateralized assets |
Under-collateralized
assets |
|
Over-collateralized
assets |
Under-collateralized
assets |
| Carrying value
of the assets |
Fair
value of collateral |
Carrying value
of the assets |
Fair
value of collateral |
|
Carrying value
of the assets |
Fair
value of collateral |
Carrying value
of the assets |
Fair
value of collateral |
| Individuals |
149,719 |
388,072 |
3,415 |
2,937 |
|
141,896 |
336,597 |
3,085 |
2,861 |
| Personal (1) |
3,622 |
14,165 |
1,613 |
1,525 |
|
2,971 |
11,106 |
1,469 |
1,394 |
| Vehicles (2) |
30,474 |
71,593 |
1,365 |
1,227 |
|
29,613 |
70,901 |
1,610 |
1,463 |
| Mortgage loans
(3) |
115,623 |
302,314 |
437 |
185 |
|
109,312 |
254,590 |
6 |
4 |
| Micro, small
and medium companies and corporates (4) |
165,483 |
575,833 |
39,694 |
35,708 |
|
173,007 |
614,178 |
41,395 |
36,233 |
| Foreign
loans - Latin America (4) |
169,581 |
316,233 |
9,993 |
3,977 |
|
175,517 |
319,085 |
11,817 |
4,441 |
| Total |
484,783 |
1,280,138 |
53,102 |
42,622 |
|
490,420 |
1,269,860 |
56,297 |
43,535 |
1) In general requires financial collaterals.
2) Vehicles themselves are pledged as collateral, as well as assets leased in lease operations.
3) Properties themselves are pledged as collateral.
4) Any collateral set forth in the credit policy of ITAÚ UNIBANCO HOLDING (chattel mortgage, surety/joint debtor, mortgage
and other). |
Of total loan and lease operations, R$ 363,300 (R$
362,705 at 12/31/2022) represented unsecured loans.
I.IV.IV - Repossessed assets
Assets received from the foreclosure of loans, including
real estate, are initially recorded at the lower of: (i) the fair value of the asset less the estimated selling expenses, or (ii) the
carrying amount of the loan.
Further impairment of assets is recorded as a provision,
with a corresponding charge to income. The maintenance costs of these assets are expensed as incurred.
The policy for sales of these assets includes periodic auctions
that are announced to the market in advance, and provides that the assets cannot be held for more than one year, as stipulated by BACEN.
Total assets repossessed in the period were R$ 290 (R$
104 from 01/01 to 06/30/2022), mainly composed of real estate.
II - Market risk
Defined as the possibility of incurring financial losses
from changes in the market value of positions held by a financial institution, including the risks of transactions subject to fluctuations
in currency rates, interest rates, share prices, price indexes and commodity prices, as set forth by CMN. Price Indexes are also treated
as a risk factor group.
Market risk is controlled by an area independent from the
business areas, which is responsible for the daily activities of (i) risk measurement and assessment, (ii) monitoring of stress scenarios,
limits and alerts, (iii) application, analysis and testing of stress scenarios, (iv) risk reporting to those responsible within the business
areas, in compliance with the governance of ITAÚ UNIBANCO HOLDING, (v) monitoring of actions required to adjust positions
and risk levels to make them realistic, and (vi) providing support for the safe launch of new financial products.
The market risk structure categorizes transactions as part
of either the banking portfolio or the trading portfolio, in accordance with general criteria established by CMN Resolution 4,557, of
February 23, 2017, and BCB Resolution No. 111, of July 6, 2021 and later changes. The trading portfolio consists of all transactions
involving financial instruments and commodities, including derivatives, which are held for trading. The banking portfolio is basically
characterized by transactions for the banking business, and transactions related to the management of the balance sheet of the institution,
where there is no intention of sale and time horizons are medium and long term.
Market risk management is based on the following metrics:
• Value
at risk (VaR): a statistical measure that estimates the expected maximum potential economic loss under normal market conditions, considering
a certain time horizon and confidence level.
• Losses
in stress scenarios (Stress Test): simulation technique to assess the behavior of assets, liabilities and derivatives of a portfolio when
several risk factors are taken to extreme market situations (based on prospective and historical scenarios).
• Stop
loss: metrics used to revise positions, should losses accumulated in a fixed period reach a certain level.
• Concentration:
cumulative exposure of a certain financial instrument or risk factor, calculated at market value (MtM – Mark to Market).
• Stressed
VaR: statistical metric derived from the VaR calculation, with the purpose of simulating higher risk in the trading portfolio, taking
returns that can be seen in past scenarios of extreme volatility.
Management of interest rate risk in the Banking Book (IRRBB)
is based on the following metrics:
• ΔEVE
(Delta Economic Value of Equity): difference between the present value of the sum of repricing flows of instruments subject to IRRBB in
a base scenario and the present value of the sum of repricing flows of these instruments in a scenario of shock in interest rates.
• ΔNII
(Delta Net Interest Income): difference between the result of financial intermediation of instruments subject to IRRBB in a base scenario
and the result of financial intermediation of these instruments in a scenario of shock in interest rates.
In addition, sensitivity and loss control measures are also analyzed. They include:
• Mismatching
analysis (GAPS): accumulated exposure by risk factor of cash flows expressed at market value, allocated at the maturity dates.
• Sensitivity
(DV01- Delta Variation): impact on the fair value of cash flows when a 1 basis point change is applied to current interest rates
or on the index rates.
• Sensitivity
to Sundry Risk Factors (Greeks): partial derivatives of an option portfolio in relation to the prices of underlying assets, implied volatilities,
interest rates and time.
In order to operate within the defined limits, ITAÚ
UNIBANCO HOLDING hedges transactions with customers and proprietary positions, including its foreign investments. Derivatives are commonly
used for these hedging activities, which can be either accounting or economic hedges, both governed by the institutional polices of ITAÚ
UNIBANCO HOLDING.
The structure of limits and alerts obeys the Board of Directors’
guidelines, and it is reviewed and approved on an annual basis. This structure has specific limits aimed at improving the process of monitoring
and understanding risk, and at avoiding concentration. These limits are quantified by assessing the forecast balance sheet results, the
size of stockholders’ equity, market liquidity, complexity and volatility, and ITAÚ UNIBANCO HOLDING’s appetite
for risk.
The consumption of market risk limits is monitored and disclosed
daily through exposure and sensitivity maps. The market risk area analyzes and controls the adherence of these exposures to limits and
alerts and reports them in a timely manner to the Treasury desks and other structures foreseen in the governance.
ITAÚ UNIBANCO HOLDING uses proprietary systems
to measure the consolidated market risk. The processing of these systems occurs in a high-availability access-controlled environment,
which has data storage and recovery processes and an infrastructure that ensures business continuity in contingency (disaster recovery)
situations.
II.I - VaR - Consolidated ITAÚ UNIBANCO HOLDING
VaR is calculated by Historical Simulation, i.e. the expected
distribution for profits and losses (P&L) of a portfolio over time, which can be estimated from past behavior of returns of market
risk factors for this portfolio. VaR is calculated at a confidence level of 99%, historical period of 4 years (1000 business days) and
a holding period of one day. In addition, in a conservative approach, VaR is calculated daily, with and without volatility weighting,
and the final VaR is the more restrictive of the values given by the two methods.
From 01/01 to 06/30/2023, the average total VaR in Historical
Simulation was R$ 883 or 0.5% of total stockholders’ equity (R$ 678 from 01/01 to 12/31/2022 or 0.4% of total stockholders’
equity).
| |
VaR Total (Historical Simulation) (in millions of reais) (1) |
| 06/30/2023 |
|
12/31/2022 |
| Average |
Minimum |
Maximum |
Var Total |
|
Average |
Minimum |
Maximum |
Var Total |
| |
|
|
|
|
|
| VaR by Risk Factor Group |
|
|
|
|
|
|
|
|
|
| Interest rates |
1,219 |
1,059 |
1,349 |
1,118 |
|
1,102 |
885 |
1,751 |
1,160 |
| Currencies |
22 |
12 |
36 |
12 |
|
26 |
9 |
55 |
26 |
| Shares |
28 |
14 |
55 |
26 |
|
27 |
18 |
65 |
65 |
| Commodities |
8 |
2 |
16 |
16 |
|
4 |
2 |
10 |
10 |
| Effect of diversification |
- |
- |
- |
(277) |
|
- |
- |
- |
(527) |
| Total risk |
883 |
718 |
1,039 |
895 |
|
678 |
494 |
1,172 |
734 |
| 1) VaR by Risk Factor Group considers information from foreign units. |
| II.I.I
- Interest rate risk |
|
|
|
|
|
|
|
|
|
|
|
|
|
| The table below shows the accounting
position of financial assets and liabilities exposed to interest rate risk, distributed by maturity (remaining contractual terms).
This table is not used directly to manage interest rate risks, it is mostly used to permit the assessment of mismatching between
accounts and products associated thereto and to identify possible risk concentration. |
| |
06/30/2023 |
|
12/31/2022 |
| |
0-30
days |
31-180
days |
181-365
days |
1-5
years |
Over
5 years |
Total |
|
0-30 days |
31-180 days |
181-365
days |
1-5 years |
Over 5 years |
Total |
| Financial assets |
557,472 |
365,284 |
225,990 |
752,177 |
294,960 |
2,195,883 |
|
604,311 |
374,529 |
208,850 |
633,722 |
274,390 |
2,095,802 |
| At amortized cost |
462,997 |
310,857 |
178,561 |
401,598 |
166,449 |
1,520,462 |
|
464,682 |
314,608 |
167,135 |
391,697 |
166,250 |
1,504,372 |
| Compulsory deposits in the Central Bank of Brazil |
114,744 |
- |
- |
- |
- |
114,744 |
|
102,600 |
- |
- |
- |
- |
102,600 |
| Interbank deposits |
34,441 |
7,955 |
2,710 |
8,191 |
22 |
53,319 |
|
40,782 |
8,207 |
7,683 |
2,800 |
114 |
59,586 |
| Securities purchased under agreements to resell |
177,973 |
38,944 |
- |
- |
29 |
216,946 |
|
177,458 |
44,221 |
47 |
- |
50 |
221,776 |
| Securities |
8,462 |
30,581 |
39,581 |
110,289 |
45,355 |
234,268 |
|
15,933 |
18,962 |
26,633 |
107,431 |
42,029 |
210,988 |
| Loan and lease operations |
127,377 |
233,377 |
136,270 |
283,118 |
121,043 |
901,185 |
|
127,909 |
243,218 |
132,772 |
281,466 |
124,057 |
909,422 |
| At fair value through other comprehensive
income |
24,525 |
11,851 |
15,395 |
56,613 |
25,963 |
134,347 |
|
35,573 |
13,335 |
6,609 |
47,705 |
23,526 |
126,748 |
| At fair value through profit and
loss |
69,950 |
42,576 |
32,034 |
293,966 |
102,548 |
541,074 |
|
104,056 |
46,586 |
35,106 |
194,320 |
84,614 |
464,682 |
| Securities |
57,449 |
27,861 |
20,454 |
270,890 |
89,913 |
466,567 |
|
81,484 |
39,344 |
26,454 |
169,113 |
68,704 |
385,099 |
| Derivatives |
12,501 |
14,676 |
11,294 |
22,512 |
11,862 |
72,845 |
|
22,572 |
7,215 |
8,362 |
24,834 |
15,225 |
78,208 |
| Other Financial Assets |
- |
39 |
286 |
564 |
773 |
1,662 |
|
- |
27 |
290 |
373 |
685 |
1,375 |
| Financial liabilities |
638,098 |
149,223 |
113,410 |
452,997 |
397,249 |
1,750,977 |
|
651,532 |
177,388 |
142,668 |
585,754 |
112,329 |
1,669,671 |
| At amortized cost |
628,945 |
132,328 |
104,473 |
432,077 |
384,923 |
1,682,746 |
|
643,530 |
160,422 |
125,266 |
563,338 |
99,607 |
1,592,163 |
| Deposits |
346,369 |
63,164 |
21,275 |
208,919 |
283,554 |
923,281 |
|
360,548 |
75,395 |
62,860 |
360,225 |
12,410 |
871,438 |
| Securities sold under repurchase agreements |
266,017 |
1,090 |
1,323 |
29,669 |
21,000 |
319,099 |
|
264,284 |
5,698 |
816 |
16,223 |
6,419 |
293,440 |
| Interbank market funds |
15,791 |
64,168 |
75,478 |
152,049 |
10,896 |
318,382 |
|
12,918 |
67,034 |
57,476 |
148,390 |
8,769 |
294,587 |
| Institutional market funds |
340 |
3,399 |
6,090 |
39,387 |
69,473 |
118,689 |
|
5,379 |
11,800 |
3,552 |
36,642 |
72,009 |
129,382 |
| Premium bonds plans |
428 |
507 |
307 |
2,053 |
- |
3,295 |
|
401 |
495 |
562 |
1,858 |
- |
3,316 |
| At fair value through profit and
loss |
9,153 |
16,895 |
8,937 |
20,920 |
12,326 |
68,231 |
|
8,002 |
16,966 |
17,402 |
22,416 |
12,722 |
77,508 |
| Derivatives |
9,151 |
16,877 |
8,700 |
20,607 |
11,991 |
67,326 |
|
8,002 |
16,950 |
17,164 |
22,278 |
12,467 |
76,861 |
| Structured notes |
- |
- |
- |
12 |
74 |
86 |
|
- |
1 |
1 |
18 |
44 |
64 |
| Other Financial Liabilities |
2 |
18 |
237 |
301 |
261 |
819 |
|
- |
15 |
237 |
120 |
211 |
583 |
| Difference assets
/ liabilities (1) |
(80,626) |
216,061 |
112,580 |
299,180 |
(102,289) |
444,906 |
|
(47,221) |
197,142 |
66,181 |
47,987 |
162,635 |
426,724 |
| Cumulative difference |
(80,626) |
135,435 |
248,015 |
547,195 |
444,906 |
|
|
(47,221) |
149,921 |
216,102 |
264,089 |
426,724 |
|
| Ratio of cumulative difference to total interest-bearing
assets |
(3.7)% |
6.2% |
11.3% |
24.9% |
20.3% |
|
|
(2.3)% |
7.2% |
10.3% |
12.6% |
20.4% |
|
| 1) The difference
arises from the mismatch between the maturities of all remunerated assets and liabilities, at the respective period-end date, considering
the contractually agreed terms. |
II.I.II - Currency risk
The purpose of ITAÚ UNIBANCO HOLDING's management
of foreign exchange exposure is to mitigate the effects arising from variation in foreign exchange rates, which may present high-volatility
periods.
The currency (or foreign exchange) risk arises from positions
that are sensitive to oscillations in foreign exchange rates. These positions may be originated by financial instruments that are denominated
in a currency other than the functional currency in which the balance sheet is measured or through positions in derivative instruments
(for negotiation or hedge). Sensitivity to currency risk is disclosed in the table VaR Total (Historical Simulation) described in item
II.I – VaR Consolidated – ITAÚ UNIBANCO HOLDING.
II.I.III - Share Price Risk
The exposure to share price risk is disclosed in Note 5,
related to Financial Assets Through Profit or Loss - Securities, and Note 8, related to Financial Assets at Fair Value Through Other
Comprehensive Income - Securities.
III - Liquidity risk
Defined as the possibility that the institution may be unable
to efficiently meet its expected and unexpected obligations, both current and future, including those arising from guarantees issued,
without affecting its daily operations and without incurring significant losses.
Liquidity risk is controlled by an area independent from
the business area and responsible for establishing the reserve composition, estimating the cash flow and exposure to liquidity risk in
different time horizons, and for monitoring the minimum limits to absorb losses in stress scenarios for each country where ITAÚ
UNIBANCO HOLDING operates. All activities are subject to verification by independent validation, internal control and audit areas.
Liquidity management policies and limits are based on prospective
scenarios and senior management’s guidelines. These scenarios are reviewed on a periodic basis, by analyzing the need for cash due
to atypical market conditions or strategic decisions by ITAÚ UNIBANCO HOLDING.
ITAÚ UNIBANCO HOLDING manages and controls liquidity
risk on a daily basis, using procedures approved in superior committees, including the adoption of liquidity minimum limits, sufficient
to absorb possible cash losses in stress scenarios, measured with the use of internal and regulatory methods.
Among the main regulatory liquidity indicators, the following
indicators stand out:
Liquidity Coverage Ratio (LCR): can be defined
as a sufficiency index over a 30-day horizon, measuring the available amount of assets available to honor potential liquid outflows in
a stress scenario.
Net Stable Funding Ratio (NSFR): can be defined
as an analysis of funding available for the financing of long-term assets.
Both metrics are managed by the liquidity risk area and they
have limits approved by superior committees, as well as governance of action plans in possible liquidity stress scenarios.
Additionally, the following items for monitoring and supporting
decisions are periodically prepared and submitted to senior management:
• Different
scenarios projected for changes in liquidity.
• Contingency
plans for crisis situations.
• Reports
and charts that describe the risk positions.
• Assessment
of funding costs and alternative sources of funding.
• Monitoring
of changes in funding through a constant control of sources of funding, considering the type of investor, maturities and other factors.
III.I - Primary sources of funding
ITAÚ UNIBANCO HOLDING has different sources of
funding, of which a significant portion is from the retail segment. Of total customers’ funds, 68.8% or R$ 935,465, is immediately
available to customers. However, the historical behavior of the accumulated balance of the two largest items in this group – demand
and savings deposits - is relatively consistent with the balances increasing over time and inflows exceeding outflows for monthly average
amounts.
| Funding from customers |
06/30/2023 |
|
12/31/2022 |
| 0-30 days |
Total |
% |
|
0-30 days |
Total |
% |
| Deposits |
773,876 |
923,281 |
|
|
737,633 |
871,438 |
|
| Demand deposits |
114,061 |
114,061 |
8.4% |
|
117,587 |
117,587 |
9.1% |
| Savings deposits |
174,464 |
174,464 |
12.8% |
|
179,764 |
179,764 |
13.9% |
| Time deposits (1) |
477,465 |
620,223 |
45.6% |
|
434,450 |
564,215 |
43.5% |
| Other |
7,886 |
14,533 |
1.1% |
|
5,832 |
9,872 |
0.8% |
| Interbank market funds (1) |
160,839 |
318,382 |
23.4% |
|
130,074 |
294,587 |
22.7% |
| Funds from own issue (2) |
- |
7 |
- |
|
- |
8 |
- |
| Institutional market funds |
750 |
118,689 |
8.7% |
|
4,630 |
129,382 |
10.0% |
| Total |
935,465 |
1,360,359 |
100.0% |
|
872,337 |
1,295,415 |
100.0% |
1) The settlement date is considered as the closest period in which the client has the possibility of withdrawing funds.
2) Refers to Deposits received under securities repurchase agreements with securities from own issue. |
III.II - Control over liquidity
Under the LCR metric, ITAÚ UNIBANCO HOLDING has
High-quality Liquid Assets (HQLA) which totaled an average of R$ 355,222 in the period, mainly made up of sovereign securities, reserves
in central banks and cash. Net cash outflows totaled an average of R$ 197,692 in the period, mainly made up of retail, wholesale
funds, additional requirements, contractual and contingent obligations, offset by cash inflows from loans and other expected cash inflows.
The average LCR in the period is 179.7% (164.4% at 12/31/2022) above
the 100% threshold, and therefore the entity comfortably has sufficient stable funds available to support losses under the standardized
stress scenario for LCR.
From the NSFR perspective, ITAÚ UNIBANCO HOLDING has
Available Stable Funding (ASF) that totaled R$ 1,216,666 in the period, mainly made up of capital, retail and wholesale funds. The
required stable funding (RSF) totaled R$ 951,167 in the period, mainly made up of loans and financing granted to wholesale and retail
clients, central governments, and operations with central banks.
The NSFR at the period closing is 127.9% (124.9% at 12/31/2022),
above the 100% threshold, and therefore the entity comfortably has sufficient stable funds available to support the stable funds required
in the long term, in accordance with the metric.
| Liabilities according to their remaining contractual maturities,
considering their undiscounted flows, are presented below: |
| Undiscounted future
flows, except for derivatives which are fair value |
06/30/2023 |
|
12/31/2022 |
| Financial
liabilities |
0
– 30 |
31
– 365 |
366
– 720 |
Over
720 days |
Total |
|
0
– 30 |
31
– 365 |
366
– 720 |
Over
720 days |
Total |
| |
|
|
|
|
|
|
|
|
|
|
|
| Deposits |
773,884 |
98,890 |
27,028 |
26,609 |
926,411 |
|
737,637 |
92,481 |
28,768 |
21,264 |
880,150 |
| Demand deposits |
114,061 |
- |
- |
- |
114,061 |
|
117,587 |
- |
- |
- |
117,587 |
| Savings deposits |
174,464 |
- |
- |
- |
174,464 |
|
179,764 |
- |
- |
- |
179,764 |
| Time deposit |
477,465 |
93,706 |
26,302 |
25,756 |
623,229 |
|
434,450 |
91,308 |
25,870 |
21,191 |
572,819 |
| Interbank deposits |
1,148 |
5,184 |
726 |
853 |
7,911 |
|
858 |
1,173 |
2,898 |
73 |
5,002 |
| Other deposits |
6,746 |
- |
- |
- |
6,746 |
|
4,978 |
- |
- |
- |
4,978 |
| |
|
|
|
|
|
|
|
|
|
|
|
| Compulsory deposits |
(117,038) |
(12,671) |
(3,557) |
(3,483) |
(136,749) |
|
(97,709) |
(11,904) |
(3,373) |
(2,762) |
(115,748) |
| Demand deposits |
(22,005) |
- |
- |
- |
(22,005) |
|
(13,148) |
- |
- |
- |
(13,148) |
| Savings deposits |
(30,471) |
- |
- |
- |
(30,471) |
|
(27,923) |
- |
- |
- |
(27,923) |
| Time deposit |
(64,562) |
(12,671) |
(3,557) |
(3,483) |
(84,273) |
|
(56,638) |
(11,904) |
(3,373) |
(2,762) |
(74,677) |
| |
|
|
|
|
|
|
|
|
|
|
|
| Securities sold under repurchase agreements |
266,160 |
2,544 |
11,836 |
73,725 |
354,265 |
|
264,451 |
6,603 |
7,841 |
29,287 |
308,182 |
| Government securities |
223,781 |
301 |
5,982 |
53,492 |
283,556 |
|
196,672 |
6,444 |
7,808 |
29,176 |
240,100 |
| Private securities |
21,499 |
1,726 |
5,825 |
18,652 |
47,702 |
|
22,642 |
1 |
- |
10 |
22,653 |
| Foreign |
20,880 |
517 |
29 |
1,581 |
23,007 |
|
45,137 |
158 |
33 |
101 |
45,429 |
| |
|
|
|
|
|
|
|
|
|
|
|
| Interbank market funds |
160,839 |
74,738 |
39,793 |
57,527 |
332,897 |
|
94,313 |
101,047 |
44,547 |
70,900 |
310,807 |
| |
|
|
|
|
|
|
|
|
|
|
|
| Institutional market funds |
750 |
12,469 |
45,601 |
86,586 |
145,406 |
|
4,645 |
5,367 |
42,162 |
103,421 |
155,595 |
| |
|
|
|
|
|
|
|
|
|
|
|
| Derivative financial instruments - Net position |
9,151 |
25,577 |
8,661 |
23,937 |
67,326 |
|
8,002 |
34,114 |
9,056 |
25,689 |
76,861 |
| Swaps |
838 |
9,033 |
7,001 |
22,467 |
39,339 |
|
2,835 |
5,114 |
7,344 |
23,775 |
39,068 |
| Options |
242 |
11,348 |
668 |
556 |
12,814 |
|
3,221 |
25,087 |
901 |
673 |
29,882 |
| Forwards |
6,909 |
- |
- |
- |
6,909 |
|
55 |
10 |
- |
- |
65 |
| Other derivatives |
1,162 |
5,196 |
992 |
914 |
8,264 |
|
1,891 |
3,903 |
811 |
1,241 |
7,846 |
| |
|
|
|
|
|
|
|
|
|
|
|
| Other financial liabilities |
- |
2 |
255 |
562 |
819 |
|
- |
252 |
34 |
297 |
583 |
| |
|
|
|
|
|
|
|
|
|
|
|
| Total
financial liabilities |
1,093,746 |
201,549 |
129,617 |
265,463 |
1,690,375 |
|
1,011,339 |
227,960 |
129,035 |
248,096 |
1,616,430 |
| Off
balance commitments |
|
06/30/2023 |
|
12/31/2022 |
| Note |
0
– 30 |
31
– 365 |
366
– 720 |
Over
720 days |
Total |
|
0 – 30 |
31 – 365 |
366 – 720 |
Over 720
days |
Total |
| Financial guarantees |
|
1,684 |
35,216 |
12,180 |
44,825 |
93,905 |
|
2,987 |
31,548 |
12,731 |
44,513 |
91,779 |
| Loan commitments |
|
167,259 |
49,521 |
14,362 |
185,853 |
416,995 |
|
161,822 |
50,552 |
20,386 |
172,484 |
405,244 |
| Letters of credit to be released |
|
32,164 |
- |
- |
- |
32,164 |
|
47,354 |
- |
- |
- |
47,354 |
| Contractual commitments - Fixed and Intangible assets |
13 and 14 |
- |
- |
3 |
- |
3 |
|
- |
- |
- |
3 |
3 |
| Total |
|
201,107 |
84,737 |
26,545 |
230,678 |
543,067 |
|
212,163 |
82,100 |
33,117 |
217,000 |
544,380 |
IV - Emerging Risks
Defined as those with a potentially material impact on the
business in the medium and long term, but for which there are not enough elements yet for their complete assessment and mitigation due
to the number of factors and impacts not yet totally known, such as geopolitical and macroeconomic risk and climate change. Their causes
can be originated by external events and result in the emergence of new risks or in the intensification of risks already monitored byITAÚ
UNIBANCO HOLDING.
The identification and monitoring of Emerging Risks are ensured
by ITAÚ UNIBANCO HOLDING’s governance, allowing these risks to be incorporated into risk management processes too.
V - Social, Environmental and Climate
Risks
Social, environmental and climate risks are the possibility
of losses due to exposure to social, environmental and/or climatic events related to the activities developed by ITAÚ
UNIBANCO HOLDING.
Social, environmental and climatic factors are considered
relevant to the business of ITAÚ UNIBANCO HOLDING, since they may affect the creation of shared value in the short, medium
and long term.
The Policy of Social, Environmental and Climatic Risks (Risks
SAC Policy) establishes the guidelines and underlying principles for social, environmental and climatic risk management, addressing
the most significant risks for the institution’s operation through specific procedures.
Actions to mitigate the Social, Environmental and Climatic
Risks are taken based on the mapping of processes, risks and controls, monitoring of new standards related to the theme and recording
of occurrence in internal systems. In addition to the identification, the phases of prioritization, response to risk, mitigation, monitoring
and reporting of assessed risks supplement the management of these risks at ITAÚ UNIBANCO HOLDING.
In the management of Social, Environmental and Climatic Risks,
business areas manage the risk in its daily activities, following the Risks SAC Policy guidelines and specific processes, with
the support of specialized assessment from dedicated technical teams located in Credit, which serves the Wholesale segment, Credit Risk
and Modeling, and Institutional Legal teams, that act on an integrated way in the management of all dimensions of the Social, Environmental
and Climatic Risks related to the conglomerate’s activities. As an example of specific guidelines for the management of these risks,
ITAÚ UNIBANCO HOLDING has specific governance for granting and renewing credit in senior approval levels for clients in certain
economic sectors, classified as Sensitive Sectors (Mining, Steel & Metallurgy, Oil & Gas, Textiles Industry and Retail Clothing,
Paper & Pulp, Chemicals & Petrochemicals, Agri - Meatpacking, Agri - Crop Protection and Fertilizers, Wood, Energy, Rural Producers
and Real Estate), for which there is an individualized analysis of Social, Environmental and Climate Risks. The institution also
counts with specific procedures for the Institution’s operation (stockholders’ equity, branch infrastructure, technology and
suppliers), credit, investments and key controls. SAC Risks area, Internal Controls and Compliance areas, in turn, support and ensure
the governance of the activities of the business and credit areas that serves the business. The Internal Audit acts on an independent
manner, assessing risk management, controls and governance.
Governance also counts on the Social, Environmental
and Climatic Risks Committee, whose main responsibility is to assess and deliberate about institutional and strategic matters, as well
as to resolve on products, operations, and services, among others involving the Social, Environmental and Climatic Risks.
Climate Risk includes: (i) physical risks, arising from changes
in weather patterns, such as increased rainfall, and temperature and extreme weather events, and (ii) transition risks, resulting from
changes in the economy, as a result of climate actions, such as carbon pricing, climate regulation, market risks and reputational risks.
Considering its relevance, climate risk has become one of
the main priorities for ITAÚ UNIBANCO HOLDING, which supports the Task Force on Climate-related Financial Disclosures (TCFD)
and it is committed to maintaining a process of evolution and continuous improvement within the pillars recommended by the TCFD. With
this purpose, ITAÚ UNIBANCO HOLDING is strengthening the governance and strategy related to Climate Risk and developing
tools and methodologies to assess and manage these risks.
ITAÚ UNIBANCO HOLDING measures the sensitivity
of the credit portfolio to climate risks by applying the Climate Risk Sensitivity Assessment Tool, developed by Febraban. The tool combines
relevance and proportionality criteria to identify the sectors and clients within the portfolio that are more sensitive to climate risks,
considering physical and transition risks. The sectors with the highest probability of suffering financial impacts from climate change,
following the TCFD guidelines, are: energy, transport,
materials and construction, agriculture, food and forestry products.
c) Capital Management Governance
ITAÚ UNIBANCO HOLDING is subject to the regulations
of BACEN, which determines minimum capital requirements, procedures to obtain information to assess the global systemic importance of
banks, fixed asset limits, loan limits and accounting practices, and requires banks to conform to the regulations based on the Basel Accord
for capital adequacy. Additionally, CNSP and SUSEP issue regulations on capital requirements that affect our insurance operations and
private pension and premium bonds plans.
The capital statements were prepared in accordance with BACEN’s
regulatory requirements and with internationally accepted minimum requirements according to the Bank for International Settlements (BIS).
I - Composition and Capital Adequacy
The Board of Directors is the body responsible for approving
the institutional capital management policy and guidelines for the capitalization level of ITAÚ UNIBANCO HOLDING. The Board
is also responsible for the full approval of the ICAAP (Internal Capital Adequacy Assessment Process) report, the purpose of which is
to assess the capital adequacy of ITAÚ UNIBANCO HOLDING.
The result of the last ICAAP, which comprises stress tests
– which was dated December 2022 – indicated that ITAÚ UNIBANCO HOLDING has, in addition to capital to cover all
material risks, a significant capital surplus, thus assuring the solidity of the institution’s equity position.
In order to ensure that ITAÚ UNIBANCO HOLDING is
sound and has the capital needed to support business growth, the institution maintains PR levels above the minimum level required to face
risks, as demonstrated by the Common Equity, Tier I Capital and Basel ratios.
| |
06/30/2023 |
12/31/2022 |
| Available capital (amounts) |
|
|
| Common Equity Tier 1 |
155,372 |
147,781 |
| Tier 1 |
173,670 |
166,868 |
| Total capital (PR) |
192,828 |
185,415 |
| Risk-weighted assets (amounts) |
|
|
| Total risk-weighted assets (RWA) |
1,274,840 |
1,238,582 |
| Risk-based capital ratios as a percentage of RWA |
|
|
| Common Equity Tier 1 ratio (%) |
12.2% |
11.9% |
| Tier 1 ratio (%) |
13.6% |
13.5% |
| Total capital ratio (%) |
15.1% |
15.0% |
| Additional CET1 buffer requirements as a percentage of RWA |
|
|
| Capital conservation buffer requirement (%) |
2.50% |
2.50% |
| Countercyclical buffer requirement (%) |
- |
- |
| Bank G-SIB and/or D-SIB additional requirements (%) |
1.0% |
1.0% |
| Total of bank CET1 specific buffer requirements (%) |
3.50% |
3.50% |
At 06/30/2023 the amount of perpetual subordinated
debt that makes up Tier I capital is R$ 17,470 (R$ 18,336 at 12/31/2022) and the amount of perpetual subordinated
debt that makes up Tier capital II is R$ 18,818 (R$ 18,431 at 12/31/2022).
The Basel Ratio reached 15.1% at 06/30/2023, an
increase of 0.1 p.p. compared to 12/31/2022, due to teh result for the period and prudential and equity adjustments,
partially offset by the increase of Risk-Weighted Assets.
Additionally, ITAÚ UNIBANCO HOLDING has
a surplus over the required minimum Referential Equity of R$ 90,841 (R$ 86,328 at 12/31/2022), well above the ACP of R$ 44,619 (R$
43,350 at 12/31/2022), generously covered by available capital.
The fixed assets ratio shows the commitment percentage of
adjusted Referential Equity with adjusted permanent assets. ITAÚ UNIBANCO HOLDING falls within the maximum limit of 50% of adjusted
PR, established by BACEN. At 06/30/2023, fixed assets ratio reached 20.0% (19.9% at 12/31/2022), showing a surplus
of R$ 57,779 (R$ 55,748 at 12/31/2022).
II - Risk-Weighted Assets (RWA)
For calculating minimum capital requirements, RWA must be
obtained by taking the sum of the following risk exposures:
RWA = RWACPAD + RWAMINT+ RWAOPAD
• RWACPAD =
portion related to exposures to credit risk, calculated using the standardized approach.
• RWAMINT
= portion related to capital required for market risk, composed of the maximum between the internal model and 80% of the standardized
model, regulated by BACEN Circular No. 3,646 and No. 3,674.
• RWAOPAD=
portion related to capital required for operational risk, calculated based on the standardized approach.
| |
RWA |
| |
06/30/2023 |
12/31/2022 |
| Credit Risk - standardized approach |
1,146,946 |
1,118,752 |
| Credit risk (excluding counterparty credit risk) |
1,040,381 |
1,016,137 |
| Counterparty credit risk (CCR) |
42,783 |
40,222 |
| Of which: standardized approach for counterparty credit risk (SA-CCR) |
30,115 |
25,361 |
| Of which: other CCR |
12,668 |
14,861 |
| Credit valuation adjustment (CVA) |
6,419 |
7,695 |
| Equity investments in funds - look-through approach |
6,805 |
8,002 |
| Equity investments in funds - mandate-based approach |
- |
104 |
| Equity investments in funds - fall-back approach |
1,597 |
1,461 |
| Securitisation exposures - standardized approach |
3,711 |
4,408 |
| Amounts below the thresholds for deduction |
45,250 |
40,723 |
| Market Risk |
26,592 |
23,240 |
| Of which: standardized approach (RWAMPAD) |
33,240 |
29,050 |
| Of which: internal models approach (RWAMINT) |
21,818 |
23,097 |
| Operational Risk |
101,302 |
96,590 |
| Total |
1,274,840 |
1,238,582 |
III - Recovery Plan
In response to the latest international crises, the Central
Bank published Resolution No. 4,502, which requires the development of a Recovery Plan by financial institutions within Segment 1, with
total exposure to GDP of more than 10%. This plan aims to reestablish adequate levels of capital and liquidity above regulatory operating
limits in the face of severe systemic or idiosyncratic stress shocks. In this way, each institution could preserve its financial viability
while also minimizing the impact on the National Financial System.
IV - Stress testing
The stress test is a process of simulating extreme economic
and market conditions on ITAÚ UNIBANCO HOLDING’s results, liquidity and capital. The institution has been carrying out this
test in order to assess its solvency in plausible scenarios of crisis, as well as to identify areas that are more susceptible to the impact
of stress that may be the subject of risk mitigation.
For the purposes of the test, the economic research area
estimates macroeconomic variables for each stress scenario. The elaboration of stress scenarios considers the qualitative analysis of
the Brazilian and the global conjuncture, historical and hypothetical elements, short and long term risks, among other aspects, as defined
in CMN Resolution 4,557.
In this process, the main potential risks to the economy
are assessed based on the judgment of the bank's team of economists, endorsed by the Chief Economist of ITAÚ UNIBANCO HOLDING
and approved by the Board of Directors. Projections for the macroeconomic variables (such as GDP, basic interest rate, exchange rates
and
inflation) and for variables in the credit market (such as
raisings, lending, rates of default, margins and charges) used are based on exogenous shocks or through use of models validated by an
independent area.
Then, the stress scenarios adopted are used to influence
the budgeted result and balance sheet. In addition to the scenario analysis methodology, sensitivity analysis and the Reverse Stress Test
are also used.
ITAÚ UNIBANCO HOLDING uses the simulations to
manage its portfolio risks, considering Brazil (segregated into wholesale and retail) and External Units, from which the risk-weighted
assets and the capital and liquidity ratios are derived.
The stress test is also an integral part of the ICAAP, the
main purpose of which is to assess whether, even in severely adverse situations, the institution would have adequate levels of capital
and liquidity, without any impact on the development of its activities.
This information enables potential offenders to the business
to be identified and provides support for the strategic decisions of the Board of Directors, the budgeting and risk management process,
as well as serving as an input for the institution’s risk appetite metrics.
V - Leverage Ratio
The Leverage Ratio is defined as the ratio between Tier I
Capital and Total Exposure, calculated according to BACEN Circular 3,748, which minimum requirement is of 3%. The ratio is intended to
be a simple measure of non-risk-sensitive leverage, and so it does not take into account risk weights or risk mitigation.
d) Management risks of insurance contracts
and private pension
I - Management structure, roles and responsibilities
ITAÚ UNIBANCO HOLDING has specific committees,
whose assignment is to define and establish guidelines for the management of funds from insurance contracts and private pension, with
the objective of long-term profitability, and to establish assessment models, risk limits and resource allocation strategies in defined
financial assets.
II - Underwriting risk
In addition to the risks inherent in financial instruments
related to insurance contracts and private pension, operations carried out at ITAÚ UNIBANCO HOLDING cause exposure to
underwriting risk.
Underwriting risk is the risk of significant deviations in
the methodologies and/or assumptions used for pricing products that may adversely affect ITAÚ UNIBANCO HOLDING, which may be consummated
in different ways, depending on the product offered:
(i) Insurance: results from the change in risk behavior
in relation to the increase in the frequency and/or severity of claims incurred, contrary to pricing estimates.
(ii) Private Pension: is observed in the increase in
life expectancy or deviation from the assumptions adopted in the estimates of future cash flows.
The measurement of exposure to underwriting risk is based
on the analysis of the actuarial assumptions adopted in the recognition of liabilities and pricing of products through i) monitoring the
evolution of equity required to mitigate the risk of insolvency or liquidity; ii) follow-up of portfolios, products, and coverage, from
the perspective of results, adherence to expected rates and expected behavior of loss ratio.
Exposure to underwriting risk is managed and monitored in
accordance with risk appetite levels approved by Management and is controlled using indicators that allow the creation of stress scenarios
and simulations of the portfolio.
II.I Risk Concentrations
For ITAÚ UNIBANCO HOLDING there is no concentration
of products in relation to insurance premiums, thus reducing the risk of concentration in products and distribution channels. ITAÚ
UNIBANCO HOLDING's insurance and private pension operations are mainly related to death and survivorship coverage.
| II.II - Sensitivity analysis |
|
|
|
|
|
| The sensitivity analysis considers a vision impacts caused by changes in assumptions, which could affect the income and stockholders’ equity at the report date. This type of analysis is usually conducted under the ceteris paribus condition, in which the sensitivity of a system is measured when one variable of interest is changed and all the others remain unchanged. The results obtained are shown in the table below: |
| Assumptions |
|
06/30/2023 |
| |
Impact in Income |
Impact in Stockholders’ Equity |
| |
Insurance |
Private pension |
Insurance |
Private pension |
| Discount rate |
|
|
|
|
|
| 0.5% increase |
|
- |
(26) |
46 |
640 |
| 0.5% decrease |
|
- |
21 |
(50) |
(707) |
| Biometric tables |
|
|
|
|
|
| 5% increase |
|
(3) |
48 |
- |
- |
| 5% decrease |
|
3 |
(51) |
- |
- |
| Claims |
|
|
|
|
|
| 5% increase |
|
(31) |
- |
- |
- |
| 5% decrease |
|
31 |
- |
- |
- |
III - Liquidity risk
Liquidity risk management for insurance and private pension
operations is performed on an ongoing basis, based on monitoring the flow of payments related to its liabilities, the flow of receipts
generated by operations and the portfolio of financial assets.
Financial assets are managed with the purpose of optimizing
the relationship between risk and return on investments, considering the characteristics of their liabilities. Accordingly, investments
are concentrated in government and private securities with good credit quality in active and liquid markets, keeping a considerable amount
invested in short-term assets, with immediate liquidity, to meet regular and contingent liquidity needs. In addition, ITAÚ
UNIBANCO HOLDING constantly monitors the solvency conditions of its operations.
Below is a maturity analysis of estimated undiscounted future
cash flows from insurance contracts and private pension, considering assumptions of inflows, outflows and discount rates (Note 27c):
| Period |
06/30/2023 |
|
12/31/2022 |
| Insurance |
Private pension |
Total |
|
Insurance |
Private pension |
Total |
| 1 year |
(678) |
15,709 |
15,031 |
|
(660) |
16,603 |
15,943 |
| 2 years |
(278) |
19,329 |
19,051 |
|
(232) |
18,773 |
18,541 |
| 3 years |
(229) |
18,084 |
17,855 |
|
(186) |
17,835 |
17,649 |
| 4 years |
(145) |
17,119 |
16,974 |
|
(120) |
17,113 |
16,993 |
| 5 years |
(56) |
16,346 |
16,290 |
|
(50) |
16,498 |
16,448 |
| Over 5 years |
1,870 |
367,572 |
369,442 |
|
1,891 |
378,341 |
380,232 |
| Total (1) |
484 |
454,159 |
454,643 |
|
643 |
465,163 |
465,806 |
| 1) Refers to (inflows) and outflows of cash flows related to insurance contracts and private pension. |
ITAÚ UNIBANCO HOLDING holds R$ 240,565 (R$
224,140 at 12/31/2022) referring to amounts that are payable or demand, which represent contributions made by insured parties
that can be redeemed at any time. All these amounts refer to contracts issued that are liabilities, and no group of contracts was in asset
position in the period.
IV - Credit risk
The credit risk arising from insurance contract premiums
is not material, as cases with unpaid coverage are canceled after 90 days.
Reinsurance operations are controlled through an internal
policy, observing the regulator's guidelines regarding the reinsurers with which ITAÚ UNIBANCO HOLDING operates.
Taking out reinsurance is subject to an assessment of the
reinsurer's credit risk and the operational limits for its consummation, and monitoring is carried out during the effectiveness to identify
signs of deterioration that lead to changes in the analyzes conducted.
Note 33 - Supplementary information
a) Acquisition of Avenue Holding Cayman
Ltd
On July 08, 2022, ITAÚ UNIBANCO HOLDING entered
into a share purchase agreement with Avenue Controle Cayman Ltd and other selling stockholders for the acquisition of control of Avenue
Holding Cayman Ltd (AVENUE). The purchase will be carried out in three phases over five years. In the first phase, ITAÚ UNIBANCO
HOLDING will acquire 35% of AVENUE’s capital for approximately R$ 493. In the second phase, after two years, ITAÚ
UNIBANCO HOLDING will acquire additional ownership interest of 15.1%, then holding control with 50.1% of AVENUE’s capital. After
five years of the first phase, ITAÚ UNIBANCO HOLDING may exercise a call option for the remaining ownership interest.
AVENUE holds a U.S. digital securities broker aimed to democratize
the access of Brazilian investors to the international market.
The management and development of AVENUE's business will
continue to be autonomous in relation to ITAÚ UNIBANCO HOLDING, which will become one of the institutions that will make AVENUE's
services available to its clients abroad.
The effective acquisitions and financial settlements will
occur after the required regulatory approvals are received.
b) “Coronavirus” COVID-19
effects
ITAÚ UNIBANCO HOLDING incorporated into its processes
the monitoring of the economic effects of the COVID-19 pandemic in Brazil and the other countries where it operates, which may adversely
affect its Profit or Loss. Even after the end of the state of public health emergency in Brazil announced in May 2022, ITAÚ
UNIBANCO HOLDING will continue to monitor the impacts of the COVID-19 pandemic and following health and health surveillance recommendations
so as to ensure safety of its employees and clients.
Note 34 - Subsequent Event
Organization of Joint Venture - Totvs Techfin S.A.
On April 12, 2022, ITAÚ UNIBANCO HOLDING with TOTVS
S.A. (TOTVS) entered into an agreement for the organization of a joint venture, called Totvs Techfin S.A. (TECHFIN), which will combine
technology and financial solutions, adding the supplementary expertise of the partners to provide corporate clients with, in an expeditious
and integrated manner, the best experiences in buying products directly from the platforms already offered by TOTVS.
TOTVS contributed with assets of its current TECHFIN operation
to a company of which ITAÚ UNIBANCO HOLDING became a partner with a 50% ownership interest in capital, and each partner may appoint
half of the members of the Board of Directors and the Executive Board. For the ownership interest, ITAÚ UNIBANCO HOLDING paid
TOTVS the amount of R$ 610 and, as a complementary price (earn-out), it will pay up to R$ 450 after five years upon achievement of goals
aligned with the growth and performance purposes. Additionally, ITAÚ UNIBANCO HOLDING will contribute the funding commitment
for current and future operations, credit expertise and development of new products at TECHFIN.
The effective acquisition and financial settlement occurred
on July 31, 2023 after the required regulatory approvals.
Public offering for the acquisition of Banco Itaú Chile
Between June 6 and July 5, 2023, ITAÚ UNIBANCO HOLDING
carried out a voluntary public offering for the acquisition of outstanding shares issued by Banco Itaú Chile (ITAÚ CHILE),
including those in the form of American Depositary Shares (ADS), in Chile and the United States of America.
Shareholders holding shares representing approximately 1.07%
of ITAÚ CHILE’s capital adhered to the voluntary public offering, where 2,122,994 shares and 554,650 ADS (equivalent to 184,883
shares) were acquired through the controlled company ITB Holding Brasil Participações Ltda., and, after the acquisitions,
ITAÚ UNIBANCO HOLDING now holds 66.69% of the ITAÚ CHILE’s capital.
The effective acquisitions occurred on July 08, 2023
and the financial settlements on July 13, 2023 for the amount of R$ 119 (CLP 19,617 millions).
Itau Unibanco (NYSE:ITUB)
Historical Stock Chart
From Jun 2024 to Jul 2024

Itau Unibanco (NYSE:ITUB)
Historical Stock Chart
From Jul 2023 to Jul 2024
