UNITED STATES
SECURITIES AND EXCHANGE COMMISSION
Washington, D.C. 20549
FORM 6-K
Report of Foreign Private Issuer Pursuant to Rule 13a-16 or 15d-16
under the Securities Exchange Act of 1934
For the month of November 2023
Commission File Number 001-11444
| |
| MAGNA INTERNATIONAL INC. |
| (Exact Name of Registrant as specified in its Charter) |
| |
| 337 Magna Drive, Aurora, Ontario, Canada L4G 7K1 |
| (Address of principal executive office) |
| |
Indicate by check mark whether the registrant files or will file annual reports under cover
Form 20-F or Form 40-F.
Form 20-F
☐ Form 40-F
☒
SIGNATURES
Pursuant to the requirements of the Securities Exchange Act of 1934, the registrant has duly
caused this report to be signed on its behalf by the undersigned, thereunto duly authorized.
|
Date: November 3, 2023 |
MAGNA INTERNATIONAL INC.
(Registrant)
|
| |
By: |
/s/ “Bassem Shakeel” |
|
| |
|
Bassem A. Shakeel,
Vice-President, Associate General Counsel
and Corporate Secretary |
EXHIBITS
Exhibit 99.1
| FINANCIAL REVIEW OF MAGNA INTERNATIONAL INC. |
| (United States dollars in millions, except per share figures) (Unaudited) |
| Prepared in accordance with U.S. GAAP |
| |
|
|
|
|
2021 |
|
2022 |
|
2023 |
| |
|
|
Note |
|
1st Q |
2nd Q |
3rd Q |
4th Q |
TOTAL |
|
1st Q |
2nd Q |
3rd Q |
4th Q |
TOTAL |
|
1st Q |
2nd Q |
3rd Q |
TOTAL |
| VEHICLE VOLUME STATISTICS (in millions) |
|
|
|
|
|
|
|
|
|
|
| North America |
|
|
3.752 |
3.213 |
2.921 |
3.219 |
13.105 |
|
3.621 |
3.551 |
3.607 |
3.524 |
14.303 |
|
3.883 |
4.085 |
3.874 |
11.842 |
| |
|
|
|
|
|
|
|
|
|
|
|
|
|
|
|
|
|
|
|
|
| |
Western Europe |
|
|
3.045 |
2.443 |
1.783 |
2.392 |
9.663 |
|
2.491 |
2.596 |
2.292 |
2.704 |
10.083 |
|
3.021 |
2.972 |
2.521 |
8.514 |
| |
Eastern Europe |
|
|
1.870 |
1.671 |
1.212 |
1.650 |
6.403 |
|
1.509 |
1.404 |
1.301 |
1.485 |
5.699 |
|
1.551 |
1.631 |
1.567 |
4.749 |
| Total Europe |
|
|
4.915 |
4.114 |
2.995 |
4.042 |
16.066 |
|
4.000 |
4.000 |
3.593 |
4.189 |
15.782 |
|
4.572 |
4.603 |
4.088 |
13.263 |
| |
|
|
|
|
|
|
|
|
|
|
|
|
|
|
|
|
|
|
|
|
| China |
|
|
6.032 |
5.699 |
5.437 |
7.366 |
24.534 |
|
6.365 |
5.487 |
7.230 |
7.260 |
26.342 |
|
5.942 |
6.815 |
7.108 |
19.865 |
| |
|
|
|
|
|
|
|
|
|
|
|
|
|
|
|
|
|
|
|
|
| Other |
|
|
6.955 |
5.819 |
5.291 |
6.087 |
24.152 |
|
6.331 |
6.127 |
6.710 |
6.866 |
26.034 |
|
7.040 |
6.781 |
6.867 |
20.688 |
| |
|
|
|
|
|
|
|
|
|
|
|
|
|
|
|
|
|
|
|
|
| Global |
|
|
21.654 |
18.845 |
16.644 |
20.714 |
77.857 |
|
20.317 |
19.165 |
21.140 |
21.839 |
82.461 |
|
21.437 |
22.284 |
21.937 |
65.658 |
| |
|
|
|
|
|
|
|
|
|
|
|
|
|
|
|
|
|
|
|
|
| Magna Steyr vehicle assembly volumes |
|
|
0.041 |
0.030 |
0.025 |
0.034 |
0.130 |
|
0.026 |
0.032 |
0.026 |
0.028 |
0.112 |
|
0.034 |
0.027 |
0.023 |
0.084 |
| |
|
|
|
|
|
|
|
|
|
|
|
|
|
|
|
|
|
|
|
|
| AVERAGE FOREIGN EXCHANGE RATES |
|
|
|
|
|
|
|
|
|
|
|
|
|
|
|
|
|
|
| 1 Canadian dollar equals U.S. dollars |
|
|
0.790 |
0.814 |
0.794 |
0.794 |
0.798 |
|
0.790 |
0.783 |
0.765 |
0.737 |
0.769 |
|
0.740 |
0.745 |
0.746 |
0.744 |
| 1 Euro equals U.S. dollars |
|
|
1.205 |
1.206 |
1.178 |
1.144 |
1.183 |
|
1.123 |
1.064 |
1.006 |
1.019 |
1.053 |
|
1.073 |
1.089 |
1.088 |
1.083 |
| 1 Chinese renminbi equals U.S. dollars |
|
|
0.154 |
0.155 |
0.155 |
0.156 |
0.155 |
|
0.158 |
0.151 |
0.146 |
0.140 |
0.149 |
|
0.146 |
0.143 |
0.138 |
0.142 |
| |
|
|
|
|
|
|
|
|
|
|
|
|
|
|
|
|
|
|
|
|
| CONSOLIDATED STATEMENTS OF INCOME (LOSS) |
|
|
|
|
|
|
|
|
|
|
|
|
|
|
|
|
|
|
| Sales: |
|
|
|
|
|
|
|
|
|
|
|
|
|
|
|
|
|
|
|
| |
|
Body Exteriors & Structures |
|
|
4,025 |
3,647 |
3,185 |
3,620 |
14,477 |
|
4,077 |
3,947 |
3,976 |
4,004 |
16,004 |
|
4,439 |
4,540 |
4,354 |
13,333 |
| |
|
Power & Vision |
|
|
3,156 |
2,881 |
2,501 |
2,804 |
11,342 |
|
3,046 |
2,888 |
2,911 |
3,016 |
11,861 |
|
3,323 |
3,462 |
3,745 |
10,530 |
| |
|
Seating Systems |
|
|
1,303 |
1,166 |
1,123 |
1,299 |
4,891 |
|
1,376 |
1,253 |
1,295 |
1,345 |
5,269 |
|
1,486 |
1,603 |
1,529 |
4,618 |
| |
|
Complete Vehicles |
|
|
1,850 |
1,490 |
1,255 |
1,511 |
6,106 |
|
1,275 |
1,403 |
1,213 |
1,330 |
5,221 |
|
1,626 |
1,526 |
1,185 |
4,337 |
| |
|
Corporate & Other |
|
|
(155) |
(150) |
(145) |
(124) |
(574) |
|
(132) |
(129) |
(127) |
(127) |
(515) |
|
(201) |
(149) |
(125) |
(475) |
| Sales |
|
|
10,179 |
9,034 |
7,919 |
9,110 |
36,242 |
|
9,642 |
9,362 |
9,268 |
9,568 |
37,840 |
|
10,673 |
10,982 |
10,688 |
32,343 |
| |
|
|
|
|
|
|
|
|
|
|
|
|
|
|
|
|
|
|
|
|
| Costs and expenses: |
|
|
|
|
|
|
|
|
|
|
|
|
|
|
|
|
|
|
| |
Cost of goods sold |
|
|
8,662 |
7,728 |
6,885 |
7,822 |
31,097 |
|
8,400 |
8,259 |
8,126 |
8,403 |
33,188 |
|
9,416 |
9,544 |
9,264 |
28,224 |
| |
Selling, general and administrative |
|
|
430 |
419 |
454 |
414 |
1,717 |
|
386 |
410 |
387 |
477 |
1,660 |
|
488 |
505 |
491 |
1,484 |
| |
Equity income |
|
|
(47) |
(44) |
(34) |
(23) |
(148) |
|
(20) |
(25) |
(27) |
(17) |
(89) |
|
(33) |
(36) |
(40) |
(109) |
| |
|
|
|
|
|
|
|
|
|
|
|
|
|
|
|
|
|
|
|
|
| Adjusted EBITDA |
|
|
1,134 |
931 |
614 |
897 |
3,576 |
|
876 |
718 |
782 |
705 |
3,081 |
|
802 |
969 |
973 |
2,744 |
| |
Depreciation |
|
|
352 |
362 |
373 |
377 |
1,464 |
|
357 |
348 |
330 |
338 |
1,373 |
|
353 |
353 |
358 |
1,064 |
| |
|
|
|
|
|
|
|
|
|
|
|
|
|
|
|
|
|
|
|
|
| Adjusted EBIT |
|
|
782 |
569 |
241 |
520 |
2,112 |
|
519 |
370 |
452 |
367 |
1,708 |
|
449 |
616 |
615 |
1,680 |
| |
Amortization of acquired intangible assets |
|
|
12 |
12 |
12 |
12 |
48 |
|
12 |
12 |
11 |
11 |
46 |
|
12 |
13 |
32 |
57 |
| |
Other expense (income), net |
1 |
|
(58) |
6 |
180 |
(90) |
38 |
|
61 |
426 |
23 |
193 |
703 |
|
142 |
86 |
(4) |
224 |
| |
Interest expense, net |
|
|
23 |
11 |
22 |
22 |
78 |
|
26 |
20 |
18 |
17 |
81 |
|
20 |
34 |
49 |
103 |
| |
|
|
|
|
|
|
|
|
|
|
|
|
|
|
|
|
|
|
|
|
| Income (loss) from operations before income taxes |
|
|
805 |
540 |
27 |
576 |
1,948 |
|
420 |
(88) |
400 |
146 |
878 |
|
275 |
483 |
538 |
1,296 |
| Income tax expense |
|
|
183 |
104 |
10 |
98 |
395 |
|
41 |
57 |
104 |
35 |
237 |
|
58 |
129 |
121 |
308 |
| |
|
|
|
|
|
|
|
|
|
|
|
|
|
|
|
|
|
|
|
|
| Net income (loss) |
|
|
622 |
436 |
17 |
478 |
1,553 |
|
379 |
(145) |
296 |
111 |
641 |
|
217 |
354 |
417 |
988 |
| (Income) loss attributable to non-controlling interests |
|
|
(7) |
(12) |
(6) |
(14) |
(39) |
|
(15) |
(11) |
(7) |
(16) |
(49) |
|
(8) |
(15) |
(23) |
(46) |
| |
|
|
|
|
|
|
|
|
|
|
|
|
|
|
|
|
|
|
|
|
| Net income (loss) attributable to Magna International Inc. |
|
|
615 |
424 |
11 |
464 |
1,514 |
|
364 |
(156) |
289 |
95 |
592 |
|
209 |
339 |
394 |
942 |
| |
|
|
|
|
|
|
|
|
|
|
|
|
|
|
|
|
|
|
|
|
| Diluted earnings (loss) per common share: |
|
|
$ 2.03 |
$ 1.40 |
$ 0.04 |
$ 1.54 |
$ 5.00 |
|
$ 1.22 |
$ (0.54) |
$ 1.00 |
$ 0.33 |
$ 2.03 |
|
$ 0.73 |
$ 1.18 |
$ 1.37 |
$ 3.29 |
| |
|
|
|
|
|
|
|
|
|
|
|
|
|
|
|
|
|
|
|
|
| Weighted average number of Common Shares outstanding |
|
|
|
|
|
|
|
|
|
|
|
|
|
|
|
|
|
|
| |
during the period (in millions): |
|
|
303.6 |
303.6 |
302.6 |
301.5 |
302.8 |
|
298.1 |
291.1 |
288.5 |
286.3 |
291.2 |
|
286.6 |
286.3 |
286.8 |
286.6 |
| |
|
|
|
|
|
|
|
|
|
|
|
|
|
|
|
|
|
|
|
|
| NON-GAAP MEASURES |
|
|
|
|
|
|
|
|
|
|
|
|
|
|
|
|
|
|
| |
|
|
|
|
|
|
|
|
|
|
|
|
|
|
|
|
|
|
|
|
| |
Adjusted EBITDA |
|
|
1,134 |
931 |
614 |
897 |
3,576 |
|
876 |
718 |
782 |
705 |
3,081 |
|
802 |
969 |
973 |
2,744 |
| |
|
|
|
|
|
|
|
|
|
|
|
|
|
|
|
|
|
|
|
|
| |
Adjusted EBIT |
2 |
|
782 |
569 |
241 |
520 |
2,112 |
|
519 |
370 |
452 |
367 |
1,708 |
|
449 |
616 |
615 |
1,680 |
| |
|
|
|
|
|
|
|
|
|
|
|
|
|
|
|
|
|
|
|
|
| |
Adjusted net income attributable to Magna International Inc. |
|
|
575 |
434 |
179 |
399 |
1,587 |
|
393 |
253 |
317 |
270 |
1,233 |
|
329 |
441 |
419 |
1,189 |
| |
|
|
|
|
|
|
|
|
|
|
|
|
|
|
|
|
|
|
|
|
| |
Adjusted Diluted earnings (loss) per common share |
|
|
$ 1.89 |
$ 1.43 |
$ 0.59 |
$ 1.32 |
$ 5.24 |
|
$ 1.32 |
$ 0.87 |
$ 1.10 |
$ 0.94 |
$ 4.24 |
|
$ 1.15 |
$ 1.54 |
$ 1.46 |
$ 4.15 |
| |
|
|
|
|
|
|
|
|
|
|
|
|
|
|
|
|
|
|
|
|
| |
|
|
|
|
|
|
|
|
|
|
|
|
|
|
|
|
|
|
|
|
| PROFITABILITY RATIOS |
|
|
|
|
|
|
|
|
|
|
|
|
|
|
|
|
|
|
| |
Selling, general and administrative /Sales |
|
|
4.2% |
4.6% |
5.7% |
4.5% |
4.7% |
|
4.0% |
4.4% |
4.2% |
5.0% |
4.4% |
|
4.6% |
4.6% |
4.6% |
4.6% |
| |
Adjusted EBIT /Sales |
|
|
7.7% |
6.3% |
3.0% |
5.7% |
5.8% |
|
5.4% |
4.0% |
4.9% |
3.8% |
4.5% |
|
4.2% |
5.6% |
5.8% |
5.2% |
| |
Operating income /Sales |
|
|
7.9% |
6.0% |
0.3% |
6.3% |
5.4% |
|
4.4% |
-0.9% |
4.3% |
1.5% |
2.3% |
|
2.6% |
4.4% |
5.0% |
4.0% |
| |
Effective tax rate |
|
|
|
|
|
|
|
|
|
|
|
|
|
|
|
|
|
|
| |
|
Reported |
|
|
22.7% |
19.3% |
37.0% |
17.0% |
20.3% |
|
9.8% |
-64.8% |
26.0% |
24.0% |
27.0% |
|
21.1% |
26.7% |
22.5% |
23.8% |
| |
|
Excluding Other expense (income) and amortization, net of taxes |
|
|
23.3% |
20.1% |
15.5% |
17.1% |
20.1% |
|
17.2% |
24.6% |
25.3% |
18.3% |
21.2% |
|
21.4% |
21.6% |
21.9% |
21.7% |
| FINANCIAL REVIEW OF MAGNA INTERNATIONAL INC. |
| CONSOLIDATED BALANCE SHEETS |
| (United States dollars in millions) (Unaudited) |
| |
|
|
|
|
|
|
|
|
|
|
|
|
|
|
|
|
|
|
| |
|
|
|
2021 |
|
|
2022 |
|
|
2023 |
| |
|
|
|
1st Q |
2nd Q |
3rd Q |
4th Q |
|
|
1st Q |
2nd Q |
3rd Q |
4th Q |
|
|
1st Q |
2nd Q |
3rd Q |
| FUNDS EMPLOYED |
|
|
|
|
|
|
|
|
|
|
|
|
|
|
|
|
| Current assets: |
|
|
|
|
|
|
|
|
|
|
|
|
|
|
|
|
| |
Accounts receivable |
|
7,176 |
6,531 |
6,082 |
6,307 |
|
|
7,006 |
6,764 |
7,082 |
6,791 |
|
|
7,959 |
8,556 |
8,477 |
| |
Inventories |
|
3,645 |
3,999 |
4,150 |
3,969 |
|
|
4,258 |
4,064 |
4,108 |
4,180 |
|
|
4,421 |
4,664 |
4,751 |
| |
Prepaid expenses and other |
|
290 |
294 |
247 |
278 |
|
|
310 |
262 |
269 |
320 |
|
|
367 |
455 |
387 |
| |
|
|
|
11,111 |
10,824 |
10,479 |
10,554 |
|
|
11,574 |
11,090 |
11,459 |
11,291 |
|
|
12,747 |
13,675 |
13,615 |
| Current liabilities: |
|
|
|
|
|
|
|
|
|
|
|
|
|
|
|
|
| |
Accounts payable |
|
6,787 |
6,248 |
5,914 |
6,465 |
|
|
6,845 |
6,443 |
6,624 |
6,999 |
|
|
7,731 |
7,984 |
7,911 |
| |
Accrued salaries and wages |
|
897 |
912 |
893 |
851 |
|
|
879 |
766 |
810 |
850 |
|
|
822 |
858 |
900 |
| |
Other accrued liabilities |
|
2,298 |
2,186 |
2,070 |
2,156 |
|
|
2,123 |
2,096 |
1,986 |
2,118 |
|
|
2,526 |
2,637 |
2,537 |
| |
Income taxes payable (receivable) |
|
109 |
123 |
125 |
200 |
|
|
190 |
136 |
97 |
93 |
|
|
9 |
(14) |
33 |
| |
|
|
|
10,091 |
9,469 |
9,002 |
9,672 |
|
|
10,037 |
9,441 |
9,517 |
10,060 |
|
|
11,088 |
11,465 |
11,381 |
| |
|
|
|
|
|
|
|
|
|
|
|
|
|
|
|
|
|
|
| Working capital |
|
1,020 |
1,355 |
1,477 |
882 |
|
|
1,537 |
1,649 |
1,942 |
1,231 |
|
|
1,659 |
2,210 |
2,234 |
| |
|
|
|
|
|
|
|
|
|
|
|
|
|
|
|
|
|
|
| Investments |
|
960 |
1,124 |
1,455 |
1,593 |
|
|
1,487 |
1,375 |
1,323 |
1,429 |
|
|
1,390 |
1,287 |
1,311 |
| Fixed assets, net |
|
8,305 |
8,297 |
8,166 |
8,293 |
|
|
8,090 |
7,723 |
7,470 |
8,173 |
|
|
8,304 |
8,646 |
8,778 |
| Goodwill, other assets and intangible assets |
|
3,614 |
3,632 |
3,530 |
3,577 |
|
|
3,544 |
3,353 |
3,280 |
3,576 |
|
|
3,640 |
4,733 |
4,726 |
| Operating lease right-of-use assets |
|
1,869 |
1,854 |
1,731 |
1,700 |
|
|
1,667 |
1,587 |
1,545 |
1,595 |
|
|
1,638 |
1,667 |
1,696 |
| Funds employed |
|
15,768 |
16,262 |
16,359 |
16,045 |
|
|
16,325 |
15,687 |
15,560 |
16,004 |
|
|
16,631 |
18,543 |
18,745 |
| FINANCING |
|
|
|
|
|
|
|
|
|
|
|
|
|
|
|
|
| Straight debt: |
|
|
|
|
|
|
|
|
|
|
|
|
|
|
|
|
| |
Cash and cash equivalents |
|
(3,464) |
(3,426) |
(2,748) |
(2,948) |
|
|
(1,996) |
(1,664) |
(1,102) |
(1,234) |
|
|
(2,429) |
(1,281) |
(1,022) |
| |
Short-term borrowings |
|
- |
- |
- |
- |
|
|
- |
- |
- |
8 |
|
|
4 |
150 |
2 |
| |
Long-term debt due within one year |
|
137 |
117 |
101 |
455 |
|
|
127 |
105 |
95 |
654 |
|
|
668 |
1,426 |
1,398 |
| |
Long-term debt |
|
3,935 |
3,941 |
3,908 |
3,538 |
|
|
3,501 |
3,408 |
3,325 |
2,847 |
|
|
4,500 |
4,159 |
4,135 |
| |
Current portion of operating lease liabilities |
|
244 |
278 |
269 |
274 |
|
|
276 |
270 |
266 |
276 |
|
|
285 |
303 |
384 |
| |
Operating lease liabilities |
|
1,613 |
1,563 |
1,438 |
1,406 |
|
|
1,369 |
1,294 |
1,254 |
1,288 |
|
|
1,318 |
1,345 |
1,289 |
| |
|
|
|
2,465 |
2,473 |
2,968 |
2,725 |
|
|
3,277 |
3,413 |
3,838 |
3,839 |
|
|
4,346 |
6,102 |
6,186 |
| Long-term employee benefit liabilities |
|
733 |
743 |
716 |
700 |
|
|
686 |
651 |
617 |
548 |
|
|
563 |
579 |
564 |
| Other long-term liabilities |
|
414 |
482 |
466 |
376 |
|
|
374 |
390 |
397 |
461 |
|
|
451 |
448 |
453 |
| Deferred tax liabilities, net |
|
104 |
124 |
40 |
19 |
|
|
(51) |
(111) |
(138) |
(179) |
|
|
(218) |
(242) |
(210) |
| |
|
|
|
1,251 |
1,349 |
1,222 |
1,095 |
|
|
1,009 |
930 |
876 |
830 |
|
|
796 |
785 |
807 |
| Shareholders' equity |
|
12,052 |
12,440 |
12,169 |
12,225 |
|
|
12,039 |
11,344 |
10,846 |
11,335 |
|
|
11,489 |
11,656 |
11,752 |
| |
|
|
|
15,768 |
16,262 |
16,359 |
16,045 |
|
|
16,325 |
15,687 |
15,560 |
16,004 |
|
|
16,631 |
18,543 |
18,745 |
| |
|
|
|
|
|
|
|
|
|
|
|
|
|
|
|
|
|
|
| ASSET UTILIZATION RATIOS |
|
|
|
|
|
|
|
|
|
|
|
|
|
|
|
|
| |
Days in accounts receivable |
|
63.4 |
65.1 |
69.1 |
62.3 |
|
|
65.4 |
65.0 |
68.8 |
63.9 |
|
|
67.1 |
70.1 |
71.4 |
| |
Days in accounts payable |
|
70.5 |
72.8 |
77.3 |
74.4 |
|
|
73.3 |
70.2 |
73.4 |
75.0 |
|
|
73.9 |
75.3 |
76.9 |
| |
Inventory turnover - cost of sales |
|
9.5 |
7.7 |
6.6 |
7.9 |
|
|
7.9 |
8.1 |
7.9 |
8.0 |
|
|
8.5 |
8.2 |
7.8 |
| |
Working capital turnover |
|
39.9 |
26.7 |
21.4 |
41.3 |
|
|
25.1 |
22.7 |
19.1 |
31.1 |
|
|
25.7 |
19.9 |
19.1 |
| |
Total asset turnover |
|
2.6 |
2.2 |
1.9 |
2.3 |
|
|
2.4 |
2.4 |
2.4 |
2.4 |
|
|
2.6 |
2.4 |
2.3 |
| |
|
|
|
|
|
|
|
|
|
|
|
|
|
|
|
|
|
|
| CAPITAL STRUCTURE |
|
|
|
|
|
|
|
|
|
|
|
|
|
|
|
|
| |
Straight debt |
|
15.6% |
15.2% |
18.1% |
17.0% |
|
|
20.1% |
21.8% |
24.7% |
24.0% |
|
|
26.1% |
32.9% |
33.0% |
| |
Long-term employee benefit liabilities, other long-term |
|
|
|
|
|
|
|
|
|
|
|
|
|
|
|
|
| |
|
liabilities & deferred tax liabilities, net |
|
7.9% |
8.3% |
7.5% |
6.8% |
|
|
6.2% |
5.9% |
5.6% |
5.2% |
|
|
4.8% |
4.2% |
4.3% |
| |
Shareholders' equity |
|
76.4% |
76.5% |
74.4% |
76.2% |
|
|
73.7% |
72.3% |
69.7% |
70.8% |
|
|
69.1% |
62.9% |
62.7% |
| |
|
|
|
100.0% |
100.0% |
100.0% |
100.0% |
|
|
100.0% |
100.0% |
100.0% |
100.0% |
|
|
100.0% |
100.0% |
100.0% |
| |
|
|
|
|
|
|
|
|
|
|
|
|
|
|
|
|
|
|
| |
Debt to total capitalization |
|
33.0% |
32.2% |
32.0% |
31.7% |
|
|
30.5% |
30.9% |
31.3% |
30.9% |
|
|
37.1% |
38.8% |
38.0% |
| |
|
|
|
|
|
|
|
|
|
|
|
|
|
|
|
|
|
|
| ANNUALIZED RETURNS |
|
|
|
|
|
|
|
|
|
|
|
|
|
|
|
|
| |
Return on equity (Net income attributable to Magna |
|
|
|
|
|
|
|
|
|
|
|
|
|
|
|
|
| |
|
International Inc. / Average shareholders' equity) |
|
20.7% |
13.8% |
0.4% |
15.2% |
|
|
12.0% |
-5.3% |
10.4% |
3.4% |
|
|
7.3% |
11.7% |
13.5% |
| |
Adjusted Return on equity (Adjusted Net income attributable |
|
|
|
|
|
|
|
|
|
|
|
|
|
|
|
|
| |
|
to Magna International Inc. / Average shareholders' equity) |
|
19.4% |
14.2% |
5.8% |
13.1% |
|
|
13.0% |
8.7% |
11.4% |
9.7% |
|
|
11.5% |
15.2% |
14.3% |
| |
Return on Invested Capital (Annualized after-tax operating |
|
|
|
|
|
|
|
|
|
|
|
|
|
|
|
|
| |
|
profits / invested capital) |
|
16.3% |
11.1% |
0.9% |
12.2% |
|
|
9.9% |
-3.2% |
7.9% |
3.2% |
|
|
5.7% |
8.7% |
9.8% |
| |
Adjusted Return on Invested Capital (Adjusted Annualized after-tax |
|
|
|
|
|
|
|
|
|
|
|
|
|
|
|
|
| |
|
operating profits / invested capital) |
|
15.3% |
11.4% |
5.0% |
10.6% |
|
|
10.6% |
7.0% |
8.6% |
7.6% |
|
|
8.7% |
11.0% |
10.3% |
| FINANCIAL REVIEW OF MAGNA INTERNATIONAL INC. |
| CONSOLIDATED STATEMENTS OF CASH FLOWS |
| (United States dollars in millions) (Unaudited) |
| |
|
|
|
|
|
|
|
|
|
|
|
|
|
|
|
|
|
|
|
|
|
|
| |
|
|
|
|
|
|
2021 |
|
2022 |
|
2023 |
| Cash provided from (used for): |
Note |
|
1st Q |
2nd Q |
3rd Q |
4th Q |
TOTAL |
|
1st Q |
2nd Q |
3rd Q |
4th Q |
TOTAL |
|
1st Q |
2nd Q |
3rd Q |
TOTAL |
| |
|
|
|
|
|
|
|
|
|
|
|
|
|
|
| Operating activities |
|
|
|
|
|
|
|
|
|
|
|
|
|
|
|
|
|
|
| |
Net income (loss) |
|
|
622 |
436 |
17 |
478 |
1,553 |
|
379 |
(145) |
296 |
127 |
657 |
|
217 |
354 |
417 |
988 |
| |
Items not involving current cash flows |
(i) |
|
349 |
341 |
515 |
371 |
1,576 |
|
370 |
705 |
295 |
406 |
1,776 |
|
351 |
525 |
404 |
1,280 |
| |
|
|
|
|
(i) |
|
971 |
777 |
532 |
849 |
3,129 |
|
749 |
560 |
591 |
533 |
2,433 |
|
568 |
879 |
821 |
2,268 |
| |
Changes in operating assets and liabilities |
(i) |
|
(310) |
(249) |
(132) |
502 |
(189) |
|
(569) |
(139) |
(353) |
723 |
(338) |
|
(341) |
(332) |
(24) |
(697) |
| Cash provided from operating activities |
|
|
661 |
528 |
400 |
1,351 |
2,940 |
|
180 |
421 |
238 |
1,256 |
2,095 |
|
227 |
547 |
797 |
1,571 |
| |
|
|
|
|
|
|
|
|
|
|
|
|
|
|
|
|
|
|
|
|
|
|
| Investment activities |
|
|
|
|
|
|
|
|
|
|
|
|
|
|
|
|
|
|
| |
Fixed asset additions |
|
|
(212) |
(277) |
(334) |
(549) |
(1,372) |
|
(238) |
(329) |
(364) |
(750) |
(1,681) |
|
(424) |
(502) |
(630) |
(1,556) |
| |
Increase in equity method investment |
|
|
- |
- |
(454) |
(63) |
(517) |
|
- |
- |
- |
- |
- |
|
- |
- |
- |
- |
| |
Increase in investments, other assets and intangible assets |
|
|
(104) |
(93) |
(101) |
(105) |
(403) |
|
(64) |
(80) |
(125) |
(186) |
(455) |
|
(101) |
(96) |
(176) |
(373) |
| |
Net cash (outflow) inflow from disposal of facilities |
1(c), 1(f) |
|
- |
- |
(41) |
- |
(41) |
|
6 |
- |
- |
- |
6 |
|
(25) |
- |
(23) |
(48) |
| |
Increase in public and private equity investments |
|
|
(3) |
(17) |
(3) |
(45) |
(68) |
|
(2) |
(2) |
(25) |
- |
(29) |
|
- |
(3) |
(7) |
(10) |
| |
Settlement of long-term receivable from non-consolidated joint venture |
|
50 |
- |
- |
- |
50 |
|
- |
- |
- |
- |
- |
|
- |
- |
- |
- |
| |
Proceeds from disposition |
|
|
19 |
20 |
10 |
32 |
81 |
|
23 |
40 |
41 |
20 |
124 |
|
19 |
44 |
32 |
95 |
| |
Business combinations |
|
|
39 |
(21) |
- |
(31) |
(13) |
|
- |
- |
- |
(3) |
(3) |
|
- |
(1,475) |
- |
(1,475) |
| Cash used for investment activities |
|
|
(211) |
(388) |
(923) |
(761) |
(2,283) |
|
(275) |
(371) |
(473) |
(919) |
(2,038) |
|
(531) |
(2,032) |
(804) |
(3,367) |
| |
|
|
|
|
|
|
|
|
|
|
|
|
|
|
|
|
|
|
|
|
|
|
| Financing activities |
|
|
|
|
|
|
|
|
|
|
|
|
|
|
|
|
|
|
| |
Net issues (repayments) of debt |
|
|
(126) |
(33) |
(13) |
5 |
(167) |
|
(328) |
(31) |
(10) |
(22) |
(391) |
|
1,636 |
544 |
(135) |
2,045 |
| |
Common Shares issued on exercise of stock options |
|
|
83 |
50 |
3 |
10 |
146 |
|
4 |
- |
1 |
3 |
8 |
|
6 |
- |
8 |
14 |
| |
Repurchase of Common Shares |
|
|
(162) |
(99) |
(5) |
(251) |
(517) |
|
(383) |
(212) |
(180) |
(5) |
(780) |
|
(9) |
(2) |
- |
(11) |
| |
Tax withholdings on vesting of equity awards |
|
|
(12) |
- |
- |
(1) |
(13) |
|
(14) |
(1) |
- |
- |
(15) |
|
(9) |
(1) |
- |
(10) |
| |
Contributions to subsidiaries by non-controlling interests |
|
|
- |
- |
- |
8 |
8 |
|
- |
5 |
- |
- |
5 |
|
- |
- |
- |
- |
| |
Dividends paid to non-controlling interests |
|
|
- |
(8) |
(2) |
(39) |
(49) |
|
- |
(12) |
(10) |
(24) |
(46) |
|
(7) |
(24) |
(18) |
(49) |
| |
Dividends paid |
|
|
(130) |
(127) |
(130) |
(127) |
(514) |
|
(133) |
(130) |
(125) |
(126) |
(514) |
|
(132) |
(129) |
(128) |
(389) |
| Cash provided from (used for) financing activities |
|
|
(347) |
(217) |
(147) |
(395) |
(1,106) |
|
(854) |
(381) |
(324) |
(174) |
(1,733) |
|
1,485 |
388 |
(273) |
1,600 |
| Effect of exchange rate changes on cash, cash equivalents |
|
|
|
|
|
|
|
|
|
|
|
|
|
|
|
|
|
|
| |
and restricted cash equivalents |
|
|
(13) |
39 |
(8) |
5 |
23 |
|
(3) |
(1) |
(3) |
(31) |
(38) |
|
14 |
(51) |
21 |
(16) |
| Net increase (decrease) in cash, cash equivalents |
|
|
|
|
|
|
|
|
|
|
|
|
|
|
|
|
|
|
| |
and restricted cash equivalents during the period |
|
|
90 |
(38) |
(678) |
200 |
(426) |
|
(952) |
(332) |
(562) |
132 |
(1,714) |
|
1,195 |
(1,148) |
(259) |
(212) |
| Cash, cash equivalents and restricted cash equivalents, |
|
|
|
|
|
|
|
|
|
|
|
|
|
|
|
|
|
|
| |
beginning of period |
|
|
3,374 |
3,464 |
3,426 |
2,748 |
3,374 |
|
2,948 |
1,996 |
1,664 |
1,102 |
2,948 |
|
1,234 |
2,429 |
1,281 |
1,234 |
| Cash, cash equivalents and restricted cash equivalents, |
|
|
|
|
|
|
|
|
|
|
|
|
|
|
|
|
|
|
| |
end of period |
|
|
3,464 |
3,426 |
2,748 |
2,948 |
2,948 |
|
1,996 |
1,664 |
1,102 |
1,234 |
1,234 |
|
2,429 |
1,281 |
1,022 |
1,022 |
| |
|
|
|
|
|
|
|
|
|
|
|
|
|
|
|
|
|
|
|
|
|
|
| |
|
|
|
(i) Certain amounts in prior periods have been reclassified to conform with current period presentation. |
| FINANCIAL REVIEW OF MAGNA INTERNATIONAL INC. |
| (United States dollars in millions, except per share figures) (Unaudited) |
| |
|
This Analyst should be read in conjunction with the audited consolidated financial statements for the year ended December 31, 2022. |
| |
|
|
|
|
|
|
|
|
|
|
|
|
|
|
|
|
|
|
|
|
|
|
| Note 1: |
OTHER EXPENSE (INCOME), NET |
| |
|
Other expense (income), net consists of: |
| |
|
|
|
|
|
|
2021 |
|
2022 |
|
2023 |
| |
|
|
|
|
|
|
1st Q |
2nd Q |
3rd Q |
4th Q |
TOTAL |
|
1st Q |
2nd Q |
3rd Q |
4th Q |
TOTAL |
|
1st Q |
2nd Q |
3rd Q |
TOTAL |
| |
|
|
|
|
|
|
|
|
|
|
|
|
|
|
|
|
|
|
|
|
|
|
| |
|
Investment revaluations, (gains) losses on sales, and impairments |
[a] |
|
(33) |
(38) |
81 |
(8) |
2 |
|
61 |
50 |
9 |
101 |
221 |
|
24 |
98 |
(19) |
103 |
| |
|
Restructuring |
[b] |
|
15 |
44 |
12 |
18 |
89 |
|
- |
- |
- |
22 |
22 |
|
118 |
(35) |
(1) |
82 |
| |
|
Operations in Russia |
[c] |
|
- |
- |
- |
- |
- |
|
- |
376 |
- |
- |
376 |
|
- |
- |
16 |
16 |
| |
|
Veoneer related termination fees and transaction costs |
[d] |
|
- |
- |
- |
(100) |
(100) |
|
- |
- |
- |
- |
- |
|
- |
23 |
- |
23 |
| |
|
Impairments |
[e] |
|
- |
- |
12 |
- |
12 |
|
- |
- |
14 |
12 |
26 |
|
- |
- |
- |
- |
| |
|
Loss on sale of business |
[f] |
|
- |
- |
75 |
- |
75 |
|
- |
- |
- |
58 |
58 |
|
- |
- |
- |
- |
| |
|
Gain on business combinations |
[g] |
|
(40) |
- |
- |
- |
(40) |
|
- |
- |
- |
- |
- |
|
- |
- |
- |
- |
| |
|
|
|
|
|
|
|
|
|
|
|
|
|
|
|
|
|
|
|
- |
|
|
| |
|
|
|
|
|
|
(58) |
6 |
180 |
(90) |
38 |
|
61 |
426 |
23 |
193 |
703 |
|
142 |
86 |
(4) |
224 |
| |
[a] |
Investment revaluations, (gains) losses on sales, and impairments |
|
|
|
|
|
|
|
|
|
|
|
|
|
|
|
|
|
| |
|
The Company revalues its public and private equity investments and certain public company warrants every quarter. The gains and losses related to this revaluation, as well as gain and losses on disposition, are recorded in Corporate. In the second quarter of 2023, the Company recorded a non-cash impairment charge of $85 million on a private equity investment and related long-term receivables within Other assets in its Corporate segment. |
| |
|
|
| |
[b] |
Restructuring |
| |
|
Reversal of restructuring charges: |
| |
|
During the second quarter of 2023, the Company’s Power & Vision segment reversed $39 million of charges due to a change in the restructuring plans related to a plant closure. |
| |
|
|
| |
|
Sale of buildings as a result of restructuring activities: |
| |
|
During the second and third quarter of 2023, the Company’s Power & Vision segment recorded a $10 million and $8 million gain on the sale of a building as a result of restructuring activities, respectively. |
| |
|
|
| |
|
Other Restructuring: |
|
|
2021 |
|
2022 |
|
2023 |
| |
|
|
|
|
|
|
1st Q |
2nd Q |
3rd Q |
4th Q |
TOTAL |
|
1st Q |
2nd Q |
3rd Q |
4th Q |
TOTAL |
|
1st Q |
2nd Q |
3rd Q |
TOTAL |
| |
|
Power & Vision |
|
|
15 |
44 |
4 |
4 |
67 |
|
- |
- |
- |
22 |
22 |
|
105 |
5 |
7 |
117 |
| |
|
Body Exteriors & Structures |
|
|
- |
- |
8 |
- |
8 |
|
- |
- |
- |
- |
- |
|
13 |
9 |
- |
22 |
| |
|
Seating Systems |
|
|
- |
- |
- |
14 |
14 |
|
- |
- |
- |
- |
- |
|
- |
- |
- |
- |
| |
|
|
|
|
|
|
15 |
44 |
12 |
18 |
89 |
|
- |
- |
- |
22 |
22 |
|
118 |
14 |
7 |
139 |
| |
[c] |
Operations in Russia |
|
|
|
|
|
|
|
|
|
|
|
|
|
|
|
|
|
|
| |
|
As a result of the expected lack of future cashflows and the continuing uncertainties connected with the Russian economy, during the second quarter of 2022, the Company recorded a $376 million impairment charge related to its investment in Russia. This included net asset impairments of $173 million and a $203 million reserve against the related foreign currency translation losses that were included in accumulated other comprehensive loss. The net asset impairments consisted of $163 million and $10 million in our Body Exteriors & Structures and our Seating Systems segments, respectively.
During the third quarter of 2023, the Company completed the sale of all of its investments in Russia resulting in a loss of $16 million including a net cash outflow of $23 million. |
| |
|
|
| |
[d] |
Veoneer related termination fees and transaction costs |
| |
|
During 2023, the Company incurred $23 million of transaction costs related to the acquisition of the Veoneer Active Safety Business.
In the fourth quarter of 2021, Veoneer, Inc. (“Veoneer”) terminated its merger agreement with Magna. In connection with the termination of the merger agreement, Veoneer paid the Company a termination fee which, net of the Company’s associated transaction costs, amounted to $100 million. |
| |
|
|
| |
[e] |
Impairments |
|
|
2021 |
|
2022 |
|
2023 |
| |
|
|
|
|
|
|
1st Q |
2nd Q |
3rd Q |
4th Q |
TOTAL |
|
1st Q |
2nd Q |
3rd Q |
4th Q |
TOTAL |
|
1st Q |
2nd Q |
3rd Q |
TOTAL |
| |
|
Body Exteriors & Structures |
|
|
- |
- |
8 |
- |
8 |
|
- |
- |
10 |
12 |
22 |
|
- |
- |
- |
- |
| |
|
Power & Vision |
|
|
- |
- |
- |
- |
- |
|
- |
- |
4 |
- |
4 |
|
- |
- |
- |
- |
| |
|
Seating Systems |
|
|
- |
- |
4 |
- |
4 |
|
- |
- |
- |
- |
- |
|
- |
- |
- |
- |
| |
|
|
|
|
|
|
- |
- |
12 |
- |
12 |
|
- |
- |
14 |
12 |
26 |
|
- |
- |
- |
- |
| |
[f] |
Loss on sale of business |
|
|
|
|
|
|
|
|
|
|
|
|
|
|
|
|
|
|
| |
|
During the fourth quarter of 2022, the Company entered into an agreement to sell a European Power & Vision operation. Under the terms of the arrangement, the Company is contractually obligated to provide the buyer with up to $42 million of funding, resulting in a loss of $58 million. During the first quarter of 2023, the Company completed the sale of this operation which resulted in a net cash outflow of $25 million.
During the third quarter of 2021, the Company sold three Body Exteriors & Structures operations in Germany. Under the terms of the arrangement, the Company provided the buyer with $41 million of funding, resulting in a loss on disposal of $75 million. |
| |
|
|
| |
[g] |
Gain on business combinations |
| |
|
In Seating Systems, during the first quarter of 2021, the Company recognized a $22 million gain on the on the change in basis of accounting for its previously held equity method investments. Also during the first quarter of 2021, in Power & Vision, substantially all of the assets of the Company's European joint venture with Ford Motor Company, Getrag Ford Transmission GmbH, were distributed to either Ford or the Company, which resulted in the Company recording a gain of $18 million. |
| Note 2: |
NON-GAAP MEASURES |
| |
|
The Company presents Adjusted EBIT (Earnings before interest, taxes, Other expense (income),net, and amortization of acquired intangible assets), Adjusted Net Income (Net Income before Other expense (income),net, net of tax excluding significant income tax valuation allowance adjustments, and amortization of acquired intangible assets), Adjusted Diluted Earnings per Share and Adjusted EBIT as a percentage of sales, Adjusted Return on Invested Capital and Adjusted Return on Equity. Effective July 1, 2023, the Company revised its calculation of Adjusted EBIT, Adjusted diluted earnings per share and Adjusted Return on Invested Capital to exclude the amortization of acquired intangibles assets. The Company presents these financial figures because such measures are widely used by analysts and investors in evaluating the operating performance of the Company. However, such measures do not have any standardized meaning under U.S. generally accepted accounting principles and may not be comparable to the calculation of similar measures by other companies. Adjusted EBIT, Adjusted Net Income and Adjusted diluted earnings per share presented in the tables below, including for the prior period, have been updated to reflect the revised calculation. |
| |
|
|
| |
|
The following table reconciles Income (loss) from operations before income taxes to Adjusted EBIT: |
|
|
|
|
|
|
|
|
|
|
|
|
|
| |
|
|
|
|
|
|
|
|
|
|
|
|
|
|
|
| |
|
|
|
|
|
|
2021 |
|
2022 |
|
2023 |
| |
|
|
|
|
|
|
1st Q |
2nd Q |
3rd Q |
4th Q |
TOTAL |
|
1st Q |
2nd Q |
3rd Q |
4th Q |
TOTAL |
|
1st Q |
2nd Q |
3rd Q |
TOTAL |
| |
|
|
|
|
|
|
|
|
|
|
|
|
|
|
|
|
|
|
|
|
|
|
| |
|
Income (loss) from operations before income taxes |
|
|
805 |
540 |
27 |
576 |
1,948 |
|
420 |
(88) |
400 |
146 |
878 |
|
275 |
483 |
538 |
1,296 |
| |
|
|
Exclude: |
|
|
|
|
|
|
|
|
|
|
|
|
|
|
|
|
|
|
| |
|
|
|
Amortization of acquired intangible assets |
|
|
12 |
12 |
12 |
12 |
48 |
|
12 |
12 |
11 |
11 |
46 |
|
12 |
13 |
32 |
57 |
| |
|
|
|
Other expense (income), net |
|
|
(58) |
6 |
180 |
(90) |
38 |
|
61 |
426 |
23 |
193 |
703 |
|
142 |
86 |
(4) |
224 |
| |
|
|
|
Interest expense |
|
|
23 |
11 |
22 |
22 |
78 |
|
26 |
20 |
18 |
17 |
81 |
|
20 |
34 |
49 |
103 |
| |
|
Adjusted EBIT |
|
|
782 |
569 |
241 |
520 |
2,112 |
|
519 |
370 |
452 |
367 |
1,708 |
|
449 |
616 |
615 |
1,680 |
| |
|
|
|
|
|
|
|
|
|
|
|
|
|
|
|
|
|
|
|
|
|
|
| |
|
The following table reconciles Net income (loss) attributable to Magna International Inc. to Adjusted net income attributable to Magna International Inc.: |
| |
|
|
| |
|
|
|
|
|
|
2021 |
|
2022 |
|
2023 |
| |
|
|
|
|
|
|
1st Q |
2nd Q |
3rd Q |
4th Q |
TOTAL |
|
1st Q |
2nd Q |
3rd Q |
4th Q |
TOTAL |
|
1st Q |
2nd Q |
3rd Q |
TOTAL |
| |
|
|
|
|
|
|
|
|
|
|
|
|
|
|
|
|
|
|
|
|
|
|
| |
|
Net income (loss) attributable to Magna International Inc. |
|
|
615 |
424 |
11 |
464 |
1,514 |
|
364 |
(156) |
289 |
95 |
592 |
|
209 |
339 |
394 |
942 |
| |
|
|
Exclude: |
|
|
|
|
|
|
|
|
|
|
|
|
|
|
|
|
|
|
| |
|
|
|
Investment revaluations, (gains) losses on sales, and impairments |
|
(24) |
(29) |
64 |
(2) |
9 |
|
48 |
38 |
7 |
75 |
168 |
|
18 |
95 |
(14) |
99 |
| |
|
|
|
Impairments |
|
|
- |
- |
9 |
- |
9 |
|
- |
361 |
12 |
12 |
385 |
|
- |
- |
- |
- |
| |
|
|
|
Operations in Russia |
|
|
- |
- |
- |
- |
- |
|
- |
- |
- |
- |
- |
|
- |
- |
16 |
16 |
| |
|
|
|
Amortization of acquired intangible assets |
|
|
9 |
8 |
9 |
8 |
34 |
|
10 |
10 |
9 |
9 |
38 |
|
10 |
11 |
25 |
46 |
| |
|
|
|
Restructuring |
|
|
15 |
31 |
11 |
17 |
74 |
|
- |
- |
- |
22 |
22 |
|
92 |
(26) |
(2) |
64 |
| |
|
|
|
Veoneer related termination fees and transaction costs |
|
|
- |
- |
- |
(75) |
(75) |
|
- |
- |
- |
- |
- |
|
- |
22 |
- |
22 |
| |
|
|
|
Net losses on the sale of business |
|
|
- |
- |
75 |
- |
75 |
|
- |
- |
- |
57 |
57 |
|
- |
- |
- |
- |
| |
|
|
|
Adjustments to Deferred Tax Valuation Allowance |
[i] |
|
- |
- |
- |
(13) |
(13) |
|
(29) |
- |
- |
- |
(29) |
|
- |
- |
- |
- |
| |
|
|
|
Gain on business combinations |
|
|
(40) |
- |
- |
- |
(40) |
|
- |
- |
- |
- |
- |
|
- |
- |
- |
- |
| |
|
Adjusted net income attributable to Magna International Inc. |
|
|
575 |
434 |
179 |
399 |
1,587 |
|
393 |
253 |
317 |
270 |
1,233 |
|
329 |
441 |
419 |
1,189 |
| |
|
|
|
|
|
|
|
|
|
|
|
|
|
|
|
|
|
|
|
|
|
|
| |
|
The following table reconciles diluted earnings (loss) per common share to Adjusted diluted earnings (loss) per common share: |
| |
|
|
| |
|
|
|
|
|
|
2021 |
|
2022 |
|
2023 |
| |
|
|
|
|
|
|
1st Q |
2nd Q |
3rd Q |
4th Q |
TOTAL |
|
1st Q |
2nd Q |
3rd Q |
4th Q |
TOTAL |
|
1st Q |
2nd Q |
3rd Q |
TOTAL |
| |
|
|
|
|
|
|
|
|
|
|
|
|
|
|
|
|
|
|
|
|
|
|
| |
|
Diluted earnings (loss) per common share |
|
|
$ 2.03 |
$ 1.40 |
$ 0.04 |
$ 1.54 |
$ 5.00 |
|
$ 1.22 |
$ (0.54) |
$ 1.00 |
$ 0.33 |
$ 2.03 |
|
$ 0.73 |
1.18 |
1.37 |
$ 3.29 |
| |
|
|
Exclude: |
|
|
|
|
|
|
|
|
|
|
|
|
|
|
|
|
|
|
| |
|
|
|
Investment revaluations, (gains) losses on sales, and impairments |
|
(0.08) |
(0.10) |
0.21 |
(0.01) |
0.03 |
|
0.16 |
0.13 |
0.03 |
0.26 |
0.58 |
|
0.07 |
0.33 |
(0.06) |
0.35 |
| |
|
|
|
Impairments |
|
|
- |
- |
0.03 |
- |
0.03 |
|
- |
1.24 |
0.04 |
0.04 |
1.32 |
|
- |
- |
- |
- |
| |
|
|
|
Operations in Russia |
|
|
- |
- |
- |
- |
- |
|
- |
- |
- |
- |
- |
|
- |
- |
0.06 |
0.06 |
| |
|
|
|
Amortization of acquired intangible assets |
|
|
0.03 |
0.04 |
0.03 |
0.02 |
0.11 |
|
0.04 |
0.03 |
0.03 |
0.03 |
0.13 |
|
0.04 |
0.04 |
0.09 |
0.15 |
| |
|
|
|
Restructuring |
|
|
0.05 |
0.10 |
0.03 |
0.06 |
0.24 |
|
- |
- |
- |
0.08 |
0.08 |
|
0.31 |
(0.09) |
- |
0.22 |
| |
|
|
|
Veoneer related termination fees and transaction costs |
|
|
- |
- |
- |
(0.25) |
(0.25) |
|
- |
- |
- |
- |
- |
|
- |
0.08 |
- |
0.08 |
| |
|
|
|
Net losses on the sale of business |
|
|
- |
- |
0.25 |
- |
0.25 |
|
- |
- |
- |
0.20 |
0.20 |
|
- |
- |
- |
- |
| |
|
|
|
Adjustments to Deferred Tax Valuation Allowance |
[i] |
|
- |
- |
- |
(0.04) |
(0.04) |
|
(0.10) |
- |
- |
- |
(0.10) |
|
- |
- |
- |
- |
| |
|
|
|
Gain on business combinations |
|
|
(0.14) |
- |
- |
- |
(0.13) |
|
- |
- |
- |
- |
- |
|
- |
- |
- |
- |
| |
|
|
|
|
|
|
|
|
|
|
|
|
|
|
|
|
|
|
|
|
|
|
| |
|
Adjusted diluted earnings per common share |
|
|
$ 1.89 |
$ 1.43 |
$ 0.59 |
$ 1.32 |
$ 5.24 |
|
$ 1.32 |
$ 0.87 |
$ 1.10 |
$ 0.94 |
$ 4.24 |
|
$ 1.15 |
$ 1.54 |
$ 1.46 |
$ 4.15 |
| |
|
|
| |
|
[i] Adjustments to Deferred Tax Valuation Allowance |
| |
|
In the fourth quarter of 2021, and first quarter of 2022, the Company recorded adjustments to the valuation allowance against its deferred tax assets in certain European countries and North America. The net effect of these adjustments was a reduction in income tax expense of $13 million and $29 million, respectively. |
| Note 3: |
SEGMENTED INFORMATION |
| |
|
|
| |
|
|
|
|
|
|
2021 |
|
2022 |
|
2023 |
| |
|
|
|
|
|
|
1st Q |
2nd Q |
3rd Q |
4th Q |
TOTAL |
|
1st Q |
2nd Q |
3rd Q |
4th Q |
TOTAL |
|
1st Q |
2nd Q |
3rd Q |
TOTAL |
| |
|
Body Exteriors & Structures |
|
|
|
|
|
|
|
|
|
|
| |
|
|
Sales |
|
|
4,025 |
3,647 |
3,185 |
3,620 |
14,477 |
|
4,077 |
3,947 |
3,976 |
4,004 |
16,004 |
|
4,439 |
4,540 |
4,354 |
13,333 |
| |
|
|
Adjusted EBIT |
|
|
329 |
230 |
100 |
171 |
830 |
|
231 |
194 |
227 |
200 |
852 |
|
272 |
394 |
358 |
1,024 |
| |
|
|
Adjusted EBIT as a percentage of sales |
|
|
8.2% |
6.3% |
3.1% |
4.7% |
5.7% |
|
5.7% |
4.9% |
5.7% |
5.0% |
5.3% |
|
6.1% |
8.7% |
8.2% |
7.7% |
| |
|
|
|
|
|
|
|
|
|
|
|
|
|
|
|
|
|
|
|
|
|
|
| |
|
Power & Vision |
|
|
|
|
|
|
|
|
|
|
|
|
|
|
|
|
|
|
| |
|
|
Sales |
|
|
3,156 |
2,881 |
2,501 |
2,804 |
11,342 |
|
3,046 |
2,888 |
2,911 |
3,016 |
11,861 |
|
3,323 |
3,462 |
3,745 |
10,530 |
| |
|
|
Adjusted EBIT |
|
|
306 |
210 |
77 |
178 |
771 |
|
163 |
99 |
124 |
116 |
502 |
|
92 |
124 |
221 |
437 |
| |
|
|
Adjusted EBIT as a percentage of sales |
|
|
9.7% |
7.3% |
3.1% |
6.3% |
6.8% |
|
5.4% |
3.4% |
4.3% |
3.8% |
4.2% |
|
2.8% |
3.6% |
5.9% |
4.2% |
| |
|
|
|
|
|
|
|
|
|
|
|
|
|
|
|
|
|
|
|
|
|
|
| |
|
Seating Systems |
|
|
|
|
|
|
|
|
|
|
|
|
|
|
|
|
|
|
| |
|
|
Sales |
|
|
1,303 |
1,166 |
1,123 |
1,299 |
4,891 |
|
1,376 |
1,253 |
1,295 |
1,345 |
5,269 |
|
1,486 |
1,603 |
1,529 |
4,618 |
| |
|
|
Adjusted EBIT |
|
|
56 |
28 |
22 |
51 |
157 |
|
50 |
3 |
37 |
14 |
104 |
|
37 |
67 |
70 |
174 |
| |
|
|
Adjusted EBIT as a percentage of sales |
|
|
4.3% |
2.4% |
2.0% |
3.9% |
3.2% |
|
3.6% |
0.2% |
2.9% |
1.0% |
2.0% |
|
2.5% |
4.2% |
4.6% |
3.8% |
| |
|
|
|
|
|
|
|
|
|
|
|
|
|
|
|
|
|
|
|
|
|
|
| |
|
Complete Vehicles |
|
|
|
|
|
|
|
|
|
|
|
|
|
|
|
|
|
|
| |
|
|
Sales |
|
|
1,850 |
1,490 |
1,255 |
1,511 |
6,106 |
|
1,275 |
1,403 |
1,213 |
1,330 |
5,221 |
|
1,626 |
1,526 |
1,185 |
4,337 |
| |
|
|
Adjusted EBIT |
|
|
80 |
79 |
30 |
98 |
287 |
|
50 |
63 |
65 |
57 |
235 |
|
52 |
34 |
(5) |
81 |
| |
|
|
Adjusted EBIT as a percentage of sales |
|
|
4.3% |
5.3% |
2.4% |
6.5% |
4.7% |
|
3.9% |
4.5% |
5.4% |
4.3% |
4.5% |
|
3.2% |
2.2% |
-0.4% |
1.9% |
| |
|
|
|
|
|
|
|
|
|
|
|
|
|
|
|
|
|
|
|
|
|
|
| |
|
Corporate and other |
|
|
|
|
|
|
|
|
|
|
|
|
|
|
|
|
|
|
| |
|
|
Intercompany eliminations |
|
|
(155) |
(150) |
(145) |
(124) |
(574) |
|
(132) |
(129) |
(127) |
(127) |
(515) |
|
(201) |
(149) |
(125) |
(475) |
| |
|
|
Adjusted EBIT |
|
|
11 |
22 |
12 |
22 |
67 |
|
25 |
11 |
(1) |
(20) |
15 |
|
(4) |
(3) |
(29) |
(36) |
| |
|
|
|
|
|
|
|
|
|
|
|
|
|
|
|
|
|
|
|
|
|
|
| |
|
Total |
|
|
|
|
|
|
|
|
|
|
|
|
|
|
|
|
|
|
|
| |
|
|
Sales |
|
|
10,179 |
9,034 |
7,919 |
9,110 |
36,242 |
|
9,642 |
9,362 |
9,268 |
9,568 |
37,840 |
|
10,673 |
10,982 |
10,688 |
32,343 |
| |
|
|
Adjusted EBIT |
|
|
782 |
569 |
241 |
520 |
2,112 |
|
519 |
370 |
452 |
367 |
1,708 |
|
449 |
616 |
615 |
1,680 |
| |
|
|
Adjusted EBIT as a percentage of sales |
|
|
7.7% |
6.3% |
3.0% |
5.7% |
5.8% |
|
5.4% |
4.0% |
4.9% |
3.8% |
4.5% |
|
4.2% |
5.6% |
5.8% |
5.2% |
Page 6 of 6
Exhibit 99.2

Q3 - 2023 Results November 3, 2023
Louis Tonelli Vice President, Investor Relations Q3 - 2023 RESULTS 2
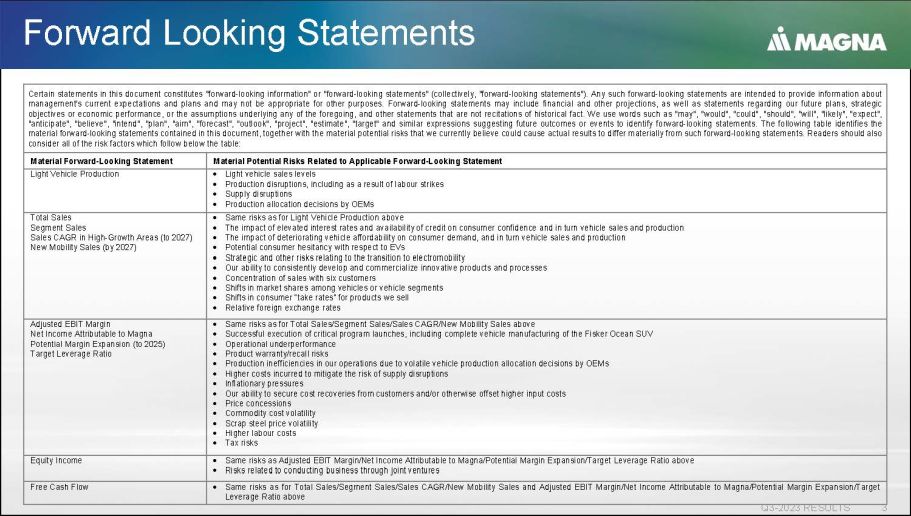
Forward Looking Statements Q3 - 2023 RESULTS 3 Certain statements in this document constitutes "forward - looking information" or "forward - looking statements" (collectively, "forward - looking statements") . Any such forward - looking statements are intended to provide information about management's current expectations and plans and may not be appropriate for other purposes . Forward - looking statements may include financial and other projections, as well as statements regarding our future plans, strategic objectives or economic performance, or the assumptions underlying any of the foregoing, and other statements that are not recitations of historical fact . We use words such as "may", "would", "could", "should", "will", "likely", "expect", "anticipate", "believe", "intend", "plan", "aim", "forecast", "outlook", "project", "estimate", "target" and similar expressions suggesting future outcomes or events to identify forward - looking statements . The following table identifies the material forward - looking statements contained in this document, together with the material potential risks that we currently believe could cause actual results to differ materially from such forward - looking statements . Readers should also consider all of the risk factors which follow below the table : Material Potential Risks Related to Applicable Forward - Looking Statement Material Forward - Looking Statement Light vehicle sales levels Production disruptions, including as a result of labour strikes Supply disruptions Production allocation decisions by OEMs Light Vehicle Production Same risks as for Light Vehicle Production above The impact of elevated interest rates and availability of credit on consumer confidence and in turn vehicle sales and production The impact of deteriorating vehicle affordability on consumer demand, and in turn vehicle sales and production Potential consumer hesitancy with respect to EVs Strategic and other risks relating to the transition to electromobility Our ability to consistently develop and commercialize innovative products and processes Concentration of sales with six customers Shifts in market shares among vehicles or vehicle segments Shifts in consumer “take rates” for products we sell Relative foreign exchange rates Total Sales Segment Sales Sales CAGR in High - Growth Areas (to 2027 ) New Mobility Sales (by 2027 ) Same risks as for Total Sales/Segment Sales/Sales CAGR/New Mobility Sales above Successful execution of critical program launches, including complete vehicle manufacturing of the Fisker Ocean SUV Operational underperformance Product warranty/recall risks Production inefficiencies in our operations due to volatile vehicle production allocation decisions by OEMs Higher costs incurred to mitigate the risk of supply disruptions Inflationary pressures Our ability to secure cost recoveries from customers and/or otherwise offset higher input costs Price concessions Commodity cost volatility Scrap steel price volatility Higher labour costs Tax risks Adjusted EBIT Margin Net Income Attributable to Magna Potential Margin Expansion (to 2025 ) Target Leverage Ratio Same risks as Adjusted EBIT Margin/Net Income Attributable to Magna/Potential Margin Expansion/Target Leverage Ratio above Risks related to conducting business through joint ventures Equity Income Same risks as for Total Sales/Segment Sales/Sales CAGR/New Mobility Sales and Adjusted EBIT Margin/Net Income Attributable to Magna/Potential Margin Expansion/Target Leverage Ratio above Free Cash Flow
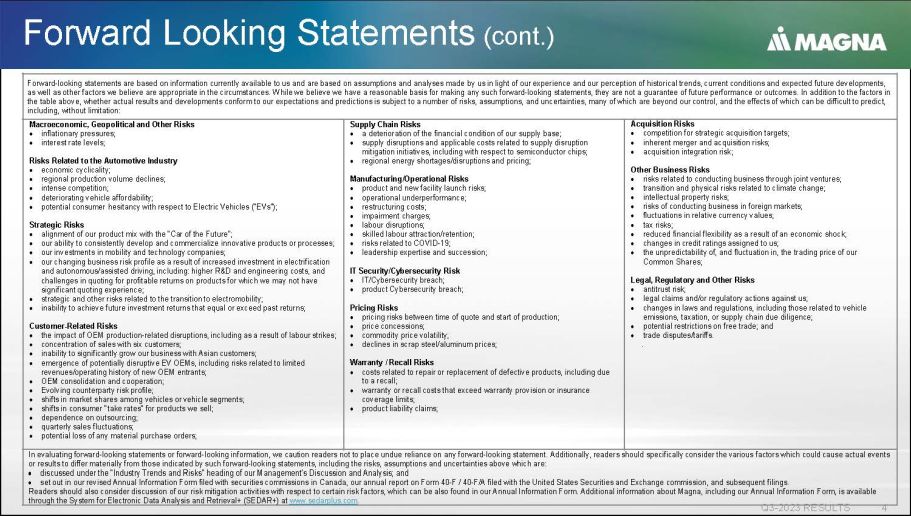
Forward Looking Statements (cont.) Q3 - 2023 RESULTS 4 Forward - looking statements are based on information currently available to us and are based on assumptions and analyses made by us in light of our experience and our perception of historical trends, current conditions and expected future developments, as well as other factors we believe are appropriate in the circumstances. While we believe we have a reasonable basis for mak ing any such forward - looking statements, they are not a guarantee of future performance or outcomes. In addition to the factors in the table above, whether actual results and developments conform to our expectations and predictions is subject to a number o f r isks, assumptions, and uncertainties, many of which are beyond our control, and the effects of which can be difficult to pred ict , including, without limitation: Acquisition Risks competition for strategic acquisition targets; inherent merger and acquisition risks; acquisition integration risk; Other Business Risks risks related to conducting business through joint ventures; transition and physical risks related to climate change; intellectual property risks; risks of conducting business in foreign markets; fluctuations in relative currency values; tax risks; reduced financial flexibility as a result of an economic shock; changes in credit ratings assigned to us; the unpredictability of, and fluctuation in, the trading price of our Common Shares; Legal, Regulatory and Other Risks antitrust risk; legal claims and/or regulatory actions against us; changes in laws and regulations, including those related to vehicle emissions, taxation, or supply chain due diligence; potential restrictions on free trade; and trade disputes/tariffs. . Supply Chain Risks a deterioration of the financial condition of our supply base; supply disruptions and applicable costs related to supply disruption mitigation initiatives, including with respect to semiconductor chips; regional energy shortages/disruptions and pricing; Manufacturing/Operational Risks product and new facility launch risks; operational underperformance; restructuring costs; impairment charges; labour disruptions; skilled labour attraction/retention; risks related to COVID - 19; leadership expertise and succession; IT Security/Cybersecurity Risk IT/Cybersecurity breach; product Cybersecurity breach; Pricing Risks pricing risks between time of quote and start of production; price concessions; commodity price volatility; declines in scrap steel/aluminum prices; Warranty / Recall Risks costs related to repair or replacement of defective products, including due to a recall; warranty or recall costs that exceed warranty provision or insurance coverage limits; product liability claims; Macroeconomic, Geopolitical and Other Risks inflationary pressures; interest rate levels; Risks Related to the Automotive Industry economic cyclicality; regional production volume declines; intense competition; deteriorating vehicle affordability; potential consumer hesitancy with respect to Electric Vehicles (“EVs”); Strategic Risks alignment of our product mix with the “Car of the Future”; our ability to consistently develop and commercialize innovative products or processes; our investments in mobility and technology companies; our changing business risk profile as a result of increased investment in electrification and autonomous/assisted driving, including: higher R&D and engineering costs, and challenges in quoting for profitable returns on products for which we may not have significant quoting experience; strategic and other risks related to the transition to electromobility; inability to achieve future investment returns that equal or exceed past returns; Customer - Related Risks the impact of OEM production - related disruptions, including as a result of labour strikes; concentration of sales with six customers; inability to significantly grow our business with Asian customers; emergence of potentially disruptive EV OEMs, including risks related to limited revenues/operating history of new OEM entrants; OEM consolidation and cooperation; Evolving counterparty risk profile; shifts in market shares among vehicles or vehicle segments; shifts in consumer "take rates" for products we sell; dependence on outsourcing; quarterly sales fluctuations; potential loss of any material purchase orders; In evaluating forward - looking statements or forward - looking information, we caution readers not to place undue reliance on any f orward - looking statement. Additionally, readers should specifically consider the various factors which could cause actual events or results to differ materially from those indicated by such forward - looking statements, including the risks, assumptions and un certainties above which are: discussed under the “Industry Trends and Risks” heading of our Management’s Discussion and Analysis; and set out in our revised Annual Information Form filed with securities commissions in Canada, our annual report on Form 40 - F / 40 - F/A filed with the United States Securities and Exchange commission, and subsequent filings. Readers should also consider discussion of our risk mitigation activities with respect to certain risk factors, which can be als o found in our Annual Information Form. Additional information about Magna, including our Annual Information Form, is availab le through the System for Electronic Data Analysis and Retrieval+ (SEDAR+) at www.sedarplus.com .
Q3 - 2023 RESULTS 5 Reminders All amounts are in U.S. Dollars Effective July 1, 2023 we revised our calculation of Non - GAAP measures to exclude amortization of acquired intangible assets. The historical presentation of non - GAAP measures has also been updated to reflect the revised calculations. Today's discussion excludes the impact of other expense (income), net ("Unusual Items") and amortization of acquired intangible assets. "Organic", in the context of sales movements, means "excluding the impact of foreign exchange, acquisitions and divestitures"
Swamy Kotagiri Chief Executive Officer Q3 - 2023 RESULTS 6
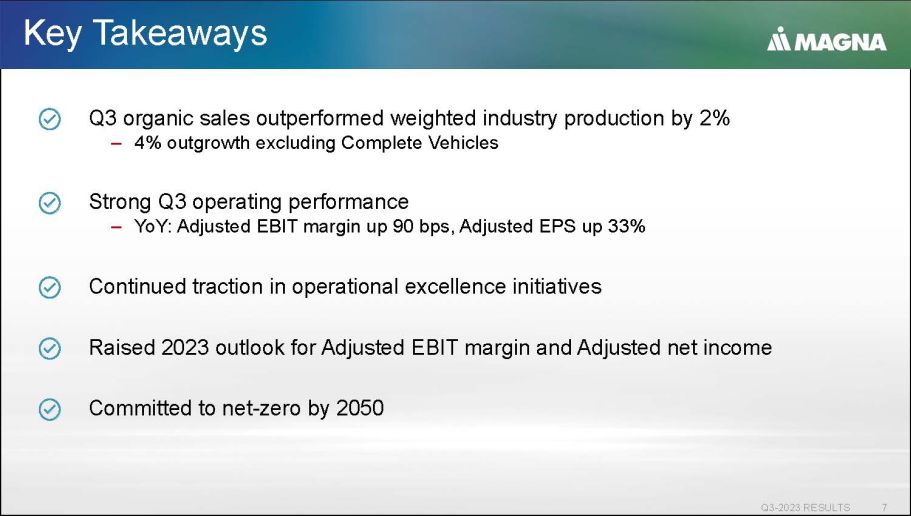
Key Takeaways Q3 - 2023 RESULTS 7 Q3 organic sales outperformed weighted industry production by 2% ‒ 4% outgrowth excluding Complete Vehicles Strong Q3 operating performance ‒ YoY: Adjusted EBIT margin up 90 bps, Adjusted EPS up 33% Continued traction in operational excellence initiatives Raised 2023 outlook for Adjusted EBIT margin and Adjusted net income Committed to net - zero by 2050
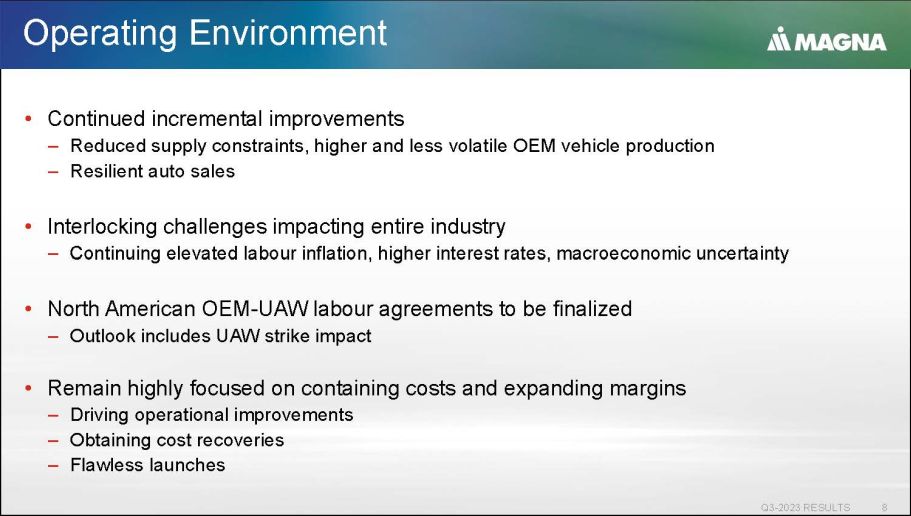
Operating Environment Q3 - 2023 RESULTS 8 • Continued incremental improvements – Reduced supply constraints, higher and less volatile OEM vehicle production – Resilient auto sales • Interlocking challenges impacting entire industry – Continuing elevated labour inflation, higher interest rates, macroeconomic uncertainty • North American OEM - UAW labour agreements to be finalized – Outlook includes UAW strike impact • Remain highly focused on containing costs and expanding margins – Driving operational improvements – Obtaining cost recoveries – Flawless launches
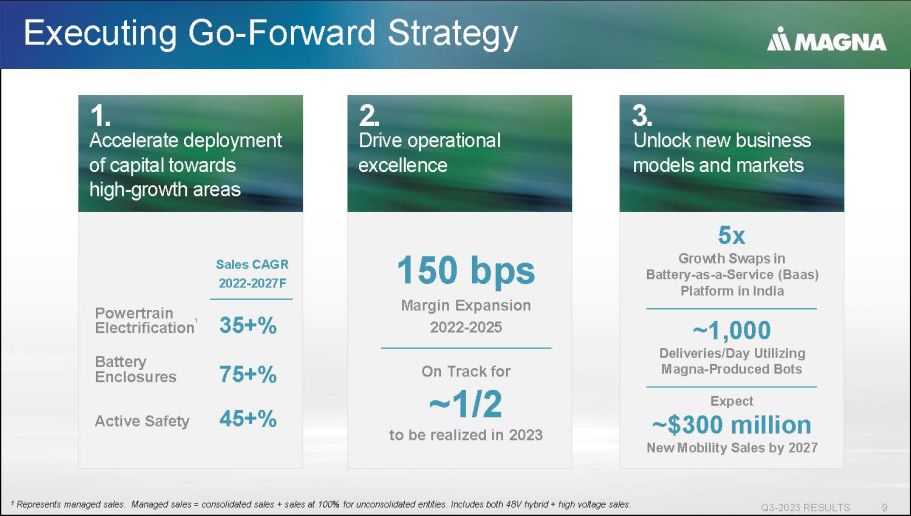
Executing Go - Forward Strategy Q3 - 2023 RESULTS 9 1 Represents managed sales. Managed sales = consolidated sales + sales at 100% for unconsolidated entities. Includes both 48V hy brid + high voltage sales. 2. Drive operational excellence 1. Accelerate deployment of capital towards high - growth areas 3. Unlock new business models and markets Sales CAGR 2022 - 2027F Powertrain Electrification 1 35+% Battery Enclosures 75+% Active Safety 45+% 150 bps Margin Expansion 2022 - 2025 On Track for ~1/2 to be realized in 2023 5x Growth Swaps in Battery - as - a - Service (Baas) Platform in India ~1,000 Deliveries/Day Utilizing Magna - Produced Bots Expect ~$300 million New Mobility Sales by 2027
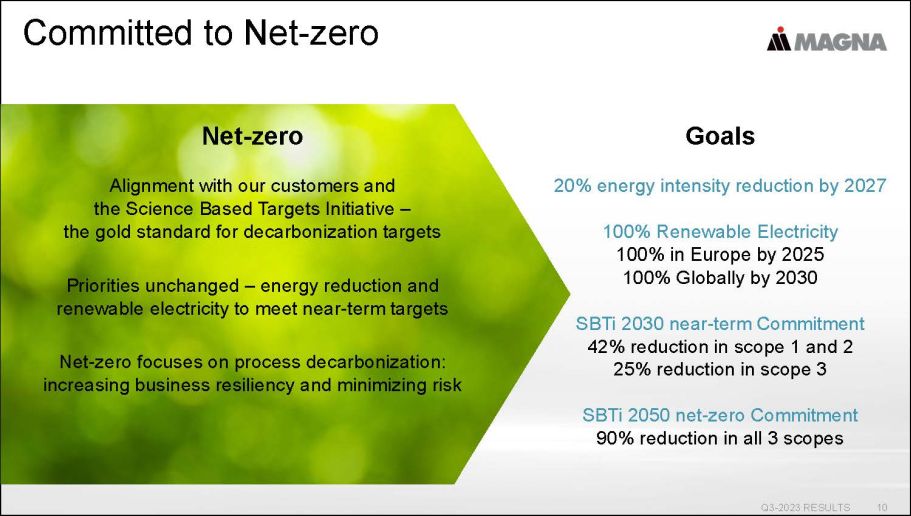
Committed to Net - zero 10 Goals 20% energy intensity reduction by 2027 100% Renewable Electricity 100% in Europe by 2025 100% Globally by 2030 SBTi 2030 near - term Commitment 42% reduction in scope 1 and 2 25% reduction in scope 3 SBTi 2050 net - zero Commitment 90% reduction in all 3 scopes Net - zero Alignment with our customers and the Science Based Targets Initiative – the gold standard for decarbonization targets Priorities unchanged – energy reduction and renewable electricity to meet near - term targets Net - zero focuses on process decarbonization: increasing business resiliency and minimizing risk Q3 - 2023 RESULTS
Pat McCann Executive Vice President & Chief Financial Officer Q3 - 2023 RESULTS 11
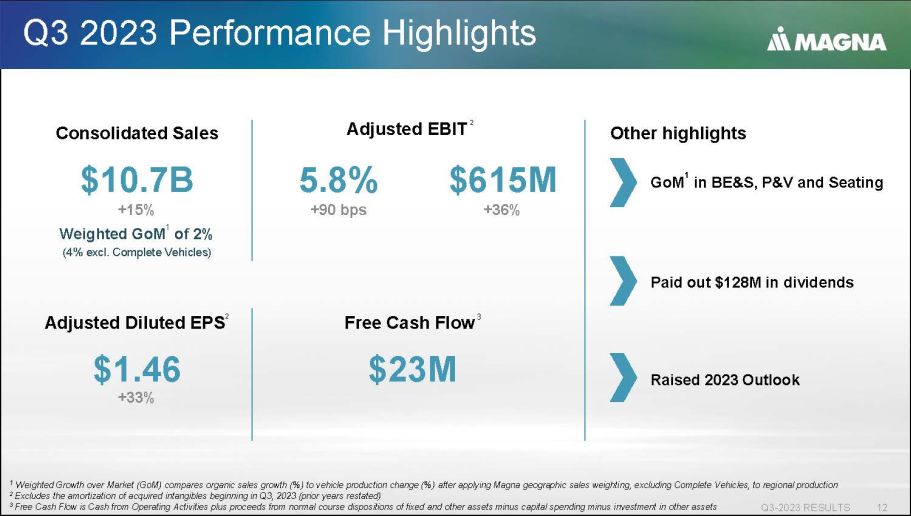
Q3 2023 Performance Highlights Q3 - 2023 RESULTS 12 Consolidated Sales $10.7B Weighted GoM 1 of 2% (4% excl. Complete Vehicles) +15% Free Cash Flow 3 $23M 1 Weighted Growth over Market (GoM) compares organic sales growth (%) to vehicle production change (%) after applying Magna geo gra phic sales weighting, excluding Complete Vehicles, to regional production 2 Excludes the amortization of acquired intangibles beginning in Q3, 2023 (prior years restated) 3 Free Cash Flow is Cash from Operating Activities plus proceeds from normal course dispositions of fixed and other assets minu s c apital spending minus investment in other assets Other highlights Paid out $128M in dividends GoM 1 in BE&S, P&V and Seating Raised 2023 Outlook Adjusted Diluted EPS 2 $1.46 +33% Adjusted EBIT 2 5.8% +90 bps $615M +36%
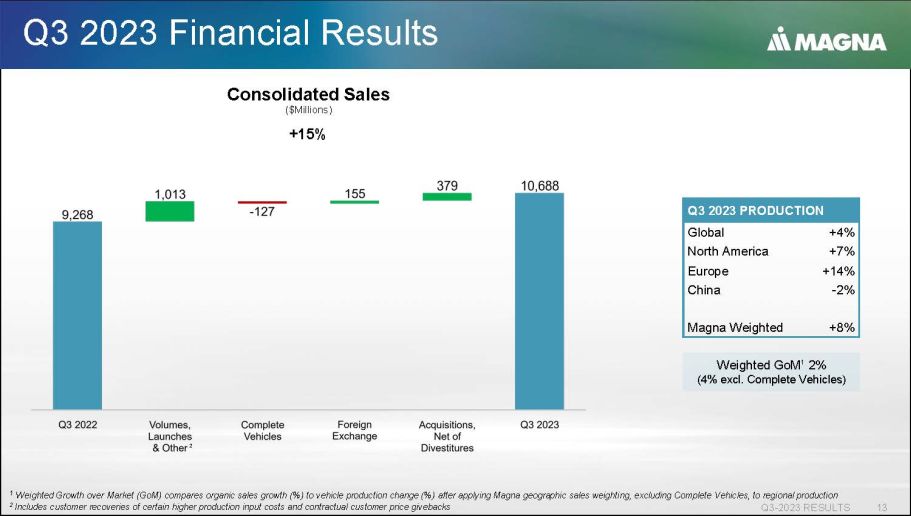
Q3 2023 Financial Results Q3 - 2023 RESULTS 13 Weighted GoM 1 2% (4% excl. Complete Vehicles) Consolidated Sales ($Millions) +15% 2 Q3 2023 PRODUCTION +4% Global +7% North America +14% Europe - 2% China +8% Magna Weighted 1 Weighted Growth over Market (GoM) compares organic sales growth (%) to vehicle production change (%) after applying Magna geo gra phic sales weighting, excluding Complete Vehicles, to regional production 2 Includes customer recoveries of certain higher production input costs and contractual customer price givebacks
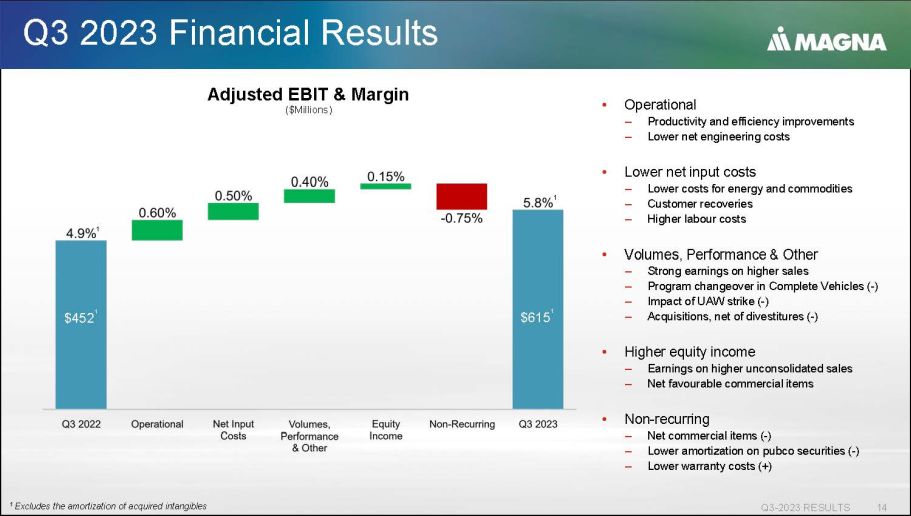
Q3 2023 Financial Results Q3 - 2023 RESULTS 14 • Operational – Productivity and efficiency improvements – Lower net engineering costs • Lower net input costs – Lower costs for energy and commodities – Customer recoveries – Higher labour costs • Volumes, Performance & Other – Strong earnings on higher sales – Program changeover in Complete Vehicles ( - ) – Impact of UAW strike ( - ) – Acquisitions, net of divestitures ( - ) • Higher equity income – Earnings on higher unconsolidated sales – Net favourable commercial items • Non - recurring – Net commercial items ( - ) – Lower amortization on pubco securities ( - ) – Lower warranty costs (+) 1 Excludes the amortization of acquired intangibles $615 1 $452 1 Adjusted EBIT & Margin ($Millions) 1 1
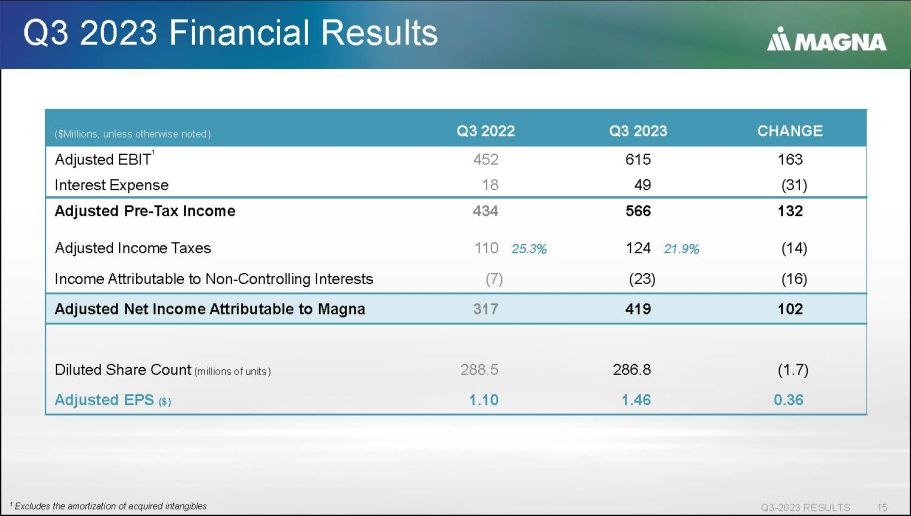
Q3 2023 Financial Results Q3 - 2023 RESULTS 15 CHANGE Q3 2023 Q3 2022 ($Millions, unless otherwise noted) 163 615 452 Adjusted EBIT 1 (31) 49 18 Interest Expense 132 566 434 Adjusted Pre - Tax Income (14) 124 110 Adjusted Income Taxes (16) (23) (7) Income Attributable to Non - Controlling Interests 102 419 317 Adjusted Net Income Attributable to Magna (1.7) 286.8 288.5 Diluted Share Count (millions of units) 0.36 1.46 1.10 Adjusted EPS ($) 25.3% 21.9% 1 Excludes the amortization of acquired intangibles
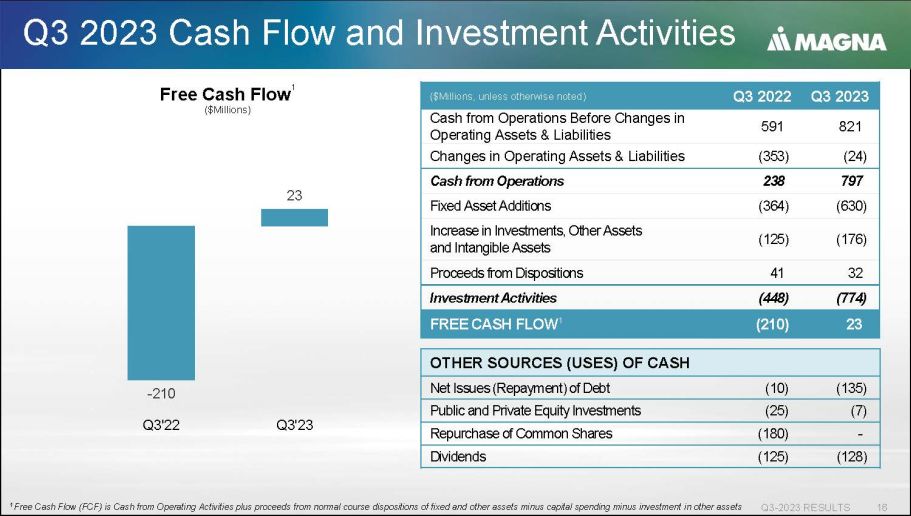
Q3 2023 Cash Flow and Investment Activities Q3 - 2023 RESULTS 16 Free Cash Flow 1 ($Millions) OTHER SOURCES (USES) OF CASH (135) (10) Net Issues (Repayment) of Debt (7) (25) Public and Private Equity Investments - (180) Repurchase of Common Shares (128) (125) Dividends Q3 2023 Q3 2022 ($Millions, unless otherwise noted) 821 591 Cash from Operations Before Changes in Operating Assets & Liabilities (24) (353) Changes in Operating Assets & Liabilities 797 238 Cash from Operations (630) (364) Fixed Asset Additions (176) (125) Increase in Investments, Other Assets and Intangible Assets 32 41 Proceeds from Dispositions (774) (448) Investment Activities 23 (210) FREE CASH FLOW 1 - 210 23 0.0 0.0 0.0 0.0 0.1 0.1 0.1 0.1 0.1 0.1 0.1 -250 -200 -150 -100 -50 0 50 100 Q3'22 Q3'23 1 Free Cash Flow (FCF) is Cash from Operating Activities plus proceeds from normal course dispositions of fixed and other asset s m inus capital spending minus investment in other assets
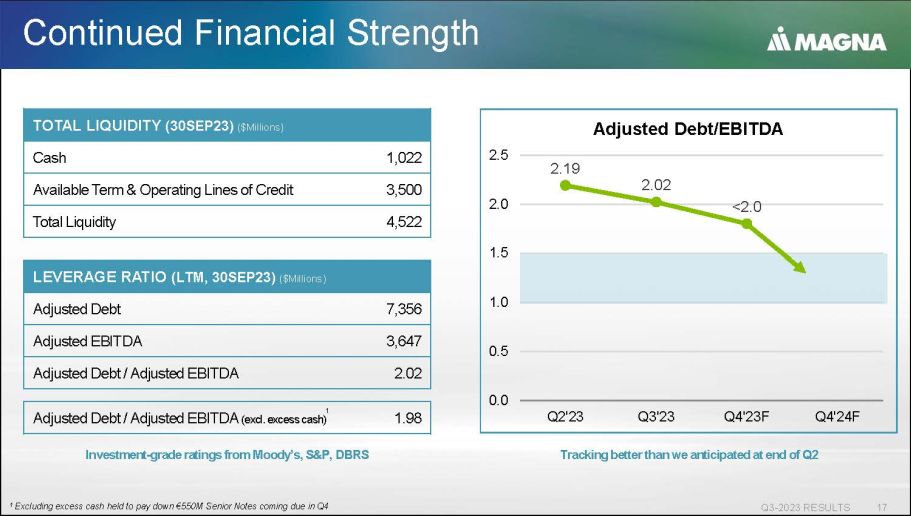
Continued Financial Strength Q3 - 2023 RESULTS 17 LEVERAGE RATIO (LTM, 30SEP23) ($M illions) 7,356 Adjusted Debt 3,647 Adjusted EBITDA 2.02 Adjusted Debt / Adjusted EBITDA TOTAL LIQUIDITY (30SEP23) ($M illions) 1,022 Cash 3,500 Available Term & Operating Lines of Credit 4,522 Total Liquidity Investment - grade ratings from Moody’s, S&P, DBRS 1 Excluding excess cash held to pay down €550M Senior N otes coming due in Q4 1.98 Adjusted Debt / Adjusted EBITDA (excl. excess cash) 1 2.19 2.02 <2.0 0.0 0.5 1.0 1.5 2.0 2.5 Q2'23 Q3'23 Q4'23F Q4'24F Adjusted Debt/EBITDA Tracking better than we anticipated at end of Q2
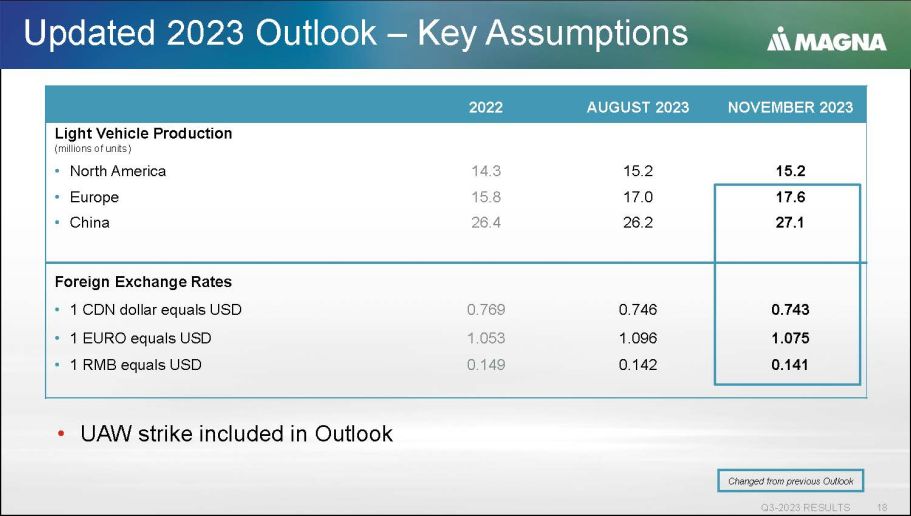
Updated 2023 Outlook – Key Assumptions Q3 - 2023 RESULTS 18 NOVEMBER 2023 AUGUST 2023 2022 Light Vehicle Production (millions of units) 15.2 15.2 14.3 • North America 17.6 17.0 15.8 • Europe 27.1 26.2 26.4 • China Foreign Exchange Rates 0.743 0.746 0.769 • 1 CDN dollar equals USD 1.075 1.096 1.053 • 1 EURO equals USD 0.141 0.142 0.149 • 1 RMB equals USD Changed from previous Outlook • UAW strike included in Outlook
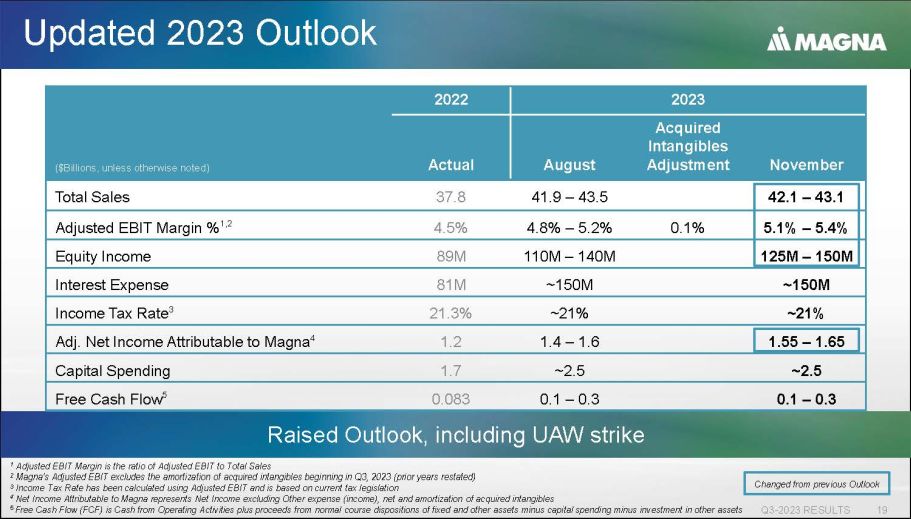
Updated 2023 Outlook Q3 - 2023 RESULTS 19 Raised Outlook, including UAW strike 2023 2022 November Acquired Intangibles Adjustment August Actual ($Billions, unless otherwise noted) 42.1 – 43.1 41.9 – 43.5 37.8 Total Sales 5.1% – 5.4% 0.1% 4.8% – 5.2% 4.5% Adjusted EBIT Margin % 1,2 125M – 150M 110M – 140M 89M Equity Income ~150M ~150M 81M Interest Expense ~21% ~21% 21.3% Income Tax Rate 3 1.55 – 1.65 1.4 – 1.6 1.2 Adj. Net Income Attributable to Magna 4 ~2.5 ~2.5 1.7 Capital Spending 0.1 – 0.3 0.1 – 0.3 0.083 Free Cash Flow 5 1 Adjusted EBIT Margin is the ratio of Adjusted EBIT to Total Sales 2 Magna's Adjusted EBIT excludes the amortization of acquired intangibles beginning in Q3, 2023 (prior years restated) 3 Income Tax Rate has been calculated using Adjusted EBIT and is based on current tax legislation 4 Net Income Attributable to Magna represents Net Income excluding Other expense (income), net and amortization of acquired int an gibles 5 Free Cash Flow (FCF) is Cash from Operating Activities plus proceeds from normal course dispositions of fixed and other asset s m inus capital spending minus investment in other assets Changed from previous Outlook

In Summary Q3 - 2023 RESULTS 20 Strong Q3 operating performance Raised outlook for 2023 Continued confidence in future margin expansion Further sales growth over market %

Appendix – Q3 2023 Results Q3 - 2023 RESULTS 21
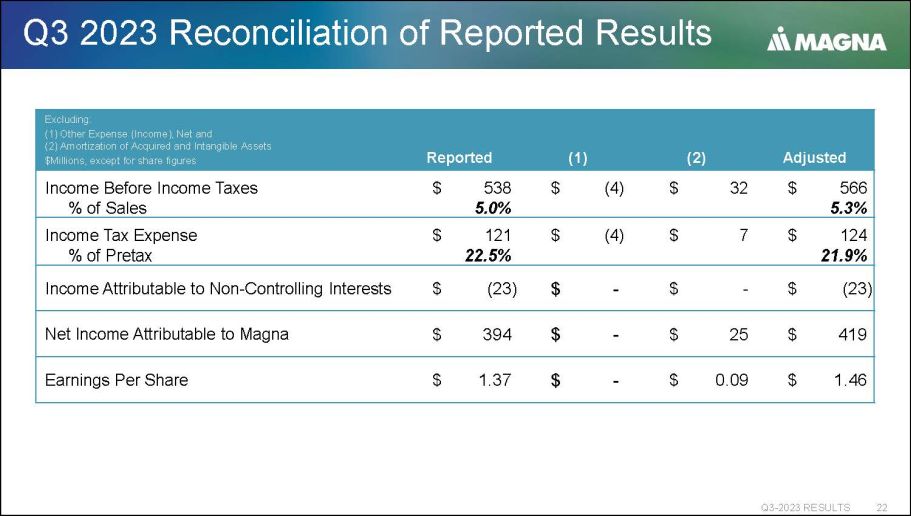
Q3 2023 Reconciliation of Reported Results Q3 - 2023 RESULTS 22 Adjusted (2) (1) Reported Excluding: (1) Other Expense (Income), Net and (2) Amortization of Acquired and Intangible Assets $Millions, except for share figures $ 566 $ 32 $ (4) $ 538 Income Before Income Taxes 5.3% 5.0% % of Sales $ 124 $ 7 $ (4) $ 121 Income Tax Expense 21.9% 22.5% % of Pretax $ (23) $ - $ - $ (23) Income Attributable to Non - Controlling Interests $ 419 $ 25 $ - $ 394 Net Income Attributable to Magna $ 1.46 $ 0.09 $ - $ 1.37 Earnings Per Share

Q3 2022 Reconciliation of Reported Results Q3 - 2023 RESULTS 23 Adjusted (2) (1) Reported Excluding: (1) Other Expense (Income), Net and (2) Amortization of Acquired and Intangible Assets $Millions, except for share figures $ 434 $ 11 $ 23 $ 400 Income Before Income Taxes 4.7% 4.3% % of Sales $ 110 $ 2 $ 4 $ 104 Income Tax Expense 25.5% 26.0% % of Pretax $ (7) $ - $ - $ (7) Income Attributable to Non - Controlling Interests $ 317 $ 9 $ 19 $ 289 Net Income Attributable to Magna $ 1.10 $ 0.03 $ 0.07 $ 1.00 Earnings Per Share
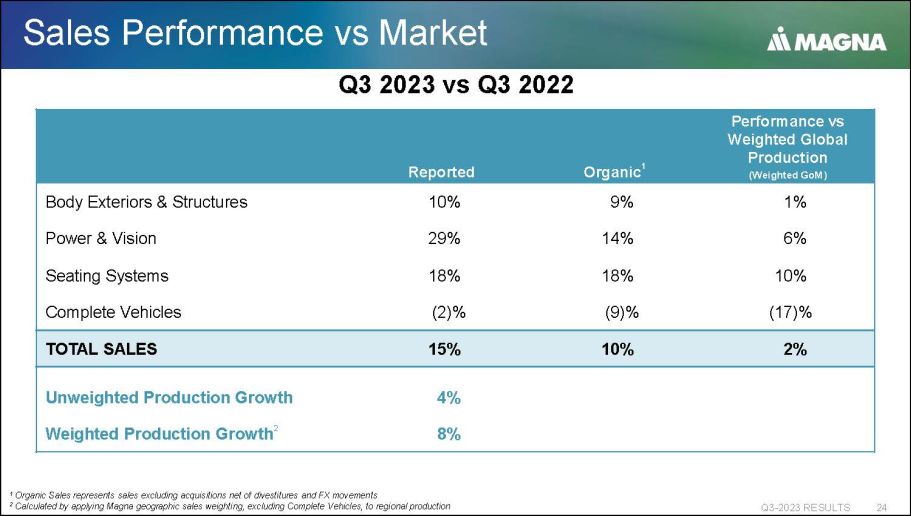
Sales Performance vs Market Q3 - 2023 RESULTS 24 Performance vs Weighted Global Production (Weighted GoM) Organic 1 Reported 1% 9% 10% Body Exteriors & Structures 6% 14% 29% Power & Vision 10% 18% 18% Seating Systems (17)% (9)% (2)% Complete Vehicles 2% 10% 15% TOTAL SALES 4% Unweighted Production Growth 8% Weighted Production Growth 2 1 Organic Sales represents sales excluding acquisitions net of divestitures and FX movements 2 Calculated by applying Magna geographic sales weighting, excluding Complete Vehicles, to regional production Q3 2023 vs Q3 2022

Segment Impact on Adjusted EBIT % of Sales Q3 - 2023 RESULTS 25 Adjusted EBIT as a Percentage of Sales Adjusted EBIT Sales ($Millions) 4.9% $ 452 $ 9,268 3 rd Quarter of 2022 Increase (Decrease) Related to: 1.1% $ 131 $ 378 Body Exteriors & Structures 0.5% $ 97 $ 834 Power & Vision 0.2% $ 33 $ 234 Seating Systems (0.6)% $ (70) $ (28) Complete Vehicles (0.3)% $ (28) $ 2 Corporate and Other 5.8% $ 615 $ 10,688 3 rd Quarter of 2023 Q3 2023 vs Q3 2022
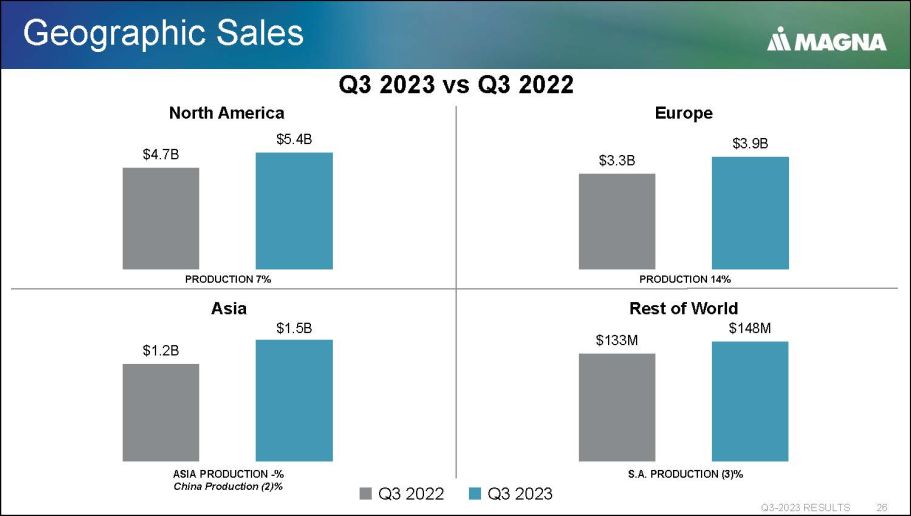
Geographic Sales Q3 - 2023 RESULTS 26 Q3 2022 Q3 2023 Asia ASIA PRODUCTION - % China Production (2)% $4.7B $5.4B $0.0B $1.0B $2.0B $3.0B $4.0B $5.0B $6.0B $3.3B $3.9B $0.0B $0.5B $1.0B $1.5B $2.0B $2.5B $3.0B $3.5B $4.0B $4.5B $133M $148M $0M $20M $40M $60M $80M $100M $120M $140M $160M North America PRODUCTION 7% Europe PRODUCTION 14% S.A. PRODUCTION (3)% Rest of World Q3 2023 vs Q3 2022 $1.2B $1.5B $0.0B $0.2B $0.4B $0.6B $0.8B $1.0B $1.2B $1.4B $1.6B
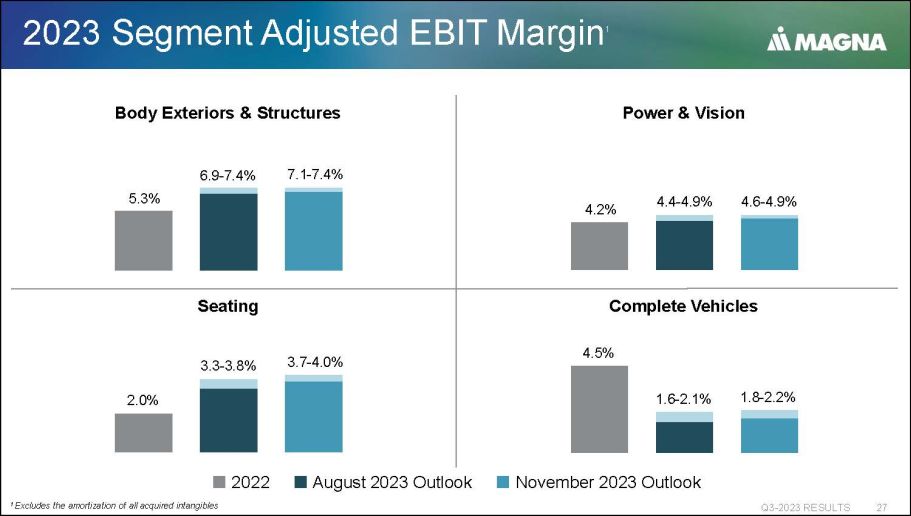
2023 Segment Adjusted EBIT Margin 1 Q3 - 2023 RESULTS 27 Body Exteriors & Structures 2022 August 2023 Outlook November 2023 Outlook 5.3% 6.9 - 7.4% 7.1 - 7.4% 2.0% 3.3 - 3.8% 3.7 - 4.0% 4.2% 4.4 - 4.9% 4.6 - 4.9% 4.5% 1.6 - 2.1% 1.8 - 2.2% Seating Power & Vision Complete Vehicles 1 Excludes the amortization of all acquired intangibles

Capital Allocation Principles Q3 - 2023 RESULTS 28 Disciplined, Profitable Approach to Growth Remains a Foundational Principle Q3 2023 • Preserve liquidity and high investment grade credit ratings Maintain Strong Balance Sheet 2.02x LTM 30SEP23 - Adj. debt / Adj. EBITDA ratio between 1.0 - 1.5x • Maintain flexibility to invest for growth $ 630M $ 176M Fixed asset additions Other investments • Organic and inorganic opportunities Invest for Growth • Innovation $ 128M • Continued dividend growth over time Return Capital to Shareholders • Repurchase shares with excess liquidity
Q3 - 2023 RESULTS 29
Exhibit 99.3

REFINITIV STREETEVENTS EDITED TRANSCRIPT MG.TO - Q3 2023 Magna International Inc Earnings Call EVENT DATE/TIME: NOVEMBER 03, 2023 / 12:00PM GMT REFINITIV STREETEVENTS | www.refinitiv.com | Contact Us ©2023 Refinitiv. All rights reserved. Republication or redistribution of Refinitiv content, including by framing or similar means, is prohibited without the prior written consent of Refinitiv. 'Refinitiv' and the Refinitiv logo are registered trademarks of Refinitiv and its affiliated companies.
NOVEMBER 03, 2023 / 12:00PM, MG.TO - Q3 2023 Magna International Inc Earnings Call CORPORATE PARTICIPANTS Louis Tonelli Magna International Inc. - VP of IR Patrick W. D. McCann Magna International Inc. - Executive VP & CFO Seetarama Swamy Kotagiri Magna International Inc. - CEO & Director CONFERENCE CALL PARTICIPANTS Christopher Patrick McNally Evercore ISI Institutional Equities, Research Division - Senior MD Colin M. Langan Wells Fargo Securities, LLC, Research Division - Senior Equity Analyst Dan Meir Levy Barclays Bank PLC, Research Division - Senior Analyst Gautam Narayan RBC Capital Markets, Research Division - Assistant VP James Albert Picariello BNP Paribas Exane, Research Division - Research Analyst Jonathan Goldman Scotiabank Global Banking and Markets, Research Division - Associate Joseph Robert Spak RBC Capital Markets, Research Division - Former Autos and Leisure Analyst Mark Trevor Delaney Goldman Sachs Group, Inc., Research Division - Equity Analyst Michael W. Glen Raymond James Ltd., Research Division - Director PRESENTATION Operator Greetings, and welcome to the Q 3 2022 results . (Operator Instructions) As a reminder, this conference is being recorded today, Friday, November 3 , 2023 . I would now like to turn the conference over now to Louis Tonelli, Vice President, Investor Relations. Please go right ahead. Louis Tonelli - Magna International Inc . - VP of IR Thanks, Tommy . Hello, everyone, and welcome to our conference call covering our third quarter of 2023 . Joining me today are Swamy Kotagiri and Pat McCann . Yesterday, our Board of Directors met and approved our financial results for the third quarter of 2023 as well as our updated ' 23 outlook . We issued a press release this morning outlining our results . You'll find the press release, today's conference call webcast, the slide presentations go along with the call and our updated quarterly financial review all in the Investor Relations section of our website at magna . com . Before we get started, just as a reminder, the discussion today may contain forward - looking information or forward - looking statements within the meaning of applicable securities legislation . Such statements involve certain risks, assumptions and uncertainties which may cause the company's actual or future results and performance to be materially different than those expressed or implied in these statements . Please refer to today's press release for a complete description of our safe harbor disclaimer . Please also refer to the reminder slides included in our presentation that relates to our commentary today . And with that, I'll pass it over to Swamy . 2 REFINITIV STREETEVENTS | www.refinitiv.com | Contact Us ©2023 Refinitiv. All rights reserved. Republication or redistribution of Refinitiv content, including by framing or similar means, is prohibited without the prior written consent of Refinitiv. 'Refinitiv' and the Refinitiv logo are registered trademarks of Refinitiv and its affiliated companies.
Seetarama Swamy Kotagiri - Magna International Inc . - CEO & Director Thank you, Louis . Good morning, everyone . I appreciate you all joining our call today as we share our third quarter earnings results . Before I share some of the details, I want to thank my team for their continued progress and solid results . So let's get started . Some key highlights to mention before I dive into the details . Our organic sales grew by 10 % year - over - year surpassing weighted production by 4 % , excluding complete vehicles and 2 % , including complete vehicles . Our third quarter showcased strong operating performance with higher organic sales once again contributing to robust earnings that represented a significant improvement year - over - year . We continue to benefit from our activities in operational excellence and cost containments leading to improved margins . We have raised our 2023 adjusted EBIT margin and adjusted net income outlook ranges for 2023 , demonstrating solid operating performance even with the negative impact of the UAW strike in the third and fourth quarters . And we recently announced our commitment to achieving net zero across Magna by 2050 . Our industry continues to experience incremental improvements, including reduced supply constraints, stronger and more stable production schedules and resilient auto sales in a number of markets . However, the global economy continues to face some interlocking challenges, including continuing elevated labor inflation, higher interest rates, geopolitical risks and slowing economic growth . These challenges are impacting our entire industry . In North America, the (inaudible) experienced UAW labor stoppages for about 6 weeks, which cost the industry approximately 220 , 000 units . The UAW has now reached tentative agreements with all 3 OEMs, which need to be ratified . Our outlook reflects the full extent of the strike . We remain highly focused on containing costs and improving our margins . This is being achieved through ongoing operational improvement and cost recovery initiatives as well as executing flawless launches across Magna . At our virtual investor event in September, we provided an update on the progress of our go - forward strategy . Our ongoing investments in mega - trend areas are driving significant growth over the coming years, including 35 - plus percent in powertrain electrification, 75 - plus percent in battery enclosures and 45 - plus percent in active safety . Most importantly, our portfolio is substantially aligned with the Car of the Future, which we expect to drive sales growth regardless of the pace of powertrain electrification . Where possible, we are working to mitigate risks, including by installing capital in tranches and employing different cost sharing models with our customers . At the same time, we have been accelerating our activities around operational excellence to ensure we remain at the forefront of manufacturing and exceeding our customers' expectations in all areas . We expect about 150 basis points of margin expansion from our collective efforts here, including about half that amount this year . And we are leveraging capabilities that already exist within Magna to unlock opportunities with new models and markets as they develop . It is early days for us in this area, but we have already had some traction . We have experienced 5 x growth in battery swaps in our Battery as a Service venture and are experiencing about 1 , 000 deliveries a day utilizing Magna produced parts . We expect about $ 300 million in New Mobility Sales by 2027 with a significant runway for additional profitable growth beyond that . We expect our strategy to deliver continued growth above market, improved margins and returns and further shift in our portfolio towards mega - trend areas . This should drive increased shareholder value in the years to come . We also took a significant step forward in our commitment to sustainability, and environmental stewardship by submitting net zero emission targets for validation by the science - based targets initiative, with a goal to achieve net zero by 2050 , together with meeting our near - term Scope 1 , 2 and 3 targets by 2030 . Among the steps involved in meeting this target is transitioning to 100 % renewable electricity use in our European operations by 2025 and globally by 2030 . We have already made progress towards previously established sustainability actions . This year, we are on track to achieve our commitment to reduce global energy intensity by 10 % in all manufacturing facilities with a target of 20 % reduction by 2027 and more than 30 Magna divisions have achieved carbon neutrality over the last 2 years . With that, I'll pass the call over to Pat . NOVEMBER 03, 2023 / 12:00PM, MG.TO - Q3 2023 Magna International Inc Earnings Call 3 REFINITIV STREETEVENTS | www.refinitiv.com | Contact Us ©2023 Refinitiv. All rights reserved. Republication or redistribution of Refinitiv content, including by framing or similar means, is prohibited without the prior written consent of Refinitiv. 'Refinitiv' and the Refinitiv logo are registered trademarks of Refinitiv and its affiliated companies.
Patrick W . D . McCann - Magna International Inc . - Executive VP & CFO Thanks, Swamy, and good morning, everyone . As Swamy indicated, once again, we delivered strong earnings this past quarter despite the onset of the UAW strike in September . Comparing the third quarter of 2023 to ' 22 , consolidated sales were $ 10 . 7 billion, up 15 % compared to a 4 % increase in global light vehicle production . Adjusted EBIT was $ 615 million and adjusted EBIT margin increased 90 basis points to 5 . 8 % . Adjusted EPS came in at $ 1 . 46 , up 33 % year - over - year and free cash flow generated in the quarter was $ 23 million compared to a $ 210 million use in the third quarter of ' 22 . Despite our higher capital spend this quarter to support record program awards in ' 22 . During the quarter, we paid dividends of $ 128 million, and we increased our adjusted EBIT margin and earnings outlook despite the negative impact of the UAW strike . Let me take you through some of the details . North American and European light vehicle production were up 7 % and 14 % , respectively, while Chinese production declined 2 % , netting to a 4 % increase in global production . Our consolidated sales were $ 10 . 7 billion, up 15 % over the third quarter of ' 22 . On an organic basis, our sales also increased 10 % year - over - year for a 2 % growth over market or 4 % growth over market, excluding complete vehicles . The sales increase was primarily due to higher global vehicle production, the launch of new programs, adjustments to recover certain higher input costs, the acquisition of Veoneer Active Safety, net of the divestiture of our manual transmissions plant in Europe and the net strengthening of currencies against the U . S . dollar . These are partially offset by lower Complete Vehicle sales, mainly due to a program changeover and an estimated $ 55 million impact from the UAW strike . Adjusted EBIT was $ 615 million and adjusted EBIT margin was 5 . 8 % compared to 4 . 9 % in the third quarter of ' 22 . Our continued focus on operational excellence and performance on cost initiatives is driving strong earnings on higher sales . This was despite the negative impact of a program changeover in Complete Vehicles, the UAW strike, which we estimate cost us about 10 basis points and acquisitions net of divestitures . Combined, we generated 40 basis points of net improvements . Adjusted EBIT margin was also positively impacted by about 60 basis points of net operational items, which include productivity and efficiency improvements at certain facilities and lower net engineering costs, about 50 basis points related to lower net input costs and higher equity income which benefited margin by about 15 basis points . EBIT margin was negatively impacted by commercial items that had a net unfavorable impact in the quarter, which subtracted about 75 basis points year - over - year . Interest expense increased primarily reflecting senior notes issued and borrowings in the first half of the year as well as higher interest rates . Our adjusted effective income tax rate came in at 21 . 9 % , largely in line with our ' 23 expectations but lower than Q 3 of last year . Adjusted net income attributable to Magna was $ 419 million, up 32 % over the third quarter of ' 22 , reflecting higher EBIT and the lower tax rate, partially offset by higher interest expense and minority interest . Adjusted diluted EPS was $ 1 . 46 , up 33 % compared to Q 3 last year . This increase is the result of higher net income and fewer shares outstanding to reduce number of shares outstanding substantially reflect the impact of share purchases in 2022 . Turning to a review of our cash flows and investment activities . In the third quarter of ' 23 , we generated $ 821 million in cash from operations before changes in working capital, up $ 230 million or 39 % from ' 22 and we invested $ 24 million in working capital . Investment activities in the quarter included $ 630 million for fixed assets and $ 176 million for investments, other assets and intangibles . As expected, CapEx was higher than the $ 364 million in Q 3 last year to support our record program awards in 2022 . Overall, we generated free cash flow of $ 23 million in the third quarter . We also paid $ 128 million in dividends . Our balance sheet continues to be strong with investment - grade ratings from the major credit agencies . At the end of Q 3 , we had over $ 4 . 5 billion in liquidity, including about $ 1 billion of cash . Currently, our adjusted debt to adjusted EBITDA ratio is 2 . 02 . Excluding cash we're holding to help pay down our EUR 550 million senior notes coming due in the fourth quarter, our ratio would be 1 . 98 . This ratio continues to decline and is tracking better than we're expected at the end of last quarter as a result of our improved operating results . We anticipate a reduction of our leverage ratio by the end of this year and a further decline through 2024 . NOVEMBER 03, 2023 / 12:00PM, MG.TO - Q3 2023 Magna International Inc Earnings Call 4 REFINITIV STREETEVENTS | www.refinitiv.com | Contact Us ©2023 Refinitiv. All rights reserved. Republication or redistribution of Refinitiv content, including by framing or similar means, is prohibited without the prior written consent of Refinitiv. 'Refinitiv' and the Refinitiv logo are registered trademarks of Refinitiv and its affiliated companies.

Next, I will cover our updated outlook, which incorporates higher than previously expected vehicle production in both Europe and China, including as a result of better production in Q 3 . Our assumption for production in North America is unchanged from our previous outlook as stronger - than - expected production was offset by the impact of the UAW strike . We have not assumed any lost [D 3 ] production is made up in the fourth quarter . We also assume exchange rates in our outlook will approximate current rates . We now expect a slightly weaker EUR, CAD and RMB for 2023 relative to our previous outlook . We have narrowed our expected sales range with essentially the same midpoint as our last outlook . This mainly reflects higher European and Chinese vehicle production in the second half of ' 23 , offset by the net stronger U . S . dollar relative to our last outlook and the estimated $ 310 million impact of the UAW strike . We communicated last quarter that beginning in Q 3 , Magna's adjusted EBIT would exclude the amortization of all acquired intangibles . Our August outlook excluded our estimate of the amortization intangibles associated with the acquisition of Veoneer Active Safety, about $ 30 million for half of ' 23 . Our final analysis of all other acquisitions resulted in about $ 50 million of additional annual amortization to be excluded from our adjusted EBIT calculation . This additional adjustment amounts to approximately 10 basis points in EBIT margin . We have updated our historical presentation of adjusted EBIT to reflect these revised calculations . As a result of our strong performance so far in ' 23 , our expectations for continued operational execution and despite the negative impact of the UAW strike which we estimate to be between 10 and 15 basis points, we have narrowed and raised our adjusted EBIT margin . We now expect our EBIT margin for ' 23 to be in the range of 5 . 1 % to 5 . 4 % , which compares to 4 . 9 % to 5 . 3 % previously, adjusted by the 10 basis points to reflect amortization of all acquired intangibles . We're increasing our equity income range, mainly reflecting our better - than - forecasted performance in Q 3 . As a result of increasing our adjusted EBIT margin range, we are also raising our range for adjusted net [income] attributable to Magna . Our interest expense, tax rate, capital spending and free cash flow expectations are all unchanged from our last outlook . In summary, we are pleased with our strong operating performance in the third quarter . Once again, we outgrew our end markets by 2 % on a consolidated basis as a percent, excluding Complete Vehicles . We raised our outlook for 2023 , and we have continued confidence in our plans for margin expansion for the years to come . Thank you for your attention . We will be happy to answer your questions . QUESTIONS AND ANSWERS Operator (Operator Instructions) And with this, with our first question on the line from Chris McNally with Evercore . Christopher Patrick McNally - Evercore ISI Institutional Equities, Research Division - Senior MD Thanks so much, team . I appreciate all the detail . Maybe we could start with the -- obviously, the big topic of the week is around EV demand . And maybe just kind of just level set, just remind us your exposure, particularly in powertrain, you have $ 800 million and last year growing to -- I think it's (inaudible) this year, you have parts of -- of, I think, $ 4 billion out in the out years . What percentage is maybe pure EV versus 48 - volt and hybrid, that would be helpful? NOVEMBER 03, 2023 / 12:00PM, MG.TO - Q3 2023 Magna International Inc Earnings Call 5 REFINITIV STREETEVENTS | www.refinitiv.com | Contact Us ©2023 Refinitiv. All rights reserved. Republication or redistribution of Refinitiv content, including by framing or similar means, is prohibited without the prior written consent of Refinitiv. 'Refinitiv' and the Refinitiv logo are registered trademarks of Refinitiv and its affiliated companies.

And then just a pace on battery enclosures, which is obviously a new growth area . Just sort of anything around ' 23 , ' 24 , again, you've given longer - term targets? And just remind us maybe some of the programs or geographic exposure? Those are the big questions I think that you'll probably get several times in the queue from the rest of the analysts . So maybe we can start there . Seetarama Swamy Kotagiri - Magna International Inc . - CEO & Director Chris, we will try to address the different aspects of the questions . I think from an EV perspective, just generally to address macro, we've always said electrification is a (inaudible) irreversible trend and it's here to stay but the question was going to be the predictability of the take rates, right? How soon is it going to come? So it's basically the very long tale, and it's still very early days of electrification . Also, if you look at the last 3 or 4 years, as we talked about electrification, we have generally said that global penetration will be somewhere in the mid - 30 s in percentage by 2030 . Given those circumstances, our policy or our call it strategy has been to look at the volumes by program, by customer, look at external sources, IHS and our own internal volume predictions, and have been using that to come up with the numbers that you talked about . In the past, like not just related to EV, right, the volume uncertainty has been there on every program if you go back a few decades . And we have a mechanism to go through that in our own planning process and how we put the capital forward, how we plan scalability and modularity but beyond that, even have the discussions with the customers when there is a significant change in volumes . But all that said, a few questions specifically that you asked about, in electrification of powertrain specifically, we talked about $ 3 billion in 2025 managed sales and about $ 4 billion during our Investor Day in 2027 . And when we talk about those numbers, we've always taken into account the mechanism that I talked about of coming up with our own volumes, looking at multiple sources, looking at the take rates, which I would say are a little bit more conservative than what the customers and the markets have been talking, right? So that's one piece . On the battery enclosure side, I think, Louis, we are in the $ 300 million, $ 400 million this year . And we were talking about $ 1 . 6 billion by 2025 . And there, we talked about the product line where we are using existing assets, whether it's castings or exclusions or stampings, taxes and so on . And their dedicated assembly lines are considered pulling, which are paid by the customer, right? So that continues, and that is also a strategic product in the sense that when you look at the frames and the underbody and so on, we see a path going forward, and we talked about the analogy to the frames in the past, where we did in the late ' 90 s, and we continue to do the third and fourth generation of the same product today . So this is a long - term play, and we feel pretty good about that . I know I tried to address different aspects of the question . Did I miss anything there? Christopher Patrick McNally - Evercore ISI Institutional Equities, Research Division - Senior MD And the 48 - volt... Louis Tonelli - Magna International Inc. - VP of IR Just under 1/4 of our sales in '27. Seetarama Swamy Kotagiri - Magna International Inc. - CEO & Director That managed sales number. NOVEMBER 03, 2023 / 12:00PM, MG.TO - Q3 2023 Magna International Inc Earnings Call 6 REFINITIV STREETEVENTS | www.refinitiv.com | Contact Us ©2023 Refinitiv. All rights reserved. Republication or redistribution of Refinitiv content, including by framing or similar means, is prohibited without the prior written consent of Refinitiv. 'Refinitiv' and the Refinitiv logo are registered trademarks of Refinitiv and its affiliated companies.

Christopher Patrick McNally - Evercore ISI Institutional Equities, Research Division - Senior MD And then what about plug - in as well? Because obviously, there's definitely more of a concern around Pure EV than plug - in has sort of continued? There is a decent amount of PHEV, right, in your high - voltage for powertrain as well . Seetarama Swamy Kotagiri - Magna International Inc . - CEO & Director Yes . I think most of our -- if you look at the general sales, overall powertrain, at significant pace, I think, is in the 48 - volt substantially in the hybrids . There is a product line that we talked about in the PHEVs, but it's predominantly in 48 - volts, which could be applied to the PHEV part of it and pure EV switches in the e - drives . Christopher Patrick McNally - Evercore ISI Institutional Equities, Research Division - Senior MD Okay . And then the only last bit of detail within battery enclosures, since it's new, and obviously, there is one large platform that you discussed a win on . How diversified if I look through 2025 , is that sort of $ 1 . 6 billion? Are we talking a handful of OEMs? Or is it 5 or 5 to 8 ? Seetarama Swamy Kotagiri - Magna International Inc . - CEO & Director So I think we are talking about 8 OEMs, Chris . We are talking over years that's included in the projections that we mentioned in the figures, that's 8 OEMs . Louis Tonelli - Magna International Inc . - VP of IR And that's global . Seetarama Swamy Kotagiri - Magna International Inc . - CEO & Director And it's global . Christopher Patrick McNally - Evercore ISI Institutional Equities, Research Division - Senior MD That's great . And if I could just squeeze one last one on pricing recoveries . Obviously, we've talked so much about EVs over the last week that we kind of forgot about the older issues that we all used to talk about on Q 2 . Could you talk about the pace of recoveries, how it's going? Maybe just what's left in terms of could this be an extended tailwind into ' 24 , because obviously you get the annualization of any price recoveries you've gotten in the second half? Seetarama Swamy Kotagiri - Magna International Inc . - CEO & Director We've been disclosing, I would say, the net impacts rather than specific amounts, right? And if you look at the certain costs in energy have declined, there is a improving trend in commodities in certain cases . And I would say we are on track to obtain the recoveries necessary to meet our outlook . Maybe a little bit of color . We talked about the $ 100 million at the beginning of the year as headwinds . And in our last call, we talked about that being reduced to $ 50 million . And as we stand here today, we are at 0 . That means the $ 100 million has been brought down to 0 , but we continue our discussions and the focus still remains, right, on all the things, whether it is operational excellence, whether it is looking at every program and continuing discussions with customers, not specific only to ' 23 , we have always talked about looking at it holistically from ' 22 and even going forward planning into ' 24 . NOVEMBER 03, 2023 / 12:00PM, MG.TO - Q3 2023 Magna International Inc Earnings Call 7 REFINITIV STREETEVENTS | www.refinitiv.com | Contact Us ©2023 Refinitiv. All rights reserved. Republication or redistribution of Refinitiv content, including by framing or similar means, is prohibited without the prior written consent of Refinitiv. 'Refinitiv' and the Refinitiv logo are registered trademarks of Refinitiv and its affiliated companies.
Operator We'll proceed with our next question on the line . It is from Mark Delaney with Goldman Sachs . Mark Trevor Delaney - Goldman Sachs Group, Inc . , Research Division - Equity Analyst First, as you guys are thinking about your prior target to reach profitability in mega - trend areas in 2025 , as you're seeing some of the traditional OEMs revisit the radar ramps around EVs and including some in North America, where you've disclosed wins . Do you still think you can reach that profitability target in 2025 ? And if so, are you contemplating having to make some changes in order to still get there? Seetarama Swamy Kotagiri - Magna International Inc . - CEO & Director Mark . Yes, when we talk about the mega - trend areas, it's not purely electrification . Part of it is ADAS also and other products that are included in there . We have to go through the customer changes in the road map, if any, as we are going through the plan right now . But I would say we have, in some cases, had call it, different business models, which are kind of tied, not completely tied to volumes . But I can give you an example this year on one program where there was a change in volume, we had a commercial settlement, right? And in some cases, we are looking at models where the capital inlay is put forward by the customer related to [NAV] program . So there are multiple ways we are looking at it to mitigate or minimize risk, obviously, cannot take all the risk away . We've been doing this, but I think this is a little bit more deliberate and more proactive when we talk about the EV platforms . But I think we'll be able to give more color when we come back in February for the outlook . Patrick W . D . McCann - Magna International Inc . - Executive VP & CFO And I think, Mark, when we talk about the mega - trends, there is a big improvement in the ADAS business, specifically as we start launching these programs, and that's regardless whether it were distributed across ICE and EVs in that space . So you're expensing significant engineering today . And as those revenues launch, we should have a lot of contribution margin dropping to the bottom line . So it's really not just an EV explanation into ' 25 . Mark Trevor Delaney - Goldman Sachs Group, Inc . , Research Division - Equity Analyst Very helpful . And in terms of the updated EBIT margin guide, you're taking up your margin guidance on pretty similar revenue and despite the UAW strike headwind that you're now having to overcome . You gave us a number of metrics around various puts and takes, but maybe just level set us and summarize a bit what's driving the better EBIT margin despite some of these headwinds? And is there anything unusual that you would say that's more temporal helping the margins in the second half of this year? Or do you think this is (inaudible) of the profit potential and gives you guys some good momentum towards the at least 230 bps of margin expansion by 2025 that you'd previously talked about? Patrick W . D . McCann - Magna International Inc . - Executive VP & CFO I can start and Swamy jump in . When you look at the -- I think, guide to guide, we're really just executing where we expect it to be . Volumes have come in a little bit stronger . If you look on an annual basis, we've said from -- since beginning of February that we're going to improve our margins as we go through the year, and that was driven by launches, some changeovers, but also just the timing of recoveries of our commercial settlements . I think we're tracked on that plan . The one change, I would say, since February really has been the execution on the operational front that we're exceeding our targets for NOVEMBER 03, 2023 / 12:00PM, MG.TO - Q3 2023 Magna International Inc Earnings Call 8 REFINITIV STREETEVENTS | www.refinitiv.com | Contact Us ©2023 Refinitiv. All rights reserved. Republication or redistribution of Refinitiv content, including by framing or similar means, is prohibited without the prior written consent of Refinitiv. 'Refinitiv' and the Refinitiv logo are registered trademarks of Refinitiv and its affiliated companies.
whether it's cost recoveries or cost containment and our acceleration of our improvement plans . I think that's the big drive . And that's what's given us confidence . We're reiterating what we said in September that we have confidence in our ' 25 numbers . Louis Tonelli - Magna International Inc. - VP of IR And we're taking our input cost down . We said there was going to be a headwind of 50 last time around saying it's basically neutral now . So that's another contributor to the outlook to outlook improvement . Seetarama Swamy Kotagiri - Magna International Inc. - CEO & Director Yes . In summary, I would say, Pat, we -- there is not any temporal topic that has added to the expansion, but it's just operational excellence and the great trend of the materials and energy . Patrick W. D. McCann - Magna International Inc. - Executive VP & CFO Correct. Operator We'll proceed with our next question on the line from Gautam Narayan with RBC. Gautam Narayan - RBC Capital Markets, Research Division - Assistant VP The first one, I'm sorry, I missed this in the prepared comments . Could you review the UAW impact on just their absolute revenue and EBIT impact that you -- or EBITDA or EBIT impact that you've (inaudible) far or you expect in ' 23 first? Patrick W. D. McCann - Magna International Inc. - Executive VP & CFO Yes . Tom, it's Pat . So just a level set, our Q 3 impact was $ 55 million in sales, about 10 basis points on margin . Q 4 , we're estimating an additional about $ 255 million for a full year basis, $ 310 million of sales with an impact of 10 to 15 basis points on our guide . Gautam Narayan - RBC Capital Markets, Research Division - Assistant VP Okay . I mean, obviously, the next question is on the EV side . So I guess the question has to do with how orders work -- the order book works? We saw some commentary yesterday from a couple of suppliers, suggesting maybe some caution on the order book . Just curious in terms of how susceptible or how would -- how concerning could cancellations be should this downturn get more severe or "EV slowdown" gets severe? Just I mean, do you have a lot of visibility on the orders . It's a situation of like 50 % growth going to 30 % growth, so you have enough inertia to help you . Just trying to get a sense of the visibility on the order book around electrification . Seetarama Swamy Kotagiri - Magna International Inc . - CEO & Director Tom, as we look at it, it's -- we haven't really seen any cancellations . And as I mentioned to one of the previous question, if there is a volume change in terms of the planning . It is a discussion that we have with the customer . And I wouldn't say we have seen anything significant, maybe on I think that might at one point that might help . If you look at just non - electrification but all content on EV platforms, we are in single digits as a percent of sales, right, in 2023 . Going out to 2025 , maybe 1 / 5 of our business roughly is connected to EV platforms . NOVEMBER 03, 2023 / 12:00PM, MG.TO - Q3 2023 Magna International Inc Earnings Call 9 REFINITIV STREETEVENTS | www.refinitiv.com | Contact Us ©2023 Refinitiv. All rights reserved. Republication or redistribution of Refinitiv content, including by framing or similar means, is prohibited without the prior written consent of Refinitiv. 'Refinitiv' and the Refinitiv logo are registered trademarks of Refinitiv and its affiliated companies.

But again, I want to reiterate . We always look at volume planning from our perspective based on customer, based on platform, based on segment of the vehicle, looking at anxious data and other sources . So there is a, call it, the Magna volume that we have to have a judgment on . That's one aspect of it . The other one, like I said, look, even on ICE, there are several programs which don't hit the volumes that we predicted . And we have mechanisms to have those discussions with their customers . This is besides having capital outlay in tranches, having flexible manufacturing so that we can flex as the volumes change obviously within reason . And there are some cases where the volumes are up . So it's a complex, variable equation here, but we've had this with customers . And there is a little bit of uncertainty, and that's where I said, in some cases, the models on EV platforms, the customer has come forward with the capital . And some, we already had settlement, where the volumes change significantly . And in some cases, we are looking at the same product where the platform has both ICE and EV . So depending on which does better, there is a little bit of an edge . So there's a lot of these things that we look at it from our planning perspective to again mitigate risk, not completely, but it gives us enough comfort . Gautam Narayan - RBC Capital Markets, Research Division - Assistant VP Okay . And another thing that we heard yesterday was that there seems to be this kind of divergence of opinion on this EV decline story geographically with a lot of Americans, let's say, thinking that we're in this Armageddon scenario . And then over in Europe, it's kind of an opposite view . Just curious in terms of your OEM exposure on to EV specifically investment . Does that -- is that something that's pretty geographically balanced? Or how would you characterize that your EV kind of exposure to geographically on OEMs? Seetarama Swamy Kotagiri - Magna International Inc . - CEO & Director Yes . I think generally, if you look at it, our overall sales, we are about 60 % or so in North America and about 35 % in Europe and the rest in other but predominantly China . And we have said from a reasonable perspective, the electrification take rates are higher in China, followed by Europe, followed by North America . But Tom, this is very specific on platforms . We have to not just look overall to a weak segment . It's a little bit of a judgment to say when we have relationships with the customer where we are having reasonable conversations in terms of business models, which platform . A lot of that comes in rather than a generic view on region by region . Gautam Narayan - RBC Capital Markets, Research Division - Assistant VP Got it . Yes . My last one is just on that other topic, the price/mix topic . Obviously, the OEMs benefited on the way up in the past 3 years . And if we do get a normalization in price mix, one of the fears is that potentially the OEMs could go to suppliers and ask for price downs . How has that happened historically in the past? Is it that you guys typically benefit on volume recovery regardless if price/mix is coming down for your OEM customers? Or do they have the ability to squeeze you guys as price/mix comes down? Seetarama Swamy Kotagiri - Magna International Inc . - CEO & Director Yes . Those conversations have never been easy . And like you said, even when they were doing well in the last 3 years, I would say the conversations still were not easy . But I can say that we talked about various things and recoveries, looking at underperforming programs coming to an end . Input cost inflation, whether it was semiconductors or others . They were tough conversations, and I talked about getting the headwinds to be neutralized this year . All I can say is they will continue to be . They recognize that we have been living in this tough environment of inflation and chip shortages and supply constraints over the last 3 years . So we already have been living in that, right? So I think we are not going to change our thinking process to be speaking objectively with data . We have hands - on conversations, but I would say they were fair and cordial . NOVEMBER 03, 2023 / 12:00PM, MG.TO - Q3 2023 Magna International Inc Earnings Call 10 REFINITIV STREETEVENTS | www.refinitiv.com | Contact Us ©2023 Refinitiv. All rights reserved. Republication or redistribution of Refinitiv content, including by framing or similar means, is prohibited without the prior written consent of Refinitiv. 'Refinitiv' and the Refinitiv logo are registered trademarks of Refinitiv and its affiliated companies.

Operator We'll get our next question on the line . It is from Dan Levy with Barclays . Dan Meir Levy - Barclays Bank PLC, Research Division - Senior Analyst I wanted to just follow up on the last -- on the last question . And specifically, the commercial recoveries in the quarter, just any color was that at all, was it retroactive? Is it piece price? Just any color on what the recoveries were in the quarter that you saw? Magnitude as well . Seetarama Swamy Kotagiri - Magna International Inc . - CEO & Director I think we talked about it again, net impact other than growth, and I talked about the $ 100 million, right? And there's a complexity of talking productivity versus inflation recoveries and a whole bunch of other things . I would say about 2 / 3 of the recoveries in general are more related to flow - through purchase orders indexing and so on that would continue going forward and about roughly 1 / 3 or onetime, right? So the ones that are more mechanism - based, whether getting on an index or purchase orders and so on and so forth will flow - through into the following years . And the conversation of the onetime depends on, for example, energy and where they are versus what the recovery needs to be . So it's kind of a mix . Patrick W . D . McCann - Magna International Inc . - Executive VP & CFO And Dan, if I can just add . When you compare it to our expectations, we didn't have a win on recoveries or commercial in our guidance . Really, when we're talking about our increase on net inflation to pick up, it's related to last year on the commercial side . And we've been guiding all year that we had roughly a 45 basis point headwind related to commercial issues, and that's what's coming through . Dan Meir Levy - Barclays Bank PLC, Research Division - Senior Analyst Okay . And then just the second, if you could maybe give us a sense of what's happening within the segment . And specifically, Seating, I know it doesn't get a lot of air time, but this is the best margin you posted in a while . So just any voice over on Seating? And then Complete Vehicles, we know that you said that there would be a changeover and that would try get negative margins, I don't think any of it expected . Maybe you could just give us a sense of when you get past this changeover and where those margins in Complete Vehicles should normalize to? Seetarama Swamy Kotagiri - Magna International Inc . - CEO & Director So I think, again, as we talk a little bit about Seating . I think we've been saying over the last few quarters and calls that we had really unfavorable mix in ' 22 . And with the chip supply getting better, we are seeing a more normalized volume on some of the big platforms that we have . And therefore, we see the flow - through materializing . And a lot needs to be set up both the team continuing to focus on executing as we had talked about various initiatives . So that's -- I'm glad we've been talking about Seating that it was a mix issue, and it is really showing now, right? I think you're right on the Complete Vehicles where we have said that the changeover and the launch cycle, it was impacting and it's still in line with the expectation that we have in that segment . And I think as we get past this year into the next year, we'll be able to give more color when we come back in February . But as we stand here today, I think it's tracking to what we expect . Operator We'll proceed with our next question on the line from Colin Langan with Wells Fargo . NOVEMBER 03, 2023 / 12:00PM, MG.TO - Q3 2023 Magna International Inc Earnings Call 11 REFINITIV STREETEVENTS | www.refinitiv.com | Contact Us ©2023 Refinitiv. All rights reserved. Republication or redistribution of Refinitiv content, including by framing or similar means, is prohibited without the prior written consent of Refinitiv. 'Refinitiv' and the Refinitiv logo are registered trademarks of Refinitiv and its affiliated companies.

Colin M . Langan - Wells Fargo Securities, LLC, Research Division - Senior Equity Analyst If I look at the implied second half margin, it's around 5 . 6 % , which is clearly above your full year guidance -- full year outlook . Should we be thinking of that as the right sort of jumping off point as we go into ' 24 ? Or you kind of mentioned that there's sort of a cadence of recoveries? So is there sort of a little help from the recoveries in the first half that's helping that second half margin making it, sort of maybe not a good base to be thinking about? Patrick W . D . McCann - Magna International Inc . - Executive VP & CFO I think when you look at the second half, you're correct, but this is what we have been expecting that as we get through the back half of the year, the recovery is going to be more back half loaded . As we move into -- and as Swamy said earlier, we're still comfortable with where we're going in our ' 25 projections . And we're in the middle of our BP process, but we do have to get through volumes and assumptions and whatnot . But coming in, do we expect to have a reduction in margins to ' 24 ? No . Do we think we can launch from the mid - 5 s upwards? I agree with that . Colin M . Langan - Wells Fargo Securities, LLC, Research Division - Senior Equity Analyst Okay . Got it . And then -- you mentioned before you -- so how should we think about the cadence as we go into next year? Because it sounds like you still have 1 / 3 of your recoveries might need to get renegotiated in some form . So does that mean there's going to be the sort of continued sort of tougher Q 1 until you get those recoveries? Or is this becoming more of an automatic formula because if certain conditions are met, you can kind of just get them January 1 . Louis Tonelli - Magna International Inc . - VP of IR I think it's way too early to comment on cadence in 2024. We need to get through our planning process and we'll have a bit of sense for that. Colin M. Langan - Wells Fargo Securities, LLC, Research Division - Senior Equity Analyst I guess I was trying to get at maybe like how it normally works? Does -- do you have to start those negotiations at the beginning of next year again? Or is it more of a -- trying to understand the triggers that would help you get those recoveries for that whatever is not locked into piece price . Seetarama Swamy Kotagiri - Magna International Inc. - CEO & Director So Colin, I think, like I said, the one that is in a mechanism basis that kind of flows through, but the other will be data based on where our set of assumptions are in terms of energy and commodities and so on, right? So that will be a very fact based . So some conversations for ' 24 are already on the table to the extent that we know the information . And if you remember in the last 2 calls, I said it's -- when we talk ' 23 , it's not just only ' 23 . Some of it is ' 22 and some of it is forward - looking to think about what ' 24 would look like . But like Louis said, that will become more definitive once we finish our set of assumptions and have the plan in front of us . Operator We'll proceed with our next question on the line from Joseph Spak with UBS Securities. NOVEMBER 03, 2023 / 12:00PM, MG.TO - Q3 2023 Magna International Inc Earnings Call 12 REFINITIV STREETEVENTS | www.refinitiv.com | Contact Us ©2023 Refinitiv. All rights reserved. Republication or redistribution of Refinitiv content, including by framing or similar means, is prohibited without the prior written consent of Refinitiv. 'Refinitiv' and the Refinitiv logo are registered trademarks of Refinitiv and its affiliated companies.

Joseph Robert Spak - RBC Capital Markets, Research Division - Former Autos and Leisure Analyst Maybe a little bit of housekeeping just to start because I'm a little bit confused on the amortization color you provided . Like we just did your prior guidance by about 10 basis points, which suggests about $ 40 million . But then when I look in the quarter, it looks like you added back $ 32 million in the quarter . So how do we square that because it doesn't seem like that, was the amortization like abnormally high in this quarter? Like why would it step down? Like and maybe you could just give us a better sense of sort of what you think -- what the full year amortization was last year or this year? And what the right run rate is going forward so we can properly adjust our models? Patrick W . D . McCann - Magna International Inc . - Executive VP & CFO Yes . So on the amortization, so we're trying to get an apples - and - apples comparison . So what we've done, when you look at our financial reporting that will come out today, it's very clearly listed on our analyst report on our financials . But just specifically to the numbers, when we guided in August, we said $ 30 million for half a year for Veoneer . So Veoneer is about $ 60 million of an impact annually . When we did our final scrub of all the other acquisitions that we had out there on an annual basis, there's approximately another $ 50 million that is going to flow through . So on an annual basis for the next couple of years, it's going to ebb and flow as stuff rolls off, but you're in that $ 110 million range -- and last year would have been about 50 - 50 . Joseph Robert Spak - RBC Capital Markets, Research Division - Former Autos and Leisure Analyst So it's $ 50 million and going forward, it's one time . Patrick W . D . McCann - Magna International Inc . - Executive VP & CFO Correct . And this year would be [ 80 - 80 ] . Joseph Robert Spak - RBC Capital Markets, Research Division - Former Autos and Leisure Analyst Right . So then -- the -- I know you think you said year - over - year sort of prior year, maybe this is in the document and you sort of get a chance to look through, but like as we think about fourth quarter, is the -- what's sort of the right jumping off point for the new measure of adjusted EBIT? Is it like that seem like $ 11 million or $ 11 million or so that we need to add back to the fourth quarter? Louis Tonelli - Magna International Inc . - VP of IR Yes . $ 11 million relative to what we said last quarter because we basically would have implied $ 15 million . So about $ 11 million is what we would have incremental to what we said last quarter . Joseph Robert Spak - RBC Capital Markets, Research Division - Former Autos and Leisure Analyst Okay . The second question is if we look at BES margins like implied in the fourth quarter, and you look at your full year guidance for segment, there's a step down . I know that, that segment has been performing better year - to - date in part, I think, with some better performance at some of those underperforming facilities . But how much of that step down is strike related because I know there's some big customers there . How much of it is maybe a little bit of a push out from the battery enclosures business? And I guess related to the battery enclosures but I know you've made sort of big CapEx investment . Is there anything to sort of maybe slow or retime some of that spend? Or is this something you just need to invest through? NOVEMBER 03, 2023 / 12:00PM, MG.TO - Q3 2023 Magna International Inc Earnings Call 13 REFINITIV STREETEVENTS | www.refinitiv.com | Contact Us ©2023 Refinitiv. All rights reserved. Republication or redistribution of Refinitiv content, including by framing or similar means, is prohibited without the prior written consent of Refinitiv. 'Refinitiv' and the Refinitiv logo are registered trademarks of Refinitiv and its affiliated companies.
Patrick W . D . McCann - Magna International Inc . - Executive VP & CFO Yes . So I think there's 2 parts to the question . So I'll start with the first one . So from Q 3 into Q 4 , you're correct . The impact of the strike at the UAW business higher in the fourth quarter relative to the third . So that's a drag on margins . The other issue, or not issue, is just a fact as we continue to launch business, we tend to launch business more in the fourth quarter relative to the third . So that's dragging margins . But that would have been as expected . This is really a change from guidance to guidance, and that's reflected in our increased guidance range for BES for the full year . On the second part of the question related to battery trade . Battery trades really aren't dragging the margin in the sense that most of the spend in the battery trade space is related to capital and it gets put onto the balance sheet . As far as timing of spend, we're sequencing our capital as required -- just to be clear, we're not in a situation of building something and waiting for business to happen . We have facilities and we're scaling the build related to the customers' production plan . So we're scaling our capital as needed . As Swamy said earlier, those plans change . We're going to adapt as well so that we can delay our spend to the amount needed or as necessary . But we have to push forward in this space, but it's not really a margin impact related to this year . Louis Tonelli - Magna International Inc . - VP of IR Yes . I would just add, in terms of the UAW strike, it is a little more weighted not only Q 4 versus Q 3 , but a little more weighted to BES, so the other segments . So I think that's dragging . If you look at our implied fourth quarter, it really didn't change that much . So it isn't really sales it has impacted really in any one segment, all that meaningfully . It's really just the -- waiting and the UAW strike, I think in that BES . Joseph Robert Spak - RBC Capital Markets, Research Division - Former Autos and Leisure Analyst So is it like something that a need handle, a better underlying rate for that business at this point if we sort of back out some elevated launch activity in the fourth quarter and the strike? Louis Tonelli - Magna International Inc. - VP of IR Well, I mean, we're applying kind of a range of 5% to 6.5% for the fourth quarter, right? Joseph Robert Spak - RBC Capital Markets, Research Division - Former Autos and Leisure Analyst Right. But I thought you mentioned there's some unusual stuff in the fourth quarter, right, at least the strike? Louis Tonelli - Magna International Inc. - VP of IR Yes. I mean we're not going to comment on where we're expecting to go beyond this, we'll give more color on I think in February. Operator We'll get to our next question on the line. It is from James Picariello from BNP Paribas. James Albert Picariello - BNP Paribas Exane, Research Division - Research Analyst Just back on the Seating business . So I know you guys don't provide a backlog, but of course, you have one . One of your competitors -- and also back on the EV topic . One of your competitors, they stated that their new business backlog, about 80 % of it, for next year was tied to EV programs . And they went ahead and cut that backlog contribution for next year by 20 % just based on their perceived visibility or real visibility in what those NOVEMBER 03, 2023 / 12:00PM, MG.TO - Q3 2023 Magna International Inc Earnings Call 14 REFINITIV STREETEVENTS | www.refinitiv.com | Contact Us ©2023 Refinitiv. All rights reserved. Republication or redistribution of Refinitiv content, including by framing or similar means, is prohibited without the prior written consent of Refinitiv. 'Refinitiv' and the Refinitiv logo are registered trademarks of Refinitiv and its affiliated companies.
EV build schedules look like . So -- just curious what your EV program mix in the new business draw for the coming years? What that could look like in the Seating business? And if any other major product categories that are, of course, power trade agnostic come to mind in terms of this EV exposure? Seetarama Swamy Kotagiri - Magna International Inc . - CEO & Director I think one of the things I mentioned overall, if you look at Magna this year, right, like all content or total sales related to EV platforms is less than 10 % , right? And if you look at the specific question, I think you're talking about in Seating, I think Louis, picked content for us on EV platforms today in Seating is not material . So we don't see that impact obviously going forward into the outer years, which is too premature to comment, right, in terms of volumes . Because given the type of operations and so on, in outer years as we launch, I think we'll have to recalibrate with the customers if there is a significant change . Again, going back to my previous comments, we'll work with them to see how we need to recalibrate and what needs to be really put in place if there is a substantial change . James Albert Picariello - BNP Paribas Exane, Research Division - Research Analyst Okay . Understood . And then just one quick one on the LG powertrain JV . Yes, as we think about the targeted revenue ramp to $ 1 . 5 billion or $ 1 . 6 billion, whatever the number is over the coming years, just in terms of the customer, regional mix of that joint venture, what that looks like? Seetarama Swamy Kotagiri - Magna International Inc . - CEO & Director Yes . I think we were roughly talking about $ 1 billion this year, Louis, right? And if you look at it, the customer mix is between North America and we are getting into Europe, right? And it is on programs that have been already there . And obviously, some will be going forward and launching . And this is what I would call [limblock] which is like the e - machine and the inverter which are like a platform . And we think not specific only to a program . There is a certain amount of specificity to a program, but there is also a generalized asset, which applies to machines in general . So I think there is a certain amount of flexible as we talk about the manufacturing and the engineering related to this and it's not tied to one program . So again, going back to this is where we talked about flexibility there . Again, we'll have to look at the numbers as we get from the customers if there is a substantial change . But as we sit here today and look at what's out there, we haven't seen a big drop or change, but we'll be able to update based on our plans coming back into February again . Operator And we'll proceed with our next question on the line from Jonathan Goldman from Scotiabank . Jonathan Goldman - Scotiabank Global Banking and Markets, Research Division - Associate So just a quick one on the macro . I believe your previous North American production outlook did not factor in the impact from strikes . So if we strip out the impact that you're projecting, your underlying production out would be up from previous expectations? Can you just discuss what you're seeing in the macro environment that supports the relatively better outlook? NOVEMBER 03, 2023 / 12:00PM, MG.TO - Q3 2023 Magna International Inc Earnings Call 15 REFINITIV STREETEVENTS | www.refinitiv.com | Contact Us ©2023 Refinitiv. All rights reserved. Republication or redistribution of Refinitiv content, including by framing or similar means, is prohibited without the prior written consent of Refinitiv. 'Refinitiv' and the Refinitiv logo are registered trademarks of Refinitiv and its affiliated companies.

Patrick W . D . McCann - Magna International Inc . - Executive VP & CFO Yes, exactly . So when we guided in August, we guided x . We didn't assume any UAW or uniform issues at 15 . 2 million units . Our estimate is that we lost 220 , 000 units as a result of the UAW labor disruptions, which would imply 15 . 4 million . Of the 15 . 4 million of the 200 million increase that primarily came through in the third quarter . Jonathan Goldman - Scotiabank Global Banking and Markets, Research Division - Associate On more new progress or product launches or market growth or any puts and takes there? Patrick W . D . McCann - Magna International Inc . - Executive VP & CFO Can you repeat the question? You just broke up a bit? Jonathan Goldman - Scotiabank Global Banking and Markets, Research Division - Associate Yes. So the incrementally positive market outlook, could you just discuss any puts and takes that you're seeing? Louis Tonelli - Magna International Inc. - VP of IR I just (inaudible) draws from our customers relative to what we were anticipating. Jonathan Goldman - Scotiabank Global Banking and Markets, Research Division - Associate Okay . Fair enough . And then another housekeeping one . You raised the margin guidance, but it looks like below the line items are flat and you maintained the free cash flow guidance for the year . Could you just help me bridge the delta there? Patrick W. D. McCann - Magna International Inc. - Executive VP & CFO Yes . I think the simple answer is that it's just a movement within the range . When you work through the math, we were comfortable holding the range where it was at . Jonathan Goldman - Scotiabank Global Banking and Markets, Research Division - Associate And there's nothing particularly going on with working cap or anything else? Louis Tonelli - Magna International Inc. - VP of IR No, exactly. Operator We'll get to our next question on the line from Michael Glen with Raymond James. NOVEMBER 03, 2023 / 12:00PM, MG.TO - Q3 2023 Magna International Inc Earnings Call 16 REFINITIV STREETEVENTS | www.refinitiv.com | Contact Us ©2023 Refinitiv. All rights reserved. Republication or redistribution of Refinitiv content, including by framing or similar means, is prohibited without the prior written consent of Refinitiv. 'Refinitiv' and the Refinitiv logo are registered trademarks of Refinitiv and its affiliated companies.
Michael W . Glen - Raymond James Ltd . , Research Division - Director Can you just talk a little bit about Power & Vision margins? Like what I'm just trying to understand is the sequential uptick from Q 2 into Q 3 , even excluding the amortization of intangible dynamic, like you're showing a pretty notable lift from Q 2 and Q 3 . Was Veoneer accretive to Power & Vision margin in the quarter? Just trying to figure out exactly what's behind the lift? Seetarama Swamy Kotagiri - Magna International Inc . - CEO & Director Michael, I think if you look at the first half, we had a warranty item and there was a net negative commercial item in the Q 2 , and there was higher engineering costs . So that's kind of some in the first half . If you look at the second half, and obviously, we also had net input costs, which were a headwind in the first half . So if you look at the higher sales in the second half and you take out all the onetimers, the warranty item, the higher engineering cost out that added to the bottom line, and the equity income was higher . Michael W . Glen - Raymond James Ltd . , Research Division - Director Okay . And Veoneer, any comments on the contribution of Veoneer in the quarter to EBIT -- Power & Vision EBIT? Seetarama Swamy Kotagiri - Magna International Inc . - CEO & Director I would say the comments that we gave in the last call that we are in line with the expectations that we had during closing with Veoneer, and we continue to have good traction to realize the synergies that we talked about . Michael W . Glen - Raymond James Ltd . , Research Division - Director Okay . And then what -- just in terms of North America, I know that this quarter, there is a strike and everything like that . But would you say performance this quarter was consistent? Like I'm trying to assess at the platform level and you identify your larger platforms each year in the AIF . Would you say there was a pickup in the quarter across some of the smaller programs that you have in North America? Or was it generally consistent with prior periods? As in are the larger and more profitable programs at the level you expected in the period? Louis Tonelli - Magna International Inc . - VP of IR To be completely honest, I don't have that in front of me, so it's really hard, but we don't look at it by region . So I'd have to look at it and see how we compares to what we see historically . I don't think there was anything notable that I can see in the quarter, but I'll look at it more closely . Operator And Mr. Kotagiri, there are no further questions at this time. I'll now turn the call back to you for any closing remarks. Seetarama Swamy Kotagiri - Magna International Inc. - CEO & Director Thanks, everyone, for listening in today . Happy with our continued progress in 2023 . We have a relentless focus on execution of our strategy and meeting our mid - and long - term targets . And we have ongoing confidence in our ability to meet our plans . Thank you, and have a great day . Operator And that does conclude the conference call for today. We thank you for your participation as you disconnect your lines. Have a good day, everyone. NOVEMBER 03, 2023 / 12:00PM, MG.TO - Q3 2023 Magna International Inc Earnings Call 17 REFINITIV STREETEVENTS | www.refinitiv.com | Contact Us ©2023 Refinitiv. All rights reserved. Republication or redistribution of Refinitiv content, including by framing or similar means, is prohibited without the prior written consent of Refinitiv. 'Refinitiv' and the Refinitiv logo are registered trademarks of Refinitiv and its affiliated companies.
DISCLAIMER Refinitiv reserves the right to make changes to documents, content, or other information on this web site without obligation to notify any person of such changes . In the conference calls upon which Event Transcripts are based, companies may make projections or other forward - looking statements regarding a variety of items . Such forward - looking statements are based upon current expectations and involve risks and uncertainties . Actual results may differ materially from those stated in any forward - looking statement based on a number of important factors and risks, which are more specifically identified in the companies' most recent SEC filings . Although the companies may indicate and believe that the assumptions underlying the forward - looking statements are reasonable, any of the assumptions could prove inaccurate or incorrect and, therefore, there can be no assurance that the results contemplated in the forward - looking statements will be realized . THE INFORMATION CONTAINED IN EVENT TRANSCRIPTS IS A TEXTUAL REPRESENTATION OF THE APPLICABLE COMPANY'S CONFERENCE CALL AND WHILE EFFORTS ARE MADE TO PROVIDE AN ACCURATE TRANSCRIPTION, THERE MAY BE MATERIAL ERRORS, OMISSIONS, OR INACCURACIES IN THE REPORTING OF THE SUBSTANCE OF THE CONFERENCE CALLS . IN NO WAY DOES REFINITIV OR THE APPLICABLE COMPANY ASSUME ANY RESPONSIBILITY FOR ANY INVESTMENT OR OTHER DECISIONS MADE BASED UPON THE INFORMATION PROVIDED ON THIS WEB SITE OR IN ANY EVENT TRANSCRIPT . USERS ARE ADVISED TO REVIEW THE APPLICABLE COMPANY'S CONFERENCE CALL ITSELF AND THE APPLICABLE COMPANY'S SEC FILINGS BEFORE MAKING ANY INVESTMENT OR OTHER DECISIONS . © 2023 , Refinitiv . All Rights Reserved . NOVEMBER 03, 2023 / 12:00PM, MG.TO - Q3 2023 Magna International Inc Earnings Call 18 REFINITIV STREETEVENTS | www.refinitiv.com | Contact Us ©2023 Refinitiv. All rights reserved. Republication or redistribution of Refinitiv content, including by framing or similar means, is prohibited without the prior written consent of Refinitiv. 'Refinitiv' and the Refinitiv logo are registered trademarks of Refinitiv and its affiliated companies.
Magna (NYSE:MGA)
Historical Stock Chart
From Apr 2024 to May 2024

Magna (NYSE:MGA)
Historical Stock Chart
From May 2023 to May 2024
