1st Colonial Bancorp, Inc. (OTCBB:FCOB), holding company of 1st
Colonial National Bank, today reported that its net income for the
nine months ended September 30, 2009 was $449,000 ($0.15 per
share), compared to $653,000 ($0.22 per share) for the nine months
ended September 30, 2008.
Gerry Banmiller, President and Chief Executive Officer,
commented, “Although these year-to-date earnings for 2009 are lower
than the prior year, they must be considered in the context of
several factors: First, our core earnings actually increased in
2009, as we had a one-time gain from insurance proceeds of $232,000
in 2008. Absent this one-time gain, our pre-tax net income for the
nine months ended September 30, 2009 of $461,000 was $15,000
greater than our adjusted pre-tax income of $446,000 for the nine
months ended September 30, 2008. Second, we achieved this increase
in our core earnings despite the increased expenses that are
concomitant with a troubled economy, such as an increased provision
for loan losses, the FDIC special assessment imposed on all banks,
and legal expenses inherent with enforcing loan contracts. We are
pleased with our deposit and loan growth, which is a function of
the individual efforts of our officers as well as increased
advertising in newspaper and radio.”
At September 30, 2009, 1st Colonial also reported total assets
of $257.4 million compared to $225.6 million at September 30, 2008;
total loans were $160.5 million, an increase of
$19.1 million from September 30, 2008. Deposits were $221.1
million, an increase of $27.1 million from September 30, 2008.
1st Colonial’s net interest income of $5.2 million for the nine
months ended September 30, 2009 was $572,000, or 12.3%, higher than
the net interest income of $4.7 million for the nine month period
ended September 30, 2008. The provision for loan losses was
$807,000 compared to $704,000 for the prior period.
Non-interest income increased $194,000 from the comparable
period in 2008 due to an increase in income from our new
Residential Lending Division. Fees from the sale of residential
mortgage loans increased by $445,000 in the first nine months of
2009 compared to the same period in 2008. Non-interest income in
the third quarter of 2008 was aided by the onetime insurance
proceeds benefit of $232,000 mentioned above. Non-interest expense
also increased $880,000 or 22.0% from the comparable period in
2008. Salaries and benefits accounted for $491,000 of the increase
due to the addition of our residential lending department and
general salary and benefit increases. FDIC assessments increased by
$180,000; occupancy and equipment expense increased by $54,000 due
to our acquiring additional space in our administrative
headquarters to accommodate our growth; and professional fees
increased by $74,000.
The company also reported that its net income for the three
months ended September 30, 2009 was $109,000, a decrease of $33,000
from the comparable period ended September 30, 2008. Net income
from the comparable period ended September 30, 2008 included the
one time insurance proceeds benefit of $232,000. Additionally,
diluted earnings per share decreased from $0.05 for the quarter
ended September 30, 2008 to $0.03 for the quarter ended September
30, 2009. The earnings per share numbers stated herein for all
periods have been adjusted to reflect the 5% stock dividends paid
on April 15, 2009 and April 15, 2008.
Highlights as of September 30, 2009 and September 30, 2008, and
comparing the nine and three months ended September 30, 2009 and
the nine and three months ended September 30, 2008, respectively
(all unaudited), include the following (dollars in thousands,
except per share data):
At At $ increase/ % increase/
September 30, 2009 September 30, 2008
(decrease) (decrease) Total assets
$ 257,371 $ 225,608 $ 31,763 14.1% Total loans 160,467
141,329 19,138 13.5% Total deposits 221,107 194,004 27,103
14.0% Shareholders' equity 22,984 21,745 1,239 5.7%
For the nine months ended $ increase/ % increase/
September 30, 2009 September 30, 2008
(decrease) (decrease) Net interest
income $ 5,240 $ 4,668 $ 572 12.3% Provision for loan losses
807 704 103 14.6% Other income 902 708 194 27.4%
Non-interest expense 4,874 3,994 880 22.0% Tax benefit
(expense) (12) (25) (13) -52.0% Net income 449 653 (204)
-31.2% Earnings per share, diluted $ 0.15 $ 0.22 $ (0.07)
-31.8% For the three months ended $ increase/ %
increase/
September 30, 2009 September 30,
2008 (decrease) (decrease)
Net interest income $ 1,812 $ 1,614 $ 198 12.3% Provision
for loan losses 306 621 (315) -50.7% Other income 322 415
(93) -22.4% Non-interest expense 1,697 1,385 312 22.5%
Tax benefit (expense) (22) 119 141 -118.5% Net income
109 142 (33) -23.2% Earnings per share, diluted $ 0.03 $
0.05 $ (0.02) -40.0%
1st Colonial National Bank, the subsidiary of 1st Colonial
Bancorp, provides a range of business and consumer financial
services, placing emphasis on customer service, access to decision
makers and quick turnaround on credit applications. Headquartered
in Collingswood, New Jersey, the Bank also has branches in the New
Jersey communities of Westville and Cinnaminson. To learn more,
call (856) 858-8402 or visit www.1stcolonial.com.
This Release contains forward-looking statements that are not
historical facts and include statements about management’s
strategies and expectations about our business. There are risks and
uncertainties that may cause our actual results and performance to
be materially different from results indicated by these
forward-looking statements. Factors that might cause a difference
include economic conditions; lack of liquidity; changes in interest
rates, changes in FDIC assessments, deposit flows, loan demand, and
real estate values; competition; changes in accounting principles,
policies or guidelines; changes in laws or regulation; new
technology and other factors affecting our operations, pricing,
products and services.
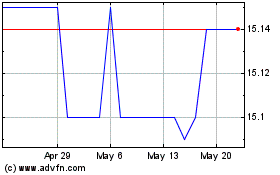
1st Colonial Bancorp (PK) (USOTC:FCOB)
Historical Stock Chart
From Jun 2024 to Jul 2024

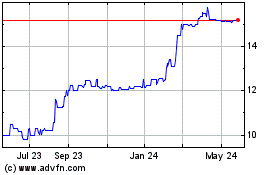
1st Colonial Bancorp (PK) (USOTC:FCOB)
Historical Stock Chart
From Jul 2023 to Jul 2024
