The Marketing Alliance Announces Transitional Financial Results for the Quarterly Period Ended March 31, 2005
03 August 2005 - 1:28AM
Business Wire
Highlights for the three-month period ended March 31, 2005 --
Company changes fiscal year end to March 31st -- Net income of
$384,000, or $0.19 per share -- Revenues increase 5% to $3.9
million -- Balance sheet remains solid with $2.5 million of working
capital and no long-term debt. The Marketing Alliance, Inc. (Pink
Sheets: MAAL) ("TMA"), a consortium of independent life insurance
brokerage general agencies located throughout the United States,
today announced financial results for the three months ended March
31, 2005. As previously announced, TMA's Board of Directors
approved a change in the Company's fiscal year to the period ending
March 31st from a calendar year ending on December 31st. The
Company decided to make this change as a means of better aligning
its fiscal year with the business cycle of its member agencies. The
next quarterly period the Company will report will be its fiscal
first quarter ended June 30, 2005. Revenues for the three-month
period ended March 31, 2005 increased to $3.9 million from $3.7
million in the same period last year, largely due to internal
growth among TMA's member agencies. Net operating revenue, or gross
profit, for the three months ended March 31, 2005 was $1.7 million,
or 44% of revenues, down slightly from the $1.8 million, or 48% of
revenues, reported in the same period last year, due primarily to
increased bonuses earned by TMA distributors. Operating expenses
for the three-month period ended March 31, 2005 rose 25% to
$930,000 from the same prior year period. This increase was largely
due to severance packages given to the Company's former CEO and
other personnel, and start-up costs relating to the Company's TMA
Marketing, Inc. subsidiary, which provides annuity products to TMA
member agencies. Despite these non-recurring charges, TMA reported
operating income of $775,000 in the three-month period ended March
31, 2005, as compared to operating income of $1.0 million in the
comparable prior year period. The Company reported net income of
$384,000, or $0.19 per share, in the three month period ended March
31, 2005, versus net income of $721,000, or $0.35 per share, for
the same period last year. The primary reason for this decline is a
realized and unrealized loss on investments during the period. In
April 2005, the Company reassessed its investment strategy, which
previously consisted of a portfolio largely containing equity
investments in regional banks. TMA has now shifted a large majority
of its investment portfolio to third-party financial managers, with
a focus on steady, long-term growth consistent with TMA's working
capital needs. Ronald D. Verzone, Chairman of TMA, stated, "Our
focus over the past year has been to aggressively address potential
areas of growth for the Company, while still adhering to our core
philosophy of providing our independent member agencies with the
means to compete within their marketplace. One of TMA's initiatives
was the opening of the Omaha Business Center in May 2004. The
Business Center offers TMA's distributors increased efficiency
levels for each transaction, as all aspects of the application
processing cycle are handled internally. This allows our
independent agents to allocate more time and resources to growing
their business. With the growth of the business center, we are
optimistic that we can continue to attract new agencies to our
expanding network." Mr. Verzone concluded, "We enter our next
fiscal year with a great opportunity to leverage our investments in
the Business Center and TMA Marketing Inc., which allows our
distributors that do not presently market annuity products to enter
a new profit center without any start-up costs. We are pleased to
have successfully completed both of these initiatives without
incurring any long-term debt, and feel that by continuing to
enhance the available products and capabilities of our
distributors, we are fueling TMA's growth." ABOUT THE MARKETING
ALLIANCE, INC. Headquartered in Pittsburgh, PA, TMA is one the
largest organizations providing support to independent insurance
brokerage agencies, with a goal of providing members value-added
services on a more efficient basis than they can achieve
individually. TMA's network is comprised of approximately 150
independent life brokerage and general agencies in 43 states.
Investor information can be accessed through the shareholder
section of TMA's website at
http://www.themarketingalliance.com/si_who.cfm. FORWARD LOOKING
STATEMENT Investors are cautioned that forward-looking statements
involve risks and uncertainties that may affect TMA's business and
prospects. Any forward-looking statements contained in this press
release represent our estimates only as of the date hereof, or as
of such earlier dates as are indicated, and should not be relied
upon as representing our estimates as of any subsequent date. These
statements involve a number of risks and uncertainties, including,
but not limited to, general changes in economic conditions. While
we may elect to update forward-looking statements at some point in
the future, we specifically disclaim any obligation to do so. -0-
*T Consolidated Statement of Operations Quarter Ended 3/31/2005
3/31/2004 Revenues $3,877,316 $3,689,554 ------------ -----------
Distributor Related Expenses Distributor bonus & commissions
paid 1,473,294 1,129,338 Distributor benefits & processing
698,858 772,380 ------------ ----------- Total 2,172,152 1,901,718
------------ ----------- Net Operating Revenue 1,705,164 1,787,836
Operating Expenses 930,446 742,444 ------------ -----------
Operating Income 774,718 1,045,392 Other Income (Expense) Interest
& dividend Income (net) 9,087 5,811 Realized & unrealized
gains (losses) on investments (net) (223,678) 205,827 Interest
expense (3,059) (6,925) Other (20,373) (18,454) ------------
----------- Income Before Provision for Income Tax 536,695
1,231,651 Provision for income taxes (152,778) (510,558)
------------ ----------- Net Income $ 383,917 $ 721,093
============ =========== Shares Outstanding 2,036,747 2,036,747
Operating Income per Share $ 0.38 $ 0.51 Net Income per Share $
0.19 $ 0.35 Consolidated Selected Balance Sheet Items As of Assets
3/31/2005 12/31/2004 Current Assets Cash $ 451,228 $ 354,640
Receivables 4,776,861 2,538,925 Investments 1,929,600 4,861,673
Other 287,826 273,542 ------------ ----------- Total Current Assets
7,445,515 8,028,780 Other Non Current Assets 460,754 490,563
------------ ----------- Total Assets $7,906,269 $8,519,343
============ =========== Liabilities & Stockholders' Equity
Total Current Liabilities $4,941,478 $5,938,469 ------------
----------- Total Liabilities 4,941,478 5,938,469 Stockholders'
Equity 2,964,791 2,580,874 ------------ ----------- Liabilities
& Stockholders' Equity $7,906,269 $8,519,343 ============
=========== *T
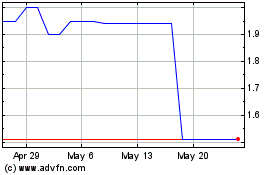
Marketing Alliance (PK) (USOTC:MAAL)
Historical Stock Chart
From Jun 2024 to Jul 2024

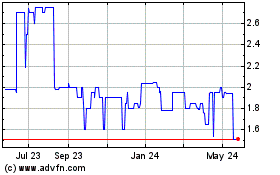
Marketing Alliance (PK) (USOTC:MAAL)
Historical Stock Chart
From Jul 2023 to Jul 2024
