Cooper Tire Earnings More than Double - Analyst Blog
10 May 2013 - 9:00PM
Zacks
Cooper Tire & Rubber Company (CTB) reported
earnings of 87 cents per share in the first quarter of 2013 that
more than doubled from 34 cents in the prior-year quarter. With
this, the company topped the Zacks Consensus Estimate by a
substantial margin of 21 cents per share. Net earnings also
increased significantly to $56.1 million from $21.6 million in the
first quarter of 2012.
However, revenues went down 12.5% to $861.7 million during the
quarter, missing the Zacks Consensus Estimate of $971.0 million.
The quarter recorded decline in volumes due to deployment of a
major phase of ERP system and inventory adjustments by certain key
customers. In addition, the soft global tire market and continuous
weakness in the world economy marred consumer spending.
Operating profit more than doubled to $96.7 million (11.2% of
sales) from $47.7 million (4.8%) a year ago. Operating profit in
the quarter was positively affected by lower material costs of $90
million and lower manufacturing costs of $19 million. These were
partially offset by $44 million in unfavorable price and mix and
$15 million in lower volumes.
Segment Details
The North American Tire Operations recorded a 14% decline in
revenues to $602.0 million. The decrease in sales was attributable
to a drop in unit sales (14%). The company’s total light vehicle
tire shipments in the U.S. were down 14%. Rubber Manufacturers
Association (RMA) member shipments declined 6% and total industry
shipments (that includes an estimate for non-RMA members) decreased
1% during the quarter.
Operating profits in the segment went up significantly to $71.0
million (11.9% of net sales) from $22.0 million in the first
quarter of 2012. This increase was attributable to a decrease in
raw material costs and lower product liability costs.
The International Tire Operations posted a 16% decline in revenues
to $341.0 million. The decrease was caused by lower pricing and mix
that more than offset the impact of higher unit volumes.
Operating profits went down 9.1% to $30.0 million (8.8% of net
sales) compared with $33.0 million (8.1%) a year ago. The profits
were favorably impacted by lower raw material costs and lower
selling, general and administrative costs, which were more than
offset by an unfavorable price and mix and higher manufacturing
costs.
Financial Position
Cooper Tire had cash and cash equivalents of $272.2 million as of
Mar 31, 2013, up from $257.6 million in the corresponding year-ago
quarter-end. Long-term debt stood at $351.6 million as of Mar 31,
2013, translating into a long-term debt-to-capitalization ratio of
30.1%. This compared with $346.2 million or 36.4% as of Mar 31,
2012.
Outlook
Cooper Tire expects that raw material cost will decline
sequentially by 1% in the second quarter of 2013. In the first
quarter of 2013 capital expenditures was $49.3 million compared
with $37.1 million a year ago. For 2013, capital expenditures are
expected between $195.0 million and $215.0 million.
Our Take
Cooper Tire & Rubber Company, a Zacks Rank #3 (Hold) stock,
believes stabilizing raw material costs, flexible manufacturing
operations, profitable investments, and competitive labor
agreements will help the company improve results despite headwinds
encountered by the industry.
Cooper Tire’s peer, Goodyear Tire & Rubber
Company (GT) reported a 32% rise in earnings to $111
million or 45 cents per share in the first quarter of 2013 from $84
million or 34 cents in the year-ago quarter (all excluding special
items). The company’s earnings per share exceeded the Zacks
Consensus Estimate by 15 cents during the quarter. Revenues in the
quarter slid 11% to $4.9 billion, missing the Zacks Consensus
Estimate of $5.1 billion.
Other stocks that are performing well in the broader industry where
Cooper Tire operates include Visteon Corp. (VC)
and STRATTEC Security Corp. (STRT). Both the
companies carry a Zacks Rank #1 (Strong Buy).
COOPER TIRE (CTB): Free Stock Analysis Report
GOODYEAR TIRE (GT): Free Stock Analysis Report
STRATTEC SEC CP (STRT): Free Stock Analysis Report
VISTEON CORP (VC): Free Stock Analysis Report
To read this article on Zacks.com click here.
Zacks Investment Research
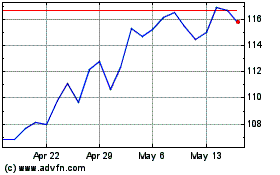
Visteon (NASDAQ:VC)
Historical Stock Chart
From Jun 2024 to Jul 2024

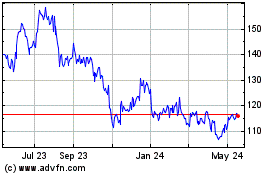
Visteon (NASDAQ:VC)
Historical Stock Chart
From Jul 2023 to Jul 2024
