UNITED STATES
SECURITIES AND EXCHANGE COMMISSION
Washington, D.C. 20549
FORM 6-K
REPORT OF FOREIGN
PRIVATE ISSUER PURSUANT TO RULE 13a-16 OR 15d-16 UNDER THE SECURITIES EXCHANGE ACT OF 1934
For the month of November 2023
Commission File
Number: 001-39938
Vinci Partners Investments Ltd.
(Exact name of registrant as specified in its
charter)
Av. Bartolomeu Mitre, 336
Leblon – Rio de Janeiro
Brazil 22431-002
+55 (21) 2159-6240
(Address of principal executive office)
Indicate by check mark whether the registrant files
or will file annual reports under cover of Form 20-F or Form 40-F:
TABLE OF CONTENTS
SIGNATURE
Pursuant to the requirements of the Securities
Exchange Act of 1934, the registrant has duly caused this report to be signed on its behalf by the undersigned, thereunto duly authorized.
| |
Vinci Partners Investments Ltd. |
| |
|
| |
|
| |
By: |
/s/ Sergio Passos Ribeiro |
| |
|
Name: |
Sergio Passos Ribeiro |
| |
|
Title: |
Chief Financial Officer |
Date: November 16, 2023
Exhibit 99.1

Investor Presentation November 2023
2 Disclaimer This presentation contains forward - looking statements that can be identified by the use of words such as “anticipate,” “believe,” “could,” “expect,” “should,” “plan,” “intend,” “estimate” and “potential,” among others . By their nature, forward - looking statements are necessarily subject to a high degree of uncertainty and involve known and unknown risks, uncertainties, assumptions and other factors because they relate to events and depend on circumstances that will occur in the future whether or not outside of our control . Such factors may cause actual results, performance or developments to differ materially from those expressed or implied by such forward - looking statements and there can be no assurance that such forward - looking statements will prove to be correct . Accordingly, you should not place undue reliance on forward - looking statements . The forward - looking statements included herein speak only as at the date of this presentation and we do not undertake any obligation to update these forward - looking statements . Past performance does not guarantee or predict future performance . Moreover, neither we nor our affiliates, officers, employees and agents undertake any obligation to review, update or confirm expectations or estimates or to release any revisions to any forward - looking statements to reflect events that occur or circumstances that arise in relation to the content of the presentation . Further information on these and other factors that could affect our financial results is included in filings we have made and will make with the U . S . Securities and Exchange Commission (the “SEC”) from time to time, including in the section titled “Risk Factors” in our latest fillings with the SEC . These documents are available on the SEC Filings section of the investor relations section of our website at : https : //ir . vincipartners . com/financials/sec - filings . We have prepared this presentation solely for informational purposes . The information in this presentation does not constitute or form part of, and should not be construed as, an offer or invitation to subscribe for, underwrite or otherwise acquire, any of our securities or securities of our subsidiaries or affiliates, not should it or any part of it form the basis of, or be relied on, in connection with any contract to purchase or subscribe for any of our securities or securities of any of our subsidiaries or affiliates, nor shall it or any part of it form the basis of, or be relied on, in connection with any contract or commitment whatsoever . This presentation also includes certain non - GAAP financial information . We believe that such information is meaningful and useful in understanding the activities and business metrics of our operations . We also believe that these non - GAAP financial measures reflect an additional way of viewing aspects of our business that, when viewed with our International Financial Reporting Standards (“IFRS”) results, as issued by the International Accounting Standards Board, provide a more complete understanding of factors and trends affecting our business . Further, investors regularly rely on non - GAAP financial measures to assess operating performance and such measures may highlight trends in our business that may not otherwise be apparent when relying on financial measures calculated in accordance with IFRS . We also believe that certain non - GAAP financial measures are frequently used by securities analysts, investors and other interested parties in the evaluation of public companies in our industry, many of which present these measures when reporting their results . The non - GAAP financial information is presented for informational purposes and to enhance understanding of the IFRS financial statements . The non - GAAP measures should be considered in addition to results prepared in accordance with IFRS, but not as a substitute for, or superior to, IFRS results . As other companies may determine or calculate this non - GAAP financial information differently, the usefulness of these measures for comparative purposes is limited . A reconciliation of such non - GAAP financial measures to the nearest GAAP measure is included in this presentation .

Business Overview

4 Notes: ¹As of 3Q’23; LTM Dividend Yield is calculated considering 0.70 dividend/share for LTM and US$10.04/share as of Novemb er 15th,2023. Vinci Partners is a leading, full - service alternative asset manager Business Strategies 10 Distribution Channels 5 Capital committed for 5+ years¹ 52% Vinci operates on a highly visible and integrated recurring revenue business model, founded on diversification across business segments with a proven ability to raise long - term AUM from different pools of capital Vinci and Ares announced a Strategic Partnership and $100million investment to accelerate the growth of Vinci s platform in LatAm Third Quarter 2023 Highlights Higher level of management fees since the IPO, generating R$0.95 FRE/Share R$1.3bn in new capital subscriptions across VCP IV, VICC and VISC Quarterly Dividend of US$0.17 , resulting in a 7.0% LTM Dividend Yield² What are we focusing on the near term? Target Fundraising (Private Markets) R$15 billion until Year - End 2024 R$6 billion Raised as of 3Q’23 What are we focusing on the long - term? Target until 2028 (Full Power of the platform) R$60 billion Organic Fundraising R$150 billion 2028 Target AUM
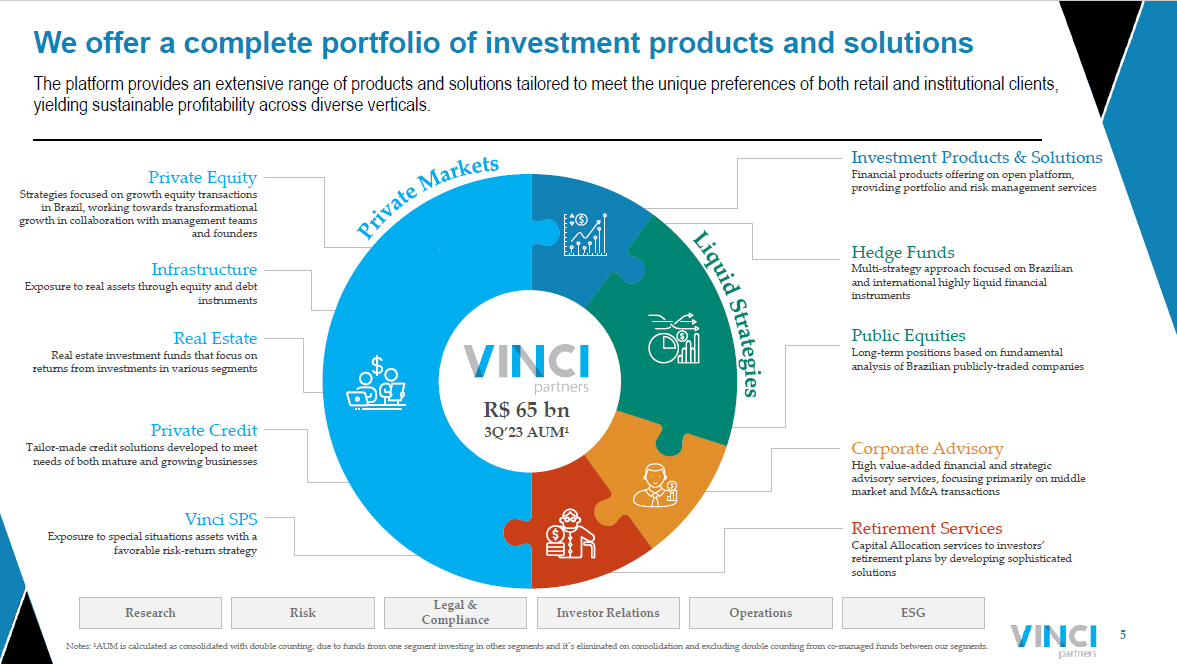
5 Notes: ¹AUM is calculated as consolidated with double counting, due to funds from one segment investing in other segments and it ´ s eliminated on consolidation and excluding double counting from co - managed funds between our segments. The platform provides an extensive range of products and solutions tailored to meet the unique preferences of both retail and in stitutional clients, yielding sustainable profitability across diverse verticals. We offer a complete portfolio of investment products and solutions Investment Products & Solutions Financial products offering on open platform, providing portfolio and risk management services Hedge Funds Multi - strategy approach focused on Brazilian and international highly liquid financial instruments Public Equities Long - term positions based on fundamental analysis of Brazilian publicly - traded companies Corporate Advisory High value - added financial and strategic advisory services, focusing primarily on middle market and M&A transactions Retirement Services Capital Allocation services to investors’ retirement plans by developing sophisticated solutions Vinci SPS Exposure to special situations assets with a favorable risk - return strategy Private Credit Tailor - made credit solutions developed to meet needs of both mature and growing businesses Real Estate Real estate investment funds that focus on returns from investments in various segments Infrastructure Exposure to real assets through equity and debt instruments Private Equity Strategies focused on growth equity transactions in Brazil, working towards transformational growth in collaboration with management teams and founders R$ 65 bn 3Q’23 AUM¹ Research Risk Legal & Compliance Investor Relations Operations ESG
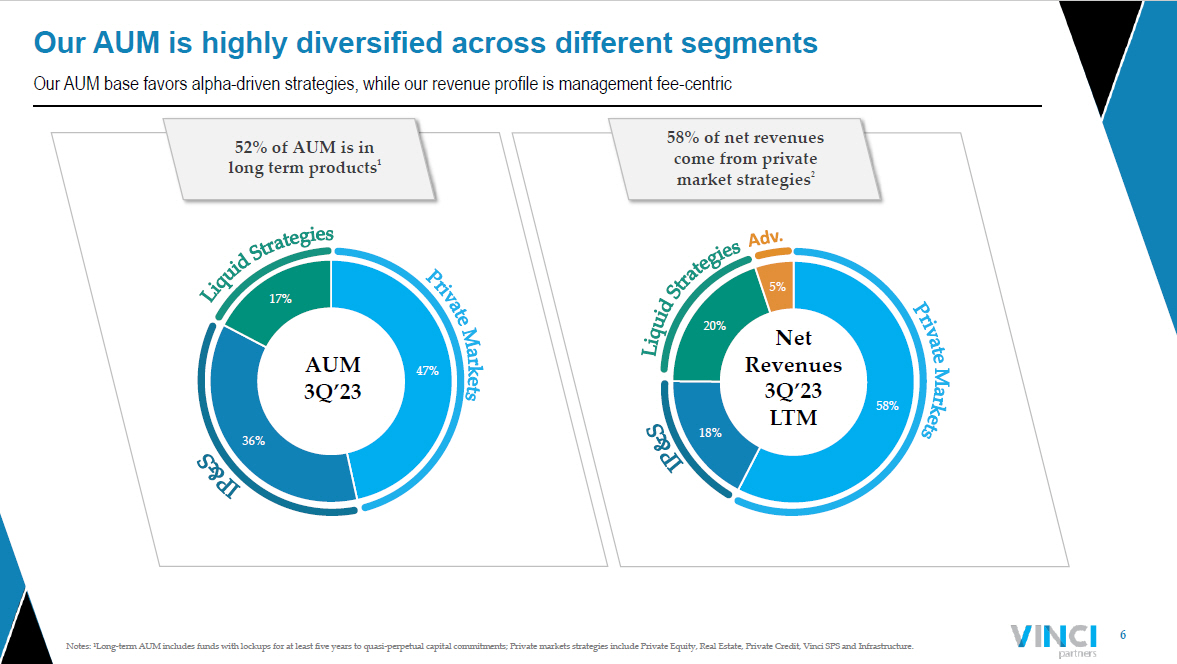
6 Notes: ¹Long - term AUM includes funds with lockups for at least five years to quasi - perpetual capital commitments; Private market s strategies include Private Equity, Real Estate, Private Credit, Vinci SPS and Infrastructure. Our AUM base favors alpha - driven strategies, while our revenue profile is management fee - centric Our AUM is highly diversified across different segments 58% 18% 20% 5% 47% 36% 17% Net Revenues 3Q’23 LTM AUM 3Q’23 58 % of net revenues come from private market strategies ² 52 % of AUM is in long term products ¹
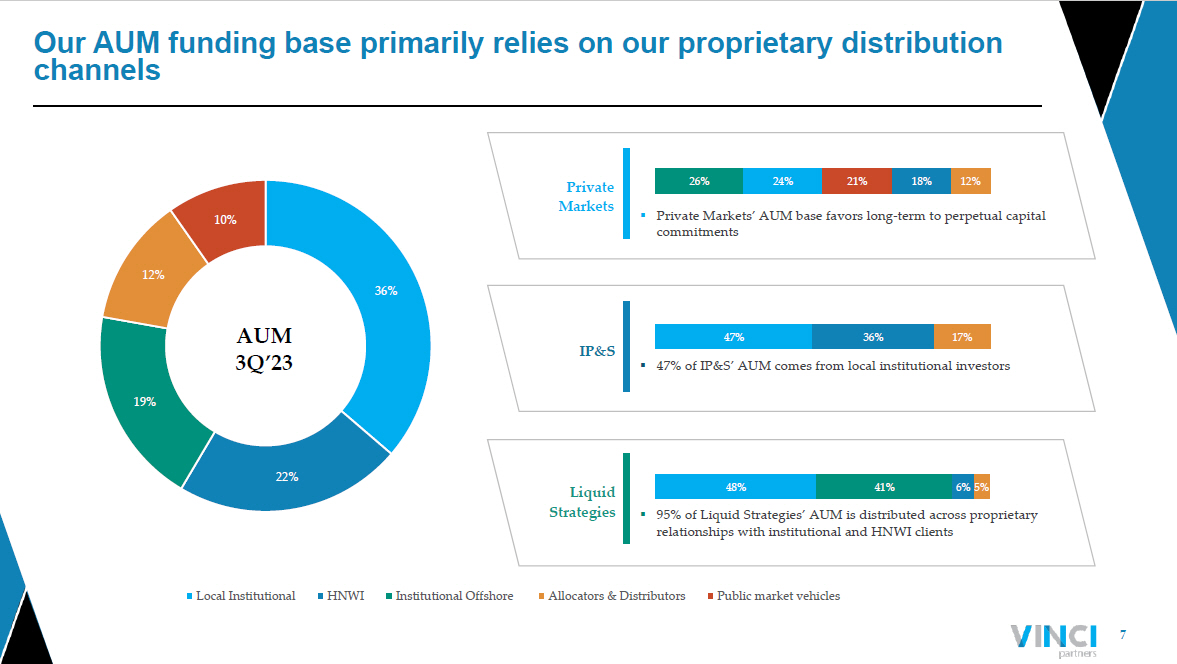
7 Our AUM funding base primarily relies on our proprietary distribution channels 47% 36% 17% 26% 24% 21% 18% 12% 36% 22% 19% 12% 10% Local Institutional HNWI Institutional Offshore Allocators & Distributors Public market vehicles 48% 41% 6% 5% Liquid . Strategies . ▪ 95% of Liquid Strategies’ AUM is distributed across proprietary relationships with institutional and HNWI clients Private . Markets . ▪ Private Markets’ AUM base favors long - term to perpetual capital commitments IP&S . ▪ 47% of IP&S’ AUM comes from local institutional investors AUM 3Q’23
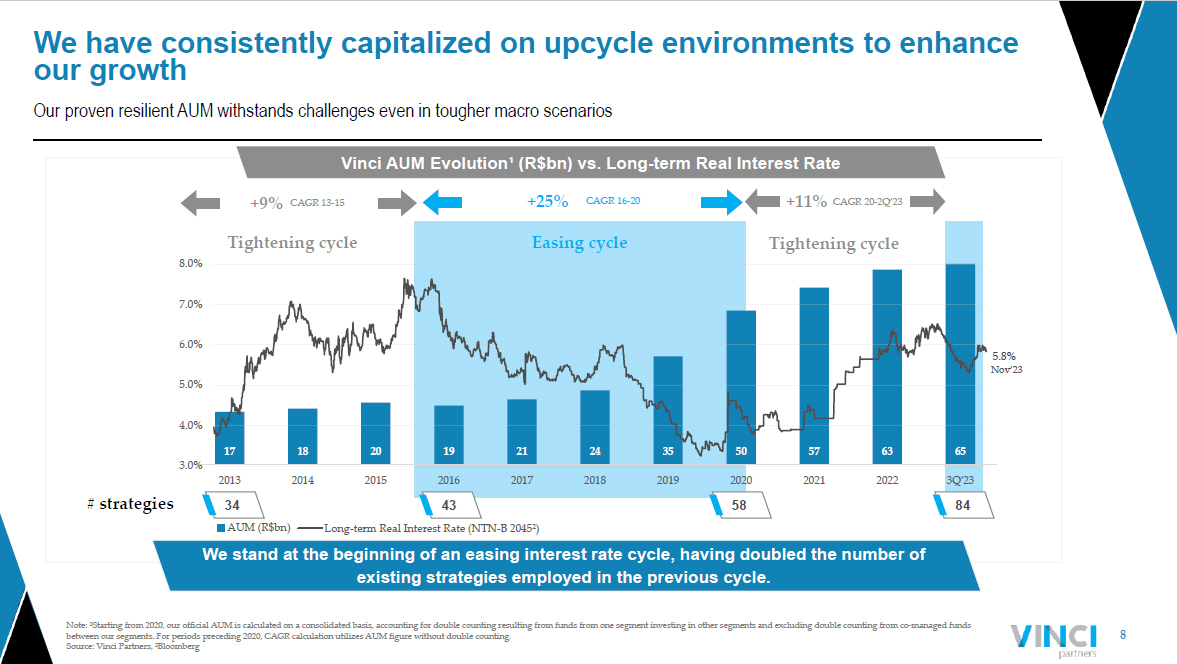
8 6 We stand at the beginning of an easing interest rate cycle, having doubled the number of existing strategies employed in the previous cycle. Nov’23 Tightening cycle Easing cycle Tightening cycle # strategies Vinci AUM Evolution¹ ( R$bn ) vs. Long - term Real Interest Rate Our proven resilient AUM withstands challenges even in tougher macro scenarios Note: ¹Starting from 2020, our official AUM is calculated on a consolidated basis, accounting for double counting resulting f rom funds from one segment investing in other segments and excluding double counting from co - managed funds between our segments. For periods preceding 2020, CAGR calculation utilizes AUM figure without double counting. Source: Vinci Partners, ²Bloomberg We have consistently capitalized on upcycle environments to enhance our growth CAGR 13 - 15 +9% CAGR 16 - 20 +25% CAGR 20 - 2Q’23 +11% 34 43 58 84 17 18 20 19 21 24 35 50 57 63 65 2013 2014 2015 2016 2017 2018 2019 2020 2021 2022 3Q'23 AUM (R$bn) 5.8% 3.0% 4.0% 5.0% 6.0% 7.0% 8.0% Long-term Real Interest Rate (NTN-B 2045²)
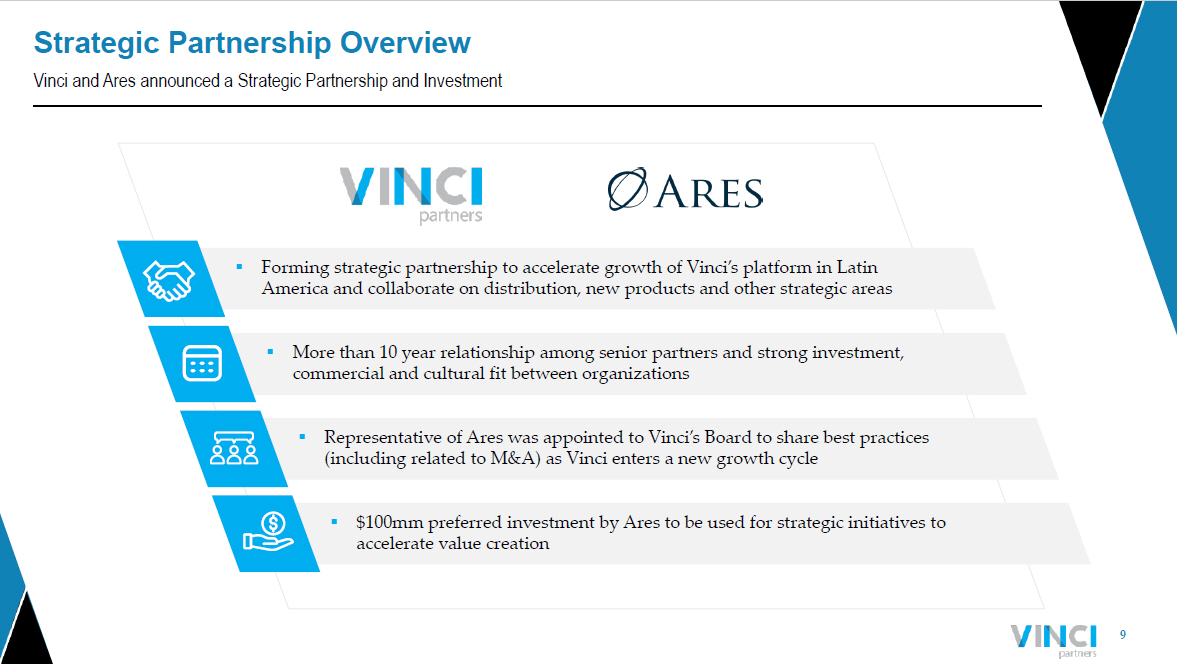
9 Strategic Partnership Overview Vinci and Ares announced a Strategic Partnership and Investment ▪ Forming strategic partnership to accelerate growth of Vinci’s platform in Latin America and collaborate on distribution, new products and other strategic areas ▪ More than 10 year relationship among senior partners and strong investment, commercial and cultural fit between organizations ▪ Representative of Ares was appointed to Vinci’s Board to share best practices (including related to M&A) as Vinci enters a new growth cycle ▪ $100mm preferred investment by Ares to be used for strategic initiatives to accelerate value creation
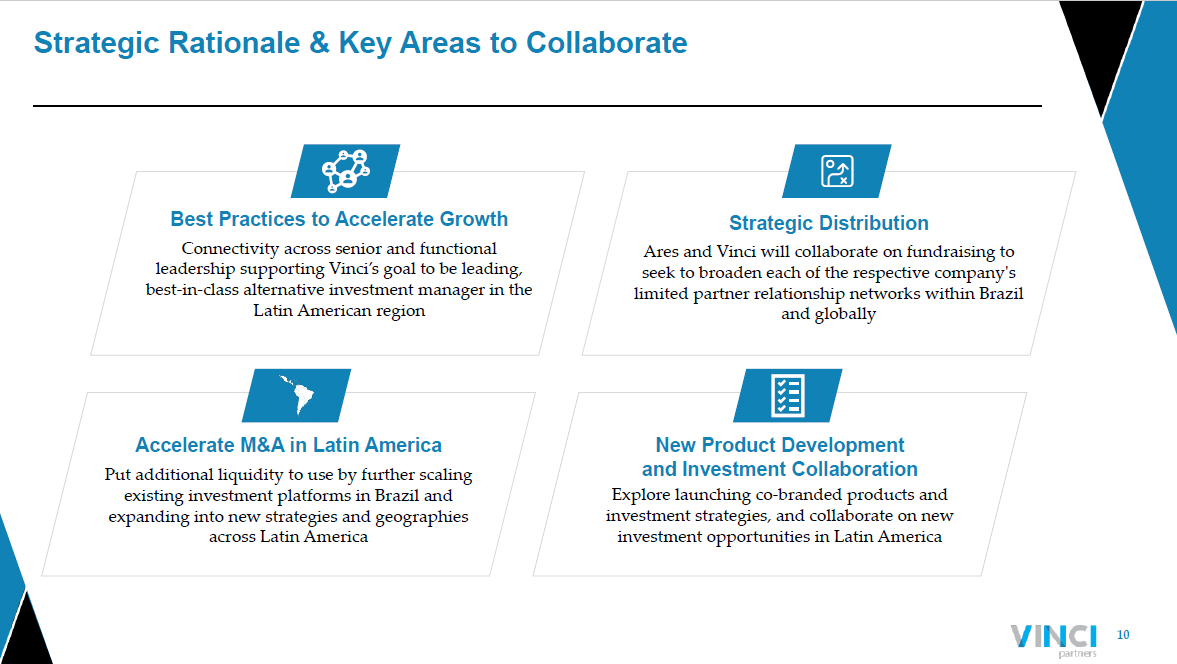
10 Strategic Rationale & Key Areas to Collaborate Accelerate M&A in Latin America Put additional liquidity to use by further scaling existing investment platforms in Brazil and expanding into new strategies and geographies across Latin America Best Practices to Accelerate Growth Connectivity across senior and functional leadership supporting Vinci’s goal to be leading, best - in - class alternative investment manager in the Latin American region New Product Development and Investment Collaboration Explore launching co - branded products and investment strategies, and collaborate on new investment opportunities in Latin America Strategic Distribution Ares and Vinci will collaborate on fundraising to seek to broaden each of the respective company's limited partner relationship networks within Brazil and globally

What is yet to come?
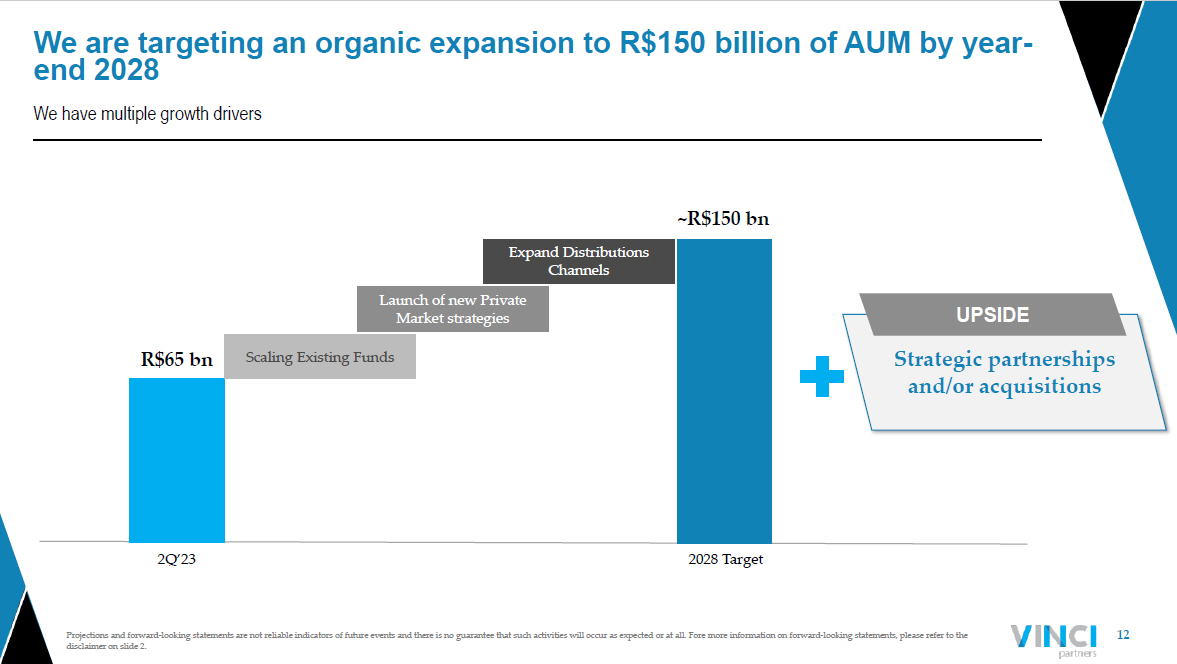
12 We have multiple growth drivers Projections and forward - looking statements are not reliable indicators of future events and there is no guarantee that such acti vities will occur as expected or at all. Fore more information on forward - looking statements, please refer to the disclaimer on slide 2. We are targeting an organic expansion to R$150 billion of AUM by year - end 2028 Strategic partnerships and/or acquisitions UPSIDE 2Q’23 R$65 bn 2028 Target ~R$150 bn Scaling Existing Funds Launch of new Private Market strategies Expand Distributions Channels
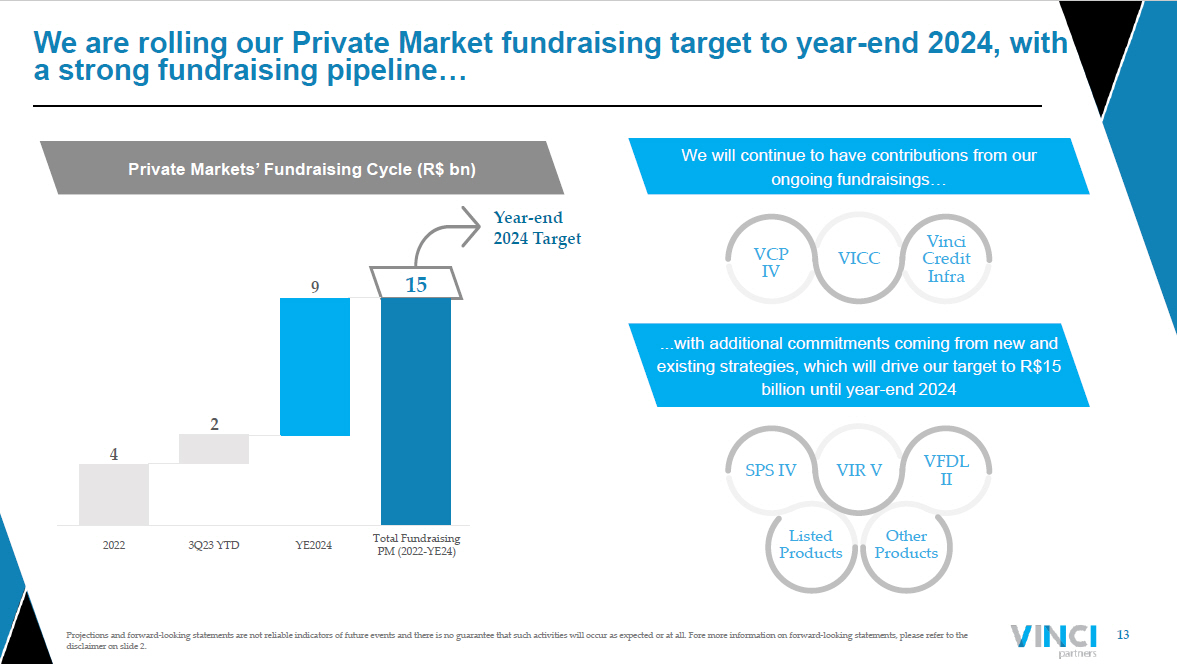
13 Projections and forward - looking statements are not reliable indicators of future events and there is no guarantee that such acti vities will occur as expected or at all. Fore more information on forward - looking statements, please refer to the disclaimer on slide 2. We are rolling our Private Market fundraising target to year - end 2024, with a strong fundraising pipeline… Private Markets’ Fundraising Cycle (R$ bn) We will continue to have contributions from our ongoing fundraisings… ...with additional commitments coming from new and existing strategies, which will drive our target to R$15 billion until year - end 2024 VCP IV VICC Vinci Credit Infra SPS IV VIR V VFDL II Listed Products Other Products 2022 3Q23 YTD YE2024 Total Fundraising PM (2022 - YE24) Year - end 2024 Target 4 2 9 15
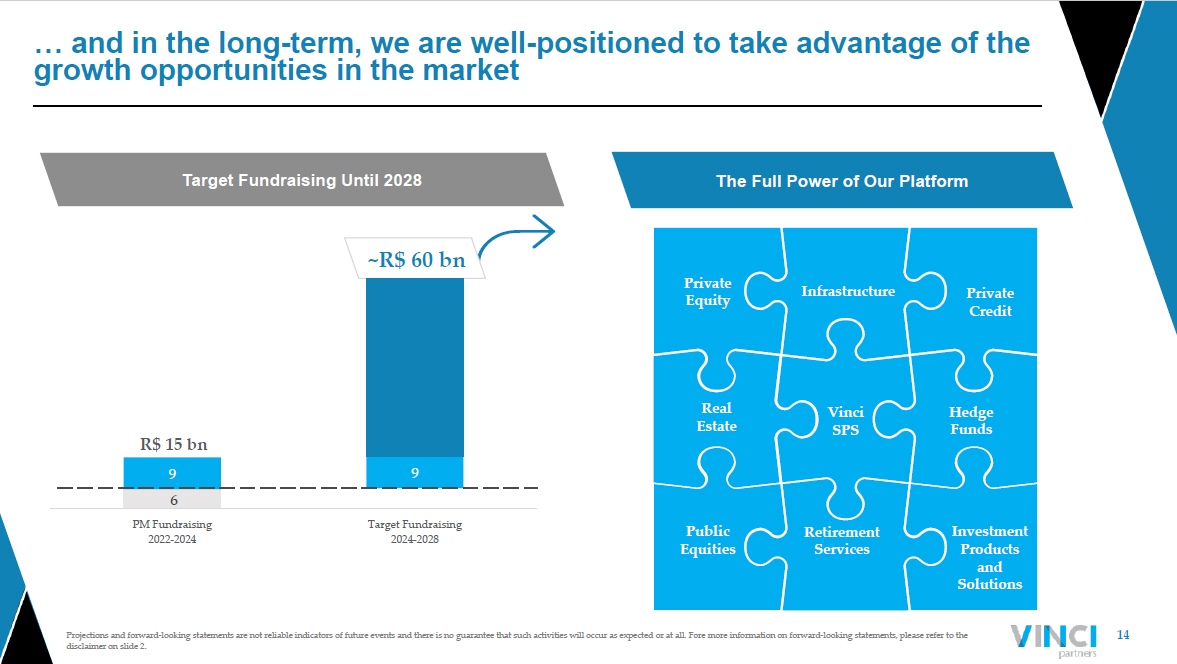
14 Projections and forward - looking statements are not reliable indicators of future events and there is no guarantee that such acti vities will occur as expected or at all. Fore more information on forward - looking statements, please refer to the disclaimer on slide 2. … and in the long - term, we are well - positioned to take advantage of the growth opportunities in the market 6 9 9 R$ 15 bn ~R$ 60 bn PM Fundraising 2022-2024 Target Fundraising 2024-2028 Target Fundraising Until 2028 The Full Power of Our Platform Private Equity Vinci SPS Private Credit Real Estate Public Equities Hedge Funds Retirement Services Investment Products and Solutions Infrastructure

15 Projections and forward - looking statements are not reliable indicators of future events and there is no guarantee that such acti vities will occur as expected or at all. Fore more information on forward - looking statements, please refer to the disclaimer on slide 2. Fee Related Earnings growth will be driven by AUM and Margin Expansion Fee Related Revenues R$414mm 2.2 - 2.4x R$900 - 1,000mm 2Q’23 LTM 2028 Target Fee Related Earnings R$201mm 2.5 - 3.0x R$500 - 600mm FRE Margin 48.5% 650 - 1,150bps 55% - 60%
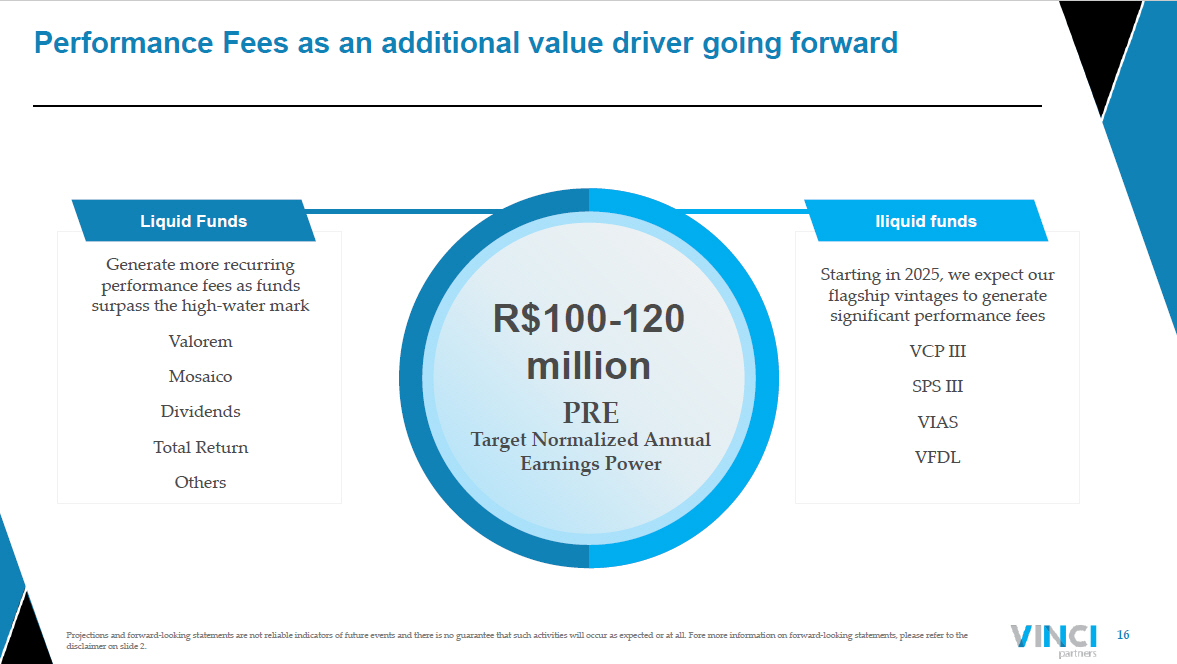
16 6 6 Projections and forward - looking statements are not reliable indicators of future events and there is no guarantee that such acti vities will occur as expected or at all. Fore more information on forward - looking statements, please refer to the disclaimer on slide 2. Performance Fees as an additional value driver going forward R$100 - 120 million PRE Target Normalized Annual Earnings Power Generate more recurring performance fees as funds surpass the high - water mark Valorem Mosaico Dividends Total Return Others Liquid Funds Starting in 2025, we expect our flagship vintages to generate significant performance fees VCP III SPS III VIAS VFDL Iliquid funds

17 Projections and forward - looking statements are not reliable indicators of future events and there is no guarantee that such acti vities will occur as expected or at all. Fore more information on forward - looking statements, please refer to the disclaimer on slide 2. GP Investments should drive future value R$1 billion Proprietary Commitments Expected ~ 2.0x Net MoC To be mostly realized through 2026 - 2030 Seed investments enhance FRE and PRE growth and fundraising capabilities REITs investments generate monthly realized GP investment income Capital gain from Private Markets’ products as they divest from assets
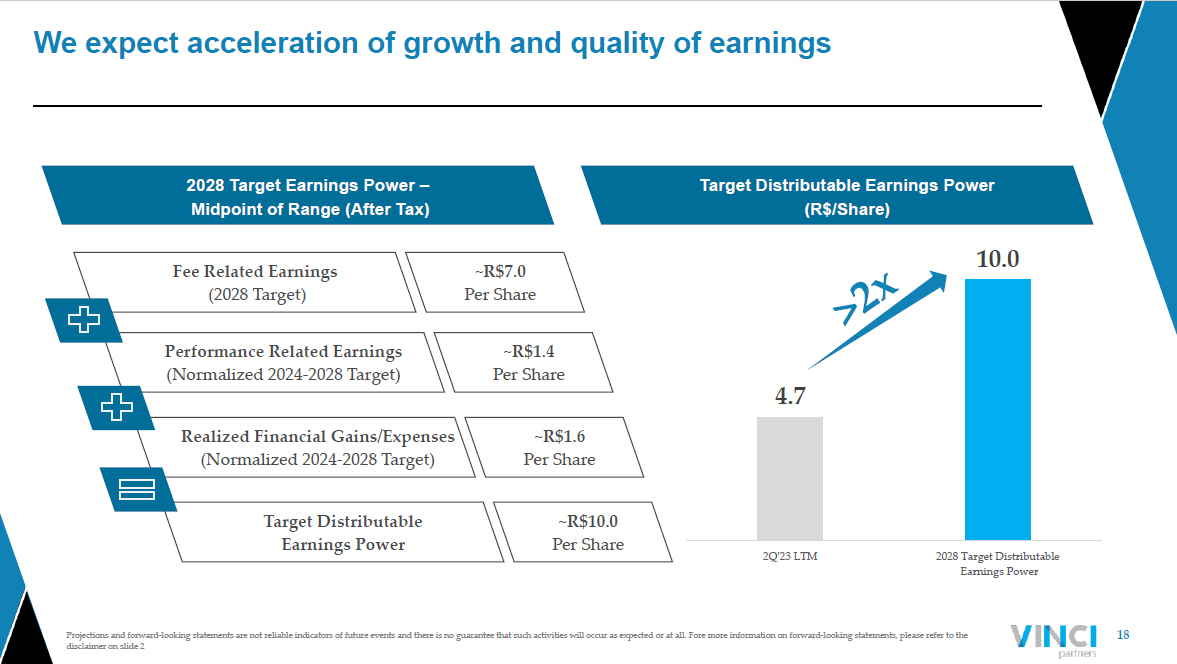
18 Projections and forward - looking statements are not reliable indicators of future events and there is no guarantee that such acti vities will occur as expected or at all. Fore more information on forward - looking statements, please refer to the disclaimer on slide 2 We expect acceleration of growth and quality of earnings 2028 Target Earnings Power – Midpoint of Range (After Tax) Fee Related Earnings (2028 Target) ~R$7.0 Per Share Performance Related Earnings (Normalized 2024 - 2028 Target) ~R$1.4 Per Share Realized Financial Gains/Expenses (Normalized 2024 - 2028 Target) ~R$1.6 Per Share Target Distributable Earnings Power ~R$10.0 Per Share 4.7 10.0 2Q'23 LTM 2028 Target Distributable Earnings Power Target Distributable Earnings Power (R$/Share)

19 Key takeaways 6 Our business model is structured to drive strong growth during favorable market conditions and to remain resilient during tougher scenarios 6 Our partnership with Ares will accelerate our platform’s growth in Latin America and collaborate on distribution, new products and other strategic areas 6 The alternative market is expanding on a global scale, and emerging markets are in a good position to capture an increasing share in the coming years, with a potential focus on attracting institutional investors 6 We are well - positioned to take advantage of growth opportunities in the market and to raise ~R$60 billion until 2028 , leveraging the full power of our platform 6 The potential for outsized shareholder returns is significant, driven by the growing FRE and the promising upside potential from PRE and GP investments

Financial Highlights
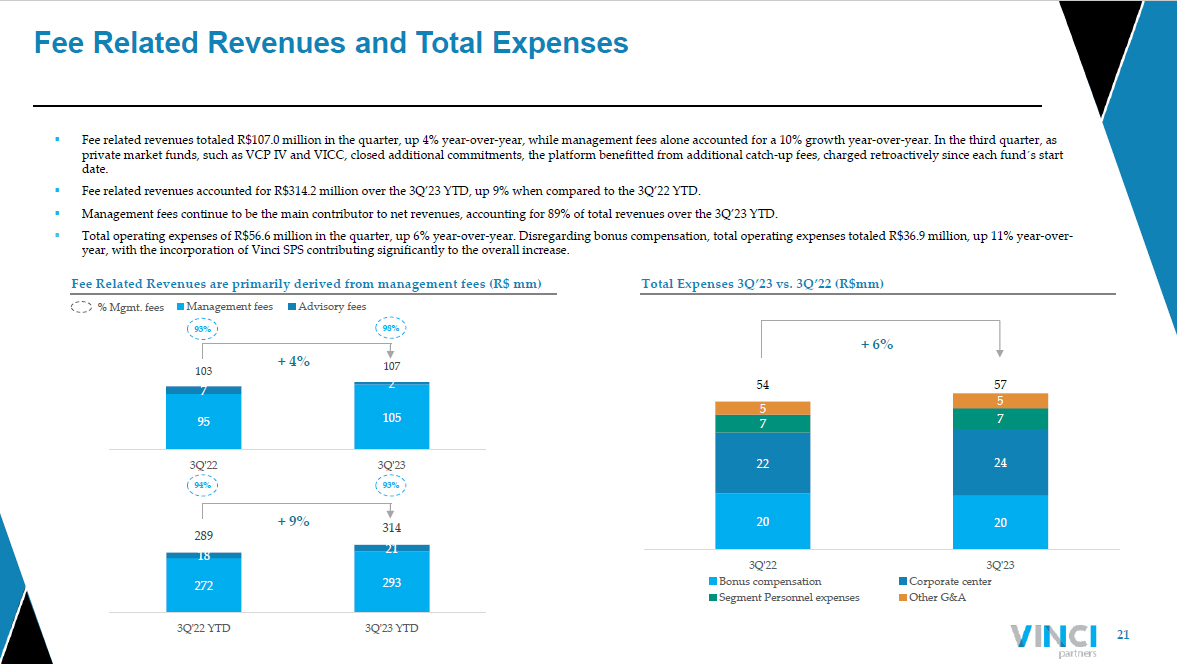
21 Fee Related Revenues and Total Expenses 20 20 22 24 7 7 5 5 54 57 3Q'22 3Q'23 Bonus compensation Corporate center Segment Personnel expenses Other G&A + 6% 95 105 7 2 103 107 3Q'22 3Q'23 Management fees Advisory fees 272 293 18 21 289 314 3Q'22 YTD 3Q'23 YTD Fee Related Revenues are primarily derived from management fees (R$ mm) % Mgmt. fees ▪ Fee related revenues totaled R$107.0 million in the quarter, up 4% year - over - year, while management fees alone accounted for a 1 0% growth year - over - year. In the third quarter, as private market funds, such as VCP IV and VICC, closed additional commitments, the platform benefitted from additional catch - up f ees, charged retroactively since each fund ´ s start date. ▪ Fee related revenues accounted for R$314.2 million over the 3Q’23 YTD, up 9% when compared to the 3Q’22 YTD. ▪ Management fees continue to be the main contributor to net revenues, accounting for 89% of total revenues over the 3Q’23 YTD. ▪ Total operating expenses of R$56.6 million in the quarter, up 6% year - over - year. Disregarding bonus compensation, total operatin g expenses totaled R$36.9 million, up 11% year - over - year, with the incorporation of Vinci SPS contributing significantly to the overall increase. 93% 98 % 93 % 94 % Total Expenses 3Q’23 vs. 3Q ’ 22 ( R$mm ) + 4% + 9%
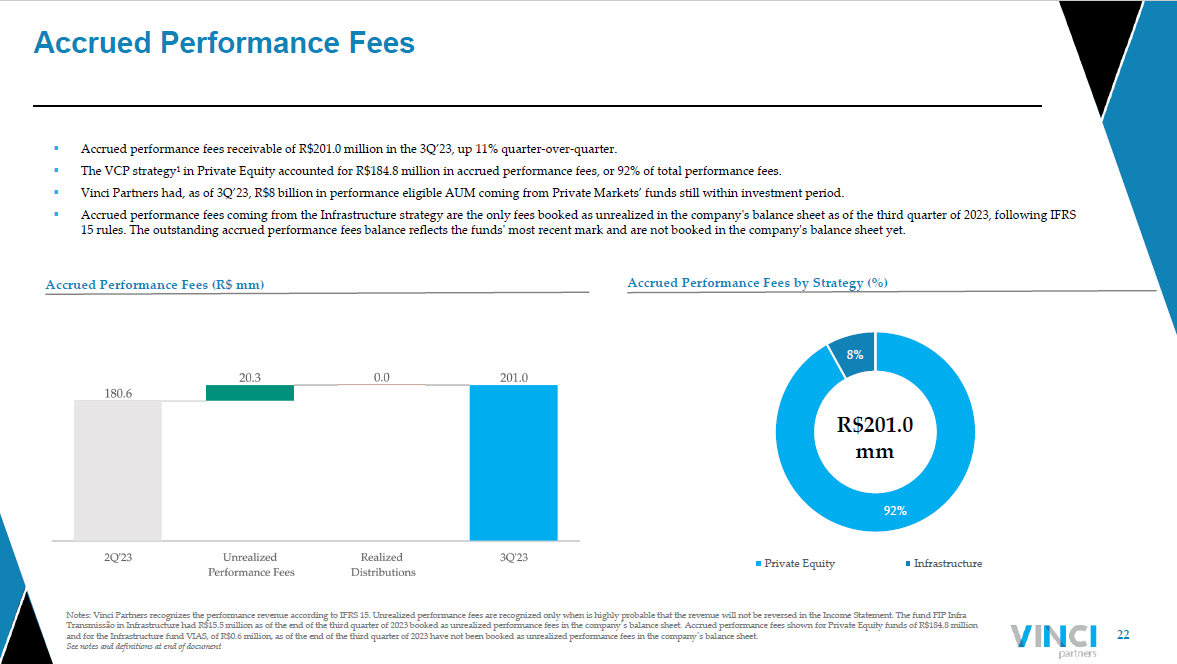
22 Notes: Vinci Partners recognizes the performance revenue according to IFRS 15. Unrealized performance fees are recognized onl y w hen is highly probable that the revenue will not be reversed in the Income Statement. The fund FIP Infra Transmissão in Infrastructure had R$15.5 million as of the end of the third quarter of 2023 booked as unrealized performance fees in the co mpany ´ s balance sheet. Accrued performance fees shown for Private Equity funds of R$184.8 million and for the Infrastructure fund VIAS, of R$0.6 million, as of the end of the third quarter of 2023 have not been booked as un rea lized performance fees in the company ´ s balance sheet. See notes and definitions at end of document Accrued Performance Fees 92% 8% Private Equity Infrastructure ▪ Accrued performance fees receivable of R$201.0 million in the 3Q’23, up 11% quarter - over - quarter. ▪ The VCP strategy¹ in Private Equity accounted for R$184.8 million in accrued performance fees, or 92% of total performance fe es. ▪ Vinci Partners had, as of 3Q’23, R$8 billion in performance eligible AUM coming from Private Markets’ funds still within inve stm ent period. ▪ Accrued performance fees coming from the Infrastructure strategy are the only fees booked as unrealized in the company's bala nce sheet as of the third quarter of 2023, following IFRS 15 rules. The outstanding accrued performance fees balance reflects the funds' most recent mark and are not booked in the com pan y's balance sheet yet. R$201.0 mm Accrued Performance Fees (R$ mm) Accrued Performance Fees by Strategy (%)
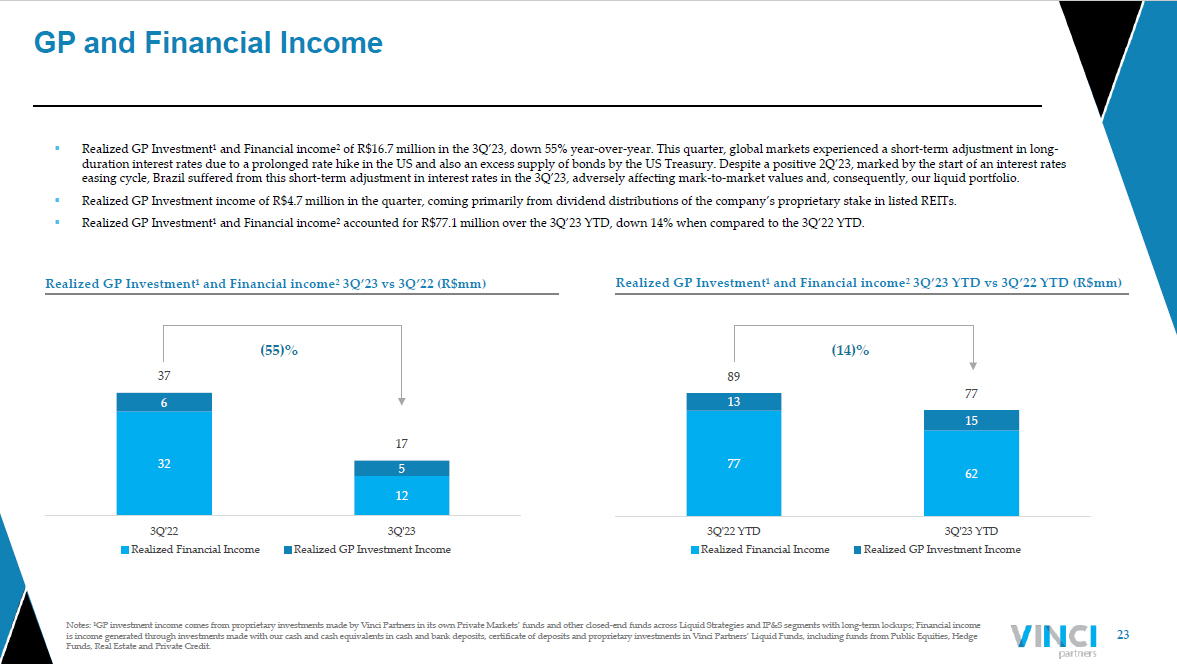
23 Notes: ¹GP investment income comes from proprietary investments made by Vinci Partners in its own Private Markets’ funds and oth er closed - end funds across Liquid Strategies and IP&S segments with long - term lockups; Financial income is income generated through investments made with our cash and cash equivalents in cash and bank deposits, certificate of dep osi ts and proprietary investments in Vinci Partners’ Liquid Funds, including funds from Public Equities, Hedge Funds, Real Estate and Private Credit. GP and Financial Income 32 12 6 5 37 17 3Q'22 3Q'23 Realized Financial Income Realized GP Investment Income 77 62 13 15 89 77 3Q'22 YTD 3Q'23 YTD Realized Financial Income Realized GP Investment Income ▪ Realized GP Investment¹ and Financial income² of R$16.7 million in the 3Q’23, down 55% year - over - year. This quarter, global mark ets experienced a short - term adjustment in long - duration interest rates due to a prolonged rate hike in the US and also an excess supply of bonds by the US Treasury. Despite a positive 2Q’23, marked by the start of an interest rates easing cycle, Brazil suffered from this short - term adjustment in interest rates in the 3Q’23, adversely affecting mark - to - market values and, consequently, our liquid portfolio. ▪ Realized GP Investment income of R$4.7 million in the quarter, coming primarily from dividend distributions of the company’s pro prietary stake in listed REITs. ▪ Realized GP Investment¹ and Financial income² accounted for R$77.1 million over the 3Q’23 YTD, down 14% when compared to the 3Q’ 22 YTD. Realized GP Investment¹ and Financial income² 3Q’23 vs 3Q’22 ( R$mm ) (14)% Realized GP Investment¹ and Financial income² 3Q’23 YTD vs 3Q’22 YTD ( R$mm ) (55)%
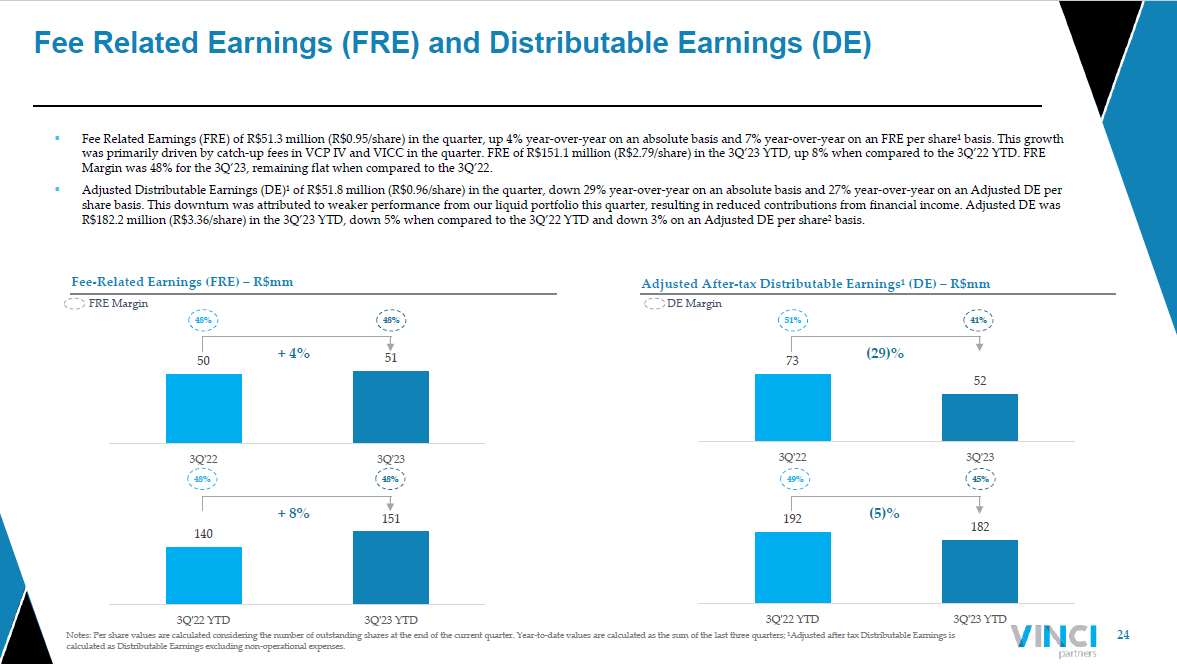
24 Notes: Per share values are calculated considering the number of outstanding shares at the end of the current quarter. Year - to - d ate values are calculated as the sum of the last three quarters; ¹Adjusted after tax Distributable Earnings is calculated as Distributable Earnings excluding non - operational expenses. Fee Related Earnings (FRE) and Distributable Earnings (DE) 192 182 3Q'22 YTD 3Q'23 YTD 73 52 3Q'22 3Q'23 140 151 3Q'22 YTD 3Q'23 YTD 50 51 3Q'22 3Q'23 DE Margin ▪ Fee Related Earnings (FRE) of R$51.3 million (R$0.95/share) in the quarter, up 4% year - over - year on an absolute basis and 7% yea r - over - year on an FRE per share¹ basis. This growth was primarily driven by catch - up fees in VCP IV and VICC in the quarter. FRE of R$151.1 million (R$2.79/share) in the 3Q’23 YTD, up 8% when compared to the 3Q’22 YTD. FRE Margin was 48% for the 3Q’23, remaining flat when compared to the 3Q’22. ▪ Adjusted Distributable Earnings (DE)¹ of R$51.8 million (R$0.96/share) in the quarter, down 29% year - over - year on an absolute ba sis and 27% year - over - year on an Adjusted DE per share basis. This downturn was attributed to weaker performance from our liquid portfolio this quarter, resulting in reduced con tributions from financial income. Adjusted DE was R$182.2 million (R$3.36/share) in the 3Q’23 YTD, down 5% when compared to the 3Q’22 YTD and down 3% on an Adjusted DE per sha re² basis. Fee - Related Earnings (FRE) – R$mm Adjusted After - tax Distributable Earnings¹ (DE) – R$mm FRE Margin 51% 41 % 49 % 45% + 4% + 8% 48% 48 % 48% 48% (29)% (5)%
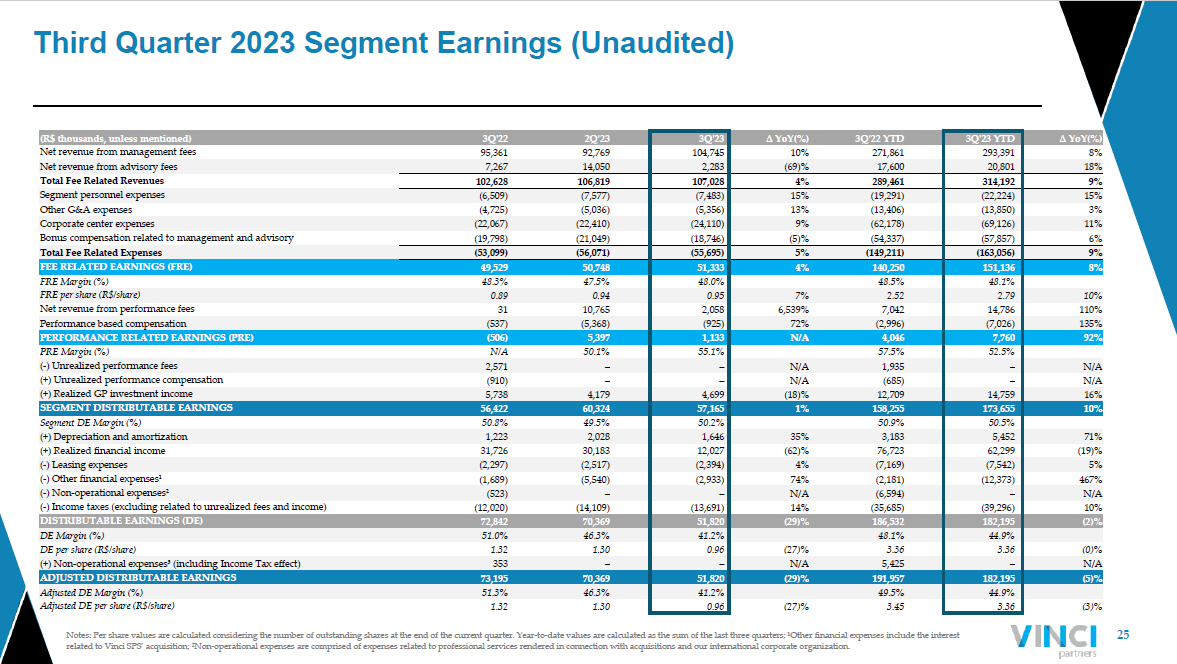
25 Notes: Per share values are calculated considering the number of outstanding shares at the end of the current quarter. Year - to - d ate values are calculated as the sum of the last three quarters; ¹Other financial expenses include the interest related to Vinci SPS’ acquisition; ²Non - operational expenses are comprised of expenses related to professional services rendered in connection with acquisitions and our international corporate organization. Third Quarter 2023 Segment Earnings (Unaudited) (R$ thousands, unless mentioned) 3Q'22 2Q'23 3Q'23 ∆ YoY(%) 3Q'22 YTD 3Q'23 YTD ∆ YoY(%) Net revenue from management fees 95,361 92,769 104,745 10% 271,861 293,391 8% Net revenue from advisory fees 7,267 14,050 2,283 (69)% 17,600 20,801 18% Total Fee Related Revenues 102,628 106,819 107,028 4% 289,461 314,192 9% Segment personnel expenses (6,509) (7,577) (7,483) 15% (19,291) (22,224) 15% Other G&A expenses (4,725) (5,036) (5,356) 13% (13,406) (13,850) 3% Corporate center expenses (22,067) (22,410) (24,110) 9% (62,178) (69,126) 11% Bonus compensation related to management and advisory (19,798) (21,049) (18,746) (5)% (54,337) (57,857) 6% Total Fee Related Expenses (53,099) (56,071) (55,695) 5% (149,211) (163,056) 9% FEE RELATED EARNINGS (FRE) 49,529 50,748 51,333 4% 140,250 151,136 8% FRE Margin (%) 48.3% 47.5% 48.0% 48.5% 48.1% FRE per share (R$/share) 0.89 0.94 0.95 7% 2.52 2.79 10% Net revenue from performance fees 31 10,765 2,058 6,539% 7,042 14,786 110% Performance based compensation (537) (5,368) (925) 72% (2,996) (7,026) 135% PERFORMANCE RELATED EARNINGS (PRE) (506) 5,397 1,133 N/A 4,046 7,760 92% PRE Margin (%) N/A 50.1% 55.1% 57.5% 52.5% ( - ) Unrealized performance fees 2,571 – – N/A 1,935 – N/A (+) Unrealized performance compensation (910) – – N/A (685) – N/A (+) Realized GP investment income 5,738 4,179 4,699 (18)% 12,709 14,759 16% SEGMENT DISTRIBUTABLE EARNINGS 56,422 60,324 57,165 1% 158,255 173,655 10% Segment DE Margin (%) 50.8% 49.5% 50.2% 50.9% 50.5% (+) Depreciation and amortization 1,223 2,028 1,646 35% 3,183 5,452 71% (+) Realized financial income 31,726 30,183 12,027 (62)% 76,723 62,299 (19)% ( - ) Leasing expenses (2,297) (2,517) (2,394) 4% (7,169) (7,542) 5% ( - ) Other financial expenses¹ (1,689) (5,540) (2,933) 74% (2,181) (12,373) 467% ( - ) Non - operational expenses² (523) – – N/A (6,594) – N/A ( - ) Income taxes (excluding related to unrealized fees and income) (12,020) (14,109) (13,691) 14% (35,685) (39,296) 10% DISTRIBUTABLE EARNINGS (DE) 72,842 70,369 51,820 (29)% 186,532 182,195 (2)% DE Margin (%) 51.0% 46.3% 41.2% 48.1% 44.9% DE per share (R$/share) 1.32 1.30 0.96 (27)% 3.36 3.36 (0)% (+) Non - operational expenses³ (including Income Tax effect) 353 – – N/A 5,425 – N/A ADJUSTED DISTRIBUTABLE EARNINGS 73,195 70,369 51,820 (29)% 191,957 182,195 (5)% Adjusted DE Margin (%) 51.3% 46.3% 41.2% 49.5% 44.9% Adjusted DE per share (R$/share) 1.32 1.30 0.96 (27)% 3.45 3.36 (3)%

Appendix – I Business Overview
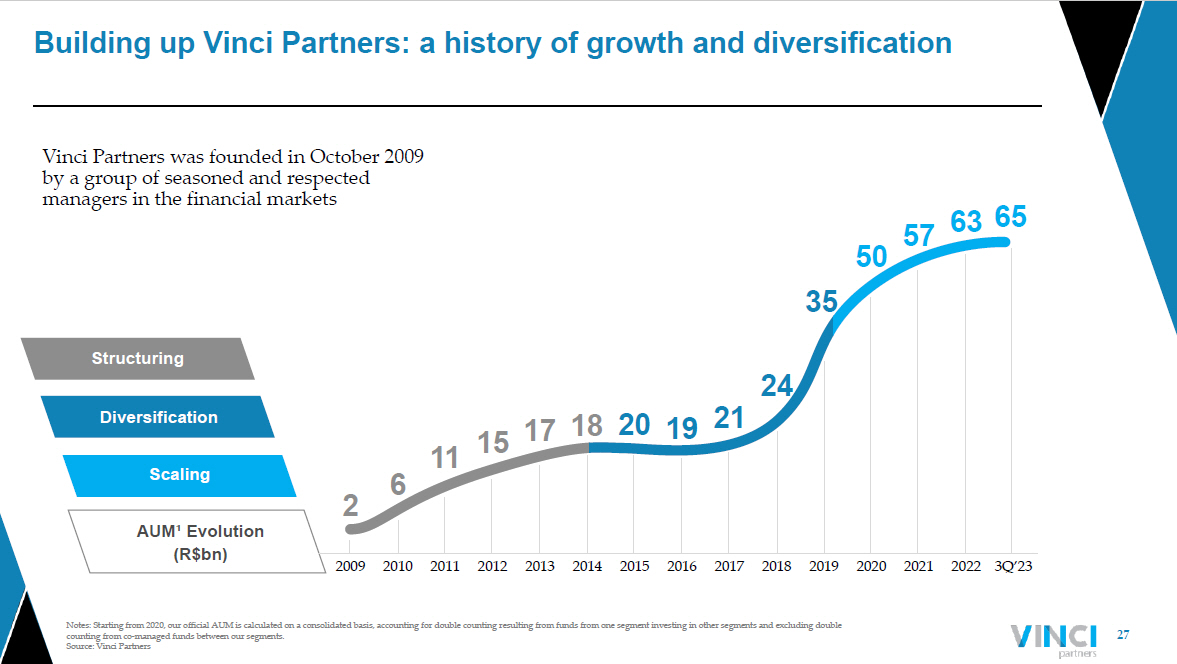
27 Notes: Starting from 2020, our official AUM is calculated on a consolidated basis, accounting for double counting resulting from fun ds from one segment investing in other segments and excluding double counting from co - managed funds between our segments. Source : Vinci Partners Building up Vinci Partners: a history of growth and diversification AUM¹ Evolution ( R$bn ) 2009 2010 2011 2012 2013 2014 2015 2016 2017 2018 2019 2020 2021 2022 3Q’23 2 6 11 15 17 18 20 19 21 24 35 50 57 63 65 Structuring Scaling Diversification Vinci Partners was founded in October 2009 by a group of seasoned and respected managers in the financial markets
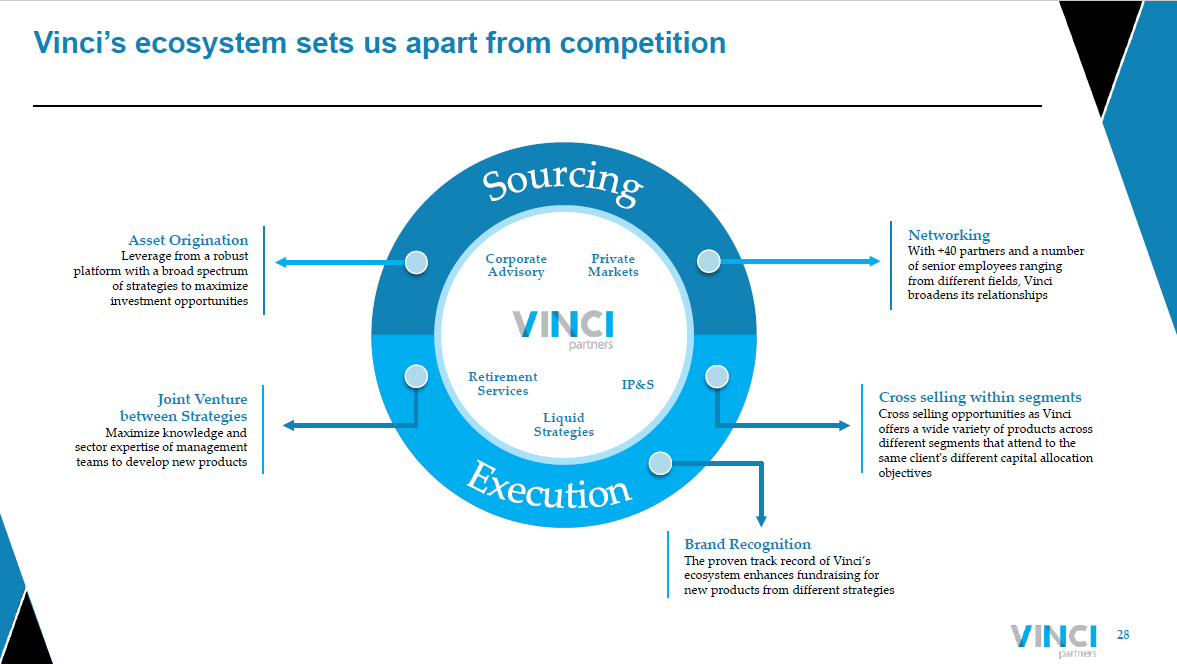
28 Vinci’s ecosystem sets us apart from competition Private Markets Liquid Strategies IP&S Retirement Services Corporate Advisory Asset Origination Leverage from a robust platform with a broad spectrum of strategies to maximize investment opportunities Networking With +40 partners and a number of senior employees ranging from different fields, Vinci broadens its relationships Brand Recognition The proven track record of Vinci’s ecosystem enhances fundraising for new products from different strategies Cross selling within segments Cross selling opportunities as Vinci offers a wide variety of products across different segments that attend to the same client's different capital allocation objectives Joint Venture between Strategies Maximize knowledge and sector expertise of management teams to develop new products
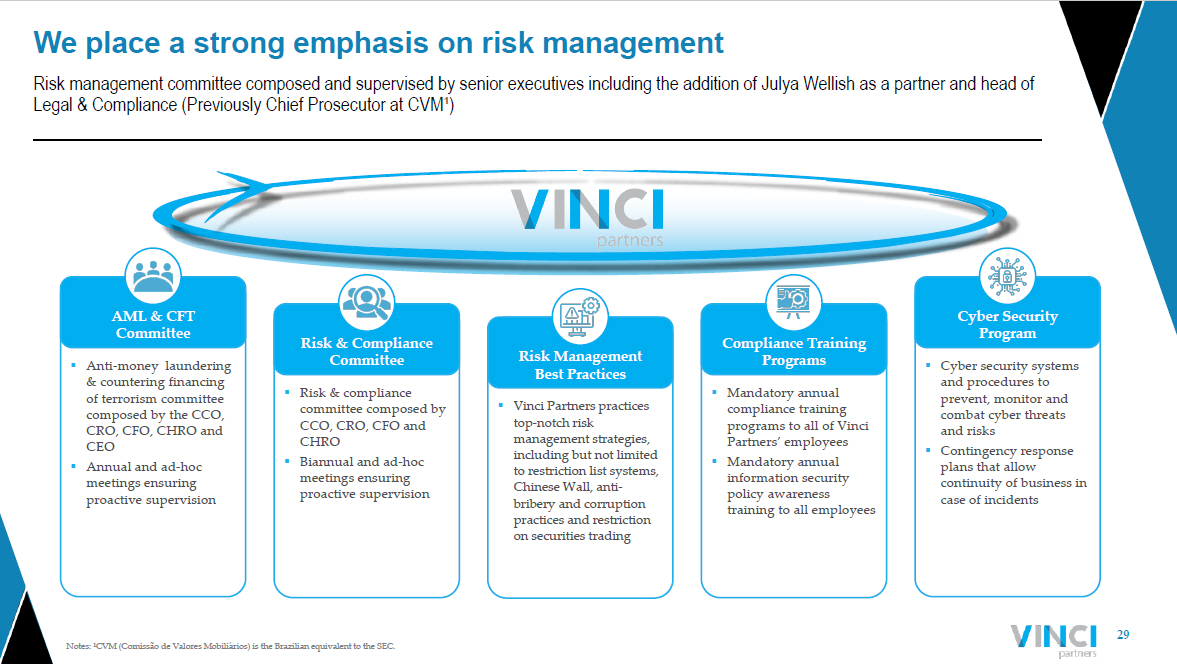
29 Notes: ¹CVM ( Comissão de Valores Mobiliários ) is the Brazilian equivalent to the SEC. Risk management committee composed and supervised by senior executives including the addition of Julya Wellish as a partner and head of Legal & Compliance (Previously Chief Prosecutor at CVM¹) We place a strong emphasis on risk management ▪ Mandatory annual compliance training programs to all of Vinci Partners’ employees ▪ Mandatory annual information security policy awareness training to all employees ▪ Vinci Partners practices top - notch risk management strategies, including but not limited to restriction list systems, Chinese Wall, anti - bribery and corruption practices and restriction on securities trading ▪ Risk & compliance committee composed by CCO, CRO, CFO and CHRO ▪ Biannual and ad - hoc meetings ensuring proactive supervision ▪ Anti - money laundering & countering financing of terrorism committee composed by the CCO, CRO, CFO, CHRO and CEO ▪ Annual and ad - hoc meetings ensuring proactive supervision ▪ Cyber security systems and procedures to prevent, monitor and combat cyber threats and risks ▪ Contingency response plans that allow continuity of business in case of incidents Compliance Training Programs Risk & Compliance Committee AML & CFT Committee Cyber Security Program Risk Management Best Practices
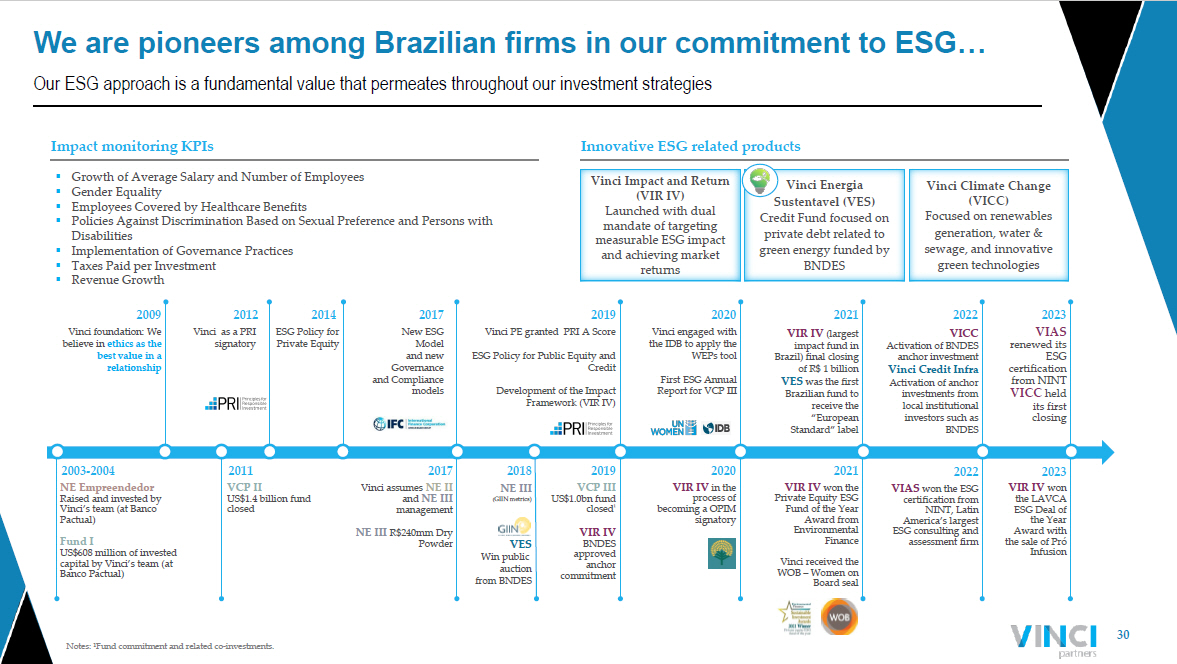
30 Our ESG approach is a fundamental value that permeates throughout our investment strategies We are pioneers among Brazilian firms in our commitment to ESG… Vinci Energia Sustentavel (VES) Credit Fund focused on private debt related to green energy funded by BNDES Vinci Impact and Return (VIR IV) Launched with dual mandate of targeting measurable ESG impact and achieving market returns Impact monitoring KPIs Innovative ESG related products ▪ Growth of Average Salary and Number of Employees ▪ Gender Equality ▪ Employees Covered by Healthcare Benefits ▪ Policies Against Discrimination Based on Sexual Preference and Persons with Disabilities ▪ Implementation of Governance Practices ▪ Taxes Paid per Investment ▪ Revenue Growth Vinci foundation: We believe in ethics as the best value in a relationship 2009 2011 New ESG Model and new Governance and Compliance models 2017 ESG Policy for Private Equity 2014 NE III ( GIIN metrics) VES Win public auction from BNDES 2018 Vinci PE granted PRI A Score ESG Policy for Public Equity and Credit Development of the Impact Framework (VIR IV) 2019 NE Empreendedor Raised and invested by Vinci’s team (at Banco Pactual) Fund I US$608 million of invested capital by Vinci’s team (at Banco Pactual) 2003 - 2004 Vinci as a PRI signatory 2012 VCP II US$1.4 billion fund closed 2017 Vinci assumes NE II and NE III management NE III R$240mm Dry Powder 2019 VCP III US$1.0bn fund closed ¹ VIR IV BNDES approved anchor commitment Vinci engaged with the IDB to apply the WEPs tool First ESG Annual Report for VCP III 2020 2020 VIR IV in the process of becoming a OPIM signatory 2021 VIR IV (largest impact fund in Brazil) final closing of R$ 1 billion VES was the first Brazilian fund to receive the “European Standard” label 2021 VIR IV won the Private Equity ESG Fund of the Year Award from Environmental Finance Vinci received the WOB – Women on B oard seal 2022 VICC Activation of BNDES anchor investment Vinci Credit Infra Activation of anchor investments from local institutional investors such as BNDES 2022 VIAS won the ESG certification from NINT, Latin America’s largest ESG consulting and assessment firm 2023 VIAS renewed its ESG certification from NINT VICC held its first closing 2023 VIR IV won the LAVCA ESG Deal of the Year Award with the sale of Pró Infusion Vinci Climate Change (VICC) Focused on renewables generation, water & sewage, and innovative green technologies Notes: ¹Fund commitment and related co - investments.

31 And Brazil is a perfect fit for advancing this agenda As of September 29, 2023, unless otherwise stated. Source : ¹ Prequin ; ²PEI; ³Vinci Partners Internal Research … and stands as a leader for climate and impact - oriented investments in Brazil total capital raised ($bn) 2,500 2,000 1,500 1,000 500 0 80 60 40 20 0 2011 2012 2013 2014 2015 2016 2017 2018 2019 2020 2021 2022 Avg. fund size ($m m ) Total capital raised ($bn) Avg fund size ($m m ) Global renewables - focused fundraising (US$)¹ ~ 70% of DFIs, Pension funds and foundations are increasing their focus towards climate funds². ~ 70% of Global Institutional Investors have or expect to have exposure to Private Market funds with climate agendas over the next twelve months². A Global opportunity is unfolding… Funds with Climate and Impact - oriented Investments VIAS VICC VES Credit Infra VIR IV VIGT Water and Sewage Climate Change Sustainable Energy Credit Infrastructure Credit PE Impact fund Brownfield Renewable and Transmission Yield Assets R$5.2bn AUM of climate and impact - oriented products VICC sits amongst a limited number of funds classified as Article 8 in LatAm³ 6 Strategies … and Vinci is in an unique position to capitalize on this enduring trend Article 8

Vinci is primed to capitalize on secular trends…
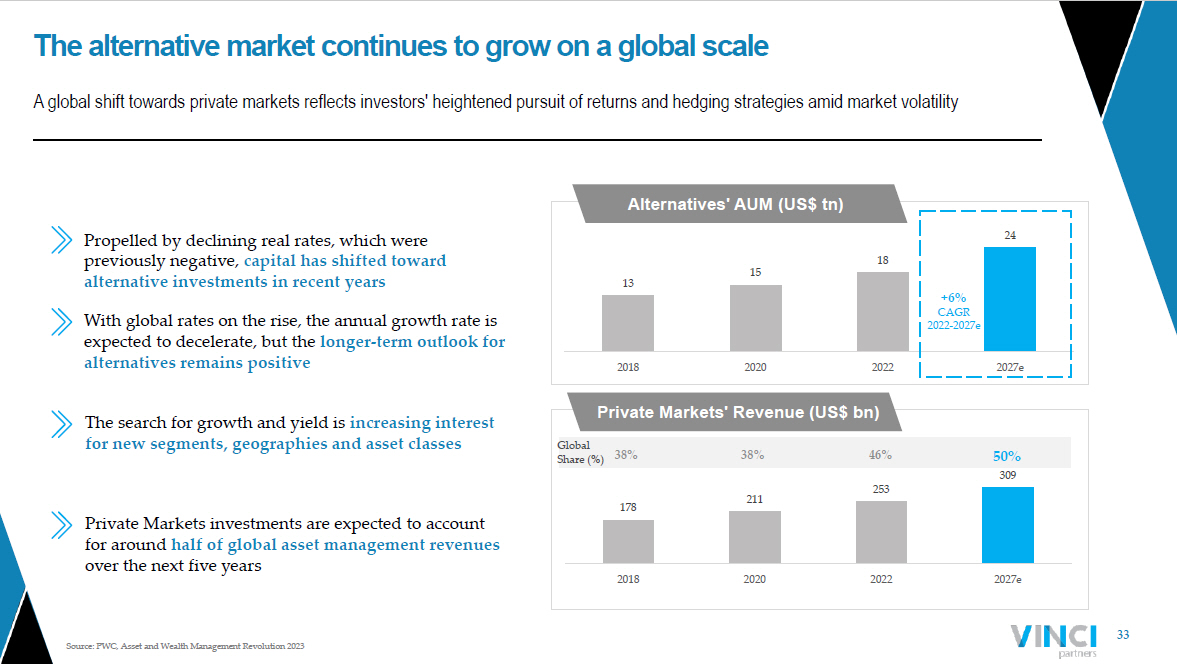
33 Global Share (%) Source: PWC, Asset and Wealth Management Revolution 2023 The alternative market continues to grow on a global scale A global shift towards private markets reflects investors' heightened pursuit of returns and hedging strategies amid market v ola tility Propelled by declining real rates, which were previously negative, capital has shifted toward alternative investments in recent years With global rates on the rise, the annual growth rate is expected to decelerate, but the longer - term outlook for alternatives remains positive The search for growth and yield is increasing interest for new segments, geographies and asset classes Private Markets investments are expected to account for around half of global asset management revenues over the next five years 13 15 18 24 0 5 10 15 20 25 30 35 2018 2020 2022 2027e Alternatives' AUM (US$ tn ) +6% CAGR 2022 - 2027e 178 211 253 309 38% 38% 46% 50% 0% 10% 20% 30% 40% 50% 60% 0 50 100 150 200 250 300 350 400 450 500 2018 2020 2022 2027e Private Markets' Revenue (US$ bn)
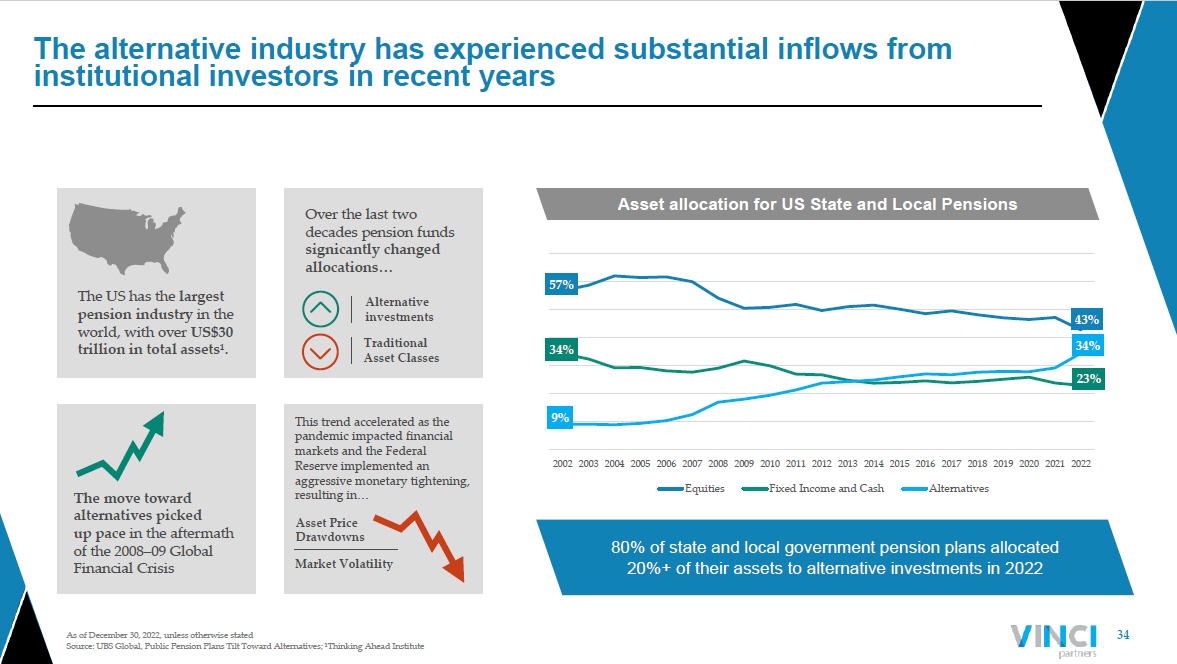
34 As of December 30, 2022, unless otherwise stated Source : UBS Global, Public Pension Plans Tilt Toward Alternatives ; ¹Thinking Ahead Institute The alternative industry has experienced substantial inflows from institutional investors in recent years 57% 43% 34% 23% 9% 34% 2002 2003 2004 2005 2006 2007 2008 2009 2010 2011 2012 2013 2014 2015 2016 2017 2018 2019 2020 2021 2022 Equities Fixed Income and Cash Alternatives 80% of state and local government pension plans allocated 20%+ of their assets to alternative investments in 2022 Asset allocation for US State and Local Pensions The US has the largest pension industry in the world, with over US$30 trillion in total assets¹ . Over the last two decades pension funds signicantly changed allocations… Alternative investments Traditional Asset Classes The move toward alternatives picked up pace in the aftermath of the 2008 – 09 Global Financial Crisis This trend accelerated as the pandemic impacted financial markets and the Federal Reserve implemented an aggressive monetary tightening, resulting in… Asset Price Drawdowns Market Volatility
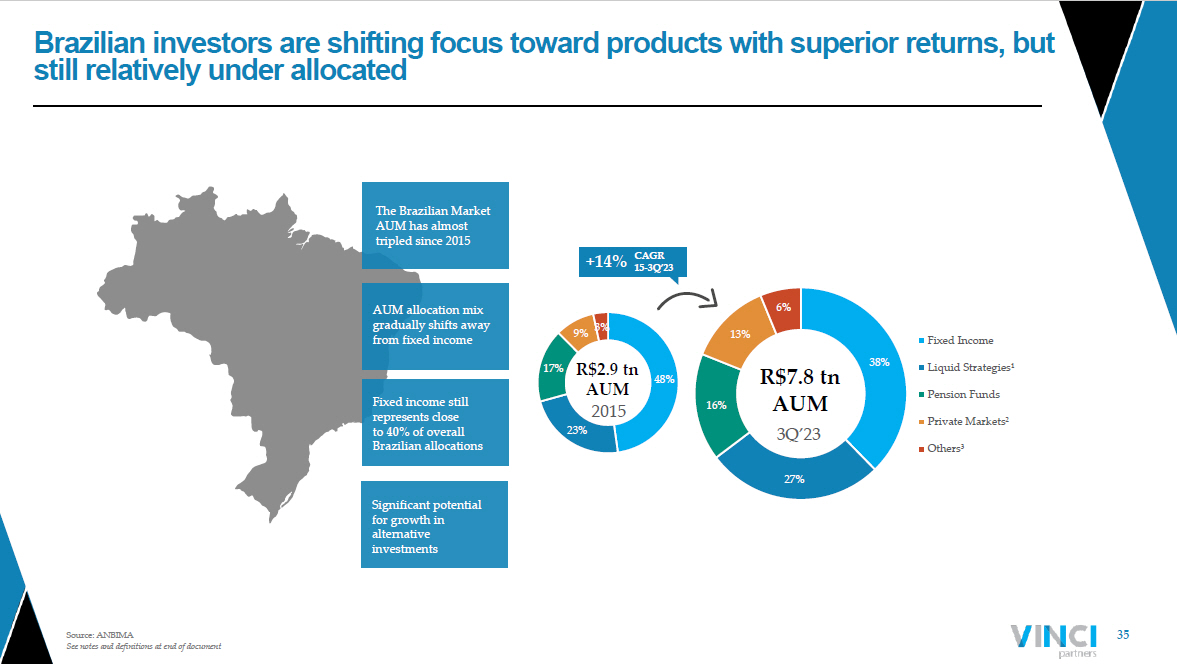
35 Source : ANBIMA See notes and definitions at end of document Brazilian investors are shifting focus toward products with superior returns, but still relatively under allocated The Brazilian Market AUM has almost tripled since 2015 AUM allocation mix gradually shifts away from fixed income Significant potential for growth in alternative investments 48% 23% 17% 9% 3% 2015 Fixed Income Liquid Strategies¹ Pension Funds Private Markets² Others³ 38% 27% 16% 13% 6% 3Q’23 R $2.9 tn AUM R$7.8 tn AUM +14% CAGR 15 - 3Q’23 Fixed income still represents close to 40% of overall Brazilian allocations
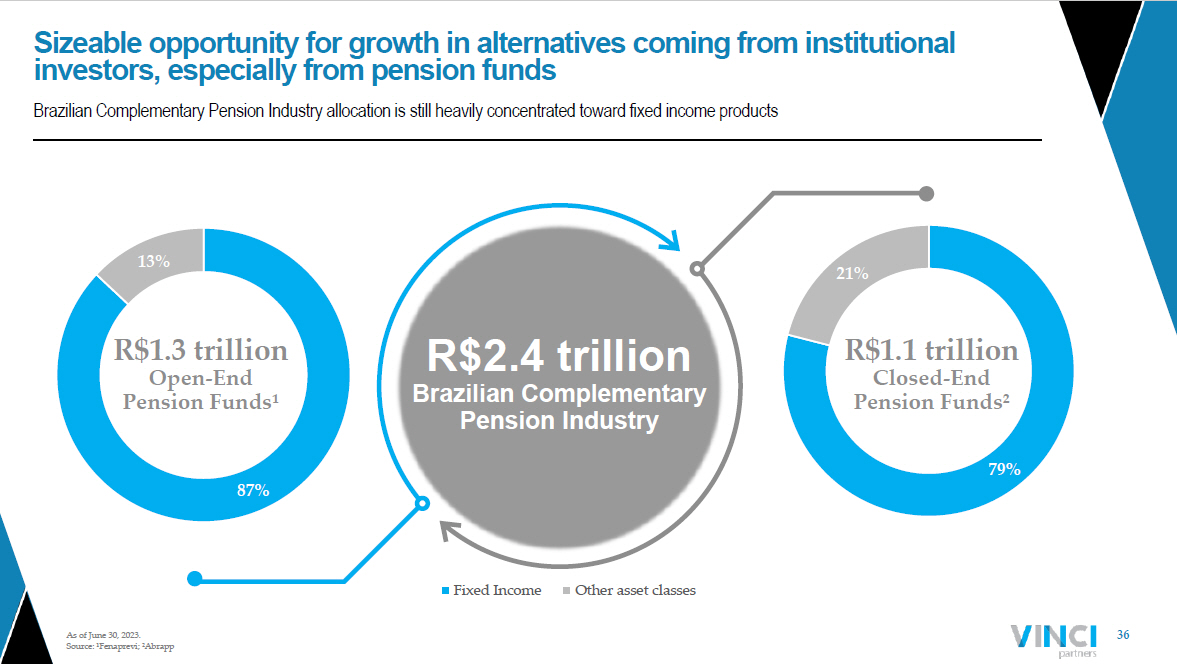
36 87% 13% Fixed Income Other asset classes 79% 21% Brazilian Complementary Pension Industry allocation is still heavily concentrated toward fixed income products As of June 30, 2023. Source: ¹Fenaprevi; ²Abrapp Sizeable opportunity for growth in alternatives coming from institutional investors, especially from pension funds R$2.4 trillion Brazilian Complementary Pension Industry R$1.1 trillion Closed - End Pension Funds² R$1.3 trillion Open - End Pension Funds¹
Appendix – II Segment Summaries
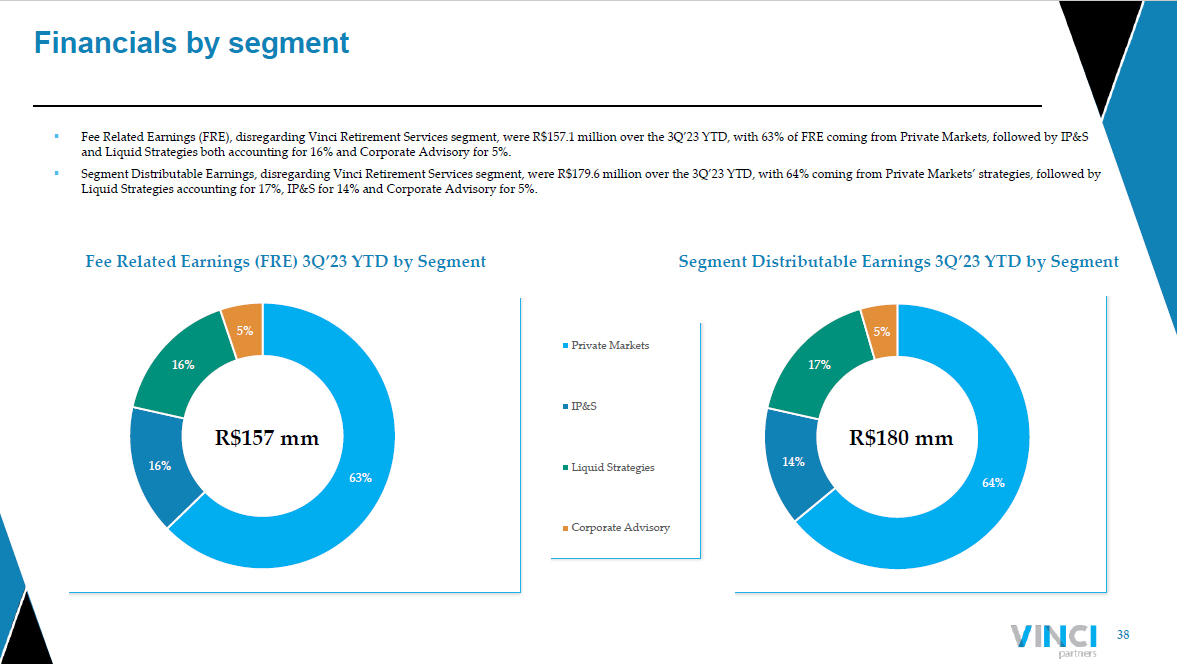
38 Financials by segment 63% 16% 16% 5% ▪ Fee Related Earnings (FRE), disregarding Vinci Retirement Services segment, were R$157.1 million over the 3Q’23 YTD, with 63% of FRE coming from Private Markets, followed by IP&S and Liquid Strategies both accounting for 16% and Corporate Advisory for 5%. ▪ Segment Distributable Earnings, disregarding Vinci Retirement Services segment, were R$179.6 million over the 3Q’23 YTD, with 64 % coming from Private Markets’ strategies, followed by Liquid Strategies accounting for 17%, IP&S for 14% and Corporate Advisory for 5%. Segment Distributable Earnings 3Q’23 YTD by Segment Fee Related Earnings (FRE) 3Q’23 YTD by Segment R$157 mm R$180 mm 64% 14% 17% 5% Private Markets IP&S Liquid Strategies Corporate Advisory
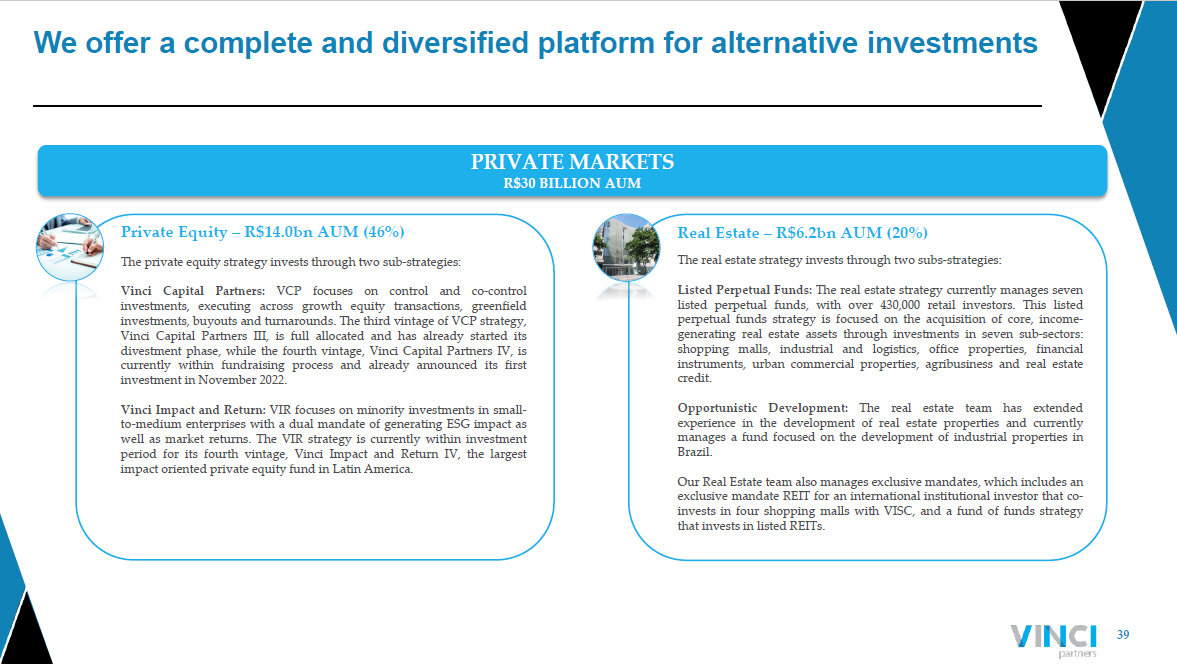
39 We offer a complete and diversified platform for alternative investments Private Equity – R$14.0bn AUM (46%) Real Estate – R$6.2bn AUM (20%) PRIVATE MARKETS R$ 30 BILLION AUM The real estate strategy invests through two subs - strategies : Listed Perpetual Funds : The real estate strategy currently manages seven listed perpetual funds, with over 430 , 000 retail investors . This listed perpetual funds strategy is focused on the acquisition of core, income - generating real estate assets through investments in seven sub - sectors : shopping malls, industrial and logistics, office properties, financial instruments, urban commercial properties, agribusiness and real estate credit . Opportunistic Development : The real estate team has extended experience in the development of real estate properties and currently manages a fund focused on the development of industrial properties in Brazil . Our Real Estate team also manages exclusive mandates, which includes an exclusive mandate REIT for an international institutional investor that co - invests in four shopping malls with VISC, and a fund of funds strategy that invests in listed REITs . The private equity strategy invests through two sub - strategies : Vinci Capital Partners : VCP focuses on control and co - control investments, executing across growth equity transactions, greenfield investments, buyouts and turnarounds . The third vintage of VCP strategy, Vinci Capital Partners III, is full allocated and has already started its divestment phase, while the fourth vintage, Vinci Capital Partners IV, is currently within fundraising process and already announced its first investment in November 2022 . Vinci Impact and Return : VIR focuses on minority investments in small - to - medium enterprises with a dual mandate of generating ESG impact as well as market returns . The VIR strategy is currently within investment period for its fourth vintage, Vinci Impact and Return IV, the largest impact oriented private equity fund in Latin America .
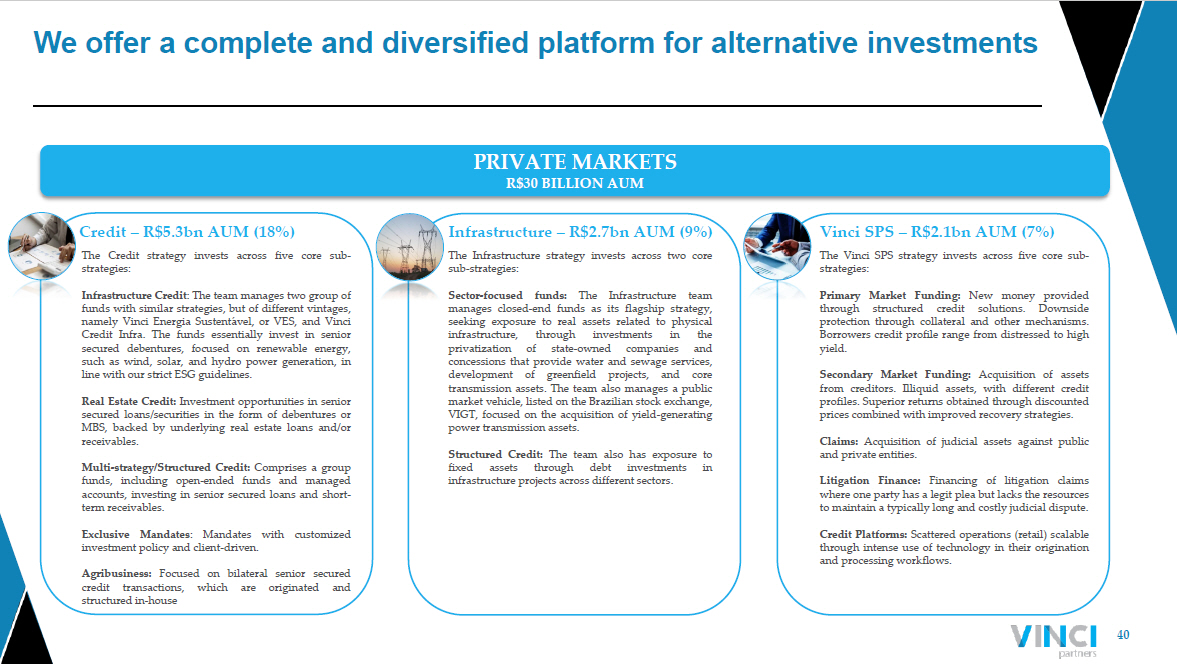
40 We offer a complete and diversified platform for alternative investments Infrastructure – R$2.7bn AUM (9%) Vinci SPS – R$2.1bn AUM (7%) The Vinci SPS strategy invests across five core sub - strategies : Primary Market Funding : New money provided through structured credit solutions . Downside protection through collateral and other mechanisms . Borrowers credit profile range from distressed to high yield . Secondary Market Funding : Acquisition of assets from creditors . Illiquid assets, with different credit profiles . Superior returns obtained through discounted prices combined with improved recovery strategies . Claims : Acquisition of judicial assets against public and private entities . Litigation Finance : Financing of litigation claims where one party has a legit plea but lacks the resources to maintain a typically long and costly judicial dispute . Credit Platforms : Scattered operations (retail) scalable through intense use of technology in their origination and processing workflows . PRIVATE MARKETS R$ 30 BILLION AUM The Infrastructure strategy invests across two core sub - strategies : Sector - focused funds : The Infrastructure team manages closed - end funds as its flagship strategy, seeking exposure to real assets related to physical infrastructure, through investments in the privatization of state - owned companies and concessions that provide water and sewage services, development of greenfield projects, and core transmission assets . The team also manages a public market vehicle, listed on the Brazilian stock exchange, VIGT, focused on the acquisition of yield - generating power transmission assets . Structured Credit : The team also has exposure to fixed assets through debt investments in infrastructure projects across different sectors . Credit – R$5.3bn AUM (18%) The Credit strategy invests across five core sub - strategies : Infrastructure Credit : The team manages two group of funds with similar strategies, but of different vintages, namely Vinci Energia Sustentável , or VES, and Vinci Credit Infra . The funds essentially invest in senior secured debentures, focused on renewable energy, such as wind, solar, and hydro power generation, in line with our strict ESG guidelines . Real Estate Credit : Investment opportunities in senior secured loans/securities in the form of debentures or MBS, backed by underlying real estate loans and/or receivables . Multi - strategy/Structured Credit : Comprises a group funds, including open - ended funds and managed accounts, investing in senior secured loans and short - term receivables . Exclusive Mandates : Mandates with customized investment policy and client - driven . Agribusiness : Focused on bilateral senior secured credit transactions, which are originated and structured in - house

41 Private Markets Private Equity 46% Real Estate 20% Credit 18% Infrastructure 9% Vinci SPS 7% Private Markets' AUM (R$ thousands, unless mentioned) 3Q'22 2Q'23 3Q'23 ∆ YoY (%) 3Q'22 YTD 3Q'23 YTD ∆ YoY (%) Net revenue from management fees 52,949 57,842 68,323 29% 147,362 184,596 25% Net revenue from advisory fees 560 275 275 (51)% 1,301 824 (37)% Total Fee Related Revenues 53,509 58,117 68,597 28% 148,663 185,420 25% Segment personnel expenses (3,148) (3,719) (3,685) 17% (8,807) (10,913) 24% Other G&A expenses (2,549) (2,540) (2,835) 11% (7,715) (6,813) (12)% Corporate center expenses (11,287) (13,205) (14,867) 32% (31,668) (41,090) 30% Bonus compensation related to management and advisory (9,662) (8,817) (10,109) 5% (24,395) (28,038) 15% Total Fee Related Expenses (26,646) (28,281) (31,496) 18% (72,585) (86,853) 20% FEE RELATED EARNINGS (FRE) 26,863 29,836 37,102 38% 76,078 98,567 30% FRE Margin (%) 50.2% 51.3% 54.1% 51.2% 53.2% Net revenue from performance fees (2,559) 2,528 464 N/A (201) 2,999 N/A Realized performance fees 11 2,528 464 3,965% 1,734 2,999 73% Unrealized performance fees (2,571) – – N/A (1,935) – N/A Performance based compensation 905 (1,118) (205) N/A 70 (1,326) N/A PERFORMANCE RELATED EARNINGS (PRE) (1,654) 1,410 259 N/A (131) 1,673 N/A PRE Margin (%) 64.6% 55.8% 55.8% 65.1% 55.8% ( - ) Unrealized performance fees 2,571 – – N/A 1,935 – N/A (+) Unrealized performance compensation (910) – – N/A (685) – N/A (+) Realized GP investment income 5,738 4,179 4,699 (18)% 12,709 14,759 16% SEGMENT DISTRIBUTABLE EARNINGS 32,607 35,425 42,059 29% 89,906 114,999 28% Segment DE Margin (%) 55.0% 56.9% 57.4% 55.7% 57.4% ASSETS UNDER MANAGEMENT (AUM R$million) 27,603 29,367 30,347 10% 27,603 30,347 10% FEE EARNING ASSETS UNDER MANAGEMENT (FEAUM R$ million) 24,183 26,076 27,060 12% 24,183 27,060 12% AVERAGE MANAGEMENT FEE RATE (%) 0.87% 0.85% 0.98% 0.89% 0.90% R$30 bn AUM ▪ Fee related earnings (FRE) of R$37.1 million in the quarter, up 38% year - over - year. This growth was driven by a combination of c atch - up fees for VCP IV and VICC, and the positive impact of our strong fundraising efforts over the last twelve months. ▪ FRE was R$98.6 million over the 3Q’23 YTD, an increase of 30% when compared to the 3Q’22 YTD. ▪ Segment Distributable Earnings of R$42.1 million in the quarter, up 29% year - over - year. Segment DE was R$115.0 million over the 3Q’23 YTD, an increase of 28% when compared to the 3Q’22 YTD, driven by growth in FRE. ▪ Total AUM of R$30.3 billion in the quarter, a 10% year - over - year increase moved by strong fundraising, with highlights to Privat e Equity and Infrastructure.
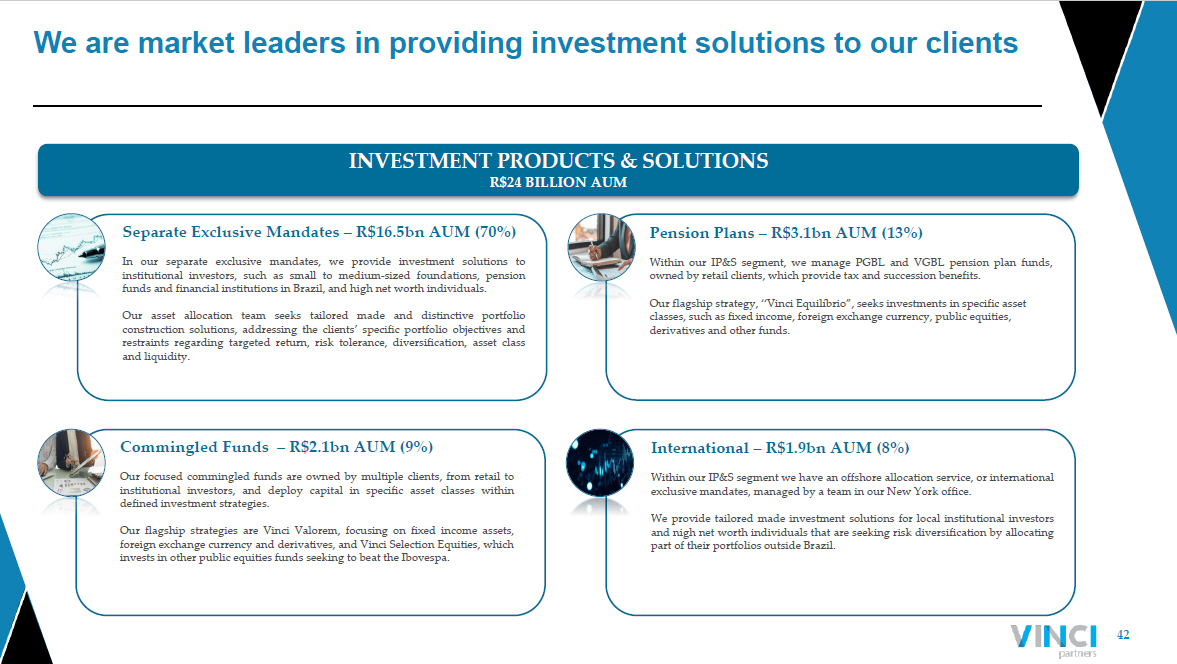
42 International – R$1.9bn AUM (8%) Within our IP&S segment we have an offshore allocation service, or international exclusive mandates, managed by a team in our New York office . We provide tailored made investment solutions for local institutional investors and nigh net worth individuals that are seeking risk diversification by allocating part of their portfolios outside Brazil . Commingled Funds – R$2.1bn AUM (9%) Our focused commingled funds are owned by multiple clients, from retail to institutional investors, and deploy capital in specific asset classes within defined investment strategies . Our flagship strategies are Vinci Valorem, focusing on fixed income assets, foreign exchange currency and derivatives, and Vinci Selection Equities, which invests in other public equities funds seeking to beat the Ibovespa . Pension Plans – R$3.1bn AUM (13%) Within our IP&S segment, we manage PGBL and VGBL pension plan funds, owned by retail clients, which provide tax and succession benefits . Our flagship strategy, “Vinci Equilíbrio”, seeks investments in specific asset classes, such as fixed income, foreign exchange currency, public equities, derivatives and other funds. INVESTMENT PRODUCTS & SOLUTIONS R$24 BILLION AUM In our separate exclusive mandates, we provide investment solutions to institutional investors, such as small to medium - sized foundations, pension funds and financial institutions in Brazil, and high net worth individuals . Our asset allocation team seeks tailored made and distinctive portfolio construction solutions, addressing the clients’ specific portfolio objectives and restraints regarding targeted return, risk tolerance, diversification, asset class and liquidity . Separate Exclusive Mandates – R$16.5bn AUM (70%) We are market leaders in providing investment solutions to our clients
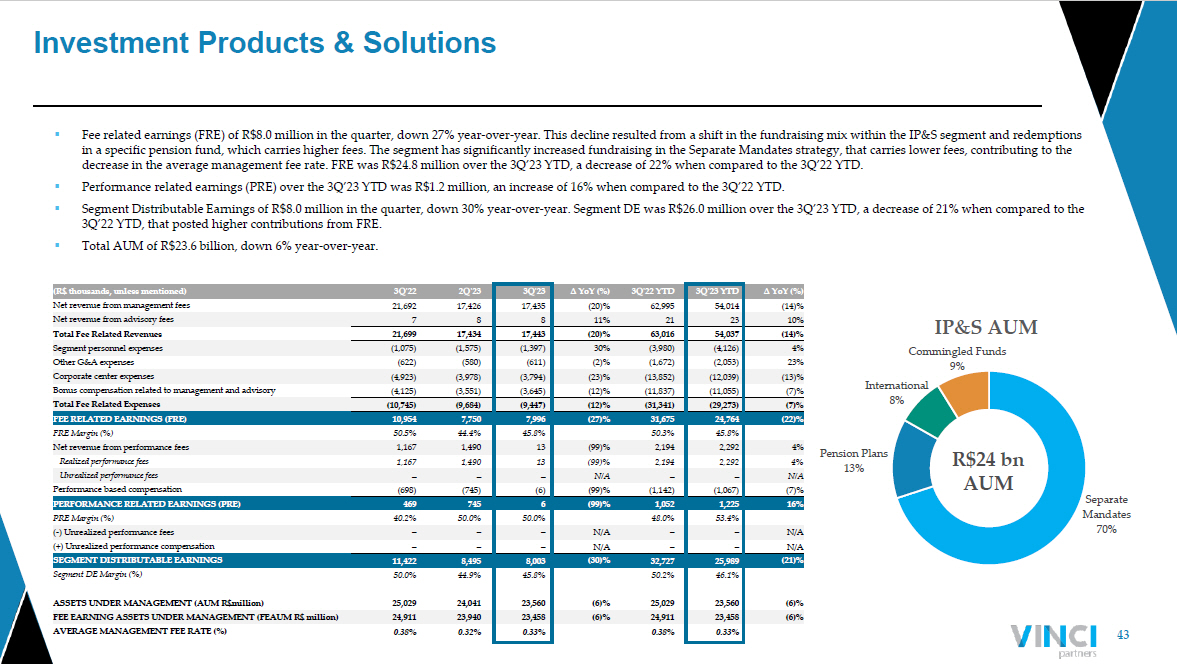
43 Investment Products & Solutions Separate Mandates 70% Pension Plans 13% International 8% Commingled Funds 9% IP&S AUM (R$ thousands, unless mentioned) 3Q'22 2Q'23 3Q'23 ∆ YoY (%) 3Q'22 YTD 3Q'23 YTD ∆ YoY (%) Net revenue from management fees 21,692 17,426 17,435 (20)% 62,995 54,014 (14)% Net revenue from advisory fees 7 8 8 11% 21 23 10% Total Fee Related Revenues 21,699 17,434 17,443 (20)% 63,016 54,037 (14)% Segment personnel expenses (1,075) (1,575) (1,397) 30% (3,980) (4,126) 4% Other G&A expenses (622) (580) (611) (2)% (1,672) (2,053) 23% Corporate center expenses (4,923) (3,978) (3,794) (23)% (13,852) (12,039) (13)% Bonus compensation related to management and advisory (4,125) (3,551) (3,645) (12)% (11,837) (11,055) (7)% Total Fee Related Expenses (10,745) (9,684) (9,447) (12)% (31,341) (29,273) (7)% FEE RELATED EARNINGS (FRE) 10,954 7,750 7,996 (27)% 31,675 24,764 (22)% FRE Margin (%) 50.5% 44.4% 45.8% 50.3% 45.8% Net revenue from performance fees 1,167 1,490 13 (99)% 2,194 2,292 4% Realized performance fees 1,167 1,490 13 (99)% 2,194 2,292 4% Unrealized performance fees – – – N/A – – N/A Performance based compensation (698) (745) (6) (99)% (1,142) (1,067) (7)% PERFORMANCE RELATED EARNINGS (PRE) 469 745 6 (99)% 1,052 1,225 16% PRE Margin (%) 40.2% 50.0% 50.0% 48.0% 53.4% ( - ) Unrealized performance fees – – – N/A – – N/A (+) Unrealized performance compensation – – – N/A – – N/A SEGMENT DISTRIBUTABLE EARNINGS 11,422 8,495 8,003 (30)% 32,727 25,989 (21)% Segment DE Margin (%) 50.0% 44.9% 45.8% 50.2% 46.1% ASSETS UNDER MANAGEMENT (AUM R$million) 25,029 24,041 23,560 (6)% 25,029 23,560 (6)% FEE EARNING ASSETS UNDER MANAGEMENT (FEAUM R$ million) 24,911 23,940 23,458 (6)% 24,911 23,458 (6)% AVERAGE MANAGEMENT FEE RATE (%) 0.38% 0.32% 0.33% 0.38% 0.33% ▪ Fee related earnings (FRE) of R$8.0 million in the quarter, down 27% year - over - year. This decline resulted from a shift in the f undraising mix within the IP&S segment and redemptions in a specific pension fund, which carries higher fees. The segment has significantly increased fundraising in the Separate Ma nda tes strategy, that carries lower fees, contributing to the decrease in the average management fee rate. FRE was R$24.8 million over the 3Q’23 YTD, a decrease of 22% when compared to th e 3 Q’22 YTD. ▪ Performance related earnings (PRE) over the 3Q’23 YTD was R$1.2 million, an increase of 16% when compared to the 3Q’22 YTD. ▪ Segment Distributable Earnings of R$8.0 million in the quarter, down 30% year - over - year. Segment DE was R$26.0 million over the 3Q’23 YTD, a decrease of 21% when compared to the 3Q’22 YTD, that posted higher contributions from FRE. ▪ Total AUM of R$23.6 billion, down 6% year - over - year. R$24 bn AUM

44 We have an established and widely recognized liquid strategies platform LIQUID STRATEGIES R$11 BILLION AUM Vinci Partners has a long track record and deep experience investing in public equities in Brazil . We focus on holding positions in companies for three to five years following deep analysis and review by our various investment committees, taking into consideration our internal controls . Our public equities strategy invests according to two key sub - strategies : All Caps : The all - caps sub - strategy focuses on long term performance through a concentrated portfolio and deep fundamental analysis without any market capitalization constraints . Our all caps flagship strategy is Vinci Mosaico , that seeks to achieve long - term results above the Brazilian stock market . The team also manages a sovereign wealth exclusive mandate under the all caps strategy . Dividends : The dividends sub - strategy focuses on well - managed companies with a strong presence in their segments that are generating significant cash returns through dividends . Our flagship strategy is Vinci Gas Dividendos , that seeks to achieve long - term returns by investing in companies with a consistent history of dividends’ payment . Public Equities – R$8.7bn AUM (75%) Our hedge funds team operates under a multi - manager strategy with several portfolio managers each pursuing independent strategies . The portfolio managers have access to both our macro and equities research dedicated teams . It helps creating a very robust analysis of the markets and developed markets currencies, government bonds and derivatives . We have strong overarching risk monitoring practices in order to generate superior Sharpe ratio and alpha for our investors . Our hedge funds strategy invests through two key sub - strategies : Vinci Atlas : Our hedge funds flagship strategy invests across five principal sub - strategies : nominal interest, inflation, commodities, currencies and equities . Total Return : The total return strategy focuses on high absolute risk - adjusted returns through fundamental analysis, diversification and use of derivatives . Hedge Funds – R$2.8bn AUM (25%)
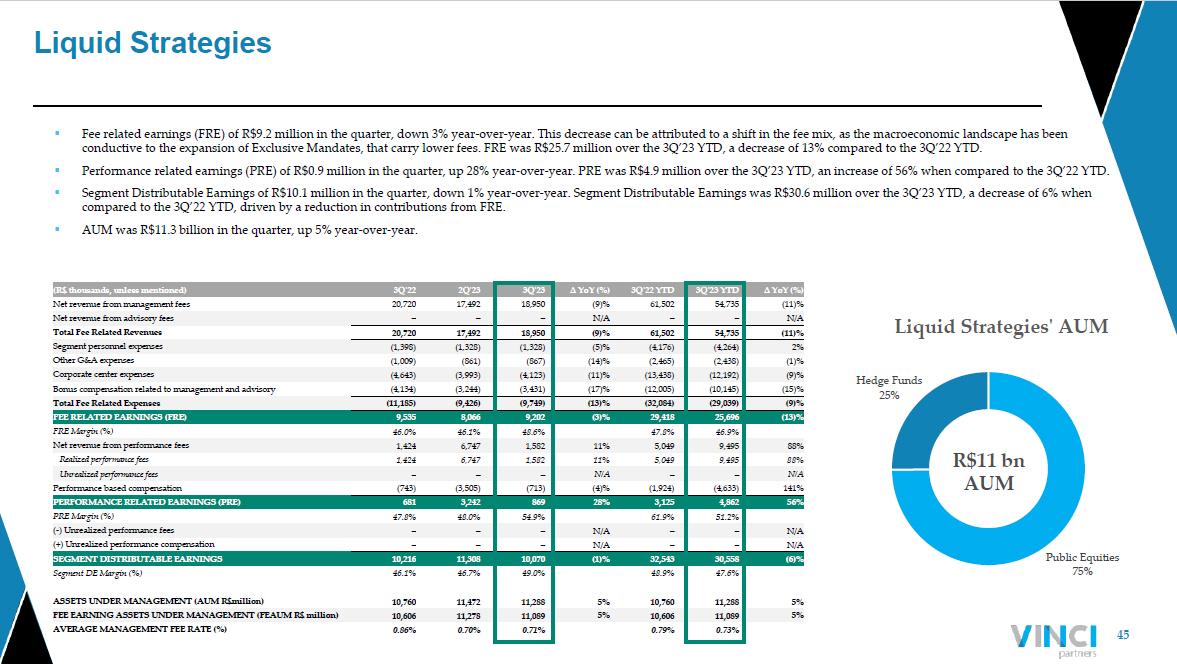
45 Liquid Strategies Public Equities 75% Hedge Funds 25% Liquid Strategies' AUM (R$ thousands, unless mentioned) 3Q'22 2Q'23 3Q'23 ∆ YoY (%) 3Q'22 YTD 3Q'23 YTD ∆ YoY (%) Net revenue from management fees 20,720 17,492 18,950 (9)% 61,502 54,735 (11)% Net revenue from advisory fees – – – N/A – – N/A Total Fee Related Revenues 20,720 17,492 18,950 (9)% 61,502 54,735 (11)% Segment personnel expenses (1,398) (1,328) (1,328) (5)% (4,176) (4,264) 2% Other G&A expenses (1,009) (861) (867) (14)% (2,465) (2,438) (1)% Corporate center expenses (4,643) (3,993) (4,123) (11)% (13,438) (12,192) (9)% Bonus compensation related to management and advisory (4,134) (3,244) (3,431) (17)% (12,005) (10,145) (15)% Total Fee Related Expenses (11,185) (9,426) (9,749) (13)% (32,084) (29,039) (9)% FEE RELATED EARNINGS (FRE) 9,535 8,066 9,202 (3)% 29,418 25,696 (13)% FRE Margin (%) 46.0% 46.1% 48.6% 47.8% 46.9% Net revenue from performance fees 1,424 6,747 1,582 11% 5,049 9,495 88% Realized performance fees 1,424 6,747 1,582 11% 5,049 9,495 88% Unrealized performance fees – – – N/A – – N/A Performance based compensation (743) (3,505) (713) (4)% (1,924) (4,633) 141% PERFORMANCE RELATED EARNINGS (PRE) 681 3,242 869 28% 3,125 4,862 56% PRE Margin (%) 47.8% 48.0% 54.9% 61.9% 51.2% ( - ) Unrealized performance fees – – – N/A – – N/A (+) Unrealized performance compensation – – – N/A – – N/A SEGMENT DISTRIBUTABLE EARNINGS 10,216 11,308 10,070 (1)% 32,543 30,558 (6)% Segment DE Margin (%) 46.1% 46.7% 49.0% 48.9% 47.6% ASSETS UNDER MANAGEMENT (AUM R$million) 10,760 11,472 11,288 5% 10,760 11,288 5% FEE EARNING ASSETS UNDER MANAGEMENT (FEAUM R$ million) 10,606 11,278 11,089 5% 10,606 11,089 5% AVERAGE MANAGEMENT FEE RATE (%) 0.86% 0.70% 0.71% 0.79% 0.73% ▪ Fee related earnings (FRE) of R$9.2 million in the quarter, down 3% year - over - year. This decrease can be attributed to a shift i n the fee mix, as the macroeconomic landscape has been conductive to the expansion of Exclusive Mandates, that carry lower fees. FRE was R$25.7 million over the 3Q’23 YTD, a decrea se of 13% compared to the 3Q’22 YTD. ▪ Performance related earnings (PRE) of R$0.9 million in the quarter, up 28% year - over - year. PRE was R$4.9 million over the 3Q’23 YTD, an increase of 56% when compared to the 3Q’22 YTD. ▪ Segment Distributable Earnings of R$10.1 million in the quarter, down 1% year - over - year. Segment Distributable Earnings was R$30 .6 million over the 3Q’23 YTD, a decrease of 6% when compared to the 3Q’22 YTD, driven by a reduction in contributions from FRE. ▪ AUM was R$11.3 billion in the quarter, up 5% year - over - year. R$11 bn AUM
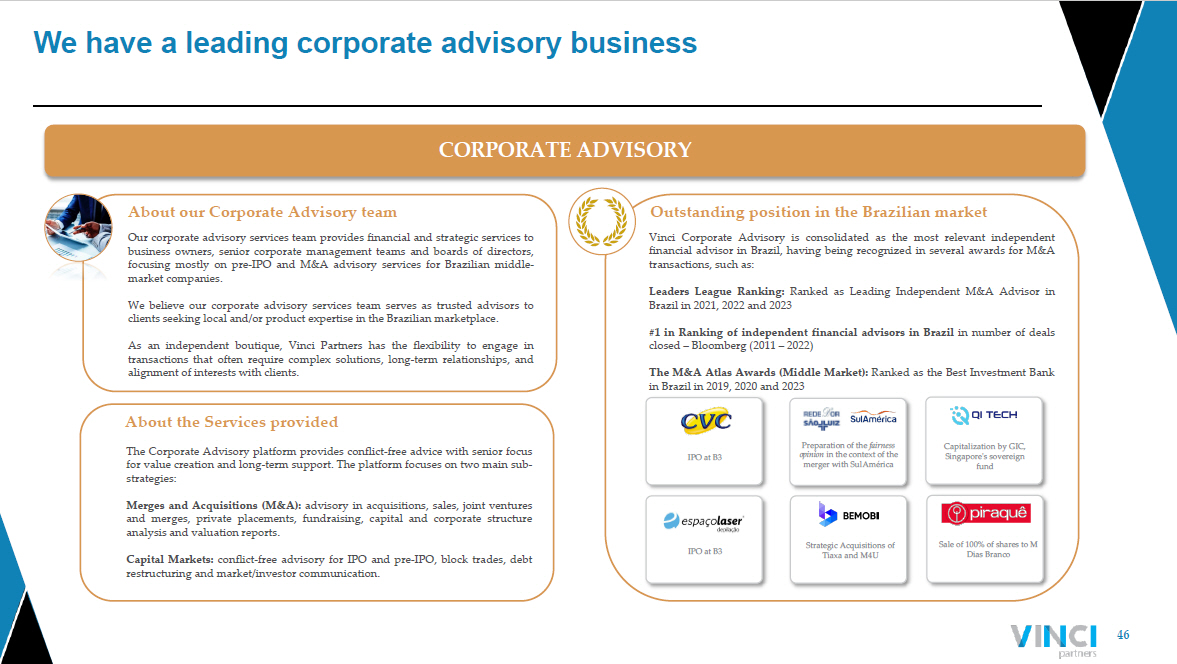
46 We have a leading corporate advisory business About our Corporate Advisory team Our corporate advisory services team provides financial and strategic services to business owners, senior corporate management teams and boards of directors, focusing mostly on pre - IPO and M&A advisory services for Brazilian middle - market companies . We believe our corporate advisory services team serves as trusted advisors to clients seeking local and/or product expertise in the Brazilian marketplace . As an independent boutique, Vinci Partners has the flexibility to engage in transactions that often require complex solutions, long - term relationships, and alignment of interests with clients . About the Services provided Outstanding position in the Brazilian market CORPORATE ADVISORY The Corporate Advisory platform provides conflict - free advice with senior focus for value creation and long - term support . The platform focuses on two main sub - strategies : Merges and Acquisitions (M&A) : advisory in acquisitions, sales, joint ventures and merges, private placements, fundraising, capital and corporate structure analysis and valuation reports . Capital Markets : conflict - free advisory for IPO and pre - IPO, block trades, debt restructuring and market/investor communication . Vinci Corporate Advisory is consolidated as the most relevant independent financial advisor in Brazil, having being recognized in several awards for M&A transactions, such as : Leaders League Ranking : Ranked as Leading Independent M&A Advisor in Brazil in 2021 , 2022 and 2023 # 1 in Ranking of independent financial advisors in Brazil in number of deals closed – Bloomberg ( 2011 – 2022 ) The M&A Atlas Awards (Middle Market) : Ranked as the Best Investment Bank in Brazil in 2019 , 2020 and 2023 Sale of 100% of shares to M Dias Branco Strategic Acquisitions of Tiaxa and M4U Preparation of the fairness opinion in the context of the merger with SulAmérica Capitalization by GIC, Singapore's sovereign fund IPO at B3 IPO at B3
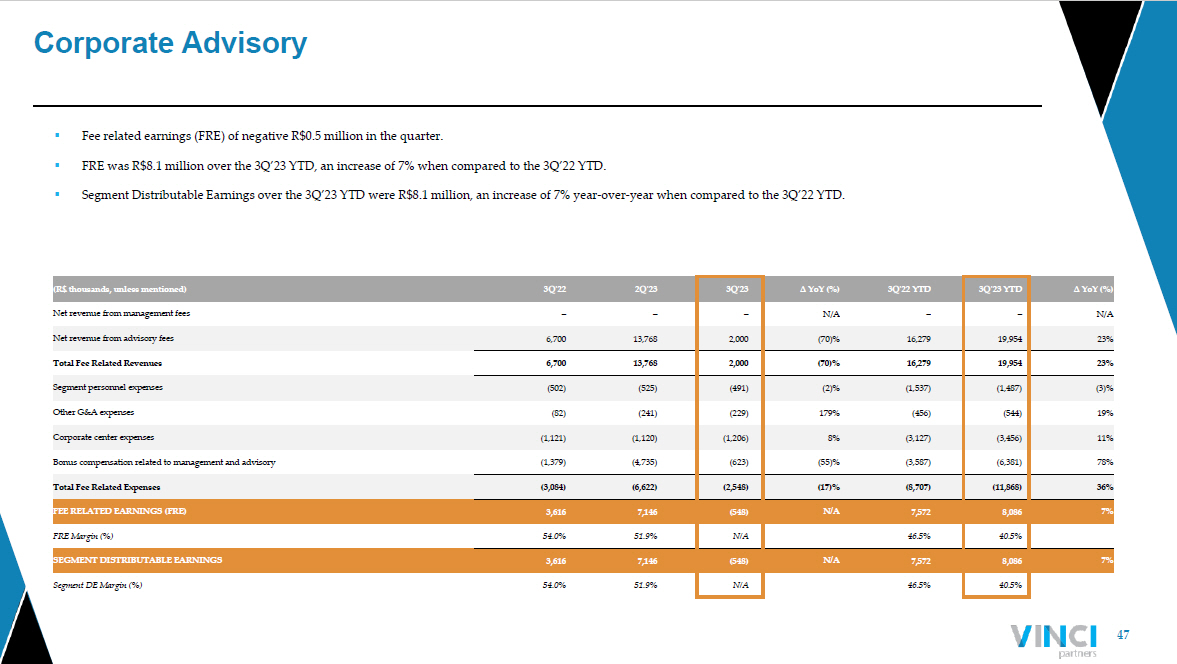
47 Corporate Advisory ▪ Fee related earnings (FRE) of negative R$0.5 million in the quarter. ▪ FRE was R$8.1 million over the 3Q’23 YTD, an increase of 7% when compared to the 3Q’22 YTD. ▪ Segment Distributable Earnings over the 3Q’23 YTD were R$8.1 million, an increase of 7% year - over - year when compared to the 3Q’2 2 YTD. (R$ thousands, unless mentioned) 3Q'22 2Q'23 3Q'23 ∆ YoY (%) 3Q'22 YTD 3Q'23 YTD ∆ YoY (%) Net revenue from management fees – – – N/A – – N/A Net revenue from advisory fees 6,700 13,768 2,000 (70)% 16,279 19,954 23% Total Fee Related Revenues 6,700 13,768 2,000 (70)% 16,279 19,954 23% Segment personnel expenses (502) (525) (491) (2)% (1,537) (1,487) (3)% Other G&A expenses (82) (241) (229) 179% (456) (544) 19% Corporate center expenses (1,121) (1,120) (1,206) 8% (3,127) (3,456) 11% Bonus compensation related to management and advisory (1,379) (4,735) (623) (55)% (3,587) (6,381) 78% Total Fee Related Expenses (3,084) (6,622) (2,548) (17)% (8,707) (11,868) 36% FEE RELATED EARNINGS (FRE) 3,616 7,146 (548) N/A 7,572 8,086 7% FRE Margin (%) 54.0% 51.9% N/A 46.5% 40.5% SEGMENT DISTRIBUTABLE EARNINGS 3,616 7,146 (548) N/A 7,572 8,086 7% Segment DE Margin (%) 54.0% 51.9% N/A 46.5% 40.5%
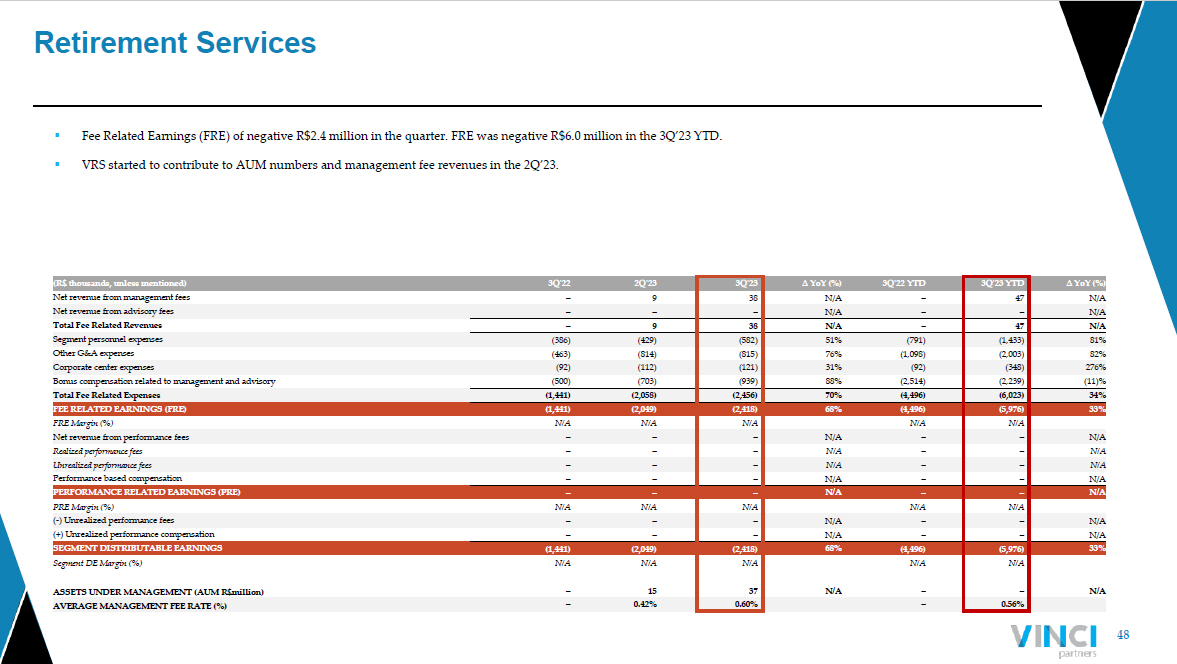
48 Retirement Services (R$ thousands, unless mentioned) 3Q'22 2Q'23 3Q'23 ∆ YoY (%) 3Q'22 YTD 3Q'23 YTD ∆ YoY (%) Net revenue from management fees – 9 38 N/A – 47 N/A Net revenue from advisory fees – – – N/A – – N/A Total Fee Related Revenues – 9 38 N/A – 47 N/A Segment personnel expenses (386) (429) (582) 51% (791) (1,433) 81% Other G&A expenses (463) (814) (815) 76% (1,098) (2,003) 82% Corporate center expenses (92) (112) (121) 31% (92) (348) 276% Bonus compensation related to management and advisory (500) (703) (939) 88% (2,514) (2,239) (11)% Total Fee Related Expenses (1,441) (2,058) (2,456) 70% (4,496) (6,023) 34% FEE RELATED EARNINGS (FRE) (1,441) (2,049) (2,418) 68% (4,496) (5,976) 33% FRE Margin (%) N/A N/A N/A N/A N/A Net revenue from performance fees – – – N/A – – N/A Realized performance fees – – – N/A – – N/A Unrealized performance fees – – – N/A – – N/A Performance based compensation – – – N/A – – N/A PERFORMANCE RELATED EARNINGS (PRE) – – – N/A – – N/A PRE Margin (%) N/A N/A N/A N/A N/A ( - ) Unrealized performance fees – – – N/A – – N/A (+) Unrealized performance compensation – – – N/A – – N/A SEGMENT DISTRIBUTABLE EARNINGS (1,441) (2,049) (2,418) 68% (4,496) (5,976) 33% Segment DE Margin (%) N/A N/A N/A N/A N/A ASSETS UNDER MANAGEMENT (AUM R$million) – 15 37 N/A – – N/A AVERAGE MANAGEMENT FEE RATE (%) – 0.42% 0.60% – 0.56% ▪ Fee Related Earnings (FRE) of negative R$2.4 million in the quarter. FRE was negative R$6.0 million in the 3Q’23 YTD. ▪ VRS started to contribute to AUM numbers and management fee revenues in the 2Q’23.
Appendix – III Financial Statements
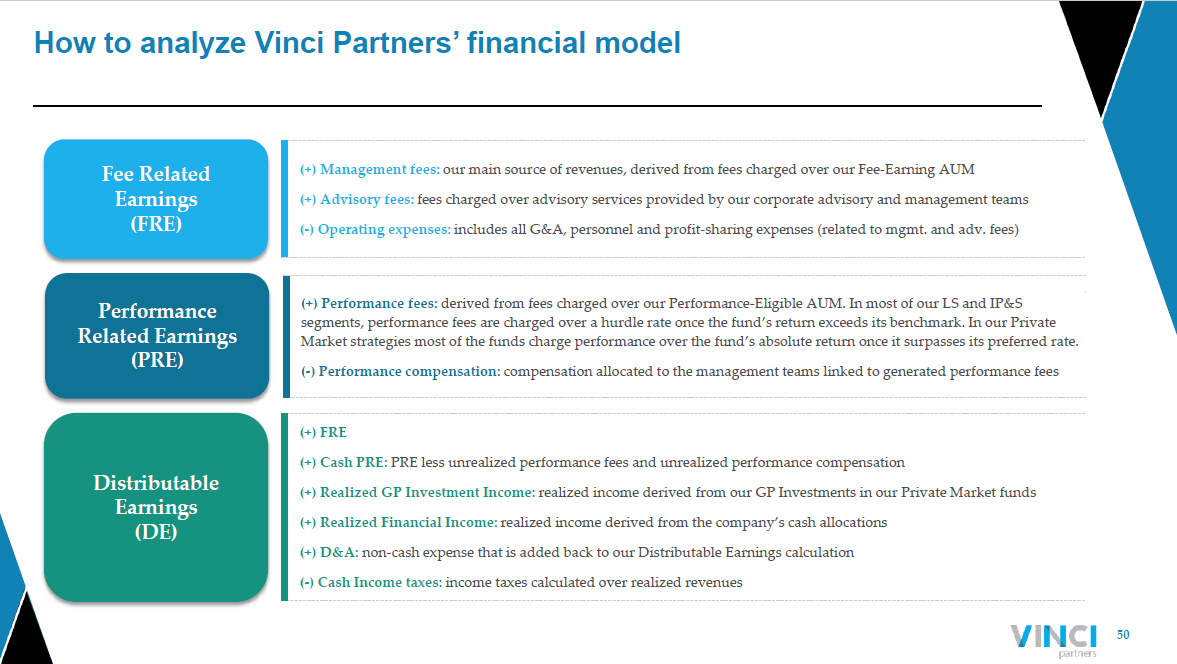
50 How to analyze Vinci Partners’ financial model Fee Related Earnings (FRE) (+) Management fees: our main source of revenues, derived from fees charged over our Fee - Earning AUM (+) Advisory fees: fees charged over advisory services provided by our corporate advisory and management teams ( - ) Operating expenses: includes all G&A, personnel and profit - sharing expenses (related to mgmt. and adv. fees) Performance Related Earnings (PRE) (+) Performance fees: derived from fees charged over our Performance - Eligible AUM. In most of our LS and IP&S segments, performance fees are charged over a hurdle rate once the fund’s return exceeds its benchmark. In our Private Market strategies most of the funds charge performance over the fund’s absolute return once it surpasses its preferred rate. ( - ) Performance compensation: compensation allocated to the management teams linked to generated performance fees Distributable Earnings (DE) (+) FRE (+) Cash PRE: PRE less unrealized performance fees and unrealized performance compensation (+) Realized GP Investment Income: realized income derived from our GP Investments in our Private Market funds (+) Realized Financial Income: realized income derived from the company’s cash allocations (+) D&A: non - cash expense that is added back to our Distributable Earnings calculation ( - ) Cash Income taxes: income taxes calculated over realized revenues
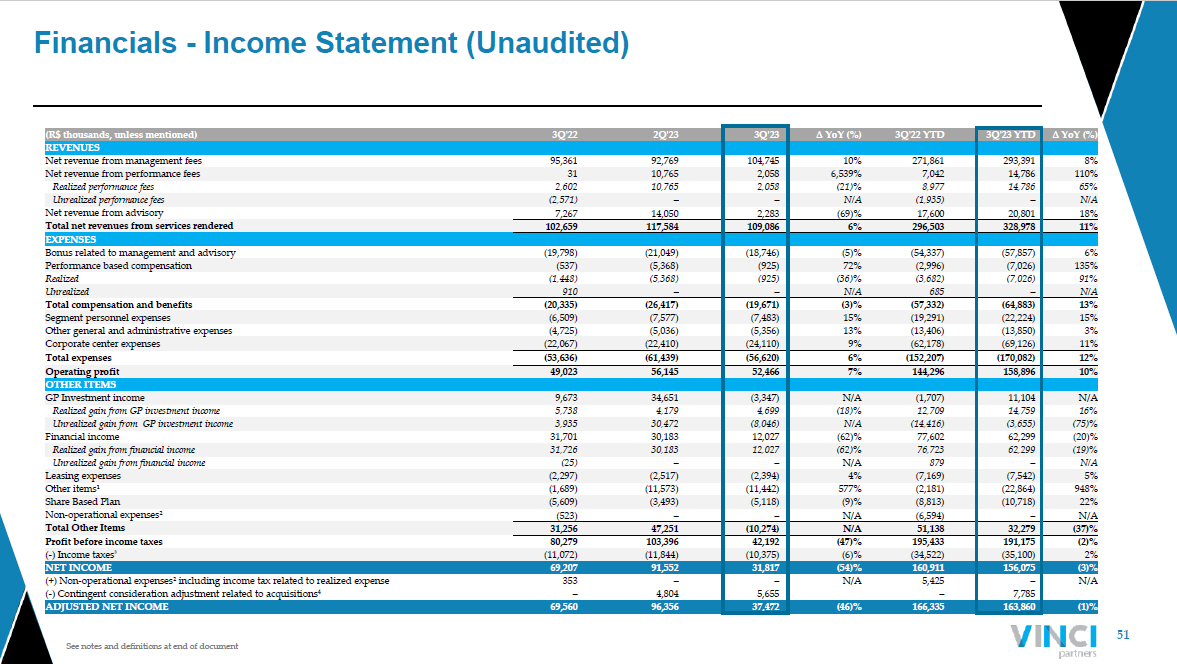
51 See notes and definitions at end of document Financials - Income Statement (Unaudited) (R$ thousands, unless mentioned) 3Q'22 2Q'23 3Q'23 ∆ YoY (%) 3Q'22 YTD 3Q'23 YTD ∆ YoY (%) REVENUES Net revenue from management fees 95,361 92,769 104,745 10% 271,861 293,391 8% Net revenue from performance fees 31 10,765 2,058 6,539% 7,042 14,786 110% Realized performance fees 2,602 10,765 2,058 (21)% 8,977 14,786 65% Unrealized performance fees (2,571) – – N/A (1,935) – N/A Net revenue from advisory 7,267 14,050 2,283 (69)% 17,600 20,801 18% Total net revenues from services rendered 102,659 117,584 109,086 6% 296,503 328,978 11% EXPENSES Bonus related to management and advisory (19,798) (21,049) (18,746) (5)% (54,337) (57,857) 6% Performance based compensation (537) (5,368) (925) 72% (2,996) (7,026) 135% Realized (1,448) (5,368) (925) (36)% (3,682) (7,026) 91% Unrealized 910 – – N/A 685 – N/A Total compensation and benefits (20,335) (26,417) (19,671) (3)% (57,332) (64,883) 13% Segment personnel expenses (6,509) (7,577) (7,483) 15% (19,291) (22,224) 15% Other general and administrative expenses (4,725) (5,036) (5,356) 13% (13,406) (13,850) 3% Corporate center expenses (22,067) (22,410) (24,110) 9% (62,178) (69,126) 11% Total expenses (53,636) (61,439) (56,620) 6% (152,207) (170,082) 12% Operating profit 49,023 56,145 52,466 7% 144,296 158,896 10% OTHER ITEMS GP Investment income 9,673 34,651 (3,347) N/A (1,707) 11,104 N/A Realized gain from GP investment income 5,738 4,179 4,699 (18)% 12,709 14,759 16% Unrealized gain from GP investment income 3,935 30,472 (8,046) N/A (14,416) (3,655) (75)% Financial income 31,701 30,183 12,027 (62)% 77,602 62,299 (20)% Realized gain from financial income 31,726 30,183 12,027 (62)% 76,723 62,299 (19)% Unrealized gain from financial income (25) – – N/A 879 – N/A Leasing expenses (2,297) (2,517) (2,394) 4% (7,169) (7,542) 5% Other items¹ (1,689) (11,573) (11,442) 577% (2,181) (22,864) 948% Share Based Plan (5,609) (3,493) (5,118) (9)% (8,813) (10,718) 22% Non - operational expenses² (523) – – N/A (6,594) – N/A Total Other Items 31,256 47,251 (10,274) N/A 51,138 32,279 (37)% Profit before income taxes 80,279 103,396 42,192 (47)% 195,433 191,175 (2)% ( - ) Income taxes ³ (11,072) (11,844) (10,375) (6)% (34,522) (35,100) 2% NET INCOME 69,207 91,552 31,817 (54)% 160,911 156,075 (3)% (+) Non - operational expenses² including income tax related to realized expense 353 – – N/A 5,425 – N/A ( - ) Contingent consideration adjustment related to acquisitions 4 – 4,804 5,655 – 7,785 ADJUSTED NET INCOME 69,560 96,356 37,472 (46)% 166,335 163,860 (1)%
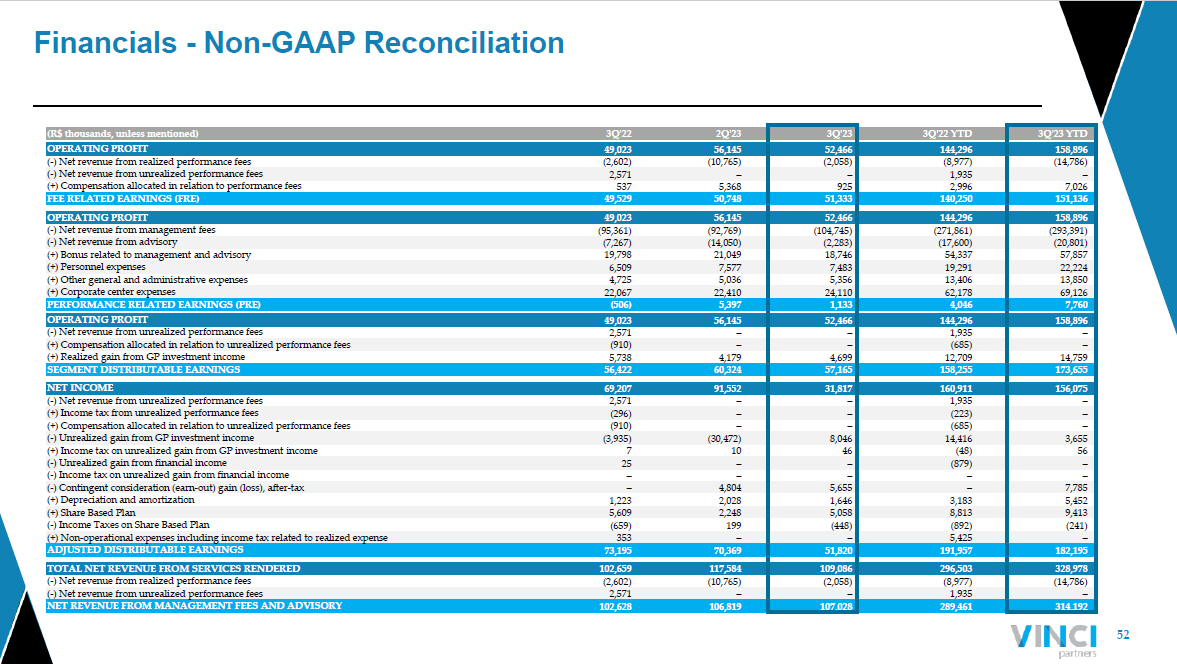
52 Financials - Non - GAAP Reconciliation (R$ thousands, unless mentioned) 3Q'22 2Q'23 3Q'23 3Q'22 YTD 3Q'23 YTD OPERATING PROFIT 49,023 56,145 52,466 144,296 158,896 ( - ) Net revenue from realized performance fees (2,602) (10,765) (2,058) (8,977) (14,786) ( - ) Net revenue from unrealized performance fees 2,571 – – 1,935 – (+) Compensation allocated in relation to performance fees 537 5,368 925 2,996 7,026 FEE RELATED EARNINGS (FRE) 49,529 50,748 51,333 140,250 151,136 OPERATING PROFIT 49,023 56,145 52,466 144,296 158,896 ( - ) Net revenue from management fees (95,361) (92,769) (104,745) (271,861) (293,391) ( - ) Net revenue from advisory (7,267) (14,050) (2,283) (17,600) (20,801) (+) Bonus related to management and advisory 19,798 21,049 18,746 54,337 57,857 (+) Personnel expenses 6,509 7,577 7,483 19,291 22,224 (+) Other general and administrative expenses 4,725 5,036 5,356 13,406 13,850 (+) Corporate center expenses 22,067 22,410 24,110 62,178 69,126 PERFORMANCE RELATED EARNINGS (PRE) (506) 5,397 1,133 4,046 7,760 OPERATING PROFIT 49,023 56,145 52,466 144,296 158,896 ( - ) Net revenue from unrealized performance fees 2,571 – – 1,935 – (+) Compensation allocated in relation to unrealized performance fees (910) – – (685) – (+) Realized gain from GP investment income 5,738 4,179 4,699 12,709 14,759 SEGMENT DISTRIBUTABLE EARNINGS 56,422 60,324 57,165 158,255 173,655 NET INCOME 69,207 91,552 31,817 160,911 156,075 ( - ) Net revenue from unrealized performance fees 2,571 – – 1,935 – (+) Income tax from unrealized performance fees (296) – – (223) – (+) Compensation allocated in relation to unrealized performance fees (910) – – (685) – ( - ) Unrealized gain from GP investment income (3,935) (30,472) 8,046 14,416 3,655 (+) Income tax on unrealized gain from GP investment income 7 10 46 (48) 56 ( - ) Unrealized gain from financial income 25 – – (879) – ( - ) Income tax on unrealized gain from financial income – – – – – ( - ) Contingent consideration (earn - out) gain (loss), after - tax – 4,804 5,655 – 7,785 (+) Depreciation and amortization 1,223 2,028 1,646 3,183 5,452 (+) Share Based Plan 5,609 2,248 5,058 8,813 9,413 ( - ) Income Taxes on Share Based Plan (659) 199 (448) (892) (241) (+) Non - operational expenses including income tax related to realized expense 353 – – 5,425 – ADJUSTED DISTRIBUTABLE EARNINGS 73,195 70,369 51,820 191,957 182,195 TOTAL NET REVENUE FROM SERVICES RENDERED 102,659 117,584 109,086 296,503 328,978 ( - ) Net revenue from realized performance fees (2,602) (10,765) (2,058) (8,977) (14,786) ( - ) Net revenue from unrealized performance fees 2,571 – – 1,935 – NET REVENUE FROM MANAGEMENT FEES AND ADVISORY 102,628 106,819 107,028 289,461 314,192
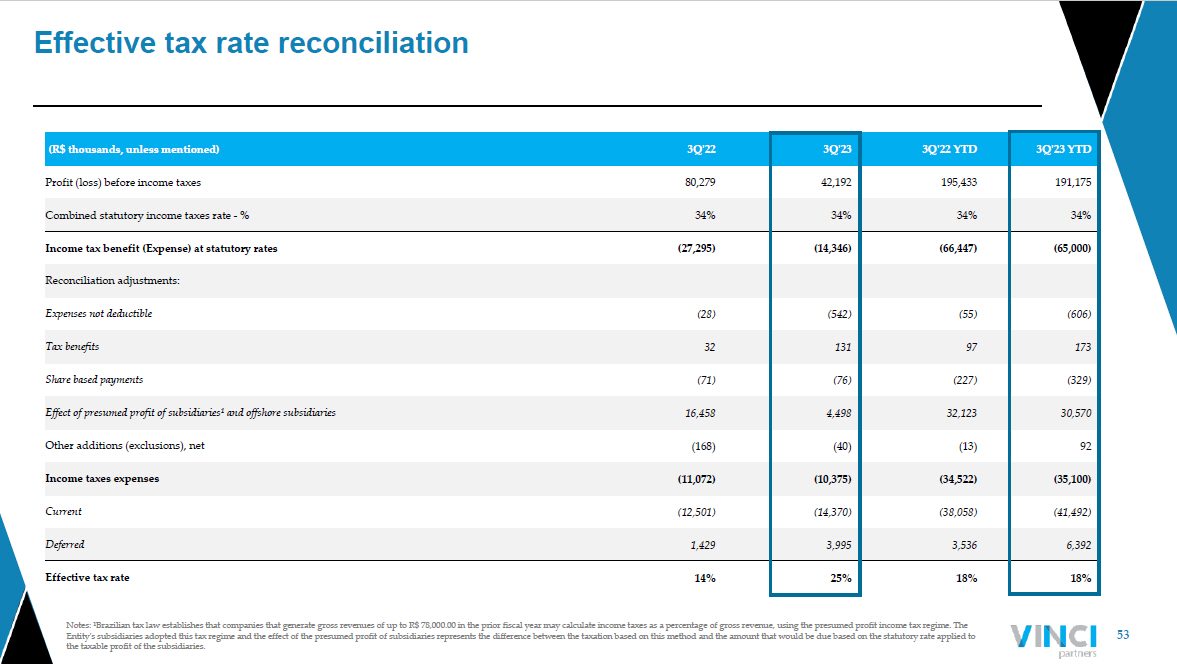
53 Notes: ¹Brazilian tax law establishes that companies that generate gross revenues of up to R$ 78,000.00 in the prior fiscal y ear may calculate income taxes as a percentage of gross revenue, using the presumed profit income tax regime. The Entity's subsidiaries adopted this tax regime and the effect of the presumed profit of subsidiaries represents the difference be tween the taxation based on this method and the amount that would be due based on the statutory rate applied to the taxable profit of the subsidiaries. Effective tax rate reconciliation (R$ thousands, unless mentioned) 3Q'22 3Q'23 3Q'22 YTD 3Q'23 YTD Profit (loss) before income taxes 80,279 42,192 195,433 191,175 Combined statutory income taxes rate - % 34% 34% 34% 34% Income tax benefit (Expense) at statutory rates (27,295) (14,346) (66,447) (65,000) Reconciliation adjustments: Expenses not deductible (28) (542) (55) (606) Tax benefits 32 131 97 173 Share based payments (71) (76) (227) (329) Effect of presumed profit of subsidiaries¹ and offshore subsidiaries 16,458 4,498 32,123 30,570 Other additions (exclusions), net (168) (40) (13) 92 Income taxes expenses (11,072) (10,375) (34,522) (35,100) Current (12,501) (14,370) (38,058) (41,492) Deferred 1,429 3,995 3,536 6,392 Effective tax rate 14% 25% 18% 18%
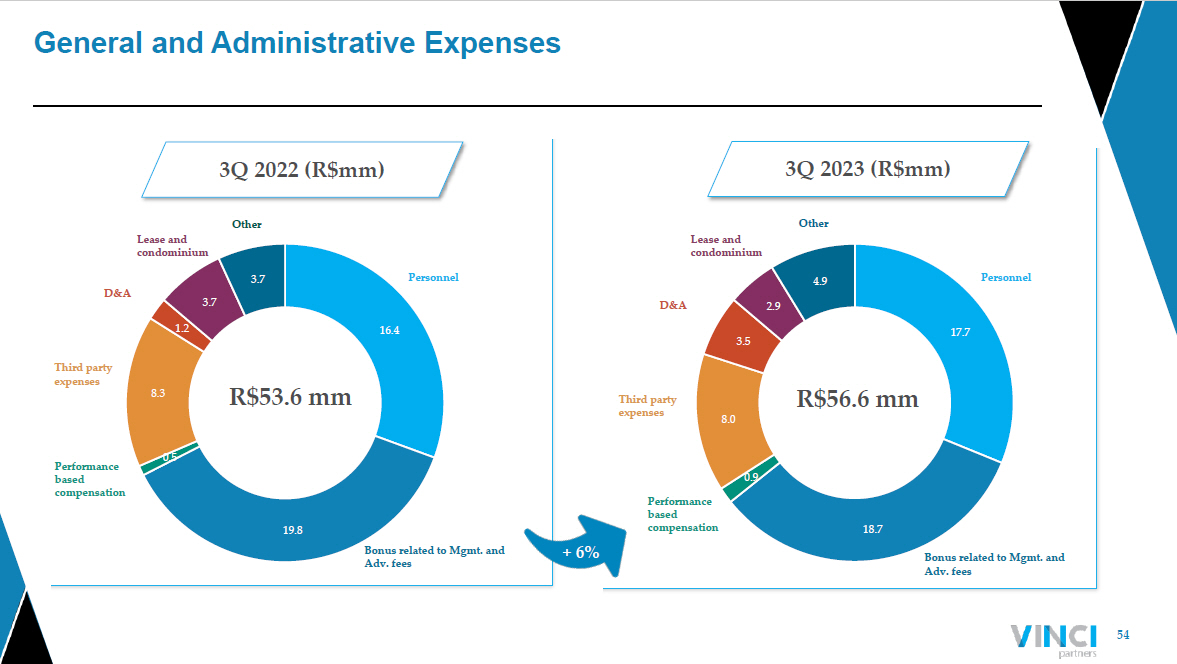
54 General and Administrative Expenses 17.7 18.7 0.9 8.0 3.5 2.9 4.9 16.4 19.8 0.5 8.3 1.2 3.7 3.7 3Q 2022 (R$mm) 3 Q 2023 (R$mm) Lease and condominium Other Personnel Bonus related to Mgmt. and Adv. fees Performance based compensation Third party expenses D&A R$53.6 mm Personnel Bonus related to Mgmt. and Adv. fees Performance based compensation Third party expenses D&A Lease and condominium Other R$56.6 mm + 6%
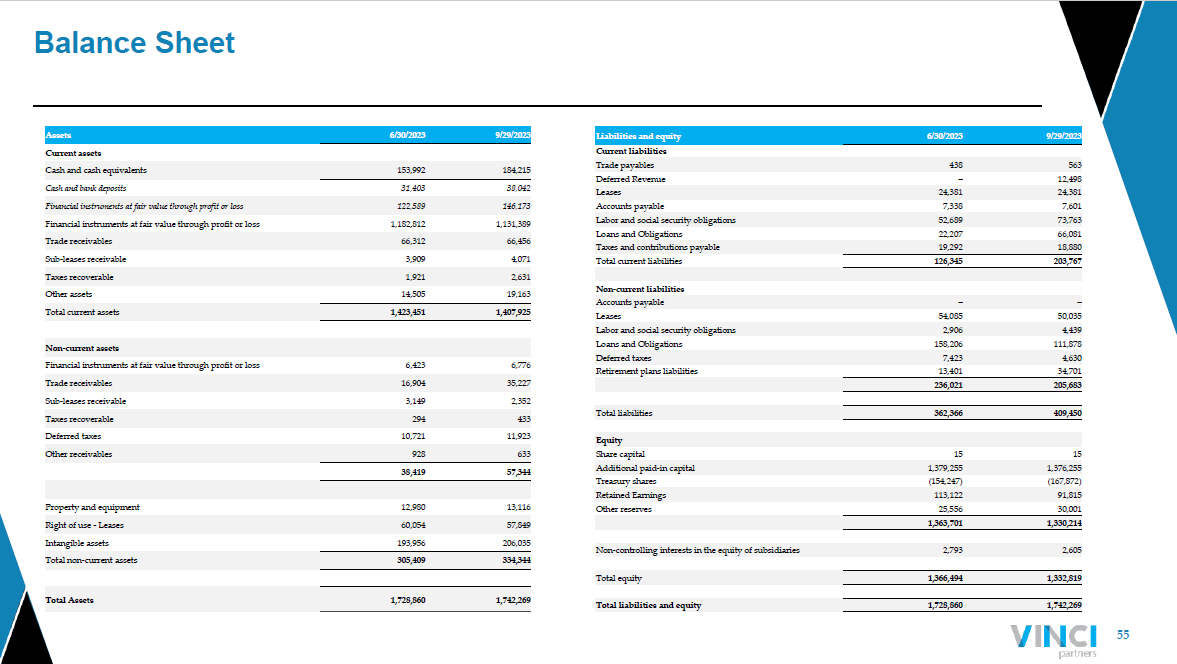
55 Balance Sheet Liabilities and equity 6/30/2023 9/29/2023 Current liabilities Trade payables 438 563 Deferred Revenue – 12,498 Leases 24,381 24,381 Accounts payable 7,338 7,601 Labor and social security obligations 52,689 73,763 Loans and Obligations 22,207 66,081 Taxes and contributions payable 19,292 18,880 Total current liabilities 126,345 203,767 Non - current liabilities Accounts payable – – Leases 54,085 50,035 Labor and social security obligations 2,906 4,439 Loans and Obligations 158,206 111,878 Deferred taxes 7,423 4,630 Retirement plans liabilities 13,401 34,701 236,021 205,683 Total liabilities 362,366 409,450 Equity Share capital 15 15 Additional paid - in capital 1,379,255 1,376,255 Treasury shares (154,247) (167,872) Retained Earnings 113,122 91,815 Other reserves 25,556 30,001 1,363,701 1,330,214 Non - controlling interests in the equity of subsidiaries 2,793 2,605 Total equity 1,366,494 1,332,819 Total liabilities and equity 1,728,860 1,742,269 Assets 6/30/2023 9/29/2023 Current assets Cash and cash equivalents 153,992 184,215 Cash and bank deposits 31,403 38,042 Financial instruments at fair value through profit or loss 122,589 146,173 Financial instruments at fair value through profit or loss 1,182,812 1,131,389 Trade receivables 66,312 66,456 Sub - leases receivable 3,909 4,071 Taxes recoverable 1,921 2,631 Other assets 14,505 19,163 Total current assets 1,423,451 1,407,925 Non - current assets Financial instruments at fair value through profit or loss 6,423 6,776 Trade receivables 16,904 35,227 Sub - leases receivable 3,149 2,352 Taxes recoverable 294 433 Deferred taxes 10,721 11,923 Other receivables 928 633 38,419 57,344 Property and equipment 12,980 13,116 Right of use - Leases 60,054 57,849 Intangible assets 193,956 206,035 Total non - current assets 305,409 334,344 Total Assets 1,728,860 1,742,269

Supplemental Details
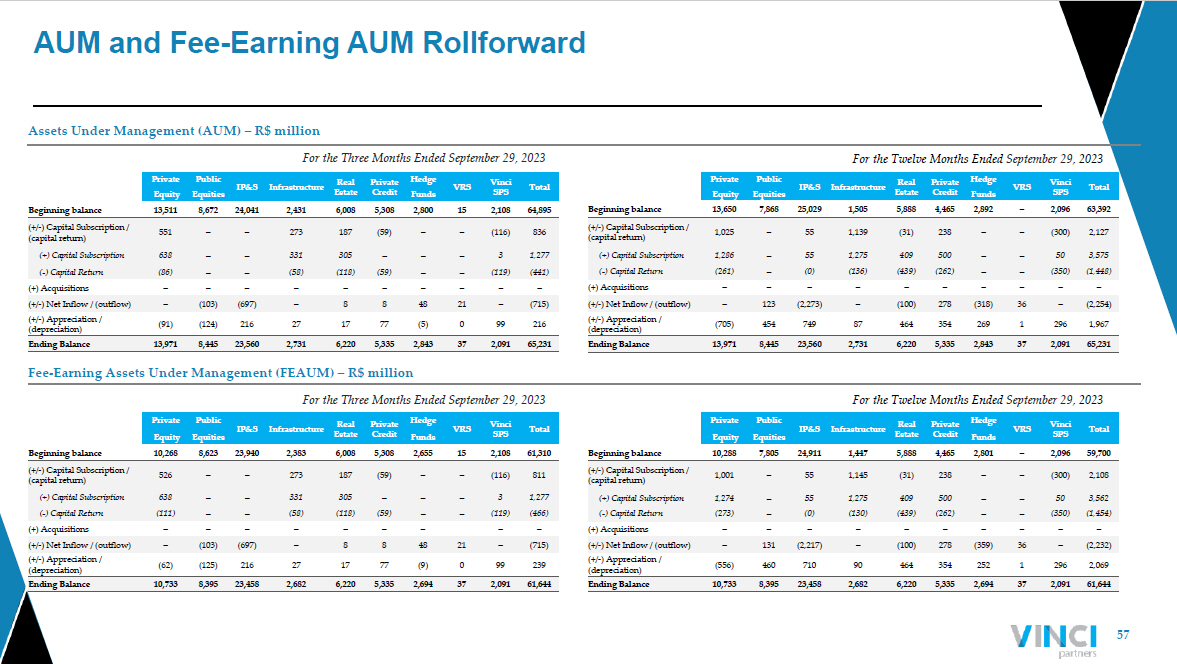
57 AUM and Fee - Earning AUM Rollforward Assets Under Management (AUM) – R$ million Fee - Earning Assets Under Management (FEAUM) – R$ million For the Three Months Ended September 29, 2023 For the Three Months Ended September 29, 2023 For the Twelve Months Ended September 29 , 2023 For the Twelve Months Ended September 29 , 2023 Private Public IP&S Infrastructure Real Estate Private Credit Hedge VRS Vinci SPS Total Equity Equities Funds Beginning balance 13,511 8,672 24,041 2,431 6,008 5,308 2,800 15 2,108 64,895 (+/ - ) Capital Subscription / (capital return) 551 – – 273 187 (59) – – (116) 836 (+) Capital Subscription 638 – – 331 305 – – – 3 1,277 ( - ) Capital Return (86) – – (58) (118) (59) – – (119) (441) (+) Acquisitions – – – – – – – – – – (+/ - ) Net Inflow / (outflow) – (103) (697) – 8 8 48 21 – (715) (+/ - ) Appreciation / (depreciation) (91) (124) 216 27 17 77 (5) 0 99 216 Ending Balance 13,971 8,445 23,560 2,731 6,220 5,335 2,843 37 2,091 65,231 Private Public IP&S Infrastructure Real Estate Private Credit Hedge VRS Vinci SPS Total Equity Equities Funds Beginning balance 13,650 7,868 25,029 1,505 5,888 4,465 2,892 – 2,096 63,392 (+/ - ) Capital Subscription / (capital return) 1,025 – 55 1,139 (31) 238 – – (300) 2,127 (+) Capital Subscription 1,286 – 55 1,275 409 500 – – 50 3,575 ( - ) Capital Return (261) – (0) (136) (439) (262) – – (350) (1,448) (+) Acquisitions – – – – – – – – – – (+/ - ) Net Inflow / (outflow) – 123 (2,273) – (100) 278 (318) 36 – (2,254) (+/ - ) Appreciation / (depreciation) (705) 454 749 87 464 354 269 1 296 1,967 Ending Balance 13,971 8,445 23,560 2,731 6,220 5,335 2,843 37 2,091 65,231 Private Public IP&S Infrastructure Real Estate Private Credit Hedge VRS Vinci SPS Total Equity Equities Funds Beginning balance 10,268 8,623 23,940 2,383 6,008 5,308 2,655 15 2,108 61,310 (+/ - ) Capital Subscription / (capital return) 526 – – 273 187 (59) – – (116) 811 (+) Capital Subscription 638 – – 331 305 – – – 3 1,277 ( - ) Capital Return (111) – – (58) (118) (59) – – (119) (466) (+) Acquisitions – – – – – – – – – (+/ - ) Net Inflow / (outflow) – (103) (697) – 8 8 48 21 – (715) (+/ - ) Appreciation / (depreciation) (62) (125) 216 27 17 77 (9) 0 99 239 Ending Balance 10,733 8,395 23,458 2,682 6,220 5,335 2,694 37 2,091 61,644 Private Public IP&S Infrastructure Real Estate Private Credit Hedge VRS Vinci SPS Total Equity Equities Funds Beginning balance 10,288 7,805 24,911 1,447 5,888 4,465 2,801 – 2,096 59,700 (+/ - ) Capital Subscription / (capital return) 1,001 – 55 1,145 (31) 238 – – (300) 2,108 (+) Capital Subscription 1,274 – 55 1,275 409 500 – – 50 3,562 ( - ) Capital Return (273) – (0) (130) (439) (262) – – (350) (1,454) (+) Acquisitions – – – – – – – – – – (+/ - ) Net Inflow / (outflow) – 131 (2,217) – (100) 278 (359) 36 – (2,232) (+/ - ) Appreciation / (depreciation) (556) 460 710 90 464 354 252 1 296 2,069 Ending Balance 10,733 8,395 23,458 2,682 6,220 5,335 2,694 37 2,091 61,644
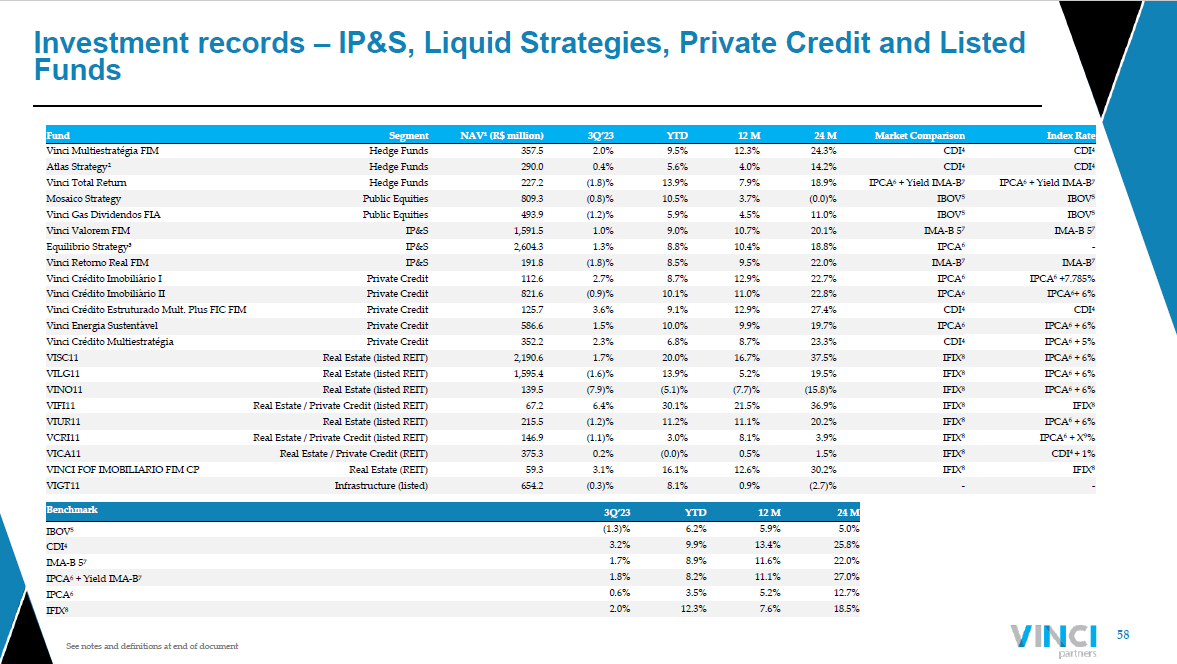
58 See notes and definitions at end of document Investment records – IP&S, Liquid Strategies, Private Credit and Listed Funds Fund Segment NAV¹ (R$ million) 3Q’23 YTD 12 M 24 M Market Comparison Index Rate Vinci Multiestratégia FIM Hedge Funds 357.5 2.0% 9.5% 12.3% 24.3% CDI 4 CDI 4 Atlas Strategy² Hedge Funds 290.0 0.4% 5.6% 4.0% 14.2% CDI 4 CDI 4 Vinci Total Return Hedge Funds 227.2 (1.8)% 13.9% 7.9% 18.9% IPCA 6 + Yield IMA - B 7 IPCA 6 + Yield IMA - B 7 Mosaico Strategy Public Equities 809.3 (0.8)% 10.5% 3.7% (0.0)% IBOV 5 IBOV 5 Vinci Gas Dividendos FIA Public Equities 493.9 (1.2)% 5.9% 4.5% 11.0% IBOV 5 IBOV 5 Vinci Valorem FIM IP&S 1,591.5 1.0% 9.0% 10.7% 20.1% IMA - B 5 7 IMA - B 5 7 Equilibrio Strategy³ IP&S 2,604.3 1.3% 8.8% 10.4% 18.8% IPCA 6 - Vinci Retorno Real FIM IP&S 191.8 (1.8)% 8.5% 9.5% 22.0% IMA - B 7 IMA - B 7 Vinci Crédito Imobiliário I Private Credit 112.6 2.7% 8.7% 12.9% 22.7% IPCA 6 IPCA 6 +7.785% Vinci Crédito Imobiliário II Private Credit 821.6 (0.9)% 10.1% 11.0% 22.8% IPCA 6 IPCA 6 + 6% Vinci Crédito Estruturado Mult . Plus FIC FIM Private Credit 125.7 3.6% 9.1% 12.9% 27.4% CDI 4 CDI 4 Vinci Energia Sustentável Private Credit 586.6 1.5% 10.0% 9.9% 19.7% IPCA 6 IPCA 6 + 6% Vinci Crédito Multiestratégia Private Credit 352.2 2.3% 6.8% 8.7% 23.3% CDI 4 IPCA 6 + 5% VISC11 Real Estate (listed REIT) 2,190.6 1.7% 20.0% 16.7% 37.5% IFIX 8 IPCA 6 + 6% VILG11 Real Estate (listed REIT) 1,595.4 (1.6)% 13.9% 5.2% 19.5% IFIX 8 IPCA 6 + 6% VINO11 Real Estate (listed REIT) 139.5 (7.9)% (5.1)% (7.7)% (15.8)% IFIX 8 IPCA 6 + 6% VIFI11 Real Estate / Private Credit (listed REIT) 67.2 6.4% 30.1% 21.5% 36.9% IFIX 8 IFIX 8 VIUR11 Real Estate (listed REIT) 215.5 (1.2)% 11.2% 11.1% 20.2% IFIX 8 IPCA 6 + 6% VCRI11 Real Estate / Private Credit (listed REIT) 146.9 (1.1)% 3.0% 8.1% 3.9% IFIX 8 IPCA 6 + X 9 % VICA11 Real Estate / Private Credit (REIT) 375.3 0.2% (0.0)% 0.5% 1.5% IFIX 8 CDI 4 + 1% VINCI FOF IMOBILIARIO FIM CP Real Estate (REIT) 59.3 3.1% 16.1% 12.6% 30.2% IFIX 8 IFIX 8 VIGT11 Infrastructure (listed) 654.2 (0.3)% 8.1% 0.9% (2.7)% - - Benchmark 3Q’23 YTD 12 M 24 M IBOV 5 (1.3)% 6.2% 5.9% 5.0% CDI 4 3.2% 9.9% 13.4% 25.8% IMA - B 5 7 1.7% 8.9% 11.6% 22.0% IPCA 6 + Yield IMA - B 7 1.8% 8.2% 11.1% 27.0% IPCA 6 0.6% 3.5% 5.2% 12.7% IFIX 8 2.0% 12.3% 7.6% 18.5%
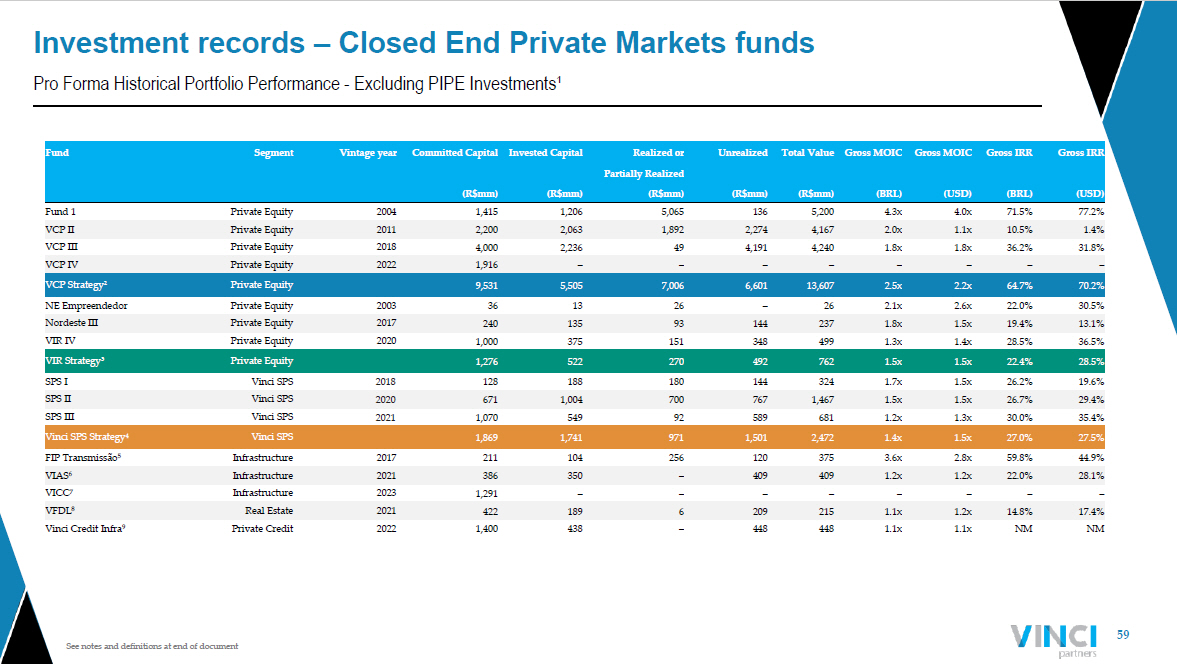
59 See notes and definitions at end of document Pro Forma Historical Portfolio Performance - Excluding PIPE Investments¹ Investment records – Closed End Private Markets funds Fund Segment Vintage year Committed Capital Invested Capital Realized or Unrealized Total Value Gross MOIC Gross MOIC Gross IRR Gross IRR Partially Realized (R$mm) (R$mm) (R$mm) (R$mm) (R$mm) (BRL) (USD) (BRL) (USD) Fund 1 Private Equity 2004 1,415 1,206 5,065 136 5,200 4.3x 4.0x 71.5% 77.2% VCP II Private Equity 2011 2,200 2,063 1,892 2,274 4,167 2.0x 1.1x 10.5% 1.4% VCP III Private Equity 2018 4,000 2,236 49 4,191 4,240 1.8x 1.8x 36.2% 31.8% VCP IV Private Equity 2022 1,916 – – – – – – – – VCP Strategy² Private Equity 9,531 5,505 7,006 6,601 13,607 2.5x 2.2x 64.7% 70.2% NE Empreendedor Private Equity 2003 36 13 26 – 26 2.1x 2.6x 22.0% 30.5% Nordeste III Private Equity 2017 240 135 93 144 237 1.8x 1.5x 19.4% 13.1% VIR IV Private Equity 2020 1,000 375 151 348 499 1.3x 1.4x 28.5% 36.5% VIR Strategy³ Private Equity 1,276 522 270 492 762 1.5x 1.5x 22.4% 28.5% SPS I Vinci SPS 2018 128 188 180 144 324 1.7x 1.5x 26.2% 19.6% SPS II Vinci SPS 2020 671 1,004 700 767 1,467 1.5x 1.5x 26.7% 29.4% SPS III Vinci SPS 2021 1,070 549 92 589 681 1.2x 1.3x 30.0% 35.4% Vinci SPS Strategy 4 Vinci SPS 1,869 1,741 971 1,501 2,472 1.4x 1.5x 27.0% 27.5% FIP Transmissão 5 Infrastructure 2017 211 104 256 120 375 3.6x 2.8x 59.8% 44.9% VIAS 6 Infrastructure 2021 386 350 – 409 409 1.2x 1.2x 22.0% 28.1% VICC 7 Infrastructure 2023 1,291 – – – – – – – – VFDL 8 Real Estate 2021 422 189 6 209 215 1.1x 1.2x 14.8% 17.4% Vinci Credit Infra 9 Private Credit 2022 1,400 438 – 448 448 1.1x 1.1x NM NM
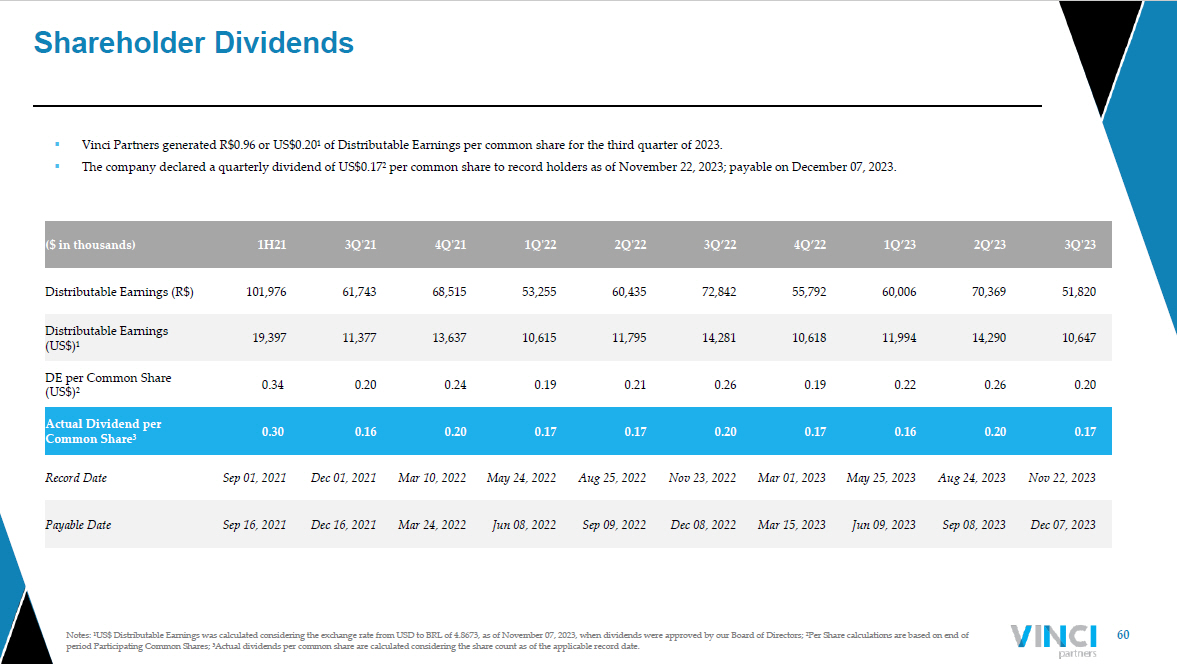
60 Notes: ¹US$ Distributable Earnings was calculated considering the exchange rate from USD to BRL of 4.8673, as of November 07, 20 23, when dividends were approved by our Board of Directors; ²Per Share calculations are based on end of period Participating Common Shares; ³Actual dividends per common share are calculated considering the share count as of the a ppl icable record date. Shareholder Dividends ($ in thousands) 1H21 3Q ' 21 4Q'21 1Q'22 2Q'22 3Q’22 4Q’22 1Q’23 2Q’23 3Q'23 Distributable Earnings (R$) 101,976 61,743 68,515 53,255 60,435 72,842 55,792 60,006 70,369 51,820 Distributable Earnings (US$)¹ 19,397 11,377 13,637 10,615 11,795 14,281 10,618 11,994 14,290 10,647 DE per Common Share (US$)² 0.34 0.20 0.24 0.19 0.21 0.26 0.19 0.22 0.26 0.20 Actual Dividend per Common Share³ 0.30 0.16 0.20 0.17 0.17 0.20 0.17 0.16 0.20 0.17 Record Date Sep 01, 2021 Dec 01, 2021 Mar 10, 2022 May 24, 2022 Aug 25, 2022 Nov 23, 2022 Mar 01, 2023 May 25, 2023 Aug 24, 2023 Nov 22, 2023 Payable Date Sep 16, 2021 Dec 16, 2021 Mar 24, 2022 Jun 08, 2022 Sep 09, 2022 Dec 08, 2022 Mar 15, 2023 Jun 09, 2023 Sep 08, 2023 Dec 07, 2023 ▪ Vinci Partners generated R$0.96 or US$0.20¹ of Distributable Earnings per common share for the third quarter of 2023. ▪ The company declared a quarterly dividend of US$0.17² per common share to record holders as of November 22, 2023; payable on Dec ember 07 , 2023.
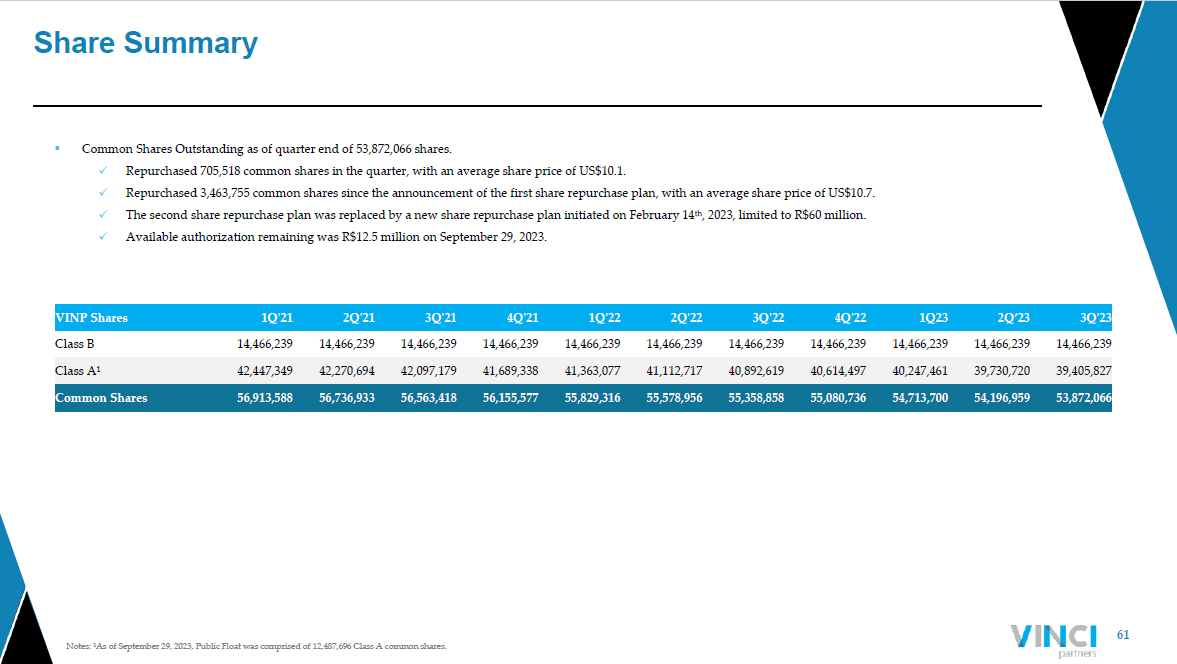
61 Notes: ¹As of September 29, 2023, Public Float was comprised of 12,487,696 Class A common shares. Share Summary ▪ Common Shares Outstanding as of quarter end of 53,872,066 shares. x Repurchased 705,518 common shares in the quarter, with an average share price of US$10.1. x Repurchased 3,463,755 common shares since the announcement of the first share repurchase plan, with an average share price of US $10.7. x The second share repurchase plan was replaced by a new share repurchase plan initiated on February 14 th , 2023, limited to R$60 million. x Available authorization remaining was R$12.5 million on September 29, 2023. VINP Shares 1Q ' 21 2Q ' 21 3Q ' 21 4Q'21 1Q'22 2Q'22 3Q'22 4Q'22 1Q23 2Q’23 3Q'23 Class B 14,466,239 14,466,239 14,466,239 14,466,239 14,466,239 14,466,239 14,466,239 14,466,239 14,466,239 14,466,239 14,466,239 Class A¹ 42,447,349 42,270,694 42,097,179 41,689,338 41,363,077 41,112,717 40,892,619 40,614,497 40,247,461 39,730,720 39,405,827 Common Shares 56,913,588 56,736,933 56,563,418 56,155,577 55,829,316 55,578,956 55,358,858 55,080,736 54,713,700 54,196,959 53,872,066
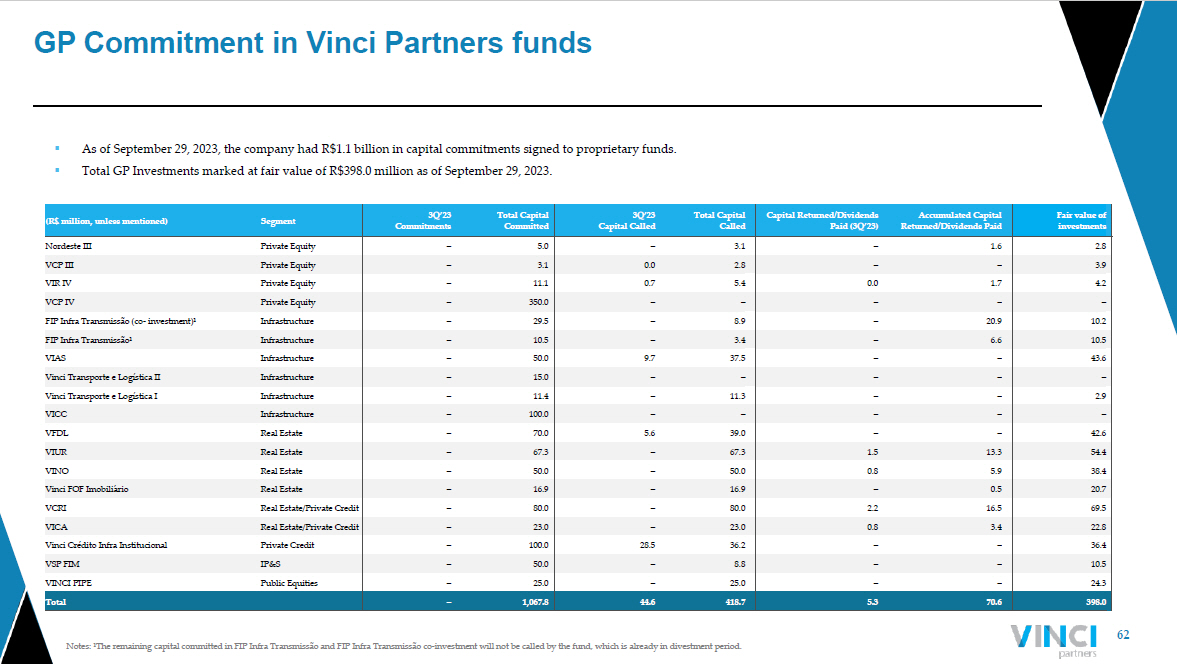
62 Notes: ¹The remaining capital committed in FIP Infra Transmissão and FIP Infra Transmissão co - investment will not be called by the fund, which is already in divestment period. GP Commitment in Vinci Partners funds (R$ million, unless mentioned) Segment 3Q’23 Commitments Total Capital Committed 3Q’23 Capital Called Total Capital Called Capital Returned/Dividends Paid (3Q’23) Accumulated Capital Returned/Dividends Paid Fair value of investments Nordeste III Private Equity – 5.0 – 3.1 – 1.6 2.8 VCP III Private Equity – 3.1 0.0 2.8 – – 3.9 VIR IV Private Equity – 11.1 0.7 5.4 0.0 1.7 4.2 VCP IV Private Equity – 350.0 – – – – – FIP Infra Transmissão ( co - investment)¹ Infrastructure – 29.5 – 8.9 – 20.9 10.2 FIP Infra Transmissão¹ Infrastructure – 10.5 – 3.4 – 6.6 10.5 VIAS Infrastructure – 50.0 9.7 37.5 – – 43.6 Vinci Transporte e Logística II Infrastructure – 15.0 – – – – – Vinci Transporte e Logística I Infrastructure – 11.4 – 11.3 – – 2.9 VICC Infrastructure – 100.0 – – – – – VFDL Real Estate – 70.0 5.6 39.0 – – 42.6 VIUR Real Estate – 67.3 – 67.3 1.5 13.3 54.4 VINO Real Estate – 50.0 – 50.0 0.8 5.9 38.4 Vinci FOF Imobiliário Real Estate – 16.9 – 16.9 – 0.5 20.7 VCRI Real Estate/Private Credit – 80.0 – 80.0 2.2 16.5 69.5 VICA Real Estate/Private Credit – 23.0 – 23.0 0.8 3.4 22.8 Vinci Crédito Infra Institucional Private Credit – 100.0 28.5 36.2 – – 36.4 VSP FIM IP&S – 50.0 – 8.8 – – 10.5 VINCI PIPE Public Equities – 25.0 – 25.0 – – 24.3 Total – 1,067.8 44.6 418.7 5.3 70.6 398.0 ▪ As of September 29, 2023, the company had R$1.1 billion in capital commitments signed to proprietary funds. ▪ Total GP Investments marked at fair value of R$398.0 million as of September 29, 2023.
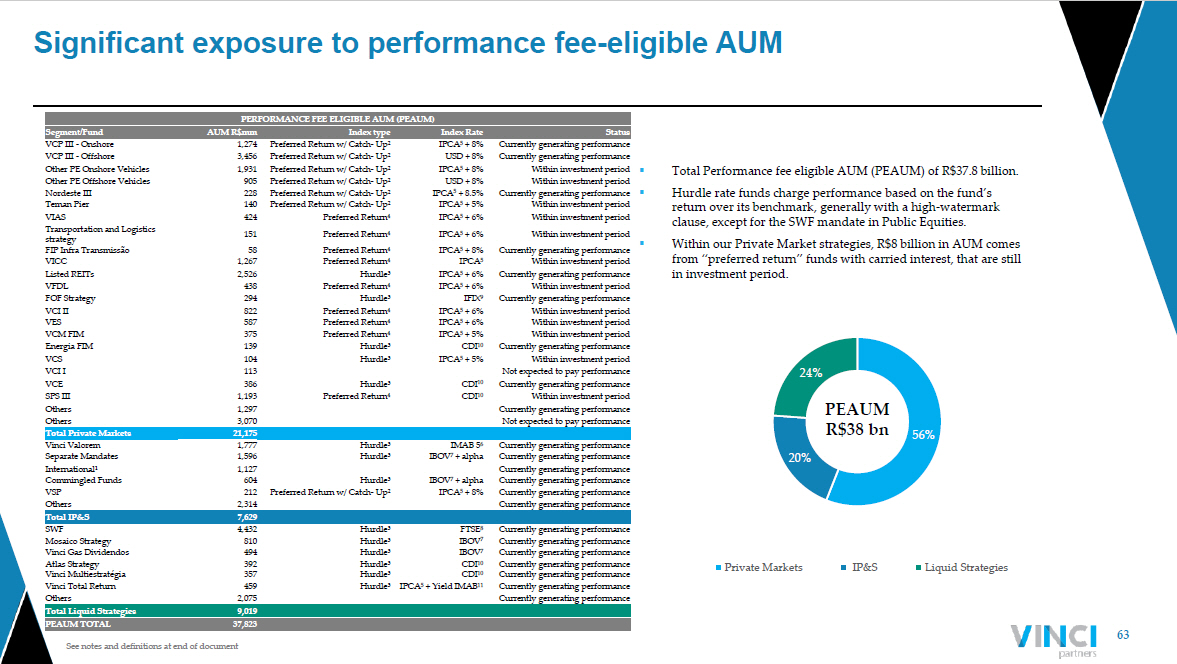
63 See notes and definitions at end of document Significant exposure to performance fee - eligible AUM 56% 20% 24% Private Markets IP&S Liquid Strategies PERFORMANCE FEE ELIGIBLE AUM (PEAUM) Segment/Fund AUM R$mm Index type Index Rate Status VCP III - Onshore 1,274 Preferred Return w/ Catch - Up² IPCA 5 + 8% Currently generating performance VCP III - Offshore 3,456 Preferred Return w/ Catch - Up² USD + 8% Currently generating performance Other PE Onshore Vehicles 1,931 Preferred Return w/ Catch - Up² IPCA 5 + 8% Within investment period Other PE Offshore Vehicles 905 Preferred Return w/ Catch - Up² USD + 8% Within investment period Nordeste III 228 Preferred Return w/ Catch - Up² IPCA 5 + 8.5% Currently generating performance Teman Pier 140 Preferred Return w/ Catch - Up² IPCA 5 + 5% Within investment period VIAS 424 Preferred Return 4 IPCA 5 + 6% Within investment period Transportation and Logistics strategy 151 Preferred Return 4 IPCA 5 + 6% Within investment period FIP Infra Transmissão 58 Preferred Return 4 IPCA 5 + 8% Currently generating performance VICC 1,267 Preferred Return 4 IPCA 5 Within investment period Listed REITs 2,526 Hurdle³ IPCA 5 + 6% Currently generating performance VFDL 438 Preferred Return 4 IPCA 5 + 6% Within investment period FOF Strategy 294 Hurdle³ IFIX 9 Currently generating performance VCI II 822 Preferred Return 4 IPCA 5 + 6% Within investment period VES 587 Preferred Return 4 IPCA 5 + 6% Within investment period VCM FIM 375 Preferred Return 4 IPCA 5 + 5% Within investment period Energia FIM 139 Hurdle³ CDI 10 Currently generating performance VCS 104 Hurdle³ IPCA 5 + 5% Within investment period VCI I 113 Not expected to pay performance VCE 386 Hurdle³ CDI 10 Currently generating performance SPS III 1,193 Preferred Return 4 CDI 10 Within investment period Others 1,297 Currently generating performance Others 3,070 Not expected to pay performance Total Private Markets 21,175 Vinci Valorem 1,777 Hurdle³ IMAB 5 6 Currently generating performance Separate Mandates 1,596 Hurdle³ IBOV 7 + alpha Currently generating performance International¹ 1,127 Currently generating performance Commingled Funds 604 Hurdle³ IBOV 7 + alpha Currently generating performance VSP 212 Preferred Return w/ Catch - Up² IPCA 5 + 8% Currently generating performance Others 2,314 Currently generating performance Total IP&S 7,629 SWF 4,432 Hurdle³ FTSE 8 Currently generating performance Mosaico Strategy 810 Hurdle³ IBOV 7 Currently generating performance Vinci Gas Dividendos 494 Hurdle³ IBOV 7 Currently generating performance Atlas Strategy 392 Hurdle³ CDI 10 Currently generating performance Vinci Multiestratégia 357 Hurdle³ CDI 10 Currently generating performance Vinci Total Return 459 Hurdle³ IPCA 5 + Yield IMAB 11 Currently generating performance Others 2,075 Currently generating performance Total Liquid Strategies 9,019 PEAUM TOTAL 37,823 ▪ Total Performance fee eligible AUM (PEAUM) of R$37.8 billion. ▪ Hurdle rate funds charge performance based on the fund’s return over its benchmark, generally with a high - watermark clause, except for the SWF mandate in Public Equities. ▪ Within our Private Market strategies, R$8 billion in AUM comes from “preferred return” funds with carried interest, that are still in investment period. PEAUM R$38 bn
64 Notes and Definitions Notes to page 22: (1) Accrued performance fees for the VCP offshore are as of 2Q’23. This occurs due to the 60 days timeline of the quarterly m ark up to be disclosed by the fund’s administrator. Notes to page 35: (1) Liquid Strategies are comprised of Public Equities and Hedge Funds. (2) Private Markets are comprised of REITs, Credit rights investment funds and Private Equity (excluding non - discretionary manag ers). (3)Others are comprised of non - discretionary Private Equity managers (80%), ETF (9%), Offshore (9%) and foreign exchange (1%). Notes to page 51: (1) Other items comprise the income/(loss) generated by contingent consideration adjustment and financial expenses related to ac quisitions. (2) Non - operational expenses are comprised of expenses related to professional services rendered in connection with acquisitions and our international corporate organization. (3) Income taxes are comprised of taxes calculated over our corporate income tax and social contribution taxes. We are taxed on an actual taxable profit regime, while part of our subsidiaries are taxed based on deemed profit. (4) Contingent consideration adjustment (after - tax) related to Vinci SPS’ acquisition, reflects the change in the earn out’s fai r value to be paid in 2027. On September 29, 2023, Vinci revaluated the fair value of the obligation based on the economic conditions at the date, resulting in an increase of the contingent conside rat ion fair value. The variation was recognized as a loss in the financial result. Notes to page 58: (1) NAV is the net asset value of each fund. For listed vehicles, the NAV represents the Market valuation of the fund. (2) Atlas strategy includes the funds Atlas FIC FIM and Atlas Institucional FIC FIM. (3) Equilibrio Strategy incudes the IP&S Family of pension plans. (4) CDI is an average of interbank overnight rates in Brazil (daily average for the period). (5) Brazil stock market most relevant index. (6) IPCA is a broad consumer price index measured by the IBGE.
65 Notes and Definitions (7) IMAB is composed by government bonds indexed to IPCA. IMAB 5 also includes government bonds indexed to IPCA with up to 5 Yea rs in duration. (8) IFIX is an index composed by listed REITs in the Brazilian stock Market. (9) If IMAB 5 Average is: i . less or equal to 2%, X=3% per year; ii. between 2% - 4%, X= Average IMAB 5+1% per year; iii. Between 4% - 5%, X=5% per year; IV. g reater or equal to 5%, X= IMAB 5 Average Notes to page 59: (1) Track record information is presented throughout this presentation on a pro forma basis and in local currency, excluding PIP E investments, a strategy that will be discontinued in VCP III. (2) Total commitments for VCP III include R$1.3 billion in co - investments. Track record presented for the VCP strategy as of 1Q’ 23, due to fund’s administrator timeline to disclose the quarterly markup of the fund. (3) Track record for VIR strategy is presented as of 1Q’23, due to fund’s administrator timeline to disclose the quarterly ma rku p of the fund. (4) Track record for Vinci SPS strategy is presented as of 2Q’23. (5) Track record for FIP Infra is presented as of 1Q’23. (6) Track record for VIAS is presented as of 1Q’23. (7) Track record for VICC is presented as of 1Q’23. (8) Track record for VFDL is presented as of 2Q’23. (9) Track record for Vinci Credit Infra is presented as of 2Q’23. Notes to page 63: (1) International mandates have several different benchmarks across its vehicles. (2) The preferred return w/ catch - up rule applies to funds for which the vehicle must pay back its limited partners 100% of the invested capital corrected by the preferred return rate so it can charge performance fees. Once the preferred return rate is achieved, due to the catch - up clause, performance fees are charged ov er the absolute return of the fund instead of the excess return over the preferred rate. (3) Hurdle Rate is the minimum return the fund must achieve before it can charge performance fees. In most cases, funds with hur dle rate also are under a high - water mark clause. (4) Funds with preferred return must return 100% of invested capital corrected by the preferred return rate to its limited pa rtn ers in order to charge performance fees.
66 Notes and Definitions (5) IPCA is a broad consumer price index measured by the IBGE. (6) IMAB 5 is composed by government bonds indexed to IPCA with up to 5 years in duration. (7) IBOV is the Brazilian stock market's most relevant index; (8) FTSE is London's stock market most relevant index. (9) IFIX is an index composed by listed REITs in the Brazilian stock exchange. (10) The CDI rate is a result of the average interbank overnight rates in Brazil (daily average for the period). (11) IMAB is composed by government bonds indexed to IPCA (inflation rate) plus a fixed interest rate.
67 Notes and Definitions ▪ “Fee related earnings”, or “FRE”, is a metric to monitor the baseline performance of, and trends in, our business, in a manne r t hat does not include performance fees or investment income. We calculate FRE as operating profit less (a) net revenue from realized performance fees, less (b) net revenue from unrealize d p erformance fees, plus (c) share - based payments, plus (d) compensation allocated in relation to performance fees, plus (e) non - operational expenses, which are comprised of expenses relat ing to professional services rendered in connection with acquisitions and our international corporate organization. ▪ “FRE Margin” is calculated as FRE over total net management and advisory fees. ▪ “Distributable Earnings”, or “DE”, is used as a reference point by our board of directors for determining the amount of earni ngs available to distribute to shareholders as dividends. Distributable Earnings is calculated as profit for the year, less (a) net revenue from unrealized performance fees, plus (b) inc ome taxes from unrealized performance fees, plus (c) compensation allocated in relation to unrealized performance fees, less (d) unrealized gain from GP investment income, less ( e) unrealized gain from financial income, plus (f) income taxes on unrealized gain from GP investment income, plus (g) income taxes on unrealized gain from financial income. ▪ “DE Margin” is calculated as DE over the sum of management and advisory fee related revenues, realized performance revenue, r eal ized GP investment income and realized financial income, net of revenue tax. ▪ “Performance Related Earnings”, or “PRE”, is a performance measure that we use to assess our ability to generate profits from re venue that relies on outcome from funds above their respective benchmarks. We calculate PRE as operating profit, less (a) net revenue from fund management and advisory, less (b) op erating expenses, such as segment personnel, G&A, corporate center and bonus related to management and advisory. ▪ “Segment Distributable Earnings” is Vinci Partners’ segment profitability measure used to make operating decisions and assess pe rformance across the company’s five segments (Private Markets, Liquid Strategies, Investment Products and Solutions, Retirement Services and Corporate Advisory). Segment Distribut abl e Earnings is calculated as operating profit less (a) net revenue from unrealized performance fees, plus (b) compensation allocated in relation to unrealized performance fees, plus (c ) r ealized gain from GP investment income. ▪ “AUM” refers to assets under management. Our assets under management equal the sum of: (1) the fair market value of the inves tme nts held by funds plus the capital that we are entitled to call from investors in those funds pursuant to the terms of their capital commitments to those funds (plus the fair market va lue of co - investments arranged by us that were made or could be made by limited partners of our corporate private equity funds and portfolio companies of such funds); (2) the net a sse t value of our public equity funds, hedge funds and closed - end mutual funds; and (3) the amount of capital raised for our private credit funds. AUM includes double counting related to fun ds from one segment that invest in funds from another segment. Those cases occur mainly due to (a) fund of funds of investment products and solutions segment, and (b) investment f und s in general that invest part of their cash in private credit segment and hedge fund segment funds in order to maintain liquidity and provide for returns on cash. Such amounts are eli minated on consolidation. The bylaws of the relevant funds prohibit double - charging fees on AUM across segments. Therefore, while our AUM by segment may double - count funds from one segment that invest in funds from another segment, the revenues for any given segment do not include revenue in respect of assets managed by another segment, which mea ns there are no intercompany eliminations on revenues in our results of operations. ▪ Net Cash and Investments include cash and cash equivalents and the fair value of investments in liquid funds and GP Fund Inve stm ents. Cash and cash equivalents include cash, certificate of deposits, which are issued by Banco Bradesco (credit rating AAA evaluated by Fitch Ratings) with interest rates from 99.5% to 101% of CDI.

68 Notes and Definitions (cont’d.) ▪ “Net revenue from Fund Management and Advisory” is a performance measure that we use to assess our ability to generate profit s f rom our fund management and advisory business without measuring for the outcomes from funds above their respective benchmarks. We calculate Net Revenue from Fund Managemen t a nd Advisory as net revenue from services rendered less (a) net revenue from realized performance fees and less (b) net revenue from unrealized performance fees. ▪ “Total compensation and benefits” is the result of the profit sharing paid to our employees as (a) bonus compensation related to management advisory and (b) performance - based compensation. ▪ “Segment personnel expenses” are composed of the salary - part compensation paid to employees and partners of our funds’ managemen t teams. ▪ “Corporate center expenses” are composed by the salary - compensation paid to employees and other general and administrative expen ses related to our support teams, such as research, risk, legal & compliance, investor relations, operations and ESG. ▪ “Other general and administrative expenses” is made up of third - party expenses, depreciation and amortization, travel and repres entation, marketing expenses, administrative fees, non - operating taxes, third - party consultants’ fees, such as legal and accounting, and office consumables. ▪ “GP investment income” is income from proprietary investments made by us in our own Private Markets’ funds, used as GP Commit men ts. ▪ “Financial income” is income generated through the investments made with our cash and cash equivalents in cash and bank depos its , certificate of deposits and proprietary investments in our Liquid Funds from our public equities and hedge funds’ segments and listed REITs from our real estate segment. ▪ “Leasing expenses” include costs from the company’s sub - leasing activities. ▪ “Income taxes” is comprised of taxes on our corporate income tax and social contribution taxes. We are taxed on an actual tax abl e profit regime, while our subsidiaries are taxed based on deemed profit. ▪ “Capital Subscription / (capital return)” represents the net capital commitments and capital returns from our Private Markets ’ c losed end and listed funds. ▪ “Net Inflows / (outflows)” represent the net inflows and outflows from our liquid funds from our liquid strategies, IP&S and pri vate credit segments. ▪ “Appreciation / (depreciation)” represents the net capital appreciation/depreciation from our funds, which refers to the incr eas e or decrease of the funds’ investment’s value. ▪ “MOIC” means multiple on invested capital, a ratio intended to represent how much value an investment has returned, and is ca lcu lated as realized value plus unrealized value, divided by the total amount invested, gross of expenses and fees. ▪ “IRR” means the internal rate of return, which is a discount rate that makes the net present value of all cash flows equal to ze ro in a discounted cash flow analysis.
69 Funds/strategies’ descriptions ▪ Vinci Multiestratégia : The fund seeks to achieve long - term returns by investing in fixed income assets, through strategies that imply interest rates and currency risks. ▪ Vinci Atlas: The fund seeks to achieve long - term returns by investing across all strategies within fixed income, equities, curre ncy, derivatives, commodities and other investment funds with no obligation of any class concentration. ▪ Vinci Mosaico FIA: Public Equities’ long only flagship strategy. The strategy seeks to achieve long - term returns above Brazilian equities market (Ibovespa) based on a fundamental analysis. ▪ Vinci Gas Dividendos : Public Equities’ dividends flagship strategy. The strategy seeks to achieve long - term returns by investing in companies with a consistent history of paying dividends in the Brazilian stock market. ▪ Vinci Total Return: The fund seeks to achieve medium and long - term returns by investing most of its capital in the Brazilian sto ck market, through bottom up and top - down strategies. ▪ Vinci Valorem: IP&S flagship commingled fund with exposure to fixed income assets, foreign exchange currency and derivatives. ▪ Equilibrio Strategy: IP&S family of pension plan funds. The strategy seeks to achieve long - term returns by investing across all strategies within fixed income, equities, currency, derivatives, commodities and other investment funds, respecting limitations in regulation. ▪ Vinci Selection Equities: The fund seeks to beat the Brazilian stock market index by investing in other funds that invest in Bra zilian public equities. ▪ Vinci Crédito Imobiliário I: The fund seeks to achieve long - term returns by investing in real estate mortgage - backed credit security bonds. ▪ Vinci Crédito Estruturado Multiestratégia PLUS FIC FIM: The fund seeks to achieve consistent returns by investing in private structured credit bonds. ▪ VISC11: Shopping malls listed REIT, focused on acquiring income - generating shopping malls in Brazil. ▪ VILG11: Industrial listed REIT focused on acquiring mature income - generating industrial properties in Brazil. ▪ VINO11: Listed REIT focused on acquiring mature income - generating boutique office real estate assets in Brazil. ▪ VIFI11: Listed REIT that invests in other listed REITs and real estate mortgage - backed credit security bonds. ▪ VIUR11: perpetual capital listed REIT, focused on income generation to its quota holders through the acquisition of urban com mer cial properties in Brazil, such as street retail, grocery, healthcare, and educational focused real estate properties. ▪ VCRI11: Listed REIT that aims to invest in MBS, while also being able to invest in listed REITs with similar investment strat egi es. ▪ VICA11: VICA is a perpetual capital fund that shall invest in a diversified credit portfolio within the Agri sector in Brazil . ▪ Vinci FOF Imobiliário : Fund of Funds that invests in other listed REITs, combining income with capital gain.

RIO DE JANEIRO 55 21 2159 6000 Av. Bartolomeu Mitre, 336 Leblon – 22431 - 002 SÃO PAULO 55 11 3572 3700 Av. Brigadeiro Faria Lima, 2.277 - 14º andar Jardim Paulistano – 01452 - 000 RIBEIRÃO PRETO 55 16 2101 4641 Av. Presidente Vargas, 2.121 – Sala 106 Jardim América - 14020 - 260 RECIFE 55 81 3204 6811 Av. República do Líbano, 251 - sala 301 Torre A – Pina – 51110 - 160 NEW YORK 1 646 559 8000 780 Third Avenue, 25 th Floor 10017
Vinci Partners Investments (NASDAQ:VINP)
Historical Stock Chart
From Apr 2024 to May 2024

Vinci Partners Investments (NASDAQ:VINP)
Historical Stock Chart
From May 2023 to May 2024
