UNITED STATES
SECURITIES AND EXCHANGE COMMISSION
Washington, D.C. 20549
FORM N-CSR
CERTIFIED SHAREHOLDER REPORT OF REGISTERED
MANAGEMENT INVESTMENT COMPANIES
Investment Company Act File Number: 811-21948
Cohen & Steers Closed-End Opportunity Fund, Inc.
(Exact name of Registrant as specified
in charter)
1166 Avenue of the Americas, 30th Floor, New York, NY 10036
(Address of principal executive
offices) (Zip code)
Dana A. DeVivo
Cohen & Steers Capital Management, Inc.
1166 Avenue of the Americas, 30th Floor
New York, New York 10036
(Name and address of agent for service)
Registrant’s telephone number, including area code: (212)
832-3232
Date of fiscal year end:
December 31
Date of reporting period: December 31,
2023
Item 1. Reports to Stockholders.
COHEN
& STEERS CLOSED-END OPPORTUNITY FUND, INC.
To Our Shareholders:
We would like to share with you our report for the year ended December 31, 2023. The total returns for Cohen & Steers
Closed-End Opportunity Fund, Inc. (the Fund) and its comparative benchmarks were:
|
|
|
|
|
|
|
|
|
| |
|
Six Months Ended
December 31, 2023 |
|
|
Year Ended
December 31, 2023 |
|
| Cohen & Steers Closed-End Opportunity Fund at Net Asset Value(a) |
|
|
5.46 |
% |
|
|
12.31 |
% |
| Cohen & Steers Closed-End Opportunity Fund at Market Value(a) |
|
|
9.57 |
% |
|
|
18.15 |
% |
| S-Network All Taxable ex-Foreign Plus Capped Municipal CEF Index(b) |
|
|
4.10 |
% |
|
|
10.65 |
% |
| S&P 500
Index(b) |
|
|
8.04 |
% |
|
|
26.29 |
% |
The performance data quoted represent past performance. Past performance is no guarantee of
future results. The investment return and the principal value of an investment will fluctuate and shares, if sold, may be worth more or less than their original cost. Current performance may be lower or higher than the performance data quoted.
Current total returns of the Fund can be obtained by visiting our website at cohenandsteers.com. The Fund’s returns assume the reinvestment of all dividends and distributions at prices obtained under the Fund’s dividend reinvestment plan.
Net asset value (NAV) returns reflect fee waivers and/or expense reimbursements, without which the returns would be lower. Index performance does not reflect the deduction of any fees, taxes or expenses. An investor cannot invest directly in an
index. Performance figures for periods shorter than one year are not annualized.
Managed Distribution Policy
The Fund, acting in accordance with an exemptive order received from the U.S. Securities and Exchange Commission (SEC) and with
approval of its Board of Directors (the Board), adopted a managed distribution policy under which the Fund intends to include long-term capital gains, where applicable, as part of the regular monthly cash distributions to its shareholders (the
Plan). The Plan gives the Fund greater flexibility to realize long-term capital gains and to distribute those gains on a regular monthly basis. In accordance with the Plan, the Fund currently distributes $0.087 per share on a monthly basis.
The Fund may pay distributions in excess of the Fund’s investment company taxable income and net realized gains.
This excess would be a return of capital distributed from the Fund’s assets. Distributions of capital decrease the Fund’s total assets and, therefore, could have the effect of
| (a) |
As a closed-end investment company, the price of the
Fund’s exchange-traded shares will be set by market forces and can deviate from the net asset value (NAV) per share of the Fund. |
| (b) |
The S-Network All Taxable ex-Foreign plus Capped Municipal CEF Index is a market
capitalization-weighted index comprising all taxable closed-end funds and diversified municipal bond funds, except for single-country funds and region-specific equity funds. The index reconstitutes and rebalances quarterly. The S&P 500
Index is an unmanaged index of 500 large-capitalization stocks that is frequently used as a general measure of U.S. stock market performance. |
1
COHEN
& STEERS CLOSED-END OPPORTUNITY FUND, INC.
increasing the Fund’s expense ratio. In addition, in
order to make these distributions, the Fund may have to sell portfolio securities at a less than opportune time.
Shareholders should not draw any conclusions about the Fund’s investment performance from the amount of these distributions or
from the terms of the Fund’s Plan. The Fund’s total return based on NAV is presented in the table above as well as in the Financial Highlights table.
The Plan provides that the Board may amend or terminate the Plan at any time without prior notice to Fund shareholders; however, at
this time, there are no reasonably foreseeable circumstances that might cause the termination. The termination of the Plan could have the effect of creating a trading discount (if the Fund’s stock is trading at or above NAV) or widening an
existing trading discount.
Market Review
Closed-end funds rose in the 12-month period ended December 31, 2023, buoyed by strong returns across most segments of the
underlying capital markets.
Interest rates played an outsized role in influencing asset prices throughout the year,
with the market focused on the potential timing and magnitude of central bank pivots following extensive monetary policy tightening. The U.S. 10-year Treasury yields fell to a year-to-date low of 3.3% during the March banking crisis, then rose
steadily to 5.0% by October, only to fall back below 4.0% by year-end (ending the year where it began). In the fourth quarter, softer-than-expected inflation data in the U.S. and Europe drove increased optimism around a shift in monetary policy,
pushing bond yields sharply lower. Expectations rose that the Federal Reserve and the European Central Bank could begin cutting benchmark lending rates as early as the first half of 2024.
Closed-end funds discounts to net asset value (NAV) widened during the year, moving from –6.0% at the start to –8.3% at
the end of the period.
Within the major asset classes, equity funds traded at an average –8.2% discount to NAV at
the end of the year, compared to –5.4% at the beginning. Municipal bond funds also saw a widening of the average discount from –8.4% to –12.9%. The discount on taxable fixed-income funds ended the year where it began, around
–4.7%, likely kept relatively tight by elevated distribution yields.
The primary market for closed-end funds
remained closed during the period, with little desire for new offerings as investor sentiment favored more seasoned issues.
Fund
Performance
The Fund had a positive total return in the period and outperformed its benchmark on both a market
price and NAV basis. Our fund and sector selection within the equity segment of the portfolio was the primary driver of outperformance. Top level asset allocation was the main detractor as the valuation of taxable fixed income funds held steady
while the equity funds shifted lower.
In a generally risk-on environment, equity closed-end funds returned 11.8% in
market price during the year and 14.1% in NAV. Within this category, U.S. hybrid funds were the top performing sector, followed by global hybrid funds and U.S. general equity funds. The worst performing sectors were the interest-rate sensitive
utilities funds and the healthcare- and biotechnology-dominated sector equity funds.
2
COHEN
& STEERS CLOSED-END OPPORTUNITY FUND, INC.
Fund selection and our overweight position
within U.S. general equity funds was our top contributor to relative performance, followed by an underweight to utilities funds, which meaningfully lagged other groups. An overweight and favorable selection in global hybrid funds further aided
relative performance. Our underweight investment in option income funds was a significant detractor from relative performance. The Fund’s selection and underweight within global equity funds was also a drag on relative performance. An
overweight in diversified commodity funds further hindered relative returns. However, the negative effect was partially offset by favorable selection in the category.
Within the taxable fixed income groups, interest rates were the decisive variable throughout the year. Preferred funds, which are
the most interest rate sensitive within taxable fixed income, underperformed. The Fund’s selection in preferreds detracted from relative performance but the effect was largely offset by a favorable underweight in the sector. Bank loans, which
have nearly zero duration, outperformed. However, as rates came down in the fourth quarter some of that relative performance reversed. Our fund selection and overweight position in bank loan funds aided performance. An underweight in the
well-performing U.S. high yield bond funds additionally detracted from performance.
Municipal bond funds had a modest
gain in market price during the period but were up more in NAV terms. While our fund selection within this group was a positive contributor, it was more than offset by our underweight allocation in the sector.
Sincerely,
|
|
|
|

|
|

|
| DOUGLAS R. BOND |
|
JEFFREY PALMA |
| Portfolio Manager |
|
Portfolio Manager |
The views and opinions in the preceding commentary are subject to change without notice and are
as of the date of the report. There is no guarantee that any market forecast set forth in the commentary will be realized. This material represents an assessment of the market environment at a specific point in time, should not be relied upon as
investment advice and is not intended to predict or depict performance of any investment.
Visit Cohen & Steers online at cohenandsteers.com
For more information about the Cohen & Steers family of mutual funds, visit cohenandsteers.com. Here you will
find fund net asset values, fund fact sheets and portfolio highlights, as well as educational resources and timely market updates.
Our website also provides comprehensive information about Cohen & Steers, including our
most recent press releases, profiles of our senior investment professionals and their investment approach to each asset class. The Cohen & Steers family of mutual funds specializes in liquid real assets, including real estate securities, listed
infrastructure and natural resource equities, as well as preferred securities and other income solutions.
3
COHEN
& STEERS CLOSED-END OPPORTUNITY FUND, INC.
Performance Review (Unaudited)
Growth of a $10,000 Investment

Average Annual Total Returns—For Periods Ended December 31, 2023
|
|
|
|
|
|
|
|
|
|
|
|
|
|
|
|
|
| |
|
1 Year |
|
|
5 Years |
|
|
10 Years |
|
|
Since Inception(c) |
|
|
Fund at NAV |
|
|
12.31 |
% |
|
|
7.43 |
% |
|
|
6.12 |
% |
|
|
5.38 |
% |
|
Fund at Market Value |
|
|
18.15 |
% |
|
|
9.36 |
% |
|
|
7.69 |
% |
|
|
5.39 |
% |
The performance data quoted represent past performance. Past performance is no guarantee of future results. The
investment return and principal value of an investment will fluctuate and shares, if redeemed, may be worth more or less than their original cost. Current performance may be lower or higher than the performance data quoted. Performance information
current to the most recent month end can be obtained by visiting our website at cohenandsteers.com. Total return assumes the reinvestment of all dividends and distributions at prices obtained under the Fund’s dividend reinvestment plan. NAV
returns reflect fee waivers and/or expense reimbursements, without which the returns would be lower. The performance graph and table do not reflect the deduction of taxes that a shareholder would pay on Fund distributions or the sale of Fund shares.
4
COHEN
& STEERS CLOSED-END OPPORTUNITY FUND, INC.
Performance Review (Unaudited)—(Continued)
| (a) |
The comparative indexes are not adjusted to reflect expenses or other fees that the U.S. Securities
and Exchange Commission (SEC) requires to be reflected in the Fund’s performance. Index performance does not reflect the deduction of any fees, taxes or expenses. An investor cannot invest directly in an index. The Fund’s performance
assumes dividends and distributions are reinvested at prices obtained under the Fund’s dividend reinvestment plan. |
| (b) |
The Linked Index is represented by the performance of the Morningstar US All Taxable Ex-Foreign Equity Index through July 31, 2019 and the S-Network All Taxable ex-Foreign plus Capped Municipal CEF Index thereafter.
The Morningstar US All Taxable Ex-Foreign Equity Index measures the market-capitalization-weighted total return of taxable equity and fixed income closed-end funds; it
excludes international, regional, and country closed-end funds. The S-Network All Taxable ex-Foreign plus Capped Municipal CEF
Index is a market capitalization weighted index comprising all taxable closed-end funds and diversified municipal bond funds, except for single-country funds and region-specific equity funds. The index
reconstitutes and rebalances quarterly. |
| (c) |
Commencement of investment operations is November 24, 2006. |
5
COHEN
& STEERS CLOSED-END OPPORTUNITY FUND, INC.
December 31, 2023
Top Ten Holdings(a)
(Unaudited)
|
|
|
|
|
|
|
|
|
| Security |
|
Value |
|
|
% of
Net
Assets |
|
|
|
|
| Adams Diversified Equity Fund, Inc. |
|
$ |
18,702,964 |
|
|
|
6.3 |
|
| PIMCO Energy & Tactical Credit Opportunities Fund |
|
|
16,182,743 |
|
|
|
5.4 |
|
| PIMCO Dynamic Income Fund |
|
|
11,008,394 |
|
|
|
3.7 |
|
| BlackRock ESG Capital Allocation Trust |
|
|
10,402,076 |
|
|
|
3.5 |
|
| PIMCO Dynamic Income Opportunities Fund |
|
|
9,155,006 |
|
|
|
3.1 |
|
| Sprott Physical Gold & Silver Trust (Canada) |
|
|
8,665,317 |
|
|
|
2.9 |
|
| Gabelli Dividend & Income Trust |
|
|
8,545,333 |
|
|
|
2.9 |
|
| Guggenheim Active Allocation Fund |
|
|
8,492,538 |
|
|
|
2.9 |
|
| Sprott Physical Gold Trust |
|
|
7,919,679 |
|
|
|
2.7 |
|
| BlackRock Capital Allocation Trust |
|
|
7,319,026 |
|
|
|
2.5 |
|
| (a) |
Top ten holdings (excluding short-term investments) are determined on the basis of the value of
individual securities held. The Fund may also hold positions in other securities issued by the companies listed above. See the Schedule of Investments for additional details on such other positions. |
Sector Breakdown
(Based on Net Assets)
(Unaudited)
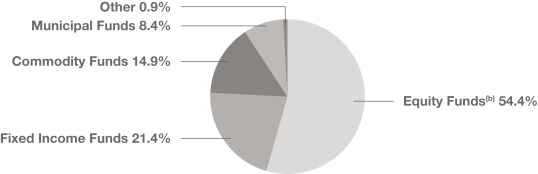
| (b) |
Includes a holding in Common Stock. |
6
COHEN
& STEERS CLOSED-END OPPORTUNITY FUND, INC.
SCHEDULE OF INVESTMENTS
December 31, 2023
|
|
|
|
|
|
|
|
|
|
|
|
|
| |
|
|
|
|
Shares |
|
|
Value |
|
| CLOSED-END
FUNDS |
|
|
86.0% |
|
|
|
|
|
|
|
|
|
| COMMODITY FUNDS |
|
|
13.1% |
|
|
|
|
|
|
|
|
|
| DIVERSIFIED COMMODITY
FUNDS |
|
|
6.8% |
|
|
|
|
|
|
|
|
|
| Adams Natural Resources Fund, Inc. |
|
|
|
155,985 |
|
|
$ |
3,217,971 |
|
| BlackRock Energy & Resources Trust |
|
|
|
69,780 |
|
|
|
868,761 |
|
| PIMCO Energy & Tactical Credit Opportunities Fund |
|
|
|
790,173 |
|
|
|
16,182,743 |
|
|
|
|
|
|
|
|
|
|
|
|
|
|
|
|
|
|
|
|
|
|
20,269,475 |
|
|
|
|
|
|
|
|
|
|
|
|
|
|
| SINGLE COMMODITY FUNDS |
|
|
6.3% |
|
|
|
|
|
|
|
|
|
| Sprott Physical Gold Trust (Canada)(a) |
|
|
|
497,155 |
|
|
|
7,919,679 |
|
| Sprott Physical Silver Trust (Canada)(a) |
|
|
|
250,145 |
|
|
|
2,021,172 |
|
| Sprott Physical Gold & Silver Trust (Canada)(a) |
|
|
|
452,497 |
|
|
|
8,665,317 |
|
|
|
|
|
|
|
|
|
|
|
|
|
|
|
|
|
|
|
|
|
|
|
|
|
18,606,168 |
|
|
|
|
|
|
|
|
|
|
|
|
|
|
| TOTAL COMMODITY
FUNDS |
|
|
|
|
|
|
|
38,875,643 |
|
|
|
|
|
|
|
|
|
|
|
| EQUITY FUNDS |
|
|
43.5% |
|
|
|
|
|
|
|
|
|
| GLOBAL EQUITY FUNDS |
|
|
1.2% |
|
|
|
|
|
|
|
|
|
| Aberdeen Total Dynamic Dividend Fund |
|
|
|
434,976 |
|
|
|
3,505,907 |
|
|
|
|
|
|
|
|
|
|
|
| GLOBAL HYBRID FUNDS |
|
|
10.6% |
|
|
|
|
|
|
|
|
|
| BlackRock Capital Allocation Trust |
|
|
|
489,567 |
|
|
|
7,319,026 |
|
| BlackRock ESG Capital Allocation Trust |
|
|
|
644,890 |
|
|
|
10,402,076 |
|
| Calamos Long/Short Equity & Dynamic Income Trust |
|
|
|
99,000 |
|
|
|
1,430,550 |
|
| Guggenheim Active Allocation Fund |
|
|
|
579,300 |
|
|
|
8,492,538 |
|
| LMP Capital & Income Fund, Inc. |
|
|
|
80,000 |
|
|
|
1,120,800 |
|
| Thornburg Income Builder Opportunities Trust |
|
|
|
171,235 |
|
|
|
2,655,855 |
|
|
|
|
|
|
|
|
|
|
|
|
|
|
|
|
|
|
|
|
|
|
31,420,845 |
|
|
|
|
|
|
|
|
|
|
|
|
|
|
| MLP FUNDS |
|
|
4.4% |
|
|
|
|
|
|
|
|
|
| First Trust Energy Infrastructure Fund |
|
|
|
212,260 |
|
|
|
3,493,799 |
|
| First Trust Energy Income & Growth Fund |
|
|
|
253,925 |
|
|
|
3,676,834 |
|
| First Trust MLP & Energy Income Fund |
|
|
|
428,575 |
|
|
|
3,672,888 |
|
| First Trust New Opportunities MLP & Energy Fund |
|
|
|
328,800 |
|
|
|
2,262,144 |
|
| Neuberger Berman Energy Infrastructure & Income
Fund, Inc. |
|
|
|
19,450 |
|
|
|
133,816 |
|
|
|
|
|
|
|
|
|
|
|
|
|
|
|
|
|
|
|
|
|
|
13,239,481 |
|
|
|
|
|
|
|
|
|
|
|
|
|
|
| OPTION INCOME FUNDS |
|
|
5.2% |
|
|
|
|
|
|
|
|
|
| Eaton Vance Enhanced Equity Income Fund II |
|
|
|
87,016 |
|
|
|
1,628,940 |
|
| Eaton Vance Risk-Managed Diversified Equity Income Fund |
|
|
|
362,446 |
|
|
|
2,841,577 |
|
| Eaton Vance Tax-Managed Buy-Write Income Fund |
|
|
|
65,000 |
|
|
|
843,700 |
|
See accompanying notes to financial statements.
7
COHEN
& STEERS CLOSED-END OPPORTUNITY FUND, INC.
SCHEDULE OF INVESTMENTS—(Continued)
December 31, 2023
|
|
|
|
|
|
|
|
|
|
|
|
|
| |
|
|
|
|
Shares |
|
|
Value |
|
| Eaton Vance Tax-Managed Buy-Write Opportunities Fund |
|
|
|
114,431 |
|
|
$
|
1,410,934 |
|
| Eaton Vance Tax-Managed
Diversified Equity Income Fund |
|
|
|
205,617 |
|
|
|
2,506,471 |
|
| Eaton Vance Tax-Managed Global
Diversified Equity Income Fund |
|
|
|
809,977 |
|
|
|
6,253,022 |
|
|
|
|
|
|
|
|
|
|
|
|
|
|
|
|
|
|
|
|
|
|
15,484,644 |
|
|
|
|
|
|
|
|
|
|
|
|
|
|
| REAL ESTATE, INCLUDING
REIT FUNDS |
|
|
0.9% |
|
|
|
|
|
|
|
|
|
| Nuveen Real Estate Income Fund |
|
|
|
90,300 |
|
|
|
706,146 |
|
| Nuveen Real Asset Income & Growth Fund |
|
|
|
180,558 |
|
|
|
2,116,140 |
|
|
|
|
|
|
|
|
|
|
|
|
|
|
|
|
|
|
|
|
|
|
2,822,286 |
|
|
|
|
|
|
|
|
|
|
|
|
|
|
| US GENERAL EQUITY FUNDS |
|
|
18.9% |
|
|
|
|
|
|
|
|
|
| Adams Diversified Equity Fund, Inc. |
|
|
|
1,056,068 |
|
|
|
18,702,964 |
|
| Cornerstone Strategic Value Fund, Inc. |
|
|
|
190,000 |
|
|
|
1,366,100 |
|
| Eaton Vance Tax-Advantaged
Dividend Income Fund |
|
|
|
168,033 |
|
|
|
3,738,734 |
|
| Eaton Vance Tax-Advantaged Global
Dividend Income Fund |
|
|
|
137,868 |
|
|
|
2,357,543 |
|
| Gabelli Equity Trust, Inc. |
|
|
|
503,640 |
|
|
|
2,558,491 |
|
| Gabelli Dividend & Income Trust |
|
|
|
394,886 |
|
|
|
8,545,333 |
|
| General American Investors Co., Inc. |
|
|
|
141,476 |
|
|
|
6,076,394 |
|
| Nuveen Core Equity Alpha Fund |
|
|
|
184,885 |
|
|
|
2,505,192 |
|
| Royce Value Trust, Inc. |
|
|
|
211,821 |
|
|
|
3,084,114 |
|
| Royce Micro-Cap Trust,
Inc. |
|
|
|
50,884 |
|
|
|
470,168 |
|
| SRH Total Return Fund, Inc. |
|
|
|
486,158 |
|
|
|
6,743,012 |
|
|
|
|
|
|
|
|
|
|
|
|
|
|
|
|
|
|
|
|
|
|
56,148,045 |
|
|
|
|
|
|
|
|
|
|
|
|
|
|
| US HYBRID FUNDS |
|
|
0.4% |
|
|
|
|
|
|
|
|
|
| Virtus Equity & Convertible Income Fund |
|
|
|
56,127 |
|
|
|
1,173,616 |
|
|
|
|
|
|
|
|
|
|
|
| US SECTOR EQUITY FUNDS |
|
|
0.5% |
|
|
|
|
|
|
|
|
|
| Tekla Healthcare Investors |
|
|
|
60,573 |
|
|
|
1,003,695 |
|
| Tekla Healthcare Opportunities Fund |
|
|
|
22,845 |
|
|
|
413,723 |
|
| Tekla Life Sciences Investors |
|
|
|
9,340 |
|
|
|
125,716 |
|
|
|
|
|
|
|
|
|
|
|
|
|
|
|
|
|
|
|
|
|
|
1,543,134 |
|
|
|
|
|
|
|
|
|
|
|
|
|
|
| UTILITIES FUNDS |
|
|
1.4% |
|
|
|
|
|
|
|
|
|
| DNP Select Income Fund, Inc. |
|
|
|
36,894 |
|
|
|
312,861 |
|
| Duff & Phelps Utility & Infrastructure Fund,
Inc. |
|
|
|
193,271 |
|
|
|
1,772,295 |
|
| MainStay CBRE Global Infrastructure Megatrends Fund |
|
|
|
159,391 |
|
|
|
2,068,895 |
|
|
|
|
|
|
|
|
|
|
|
|
|
|
|
|
|
|
|
|
|
|
4,154,051 |
|
|
|
|
|
|
|
|
|
|
|
|
|
|
| TOTAL EQUITY
FUNDS |
|
|
|
|
|
|
|
129,492,009 |
|
|
|
|
|
|
|
|
|
|
|
See accompanying notes to financial statements.
8
COHEN
& STEERS CLOSED-END OPPORTUNITY FUND, INC.
SCHEDULE OF INVESTMENTS—(Continued)
December 31, 2023
|
|
|
|
|
|
|
|
|
|
|
|
|
| |
|
|
|
|
Shares |
|
|
Value |
|
| FIXED INCOME FUNDS |
|
|
21.0% |
|
|
|
|
|
|
|
|
|
| BANK LOAN FUNDS |
|
|
3.4% |
|
|
|
|
|
|
|
|
|
| Ares Dynamic Credit Allocation Fund, Inc. |
|
|
|
134,481 |
|
|
$
|
1,849,114 |
|
| BlackRock Floating Rate Income Trust |
|
|
|
108,470 |
|
|
|
1,342,859 |
|
| Blackstone Long-Short Credit Income Fund |
|
|
|
164,996 |
|
|
|
1,889,204 |
|
| Eaton Vance Floating-Rate Income Trust |
|
|
|
96,240 |
|
|
|
1,207,812 |
|
| Eaton Vance Senior Floating-Rate Trust |
|
|
|
208,258 |
|
|
|
2,636,546 |
|
| Invesco Senior Income Trust |
|
|
|
315,861 |
|
|
|
1,295,030 |
|
|
|
|
|
|
|
|
|
|
|
|
|
|
|
|
|
|
|
|
|
|
10,220,565 |
|
|
|
|
|
|
|
|
|
|
|
|
|
|
| GLOBAL INCOME FUNDS |
|
|
10.3% |
|
|
|
|
|
|
|
|
|
| MFS Multimarket Income Trust |
|
|
|
219,209 |
|
|
|
997,401 |
|
| PIMCO Access Income Fund |
|
|
|
507,500 |
|
|
|
7,257,250 |
|
| PIMCO Dynamic Income Fund |
|
|
|
613,281 |
|
|
|
11,008,394 |
|
| PIMCO Dynamic Income Opportunities Fund |
|
|
|
747,958 |
|
|
|
9,155,006 |
|
| Western Asset Diversified Income Fund |
|
|
|
164,090 |
|
|
|
2,313,669 |
|
|
|
|
|
|
|
|
|
|
|
|
|
|
|
|
|
|
|
|
|
|
30,731,720 |
|
|
|
|
|
|
|
|
|
|
|
|
|
|
| HIGH YIELD BOND
FUNDS |
|
|
1.0% |
|
|
|
|
|
|
|
|
|
| Barings Global Short Duration High Yield Fund,
Class SH |
|
|
|
91,674 |
|
|
|
1,232,098 |
|
| PGIM Global High Yield Fund, Inc. |
|
|
|
149,752 |
|
|
|
1,701,183 |
|
|
|
|
|
|
|
|
|
|
|
|
|
|
|
|
|
|
|
|
|
|
2,933,281 |
|
|
|
|
|
|
|
|
|
|
|
|
|
|
| PREFERRED STOCK FUNDS |
|
|
2.8% |
|
|
|
|
|
|
|
|
|
| First Trust Intermediate Duration Preferred & Income
Fund |
|
|
|
55,821 |
|
|
|
910,441 |
|
| Flaherty & Crumrine Preferred & Income Securities
Fund, Inc. |
|
|
|
114,755 |
|
|
|
1,595,094 |
|
| Flaherty & Crumrine Dynamic Preferred & Income Fund,
Inc. |
|
|
|
54,100 |
|
|
|
960,275 |
|
| John Hancock Premium Dividend Fund |
|
|
|
241,061 |
|
|
|
2,567,300 |
|
| Nuveen Preferred & Income Opportunities Fund |
|
|
|
350,490 |
|
|
|
2,369,312 |
|
|
|
|
|
|
|
|
|
|
|
|
|
|
|
|
|
|
|
|
|
|
8,402,422 |
|
|
|
|
|
|
|
|
|
|
|
|
|
|
| US HIGH YIELD BOND
FUNDS |
|
|
1.8% |
|
|
|
|
|
|
|
|
|
| Allspring Income Opportunities |
|
|
|
153,646 |
|
|
|
1,001,772 |
|
| BlackRock Debt Strategies Fund, Inc. |
|
|
|
85,664 |
|
|
|
924,315 |
|
| PGIM High Yield Bond Fund, Inc. |
|
|
|
130,895 |
|
|
|
1,612,626 |
|
| PGIM Short Duration High Yield Opportunities Fund,
Class Y |
|
|
|
114,450 |
|
|
|
1,716,750 |
|
|
|
|
|
|
|
|
|
|
|
|
|
|
|
|
|
|
|
|
|
|
5,255,463 |
|
|
|
|
|
|
|
|
|
|
|
|
|
|
| US MULTI SECTOR BOND
FUNDS |
|
|
1.7% |
|
|
|
|
|
|
|
|
|
| Guggenheim Strategic Opportunities Fund |
|
|
|
394,765 |
|
|
|
5,052,992 |
|
|
|
|
|
|
|
|
|
|
|
| TOTAL FIXED INCOME
FUNDS |
|
|
|
|
|
|
|
62,596,443 |
|
|
|
|
|
|
|
|
|
|
|
See accompanying notes to financial statements.
9
COHEN
& STEERS CLOSED-END OPPORTUNITY FUND, INC.
SCHEDULE OF INVESTMENTS—(Continued)
December 31, 2023
|
|
|
|
|
|
|
|
|
|
|
|
|
| |
|
|
|
|
Shares |
|
|
Value |
|
| MUNICIPAL FUNDS |
|
|
8.4% |
|
|
|
|
|
|
|
|
|
| DIVERSIFIED MUNICIPAL BOND
FUNDS |
|
|
6.4% |
|
|
|
|
|
|
|
|
|
| BlackRock Municipal Income Fund, Inc. |
|
|
|
20,000 |
|
|
$
|
232,800 |
|
| BlackRock MuniHoldings Fund, Inc. |
|
|
|
35,447 |
|
|
|
422,174 |
|
| BlackRock MuniVest Fund, Inc. |
|
|
|
213,438 |
|
|
|
1,519,678 |
|
| BlackRock MuniYield Fund, Inc. |
|
|
|
78,315 |
|
|
|
844,236 |
|
| BlackRock MuniYield Quality Fund II, Inc. |
|
|
|
17,896 |
|
|
|
185,224 |
|
| BlackRock MuniYield Quality Fund III, Inc. |
|
|
|
176,757 |
|
|
|
2,057,451 |
|
| BlackRock MuniYield Quality Fund, Inc. |
|
|
|
92,385 |
|
|
|
1,126,173 |
|
| Eaton Vance Municipal Bond Fund |
|
|
|
49,605 |
|
|
|
502,499 |
|
| Eaton Vance Municipal Income 2028 Term Trust |
|
|
|
30,008 |
|
|
|
520,339 |
|
| Neuberger Berman Municipal Fund, Inc. |
|
|
|
216,982 |
|
|
|
2,245,764 |
|
| Nuveen AMT-Free Quality Municipal
Income Fund |
|
|
|
224,711 |
|
|
|
2,471,821 |
|
| Nuveen Municipal Value Fund, Inc. |
|
|
|
437,880 |
|
|
|
3,765,768 |
|
| Nuveen Quality Municipal Income Fund |
|
|
|
213,123 |
|
|
|
2,440,258 |
|
| PIMCO Municipal Income Fund II |
|
|
|
20,000 |
|
|
|
166,000 |
|
| PIMCO Municipal Income Fund III |
|
|
|
50,000 |
|
|
|
369,500 |
|
| Putnam Municipal Opportunities Trust |
|
|
|
27,923 |
|
|
|
285,652 |
|
|
|
|
|
|
|
|
|
|
|
|
|
|
|
|
|
|
|
|
|
|
19,155,337 |
|
|
|
|
|
|
|
|
|
|
|
|
|
|
| HIGH YIELD MUNICIPAL BOND
FUNDS |
|
|
2.0% |
|
|
|
|
|
|
|
|
|
| Nuveen AMT-Free Municipal Credit
Income Fund |
|
|
|
207,778 |
|
|
|
2,455,936 |
|
| Nuveen Municipal Credit Income Fund |
|
|
|
258,060 |
|
|
|
3,050,269 |
|
| Nuveen Municipal Credit Opportunities Fund |
|
|
|
30,000 |
|
|
|
299,100 |
|
| Nuveen Municipal High Income Opportunity Fund |
|
|
|
20,000 |
|
|
|
197,600 |
|
|
|
|
|
|
|
|
|
|
|
|
|
|
|
|
|
|
|
|
|
|
6,002,905 |
|
|
|
|
|
|
|
|
|
|
|
|
|
|
| TOTAL MUNICIPAL
FUNDS |
|
|
|
|
|
|
|
25,158,242 |
|
|
|
|
|
|
|
|
|
|
|
| TOTAL
CLOSED-END FUNDS
(Identified cost—$258,527,361) |
|
|
|
|
|
|
|
256,122,337 |
|
|
|
|
|
|
|
|
|
|
|
| EXCHANGE-TRADED FUNDS |
|
|
11.5% |
|
|
|
|
|
|
|
|
|
| COMMODITY FUNDS—SINGLE
COMMODITY FUNDS |
|
|
1.8% |
|
|
|
|
|
|
|
|
|
| iShares Silver
Trust(a) |
|
|
|
10,000 |
|
|
|
217,800 |
|
| SPDR Gold
Shares(a) |
|
|
|
27,675 |
|
|
|
5,290,630 |
|
|
|
|
|
|
|
|
|
|
|
|
|
|
|
|
|
|
|
|
|
|
5,508,430 |
|
|
|
|
|
|
|
|
|
|
|
|
|
|
| EQUITY FUNDS |
|
|
9.7% |
|
|
|
|
|
|
|
|
|
| REAL ESTATE INCLUDING REIT
FUNDS |
|
|
0.4% |
|
|
|
|
|
|
|
|
|
| Vanguard Real Estate ETF |
|
|
|
14,303 |
|
|
|
1,263,813 |
|
|
|
|
|
|
|
|
|
|
|
See accompanying notes to financial statements.
10
COHEN
& STEERS CLOSED-END OPPORTUNITY FUND, INC.
SCHEDULE OF INVESTMENTS—(Continued)
December 31, 2023
|
|
|
|
|
|
|
|
|
|
|
|
|
| |
|
|
|
|
Shares |
|
|
Value |
|
| US GENERAL EQUITY FUNDS |
|
|
9.2% |
|
|
|
|
|
|
|
|
|
| Invesco S&P 500 Equal Weight Consumer Discretionary
ETF |
|
|
|
63,926 |
|
|
$
|
3,039,681 |
|
| Invesco S&P 500 Equal Weight ETF |
|
|
|
39,223 |
|
|
|
6,189,389 |
|
| iShares Russell 1000 Value ETF |
|
|
|
16,719 |
|
|
|
2,762,815 |
|
| iShares Russell 2000 ETF |
|
|
|
7,967 |
|
|
|
1,599,057 |
|
| iShares Russell 2000 Value ETF |
|
|
|
6,900 |
|
|
|
1,071,777 |
|
| Pacer U.S. Cash Cows 100 ETF |
|
|
|
58,609 |
|
|
|
3,047,082 |
|
| SPDR S&P 500 ETF Trust |
|
|
|
8,047 |
|
|
|
3,824,819 |
|
| Vanguard S&P 500 ETF |
|
|
|
13,132 |
|
|
|
5,736,058 |
|
|
|
|
|
|
|
|
|
|
|
|
|
|
|
|
|
|
|
|
|
|
27,270,678 |
|
|
|
|
|
|
|
|
|
|
|
|
|
|
| US SECTOR EQUITY FUNDS |
|
|
0.1% |
|
|
|
|
|
|
|
|
|
| VanEck Pharmaceutical ETF |
|
|
|
4,248 |
|
|
|
345,644 |
|
|
|
|
|
|
|
|
|
|
|
| TOTAL EQUITY
FUNDS |
|
|
|
|
|
|
|
28,880,135 |
|
|
|
|
|
|
|
|
|
|
|
| TOTAL EXCHANGE-TRADED
FUNDS
(Identified cost—$29,911,570) |
|
|
|
|
|
|
|
34,388,565 |
|
|
|
|
|
|
|
|
|
|
|
| COMMON STOCK |
|
|
1.2% |
|
|
|
|
|
|
|
|
|
| Berkshire Hathaway, Inc., Class B(a) |
|
|
|
10,507 |
|
|
|
3,747,426 |
|
|
|
|
|
|
|
|
|
|
|
| TOTAL COMMON STOCK
(Identified cost—$2,844,238) |
|
|
|
|
|
|
|
3,747,426 |
|
|
|
|
|
|
|
|
|
|
|
| INTERVAL FUNDS—FIXED
INCOME FUNDS—BANK LOAN FUNDS |
|
|
0.4% |
|
|
|
|
|
|
|
|
|
| Invesco Dynamic Credit Opportunity Fund, Class AX(b) |
|
|
|
98,235 |
|
|
|
1,098,268 |
|
|
|
|
|
|
|
|
|
|
|
|
|
|
| TOTAL INTERVAL FUNDS
(Identified cost—$1,105,458) |
|
|
|
|
|
|
|
1,098,268 |
|
|
|
|
|
|
|
|
|
|
|
| SHORT-TERM INVESTMENTS |
|
|
0.6% |
|
|
|
|
|
|
|
|
|
| MONEY MARKET FUNDS |
|
|
|
|
|
|
|
|
|
|
|
|
| State Street Institutional Treasury Plus Money Market Fund, Premier Class,
5.31%(c) |
|
|
|
12,343 |
|
|
|
12,343 |
|
| State Street Institutional U.S. Government Money Market Fund, Premier
Class, 5.32%(c) |
|
|
|
1,728,000 |
|
|
|
1,728,000 |
|
|
|
|
|
|
|
|
|
|
|
| TOTAL SHORT-TERM
INVESTMENTS
(Identified cost—$1,740,343) |
|
|
|
|
|
|
|
1,740,343 |
|
|
|
|
|
|
|
|
|
|
|
| TOTAL INVESTMENTS IN
SECURITIES
(Identified cost—$294,128,970) |
|
|
99.7% |
|
|
|
|
|
|
|
297,096,939 |
|
| OTHER ASSETS IN EXCESS
OF LIABILITIES |
|
|
0.3 |
|
|
|
|
|
|
|
745,781 |
|
|
|
|
|
|
|
|
|
|
|
|
|
|
| NET ASSETS (Equivalent to $10.82 per share based on
27,535,964 shares of common stock outstanding) |
|
|
100.0% |
|
|
|
|
|
|
$ |
297,842,720 |
|
|
|
|
|
|
|
|
|
|
|
|
|
|
See accompanying notes to
financial statements.
11
COHEN
& STEERS CLOSED-END OPPORTUNITY FUND, INC.
SCHEDULE OF INVESTMENTS—(Continued)
December 31, 2023
Glossary of Portfolio Abbreviations
|
|
|
| ETF |
|
Exchange-Traded Fund |
| MLP |
|
Master Limited Partnership |
| SPDR |
|
Standard & Poor’s Depositary Receipt |
Note: Percentages indicated are based on the net assets of the Fund.
| (a) |
Non-income producing security. |
| (b) |
Investment valued using NAV as the practical expedient and has been excluded from the fair value
hierarchy. The investment fund provides liquidity through quarterly repurchase offers. |
| (c) |
Rate quoted represents the annualized seven-day yield. |
See accompanying notes to financial statements.
12
COHEN
& STEERS CLOSED-END OPPORTUNITY FUND, INC.
STATEMENT OF ASSETS AND LIABILITIES
December 31, 2023
|
|
|
|
|
| ASSETS: |
|
|
|
|
| Investments in securities, at value (Identified
cost—$294,128,970) |
|
$ |
297,096,939 |
|
| Cash |
|
|
64,848 |
|
| Receivable for: |
|
|
|
|
| Dividends |
|
|
787,924 |
|
| Investment securities sold |
|
|
352,770 |
|
| Other assets |
|
|
1,126 |
|
|
|
|
|
|
| Total Assets |
|
|
298,303,607 |
|
|
|
|
|
|
| LIABILITIES: |
|
|
|
|
| Payable for: |
|
|
|
|
| Investment management fees |
|
|
239,344 |
|
| Investment securities purchased |
|
|
221,543 |
|
|
|
|
|
|
| Total Liabilities |
|
|
460,887 |
|
|
|
|
|
|
| NET ASSETS |
|
$ |
297,842,720 |
|
|
|
|
|
|
| NET ASSETS consist of: |
|
|
|
|
| Paid-in capital |
|
$ |
309,071,617 |
|
| Total distributable earnings/(accumulated loss) |
|
|
(11,228,897 |
) |
|
|
|
|
|
|
|
$ |
297,842,720 |
|
|
|
|
|
|
| NET ASSET VALUE PER SHARE: |
|
|
|
|
| ($297,842,720 ÷ 27,535,964 shares outstanding) |
|
$ |
10.82 |
|
|
|
|
|
|
| MARKET PRICE PER SHARE |
|
$ |
11.20 |
|
|
|
|
|
|
| MARKET PRICE PREMIUM (DISCOUNT) TO NET ASSET VALUE PER SHARE |
|
|
3.51 |
% |
|
|
|
|
|
See accompanying notes to
financial statements.
13
COHEN
& STEERS CLOSED-END OPPORTUNITY FUND, INC.
STATEMENT OF OPERATIONS
For the Year Ended December 31, 2023
|
|
|
|
|
| Investment Income: |
|
|
|
|
| Dividend income |
|
$ |
13,418,160 |
|
|
|
|
|
|
| Expenses: |
|
|
|
|
| Investment management fees |
|
|
2,776,068 |
|
| Directors’ fees and expenses |
|
|
11,021 |
|
|
|
|
|
|
| Total Expenses |
|
|
2,787,089 |
|
| Reduction of Expenses (See Note 2) |
|
|
(11,021 |
) |
|
|
|
|
|
| Net Expenses |
|
|
2,776,068 |
|
|
|
|
|
|
| Net Investment Income (Loss) |
|
|
10,642,092 |
|
|
|
|
|
|
| Net Realized and Unrealized Gain (Loss): |
|
|
|
|
| Net realized gain (loss) on: |
|
|
|
|
| Investments in securities |
|
|
(13,592,292 |
) |
| Capital gain distributions from underlying funds |
|
|
4,295,509 |
|
| Foreign currency transactions |
|
|
557 |
|
|
|
|
|
|
| Net realized gain (loss) |
|
|
(9,296,226 |
) |
|
|
|
|
|
| Net change in unrealized appreciation (depreciation) on: |
|
|
|
|
| Investments in securities |
|
|
32,757,794 |
|
| Foreign currency translations |
|
|
113 |
|
|
|
|
|
|
| Net change in unrealized appreciation (depreciation) |
|
|
32,757,907 |
|
|
|
|
|
|
| Net Realized and Unrealized Gain (Loss) |
|
|
23,461,681 |
|
|
|
|
|
|
| Net Increase (Decrease) in Net Assets Resulting from Operations |
|
$ |
34,103,773 |
|
|
|
|
|
|
See accompanying notes to
financial statements.
14
COHEN
& STEERS CLOSED-END OPPORTUNITY FUND, INC.
STATEMENT OF CHANGES IN NET ASSETS
|
|
|
|
|
|
|
|
|
| |
|
For the
Year Ended
December 31, 2023 |
|
|
For the
Year Ended
December 31, 2022 |
|
| Change in Net Assets: |
|
|
|
|
|
|
|
|
| From Operations: |
|
|
|
|
|
|
|
|
| Net investment income (loss) |
|
$ |
10,642,092 |
|
|
$ |
13,223,196 |
|
| Net realized gain (loss) |
|
|
(9,296,226 |
) |
|
|
(2,959,313 |
) |
| Net change in unrealized appreciation (depreciation) |
|
|
32,757,907 |
|
|
|
(79,435,461 |
) |
|
|
|
|
|
|
|
|
|
| Net increase (decrease) in net assets resulting from operations |
|
|
34,103,773 |
|
|
|
(69,171,578 |
) |
|
|
|
|
|
|
|
|
|
| Distributions to shareholders |
|
|
(11,236,146 |
) |
|
|
(16,633,845 |
) |
| Tax return of capital to shareholders |
|
|
(17,444,776 |
) |
|
|
(11,946,520 |
) |
|
|
|
|
|
|
|
|
|
| Total distributions |
|
|
(28,680,922 |
) |
|
|
(28,580,365 |
) |
|
|
|
|
|
|
|
|
|
| Capital Stock Transactions: |
|
|
|
|
|
|
|
|
| Increase (decrease) in net assets from Fund share transactions |
|
|
1,210,443 |
|
|
|
882,073 |
|
|
|
|
|
|
|
|
|
|
| Total increase (decrease) in net assets |
|
|
6,633,294 |
|
|
|
(96,869,870 |
) |
| Net Assets: |
|
|
|
|
|
|
|
|
| Beginning of year |
|
|
291,209,426 |
|
|
|
388,079,296 |
|
|
|
|
|
|
|
|
|
|
| End of year |
|
$ |
297,842,720 |
|
|
$ |
291,209,426 |
|
|
|
|
|
|
|
|
|
|
See accompanying notes to
financial statements.
15
COHEN
& STEERS CLOSED-END OPPORTUNITY FUND, INC.
FINANCIAL HIGHLIGHTS
The following table includes selected data for a share outstanding throughout each year and other performance information derived
from the financial statements. It should be read in conjunction with the financial statements and notes thereto.
|
|
|
|
|
|
|
|
|
|
|
|
|
|
|
|
|
|
|
|
|
| |
|
For the Year Ended December 31, |
|
| Per Share Operating Data: |
|
2023 |
|
|
2022 |
|
|
2021 |
|
|
2020 |
|
|
2019 |
|
| Net asset value, beginning of year |
|
|
$10.62 |
|
|
|
$14.19 |
|
|
|
$12.82 |
|
|
|
$13.70 |
|
|
|
$11.71 |
|
|
|
|
|
|
|
|
|
|
|
|
|
|
|
|
|
|
|
|
|
|
| Income (loss) from investment operations: |
|
|
|
|
|
|
|
|
|
|
|
|
|
|
|
|
|
|
|
|
|
|
|
|
|
|
| Net investment income
(loss)(a)(b) |
|
|
0.39 |
|
|
|
0.48 |
|
|
|
0.32 |
|
|
|
0.31 |
|
|
|
0.36 |
|
| Net realized and unrealized gain (loss) |
|
|
0.85 |
|
|
|
(3.01 |
) |
|
|
2.09 |
|
|
|
(0.15 |
) |
|
|
2.67 |
|
|
|
|
|
|
|
|
|
|
|
|
|
|
|
|
|
|
|
|
|
|
| Total from investment operations |
|
|
1.24 |
|
|
|
(2.53 |
) |
|
|
2.41 |
|
|
|
0.16 |
|
|
|
3.03 |
|
|
|
|
|
|
|
|
|
|
|
|
|
|
|
|
|
|
|
|
|
|
| Less dividends and distributions to shareholders from: |
|
|
|
|
|
|
|
|
|
|
|
|
|
|
|
|
|
|
|
|
|
|
|
|
|
|
| Net investment income |
|
|
(0.41 |
) |
|
|
(0.49 |
) |
|
|
(0.37 |
) |
|
|
(0.29 |
) |
|
|
(0.45 |
) |
| Net realized gain |
|
|
— |
|
|
|
(0.11 |
) |
|
|
(0.67 |
) |
|
|
— |
|
|
|
(0.08 |
) |
| Tax return of capital |
|
|
(0.63 |
) |
|
|
(0.44 |
) |
|
|
— |
|
|
|
(0.75 |
) |
|
|
(0.51 |
) |
|
|
|
|
|
|
|
|
|
|
|
|
|
|
|
|
|
|
|
|
|
| Total dividends and distributions to shareholders |
|
|
(1.04 |
) |
|
|
(1.04 |
) |
|
|
(1.04 |
) |
|
|
(1.04 |
) |
|
|
(1.04 |
) |
|
|
|
|
|
|
|
|
|
|
|
|
|
|
|
|
|
|
|
|
|
| Net increase (decrease) in net asset value |
|
|
0.20 |
|
|
|
(3.57 |
) |
|
|
1.37 |
|
|
|
(0.88 |
) |
|
|
1.99 |
|
|
|
|
|
|
|
|
|
|
|
|
|
|
|
|
|
|
|
|
|
|
| Net asset value, end of year |
|
|
$10.82 |
|
|
|
$10.62 |
|
|
|
$14.19 |
|
|
|
$12.82 |
|
|
|
$13.70 |
|
|
|
|
|
|
|
|
|
|
|
|
|
|
|
|
|
|
|
|
|
|
| Market value, end of year |
|
|
$11.20 |
|
|
|
$10.45 |
|
|
|
$14.78 |
|
|
|
$12.42 |
|
|
|
$13.42 |
|
|
|
|
|
|
|
|
|
|
|
|
|
|
|
|
|
|
|
|
|
|
|
|
|
|
|
|
| |
|
|
|
|
|
|
|
|
|
|
|
|
|
|
|
|
|
|
|
|
| Total net asset value
return(c) |
|
|
12.31 |
% |
|
|
–18.08 |
% |
|
|
19.38 |
% |
|
|
2.69 |
% |
|
|
26.89 |
% |
|
|
|
|
|
|
|
|
|
|
|
|
|
|
|
|
|
|
|
|
|
| Total market value
return(c) |
|
|
18.15 |
% |
|
|
–22.61 |
% |
|
|
28.35 |
% |
|
|
1.56 |
% |
|
|
31.25 |
% |
|
|
|
|
|
|
|
|
|
|
|
|
|
|
|
|
|
|
|
|
|
|
|
|
|
|
|
| |
|
|
|
|
|
|
|
|
|
|
|
|
|
|
|
|
|
|
|
|
| Ratios/Supplemental Data: |
|
|
|
|
|
|
|
|
|
|
|
|
|
|
|
|
|
|
|
|
|
|
|
|
|
|
| Net assets, end of year (in millions) |
|
|
$297.8 |
|
|
|
$291.2 |
|
|
|
$388.1 |
|
|
|
$349.1 |
|
|
|
$373.0 |
|
|
|
|
|
|
|
|
|
|
|
|
|
|
|
|
|
|
|
|
|
|
| Ratios to average daily net assets: |
|
|
|
|
|
|
|
|
|
|
|
|
|
|
|
|
|
|
|
|
|
|
|
|
|
|
| Expenses (before expense
reduction)(d) |
|
|
0.95 |
% |
|
|
0.95 |
% |
|
|
0.95 |
% |
|
|
0.96 |
% |
|
|
0.96 |
% |
|
|
|
|
|
|
|
|
|
|
|
|
|
|
|
|
|
|
|
|
|
| Expenses (net of expense
reduction)(d) |
|
|
0.95 |
% |
|
|
0.95 |
% |
|
|
0.95 |
% |
|
|
0.95 |
% |
|
|
0.95 |
% |
|
|
|
|
|
|
|
|
|
|
|
|
|
|
|
|
|
|
|
|
|
| Net investment income (loss) (before expense reduction)(b)(d) |
|
|
3.64 |
% |
|
|
4.09 |
% |
|
|
2.31 |
% |
|
|
2.63 |
% |
|
|
2.76 |
% |
|
|
|
|
|
|
|
|
|
|
|
|
|
|
|
|
|
|
|
|
|
| Net investment income (loss) (net of expense reduction)(b)(d) |
|
|
3.64 |
% |
|
|
4.09 |
% |
|
|
2.31 |
% |
|
|
2.64 |
% |
|
|
2.77 |
% |
|
|
|
|
|
|
|
|
|
|
|
|
|
|
|
|
|
|
|
|
|
| Portfolio turnover rate |
|
|
36 |
% |
|
|
52 |
% |
|
|
60 |
% |
|
|
54 |
% |
|
|
53 |
% |
|
|
|
|
|
|
|
|
|
|
|
|
|
|
|
|
|
|
|
|
|
| (a) |
Calculation based on average shares outstanding. |
| (b) |
Net investment income (loss) is affected by the timing of distributions of the underlying funds in
which the Fund invests. |
| (c) |
Total net asset value return measures the change in net asset value per share over the year
indicated. Total market value return is computed based upon the Fund’s market price per share and excludes the effects of brokerage commissions. Dividends and distributions are assumed, for purposes of these calculations, to be reinvested at
prices obtained under the Fund’s dividend reinvestment plan. |
| (d) |
Does not include expenses incurred by the underlying funds in which the Fund invests.
|
See accompanying notes to
financial statements.
16
COHEN
& STEERS CLOSED-END OPPORTUNITY FUND, INC.
NOTES TO FINANCIAL STATEMENTS
Note 1. Organization and Significant Accounting Policies
Cohen & Steers Closed-End Opportunity Fund, Inc. (the Fund) was incorporated
under the laws of the State of Maryland on September 14, 2006 and is registered under the Investment Company Act of 1940 (the 1940 Act) as a diversified, closed-end management investment company. The
Fund’s investment objective is to achieve total return, consisting of high current income and potential capital appreciation.
The following is a summary of significant accounting policies consistently followed by the Fund in the preparation of its financial statements. The Fund is an investment company and, accordingly, follows the investment company
accounting and reporting guidance of the Financial Accounting Standards Board Accounting Standards Codification (ASC) Topic 946—Investment Companies. The accounting policies of the Fund are in conformity with accounting principles
generally accepted in the United States of America (GAAP). The preparation of the financial statements in accordance with GAAP requires management to make estimates and assumptions that affect the reported amounts of assets and liabilities at the
date of the financial statements and the reported amounts of income and expenses during the reporting period. Actual results could differ from those estimates.
Portfolio Valuation: Investments in securities that are listed on the New York Stock Exchange (NYSE) are valued, except as
indicated below, at the last sale price reflected at the close of the NYSE on the business day as of which such value is being determined. If there has been no sale on such day, the securities are valued at the mean of the closing bid and ask prices
on such day or, if no ask price is available, at the bid price.
Securities not listed on the NYSE but listed on other
domestic or foreign securities exchanges (including NASDAQ) are valued in a similar manner. Securities traded on more than one securities exchange are valued at the last sale price reflected at the close of the exchange representing the principal
market for such securities on the business day as of which such value is being determined. If after the close of a foreign market, but prior to the close of business on the day the securities are being valued, market conditions change significantly,
certain non-U.S. equity holdings may be fair valued pursuant to procedures established by the Board of Directors.
Readily marketable securities traded in the OTC market, including listed securities whose primary market is believed by
Cohen & Steers Capital Management, Inc. (the investment manager) to be OTC, are valued on the basis of prices provided by a third-party pricing service or third-party broker-dealers when such prices are believed by the investment manager,
pursuant to delegation by the Board of Directors, to reflect the fair value of such securities.
Short-term debt
securities with a maturity date of 60 days or less are valued at amortized cost, which approximates fair value. Investments in open-end mutual funds and closed-end
interval funds are valued at net asset value (NAV).
The Board of Directors has designated the investment manager as the
Fund’s “Valuation Designee” under Rule 2a-5 under the 1940 Act. As Valuation Designee, the investment manager is authorized to make fair valuation determinations, subject to the oversight of the
Board of Directors. The investment manager has established a valuation committee (Valuation Committee) to administer, implement and oversee the fair valuation process according to the policies and procedures approved
17
COHEN
& STEERS CLOSED-END OPPORTUNITY FUND, INC.
NOTES TO FINANCIAL
STATEMENTS—(Continued)
annually by the Board of Directors.
Among other things, these procedures allow the Fund to utilize independent pricing services, quotations from securities and financial instrument dealers and other market sources to determine fair value.
Securities for which market prices are unavailable, or securities for which the investment manager determines that the bid and/or
ask price or a counterparty valuation does not reflect market value, will be valued at fair value, as determined in good faith by the Valuation Committee, pursuant to procedures approved by the Fund’s Board of Directors. Circumstances in which
market prices may be unavailable include, but are not limited to, when trading in a security is suspended, the exchange on which the security is traded is subject to an unscheduled close or disruption or material events occur after the close of the
exchange on which the security is principally traded. In these circumstances, the Fund determines fair value in a manner that fairly reflects the market value of the security on the valuation date based on consideration of any information or factors
it deems appropriate. These may include, but are not limited to, recent transactions in comparable securities, information relating to the specific security and developments in the markets.
Foreign equity fair value pricing procedures utilized by the Fund may cause certain
non-U.S. equity holdings to be fair valued on the basis of fair value factors provided by a pricing service to reflect any significant market movements between the time the Fund values such securities and the
earlier closing of foreign markets.
The Fund’s use of fair value pricing may cause the NAV of Fund shares to
differ from the NAV that would be calculated using market quotations. Fair value pricing involves subjective judgments and it is possible that the fair value determined for a security may be materially different than the value that could be realized
upon the sale of that security.
Fair value is defined as the price that the Fund would expect to receive upon the sale
of an investment or expect to pay to transfer a liability in an orderly transaction with an independent buyer in the principal market or, in the absence of a principal market, the most advantageous market for the investment or liability. The
hierarchy of inputs that are used in determining the fair value of the Fund’s investments is summarized below.
| |
• |
|
Level 1—quoted prices in active markets for identical investments |
| |
• |
|
Level 2—other significant observable inputs (including quoted prices for similar investments,
interest rates, credit risk, etc.) |
| |
• |
|
Level 3—significant unobservable inputs (including the Fund’s own assumptions in
determining the fair value of investments) |
The inputs or methodology used for valuing investments may
or may not be an indication of the risk associated with those investments. Changes in valuation techniques may result in transfers into or out of an assigned level within the disclosure hierarchy.
18
COHEN
& STEERS CLOSED-END OPPORTUNITY FUND, INC.
NOTES TO FINANCIAL
STATEMENTS—(Continued)
The following is a
summary of the inputs used as of December 31, 2023 in valuing the Fund’s investments carried at value:
|
|
|
|
|
|
|
|
|
|
|
|
|
|
|
|
|
| |
|
Quoted Prices
in Active
Markets for
Identical
Investments
(Level 1) |
|
|
Other
Significant
Observable
Inputs
(Level 2) |
|
|
Significant
Unobservable
Inputs
(Level 3) |
|
|
Total |
|
| Closed-End Funds |
|
$ |
256,122,337 |
|
|
$ |
— |
|
|
$ |
— |
|
|
$ |
256,122,337 |
|
| Exchange-Traded Funds |
|
|
34,388,565 |
|
|
|
— |
|
|
|
— |
|
|
|
34,388,565 |
|
| Common Stock |
|
|
3,747,426 |
|
|
|
— |
|
|
|
— |
|
|
|
3,747,426 |
|
| Short-Term Investments |
|
|
— |
|
|
|
1,740,343 |
|
|
|
— |
|
|
|
1,740,343 |
|
|
|
|
|
|
|
|
|
|
|
|
|
|
|
|
|
|
| Subtotal(a) |
|
|
294,258,328 |
|
|
|
1,740,343 |
|
|
|
— |
|
|
|
295,998,671 |
|
|
|
|
|
|
|
|
|
|
|
|
|
|
|
|
|
|
| Investments Valued at
NAV(b) |
|
|
— |
|
|
|
— |
|
|
|
— |
|
|
|
1,098,268 |
|
|
|
|
|
|
|
|
|
|
|
|
|
|
|
|
|
|
| Total Investments in
Securities(a) |
|
$ |
294,258,328 |
|
|
$ |
1,740,343 |
|
|
$ |
— |
|
|
$ |
297,096,939 |
|
|
|
|
|
|
|
|
|
|
|
|
|
|
|
|
|
|
| (a) |
Portfolio holdings are disclosed individually on the Schedule of Investments.
|
| (b) |
As of December 31, 2023, one of the Fund’s investments was valued using NAV per unit as a
practical expedient and has been excluded from the fair value hierarchy. The fair value amount presented in this table is intended to permit reconciliation of the fair value hierarchy to the amounts presented within the Schedule of Investments.
|
Security Transactions and Investment Income: Security transactions are recorded on trade date.
Realized gains and losses on investments sold are recorded on the basis of identified cost. Interest income, which includes the amortization of premiums and accretion of discounts, is recorded on the accrual basis. Dividend income is recorded on the
ex-dividend date, except for certain dividends on foreign securities, which are recorded as soon as the Fund is informed after the ex-dividend date. Distributions from closed-end funds (CEFs) and exchange-traded funds (ETFs) are recorded as ordinary income, net realized capital gain or return of capital based on information reported by the CEFs and ETFs and management’s
estimates of such amounts based on historical information. These estimates are adjusted when the actual source of distributions is disclosed by the CEFs and ETFs and may differ from the estimated amounts.
Foreign Currency Translation: The books and records of the Fund are maintained in U.S. dollars. Investment securities and
other assets and liabilities denominated in foreign currencies are translated into U.S. dollars based upon prevailing exchange rates on the date of valuation. Purchases and sales of investment securities and income and expense items denominated in
foreign currencies are translated into U.S. dollars based upon prevailing exchange rates on the respective dates of such transactions. The Fund does not isolate that portion of the results of operations resulting from fluctuations in foreign
exchange rates on investments from the fluctuations arising from changes in market prices of securities held. Such fluctuations are included with the net realized and unrealized gain or loss on investments.
19
COHEN
& STEERS CLOSED-END OPPORTUNITY FUND, INC.
NOTES TO FINANCIAL
STATEMENTS—(Continued)
Net realized foreign
currency transaction gains or losses arise from sales of foreign currencies, (excluding gains and losses on forward foreign currency exchange contracts, which are presented separately, if any), currency gains or losses realized between the trade and
settlement dates on securities transactions, and the difference between the amounts of dividends, interest, and foreign withholding taxes recorded on the Fund’s books and the U.S. dollar equivalent of the amounts actually received or paid. Net
unrealized foreign currency translation gains and losses arise from changes in the values of assets and liabilities, other than investments in securities, on the date of valuation, resulting from changes in exchange rates. Pursuant to U.S. federal
income tax regulations, certain foreign currency gains/losses included in realized and unrealized gains/losses are included in or are a reduction of ordinary income for federal income tax purposes.
Dividends and Distributions to Shareholders: Dividends from net investment income and capital gain distributions are
determined in accordance with U.S. federal income tax regulations, which may differ from GAAP. Dividends from net investment income, if any, are typically declared quarterly and paid monthly. Net realized capital gains, unless offset by any
available capital loss carryforward, are typically distributed to shareholders at least annually. Dividends and distributions to shareholders are recorded on the ex-dividend date and are automatically
reinvested in full and fractional shares of the Fund in accordance with the Fund’s Reinvestment Plan, unless the shareholder has elected to have them paid in cash.
The Fund has a managed distribution policy in accordance with exemptive relief issued by the U.S. Securities and Exchange
Commission (SEC). The Plan gives the Fund greater flexibility to realize long-term capital gains throughout the year and to distribute those gains on a more regular basis to shareholders. Therefore, regular monthly distributions throughout the year
may include a portion of estimated realized long-term capital gains, along with net investment income, short-term capital gains and return of capital, which is not taxable. In accordance with the Plan, the Fund is required to adhere to certain
conditions in order to distribute long-term capital gains during the year. For the year ended December 31, 2023, the Fund paid distributions from net investment income and tax return of capital.
Distributions Subsequent to December 31, 2023: The following distributions have been declared by the Fund’s Board of
Directors and are payable subsequent to the period end of this report.
|
|
|
|
|
|
|
|
Ex-Date |
|
Record Date |
|
Payable Date |
|
Amount |
| 1/16/24 |
|
1/17/24 |
|
1/31/24 |
|
$0.087 |
| 2/13/24 |
|
2/14/24 |
|
2/29/24 |
|
$0.087 |
| 3/12/24 |
|
3/13/24 |
|
3/28/24 |
|
$0.087 |
Income Taxes: It is the policy of the Fund to continue to qualify as a regulated investment
company (RIC), if such qualification is in the best interest of the shareholders, by complying with the requirements of Subchapter M of the Internal Revenue Code applicable to RICs, and by distributing substantially all of its taxable earnings to
its shareholders. Also, in order to avoid the payment of any federal excise taxes, the Fund will distribute substantially all of its net investment income and net realized gains on a calendar year basis. Accordingly, no provision for federal income
or excise tax is necessary. Management has analyzed the Fund’s tax positions taken on federal and applicable state income tax returns as well as its tax positions in non-U.S. jurisdictions in which it
trades for all open tax
20
COHEN
& STEERS CLOSED-END OPPORTUNITY FUND, INC.
NOTES TO FINANCIAL
STATEMENTS—(Continued)
years and has concluded that as of
December 31, 2023, no additional provisions for income tax are required in the Fund’s financial statements. The Fund’s tax positions for the tax years for which the applicable statutes of limitations have not expired are subject to
examination by the Internal Revenue Service, state departments of revenue and by foreign tax authorities.
Note 2. Investment
Management Fees and Other Transactions with Affiliates
Investment Management Fees: Cohen & Steers
Capital Management, Inc. serves as the Fund’s investment manager pursuant to an investment management agreement (the investment management agreement). Under the terms of the investment management agreement, the investment manager provides the
Fund with day-to-day investment decisions and generally manages the Fund’s investments in accordance with the stated policies of the Fund, subject to the
supervision of the Board of Directors.
For the services provided to the Fund, the investment manager receives a fee,
accrued daily and paid monthly, at the annual rate of 0.95% of the average daily net assets of the Fund.
The investment
manager is also responsible, under the investment management agreement, for the performance of certain administrative functions for the Fund. Additionally, the investment manager pays certain expenses of the Fund, including, but not limited to,
administrative and custody fees, transfer agent fees, professional fees, and reports to shareholders.
The investment
manager has contractually agreed to reimburse the Fund so that its total annual operating expenses (exclusive of brokerage fees and commissions, taxes, and upon approval of the Board of Directors, extraordinary expenses), do not exceed 0.95% of
the Fund’s average daily net assets of the Fund. This commitment is currently expected to remain in place for the life of the Fund, can only be amended or terminated by agreement of the Fund’s Board of Directors and the investment
manager and will terminate automatically in the event of termination of the investment management agreement between the investment manager and the Fund. For the year ended December 31, 2023, fees waived and/or expenses reimbursed totaled $11,021.
Directors’ and Officers’ Fees: Certain directors and officers of the Fund are also directors, officers
and/or employees of the investment manager. The Fund does not pay compensation to directors and officers affiliated with the investment manager except for the Chief Compliance Officer, who received compensation from the investment manager, which was
reimbursed by the Fund, in the amount of $5,043 for the year ended December 31, 2023.
Note 3. Purchases and Sales of Securities
Purchases and sales of securities, excluding short-term investments, for the year ended December 31, 2023, totaled
$105,242,584 and $114,095,334, respectively.
21
COHEN
& STEERS CLOSED-END OPPORTUNITY FUND, INC.
NOTES TO FINANCIAL
STATEMENTS—(Continued)
Note 4. Income Tax Information
The tax character of dividends and distributions paid was as follows:
|
|
|
|
|
|
|
|
|
| |
|
For the Year Ended
December 31, |
|
| |
|
2023 |
|
|
2022 |
|
| Ordinary income |
|
$ |
10,361,775 |
|
|
$ |
12,476,022 |
|
| Tax exempt income |
|
|
874,371 |
|
|
|
1,013,683 |
|
| Long-term capital gain |
|
|
— |
|
|
|
3,144,140 |
|
| Tax return of capital |
|
|
17,444,776 |
|
|
|
11,946,520 |
|
|
|
|
|
|
|
|
|
|
| Total dividends and distributions |
|
$ |
28,680,922 |
|
|
$ |
28,580,365 |
|
|
|
|
|
|
|
|
|
|
As of December 31, 2023, the tax basis components of accumulated earnings, the federal tax cost and
net unrealized appreciation (depreciation) in value of investments held were as follows:
|
|
|
|
|
| Cost of investments in securities for federal income tax purposes |
|
$ |
295,552,944 |
|
|
|
|
|
|
| Gross unrealized appreciation on investments |
|
$ |
18,624,852 |
|
| Gross unrealized depreciation on investments |
|
|
(17,080,857 |
) |
|
|
|
|
|
| Net unrealized appreciation (depreciation) on investments |
|
$ |
1,543,995 |
|
|
|
|
|
|
As of December 31, 2023, the Fund has a net capital loss carryforward of $12,772,892 which may
be used to offset future capital gains. The loss is comprised of a short-term capital loss carryforward of $4,192,782 and a long-term capital loss carryforward of $8,580,110, which under current federal income tax rules, may offset capital gains
recognized in any future period.
As of December 31, 2023, the Fund had temporary book/tax differences primarily
attributable to wash sales on portfolio securities and permanent book/tax differences primarily attributable to prior year adjustments. To reflect reclassifications arising from the permanent differences, paid-in capital was credited $48,450 and
total distributable earnings/(accumulated loss) was charged $48,450. Net assets were not affected by this reclassification.
Note 5. Capital Stock
The Fund is authorized to issue 100 million shares of common stock at a par value of $0.001 per share.
During the year ended December 31, 2023, the Fund issued 113,697 shares of common stock at $1,210,443 for the reinvestment of dividends. During the year ended December 31, 2022, the Fund issued 75,539 shares of common stock at
$882,073 for the reinvestment of dividends.
On December 13, 2022, the Board of Directors approved the continuation of
the delegation of its authority to management to effect repurchases, pursuant to management’s discretion and subject to market conditions and investment considerations, of up to 10% of the Fund’s common shares outstanding (Share Repurchase
Program) as of January 1, 2023 through December 31, 2023.
22
COHEN
& STEERS CLOSED-END OPPORTUNITY FUND, INC.
NOTES TO FINANCIAL
STATEMENTS—(Continued)
During the year
ended December 31, 2023 and the year ended December 31, 2022, the Fund did not effect any repurchases.
On December 12,
2023, the Board of Directors approved the continuation of the Share Repurchase Program, which allows the Fund to repurchase up to 10% of the Fund’s common shares outstanding as of January 1, 2024 through December 31, 2024. There is no assurance
that the Fund will repurchase shares in any particular amounts or at all.
Note 6. Other
In the normal course of business, the Fund enters into contracts that provide general indemnifications. The Fund’s maximum
exposure under these arrangements is dependent on claims that may be made against the Fund in the future and, therefore, cannot be estimated; however, based on experience, the risk of material loss from such claims is considered remote.
Note 7. Subsequent Events
Management has evaluated events and transactions occurring after December 31, 2023 through the date that the financial statements were issued, and has determined that no additional disclosure in the financial statements is
required.
23
COHEN
& STEERS CLOSED-END OPPORTUNITY FUND, INC.
REPORT OF INDEPENDENT REGISTERED PUBLIC
ACCOUNTING FIRM
To the Board of Directors and Shareholders of
Cohen & Steers Closed-End Opportunity Fund, Inc.
Opinion on the Financial Statements
We have audited the accompanying statement of assets and liabilities,
including the schedule of investments, of Cohen & Steers Closed-End Opportunity Fund, Inc. (the “Fund”) as of December 31, 2023, the related statement of operations for the year ended December 31, 2023, the statement of
changes in net assets for each of the two years in the period ended December 31, 2023, including the related notes, and the financial highlights for each of the five years in the period ended December 31, 2023 (collectively referred to as
the “financial statements”). In our opinion, the financial statements present fairly, in all material respects, the financial position of the Fund as of December 31, 2023, the results of its operations for the year then ended, the
changes in its net assets for each of the two years in the period ended December 31, 2023 and the financial highlights for each of the five years in the period ended December 31, 2023 in conformity with accounting principles generally
accepted in the United States of America.
Basis for Opinion
These financial statements are the responsibility of the Fund’s management. Our responsibility is to express an opinion on the Fund’s
financial statements based on our audits. We are a public accounting firm registered with the Public Company Accounting Oversight Board (United States) (PCAOB) and are required to be independent with respect to the Fund in accordance with the U.S.
federal securities laws and the applicable rules and regulations of the Securities and Exchange Commission and the PCAOB.
We conducted
our audits of these financial statements in accordance with the standards of the PCAOB. Those standards require that we plan and perform the audit to obtain reasonable assurance about whether the financial statements are free of material
misstatement, whether due to error or fraud.
Our audits included performing procedures to assess the risks of material misstatement of
the financial statements, whether due to error or fraud, and performing procedures that respond to those risks. Such procedures included examining, on a test basis, evidence regarding the amounts and disclosures in the financial statements. Our
audits also included evaluating the accounting principles used and significant estimates made by management, as well as evaluating the overall presentation of the financial statements. Our procedures included confirmation of securities owned as of
December 31, 2023 by correspondence with the custodian, transfer agents and brokers; when replies were not received from brokers, we performed other auditing procedures. We believe that our audits provide a reasonable basis for our opinion.
/s/PricewaterhouseCoopers LLP
New York, New York
February 27, 2024
We have served as the auditor of one or more investment companies in the Cohen & Steers family of mutual funds since 1991.
24
COHEN
& STEERS CLOSED-END OPPORTUNITY FUND, INC.
(The following pages are unaudited)
TAX INFORMATION—2023
For the calendar year ended December 31, 2023, for individual taxpayers, the Fund designates $3,201,174 as qualified dividend
income eligible for reduced tax rates, tax-exempt income distributions of $874,371 and $109,659 as qualified business income. In addition, for corporate taxpayers, 21.95% of the ordinary dividends paid qualified for the dividends received deduction
(DRD).
REINVESTMENT PLAN
The Fund has a dividend reinvestment plan commonly referred to as an “opt-out” plan (the Reinvestment Plan). Each common
shareholder who participates in the Reinvestment Plan will have all distributions of dividends and capital gains (Dividends) automatically reinvested in additional common shares by Computershare as agent (the Plan Agent). Shareholders who elect not
to participate in the Reinvestment Plan will receive all Dividends in cash paid by check mailed directly to the shareholder of record (or if the shares are held in street or other nominee name, then to the nominee) by the Plan Agent, as dividend
disbursing agent. Shareholders whose common shares are held in the name of a broker or nominee should contact the broker or nominee to determine whether and how they may participate in the Reinvestment Plan.
The Plan Agent serves as agent for the shareholders in administering the Reinvestment Plan. After the Fund declares a Dividend, the
Plan Agent will, as agent for the shareholders, either: (i) receive the cash payment and use it to buy common shares in the open market, on the NYSE or elsewhere, for the participants’ accounts or (ii) distribute newly issued common shares of
the Fund on behalf of the participants.
The Plan Agent will receive cash from the Fund with which to buy common shares
in the open market if, on the Dividend payment date, the NAV per share exceeds the market price per share plus estimated brokerage commissions on that date. The Plan Agent will receive the Dividend in newly issued common shares of the Fund if, on
the Dividend payment date, the market price per share plus estimated brokerage commissions equals or exceeds the NAV per share of the Fund on that date. The number of shares to be issued will be computed at a per share rate equal to the greater of
(i) the NAV or (ii) 95% of the closing market price per share on the payment date.
If the market price per share is
less than the NAV on a Dividend payment date, the Plan Agent will have until the last business day before the next ex-dividend date for the common stock, but in no event more than 30 days after the Dividend payment date (as the case may be, the
Purchase Period), to invest the Dividend amount in shares acquired in open market purchases. If at the close of business on any day during the Purchase Period on which NAV is calculated the NAV equals or is less than the market price per share plus
estimated brokerage commissions, the Plan Agent will cease making open market purchases and the uninvested portion of such Dividends shall be filled through the issuance of new shares of common stock from the Fund at the price set forth in the
immediately preceding paragraph.
Participants in the Reinvestment Plan may withdraw from the Reinvestment Plan upon
notice to the Plan Agent. Such withdrawal will be effective immediately if received not less than ten days prior to a Dividend record date; otherwise, it will be effective for all subsequent Dividends. If any participant elects to have the Plan
Agent sell all or part of his or her shares and remit the proceeds, the Plan Agent is authorized to deduct a $15.00 fee plus $0.10 per share brokerage commissions.
25
COHEN
& STEERS CLOSED-END OPPORTUNITY FUND, INC.
The Plan Agent’s fees for the handling
of reinvestment of Dividends will be paid by the Fund. However, each participant will pay a pro rata share of brokerage commissions incurred with respect to the Plan Agent’s open market purchases in connection with the reinvestment of
Dividends. The automatic reinvestments of Dividends will not relieve participants of any income tax that may be payable or required to be withheld on such Dividends.
The Fund reserves the right to amend or terminate the Reinvestment Plan. All correspondence concerning the Reinvestment Plan should
be directed to the Plan Agent at 800-432-8224.
OTHER INFORMATION
A description of the policies and procedures that the Fund uses to determine how to vote proxies relating to portfolio securities
is available (i) without charge, upon request, by calling 866-227-0757, (ii) on our website at cohenandsteers.com or (iii) on the SEC’s website at http://www.sec.gov. In addition, the Fund’s proxy voting record for the most recent
12-month period ended June 30 is available by August 31 of each year (i) without charge, upon request, by calling 866-227-0757 or (ii) on the SEC’s website at http://www.sec.gov.
Disclosures of the Fund’s complete holdings are required to be made monthly on Form N-PORT, with every third month made
available to the public by the SEC 60 days after the end of the Fund’s fiscal quarter. The Fund’s Form N-PORT, is available (i) without charge, upon request, by calling
866-227-0757 or (ii) on the SEC’s website at http://www.sec.gov.
Please note that distributions paid by the Fund to shareholders are subject to recharacterization for tax purposes and are taxable
up to the amount of the Fund’s investment company taxable income and net realized gains. Distributions in excess of the Fund’s investment company taxable income and net realized gains are a return of capital distributed from the
Fund’s assets. To the extent this occurs, the Fund’s shareholders of record will be notified of the estimated amount of capital returned to shareholders for each such distribution and this information will also be available at
cohenandsteers.com. The final tax treatment of all distributions is reported to shareholders on their 1099-DIV forms, which are mailed after the close of each calendar year. Distributions of capital decrease the Fund’s total assets and,
therefore, could have the effect of increasing the Fund’s expense ratio. In addition, in order to make these distributions, the Fund may have to sell portfolio securities at a less than opportune time.
Notice is hereby given in accordance with Rule 23c-1 under the 1940 Act that the Fund may purchase, from time to time, shares of
its common stock in the open market.
26
COHEN
& STEERS CLOSED-END OPPORTUNITY FUND, INC.
The following information in this annual shareholder
report is a summary of certain information about the Fund. This information may not reflect all of the changes that have occurred since you purchased the Fund.
CURRENT INVESTMENT OBJECTIVES, PRINCIPAL INVESTMENT POLICIES AND PRINCIPAL RISKS OF THE FUND
The information contained herein is provided for informational purposes only and does not constitute a solicitation of an offer to
buy or sell Fund shares.
Investment Objectives
Cohen & Steers Closed-End Opportunity Fund, Inc. (the Fund) is a diversified, closed-end management investment company registered under the Investment Company Act of 1940, as amended (the 1940 Act). The Fund’s investment objective is to achieve total return, consisting of high current
income and potential capital appreciation.
Investment Strategies
The Fund seeks to achieve its objective by investing in the common stock of closed-end
management investment companies (Portfolio Funds) selected by the Fund’s investment manager that invest significantly in equity or income-producing securities. Portfolio Funds generally focus on equity or income-producing securities, sectors or
strategies, such as dividend strategies, covered call option strategies, total return strategies, balanced strategies, general equities (including both dividend and non-dividend paying equities), limited
duration strategies, convertible securities, preferred securities, high yield securities and real estate, energy, utility and other equity or income-oriented strategies. Shares of Portfolio Funds in which the Fund invests will be traded on a
national securities exchange.
Dividend strategies typically focus on investments in dividend-paying equity securities
or equity-related securities, such as common stock, preferred securities, convertible securities and/or warrants. A covered call option strategy is designed to produce income from premiums received from writing (selling) call options on single
securities and/or indices and to offset a portion of a market decline in the underlying securities. Total return strategies typically pursue both income and capital appreciation, and may invest in a wide variety of equity and fixed income securities
and other instruments that vary from fund to fund. A balanced strategy typically invests at least 25% of its assets in fixed income senior securities and at least 25% of its assets in equities. Limited duration strategies typically focus on fixed
income securities of intermediate duration (a measure of the price volatility of a debt instrument as a result of changes in market interest rates, based on the weighted average timing of the instrument’s expected principal and interest
payments), and may include high yield securities, senior loans and mortgage-related securities. Securities and other investments in which Portfolio Funds pursuing these strategies are expected to focus their investments, along with equity,
convertible, preferred and high yield securities and the real estate, energy and utilities sectors, are described with their accompanying risks, under “Principal Risks of the Fund—Portfolio Fund Investment Risk.”
Under normal circumstances, at least 80% of the Fund’s net assets will be invested in common stock issued by Portfolio
Funds. The Fund is not required to invest in Portfolio Funds focusing on U.S. or foreign securities, or equity or fixed income securities, in any specific proportion, and allocation of the
27
COHEN
& STEERS CLOSED-END OPPORTUNITY FUND, INC.
Fund’s portfolio between Portfolio Funds focusing on
U.S. and foreign securities, and between equity and fixed income securities, will vary over time, perhaps significantly. The Fund also has the ability to invest directly in income-producing securities and instruments relating to closed-end funds.
In selecting Portfolio Funds, the investment manager seeks to
identify closed-end funds that meet one or more of the following characteristics:
| |
• |
|
strong fundamentals, including ability to meet current and projected future dividend payments out of
current income or a combination of current income and realized and unrealized gains, and leverage/risk management, as the investment manager believes that a conservative approach to leverage has the potential to help mitigate the effects of changes
in interest rates; |
| |
• |
|
relatively high current income; |
| |
• |
|
share prices at a discount to net asset value; |
| |
• |
|
undervalued funds where recent total return on market price trails recent total return on net asset
value; |
| |
• |
|
well-regarded asset managers with strong track records managing the asset class(es) in which a
Portfolio Fund invests; |
| |
• |
|
diversification of sectors and asset classes among the Portfolio Funds; |
| |
• |
|
market capitalization generally greater than $200 million; and |
| |
• |
|
average daily trading volumes generally greater than $750,000 per day. |
There is no requirement that any Portfolio Fund in the Fund’s portfolio satisfy all the criteria set forth above, and the
investment manager will use its discretion in selecting a portfolio of Portfolio Funds that the investment manager believes will help the Fund achieve its investment objective.
In addition to the criteria set forth above, the investment manager also may invest opportunistically in one or more Portfolio
Funds when the investment manager believes a Portfolio Fund’s shares are not appropriately priced relative to other comparable funds or the Portfolio Fund’s share price does not properly reflect the impact of a corporate event or
conditions in the overall securities markets that the investment manager believes will have a positive influence on the Portfolio Fund’s share price.
The Fund will be limited by provisions of the 1940 Act, that limit the amount the Fund can invest in any one Portfolio Fund to 3%
of the Portfolio Fund’s total outstanding stock. As a result, the Fund may hold a smaller position in a Portfolio Fund than if it were not subject to this restriction. To comply with provisions of the 1940 Act, on any matter upon which
Portfolio Fund stockholders are solicited to vote the investment manager will vote Portfolio Fund shares in the same general proportion as shares held by other stockholders of the Portfolio Fund. The Fund will not invest in any closed-end funds managed by the investment manager.
The Fund may invest in securities
of other closed-end or open-end funds, including exchange traded funds (ETFs), in accordance with Section 12(d)(1) of the 1940 Act and the rules thereunder, or any
exemption granted under the 1940 Act.
The Fund may, but is not required to, use, without limit, various derivatives
transactions to seek to generate return, facilitate portfolio management and mitigate risks. Although the Fund’s investment adviser may seek to use these kinds of transactions to further the Fund’s investment objectives, no assurance can
be given that they will achieve this result. The Fund may enter into (buy or sell)
28
COHEN
& STEERS CLOSED-END OPPORTUNITY FUND, INC.
exchange-listed and over-the-counter put and call options on securities (including securities of investment companies and baskets of securities), indices, and other financial instruments; purchase and sell financial futures
contracts and options thereon; enter into various interest rate transactions, such as swaps, caps, floors or collars or credit transactions; equity index, total return and credit default swaps; forward contracts; and structured investments. In
addition, the Fund may enter into various currency transactions, such as forward currency contracts, currency futures contracts, currency swaps or options on currency or currency futures. The Fund also may purchase and sell derivative instruments
that combine features of these instruments. The Fund may invest in other types of derivatives, structured and similar instruments which are not currently available but which may be developed in the future.
The Fund may buy and sell shares of Portfolio Funds to take advantage of potential short-term trading opportunities, but short-term
trading will not be used as the primary means of achieving the Fund’s investment objective.
Temporary Defensive
Positions. When the investment manager believes that market or general economic conditions justify a temporary defensive position, the Fund may deviate from its investment objectives and invest all or any portion of its assets in investment
grade debt securities. In such a case, the Fund may not pursue or achieve its investment objective.
Principal Risks of the Fund
The Fund is a diversified, closed-end management investment company designed
primarily as a long-term investment and not as a trading vehicle. The Fund is not intended to be a complete investment program and, due to the uncertainty inherent in all investments, there can be no assurance that the Fund will achieve its
investment objective.
Risks of investing in the Fund include risks associated with (1) investments in closed-end funds generally, including both your investment in Common Shares and the Fund’s investment in Portfolio Fund shares; (2) the risks of the Portfolio Funds’ investments; and (3) any
direct investments in income-producing securities and derivative, structured and other instruments related to closed-end funds including derivatives, which are the same risks as described below for Portfolio
Fund investments in such securities and instruments. Since the Fund pursues its investment objective by investing in Portfolio Funds, it is subject to particular risks associated with investing in other
closed-end funds that are separate from risks associated with the investments held by the Portfolio Funds.
Both the Fund, and the Portfolio Funds, have management fees. In addition, the Portfolio Funds typically incur operating expenses
that are borne by their investors, including the Fund. As a result, Fund investors will bear not only the Fund’s management fees and any operating expenses not paid by the investment manager, but also the fees and expenses of the Portfolio
Funds attributable to the Fund’s investments. Investors would bear less expenses if they invested directly in the Portfolio Funds.
Risks of Investing in Closed-End Funds
Market Price Discount from Net Asset Value Risk. Shares of closed-end investment
companies frequently trade at a discount from their net asset value (NAV). This characteristic is a risk separate and distinct from the risk that NAV could decrease as a result of investment activities. Whether investors will realize gains or losses
upon the sale of the shares will depend not upon the Fund’s NAV but entirely upon whether the market price of the shares at the time of sale is above or below the investor’s
29
COHEN
& STEERS CLOSED-END OPPORTUNITY FUND, INC.
purchase price or adjusted basis for the shares. Because the
market price of the shares is determined by factors such as relative supply of and demand for shares in the market, general market and economic conditions, and other factors beyond the control of the Fund, the shares may trade at, above or below
NAV.
Market Risk. Your investment in the Fund represents an indirect investment in the securities owned by the
Fund. The value of these securities, like other investments, may move up or down, sometimes rapidly and unpredictably. The Fund and the Portfolio Funds may utilize leverage, which magnifies this risk. Your shares at any point in time may be worth
less than what you invested, even after taking into account the reinvestment of Fund dividends and distributions. See “Leverage Risk” below.
Investment Risk. An investment in the Fund is subject to investment risk, including the possible loss of the entire
principal amount that you invest.
Risks of Investing in Other Investment Companies. Since the Fund concentrates
its assets in closed-end management investment companies, risks of investing in the Fund include the risks associated with the purchased closed-end investment
companies’ portfolio securities, and a shareholder in the Fund will bear not only his or her proportionate share of the Fund’s expenses, but also indirectly the expenses of the Portfolio Funds. Shareholders will therefore be subject to
duplicative expenses to the extent the Fund invests in other investment companies. Risks associated with investments in closed-end funds generally include market risk, leverage risk, risk of market price
discount from NAV, risk of anti-takeover provisions and non-diversification.
To
the extent the Fund invests a portion of its assets in other investment companies, including ETFs and other types of pooled investment funds, those assets will be subject to the risks of the purchased investment fund’s portfolio securities, and
a shareholder in the Fund will bear not only his or her proportionate share of the Fund’s expenses, but also indirectly the expenses of the purchased investment funds. In addition, restrictions under the 1940 Act may limit the Fund’s
ability to invest in other investment companies to the extent desired.
The SEC has adopted Rule 12d1-4 permitting fund of fund arrangements subject to various conditions, and rescinding the present rule and certain exemptive relief previously granted. Once in effect, Rule
12d1-4 may adversely affect the Fund’s ability to invest in other investment companies and could also significantly affect the Fund’s ability to redeem its investments in other investment companies,
making such investments less attractive. The effects of rule and other regulatory changes are not known as of the date of this report, but they could impact the Fund’s ability to achieve its desired investment strategies or cause the Fund to
incur losses, realize taxable gains distributable to shareholders, incur greater or unexpected expenses or experience other adverse consequences.
Manager Risk. The success of the Fund’s strategy is subject to the ability of the investment manager to achieve
the Fund’s investment objective. Similarly, the Fund’s investments in Portfolio Funds is subject to the ability of the Portfolio Funds’ managers to achieve the Portfolio Fund’s investment objectives.
Dividend Risk. Common Shares, as well as shares issued by the Portfolio Funds, do not assure dividend payments.
Dividends are paid only when declared by the Board of Directors of the Fund or the boards of directors of the Portfolio Funds, as the case may be, and the level of dividends may vary over time. If a Portfolio Fund reduces or eliminates the level of
its regular dividends, this may reduce the level of dividends paid by the Fund, and may cause the market prices of the Portfolio Fund’s shares and the Common Shares to fall.
30
COHEN
& STEERS CLOSED-END OPPORTUNITY FUND, INC.
Inflation Risk. Inflation risk
is the risk that the value of assets or income from investments will be worth less in the future as inflation decreases the value of money. As inflation increases, the real value of the Common Shares and shares of Portfolio Funds and distributions
can decline.
Risk of Anti-Takeover Provisions. Certain provisions of the Fund’s Charter and By-Laws could limit the ability of other entities or persons to acquire control of the Fund or change the Fund’s structure. The provisions may have the effect of depriving common stockholders of an opportunity
to sell their shares at a premium over prevailing market prices or have the effect of inhibiting conversion of the Fund to an open-end fund. Portfolio Funds also may have similar provisions in their
organizational documents, which would have a similar effect on the Fund’s investments.
Dilution
Risk. Strategies may be employed by a Portfolio Fund that, under certain circumstances, have the effect of reducing its share price and the Fund’s proportionate interest. These include rights offerings in which the Fund does not
subscribe. However, the Fund would not subscribe only when the investment manager believes participation is not consistent with pursuing the Fund’s investment objective.
Portfolio Turnover Risk. The Fund may engage in portfolio trading when considered appropriate. There are no limits on
the rate of portfolio turnover. Portfolio Funds also may not be limited in their portfolio trading activity. Higher turnover rates result in correspondingly greater brokerage commissions and other transactional expenses which are borne by the Fund,
directly or through its investment in Portfolio Funds. Higher turnover rates also may be more likely to generate capital gains that must be distributed to Common Shareholders, either as a result of the Fund’s receipt of capital gains from
Portfolio Fund transactions or from the Fund’s trading in Portfolio Funds or other investments.
Derivatives
Transactions Risk. The Fund or certain Portfolio Fund’s may use of derivatives, which presents risks different from, and possibly greater than, the risks associated with investing directly in traditional securities. In certain types of
derivatives transactions the Fund or a Portfolio Fund could lose the entire amount of its investment; in other types of derivatives transactions the potential loss is theoretically unlimited. Although both OTC and exchange-traded derivatives markets
may experience lack of liquidity, OTC non-standardized derivatives transactions are generally less liquid than exchange-traded instruments. In addition, the liquidity of a secondary market in an
exchange-traded derivative contract may be adversely affected by “daily price fluctuation limits” established by the exchanges which once reached, would prevent the liquidation of open positions. If it is not possible to close an open
derivative position entered into by the Fund or a Portfolio Fund, the Fund or the Portfolio Fund may be required to make cash payments of variation (or mark-to-market)
margin and, if the Fund has insufficient cash, it may have to sell portfolio securities to meet variation margin requirements at a time when it may be disadvantageous to do so. The inability to close derivatives transactions positions also could
have an adverse impact on the Fund’s or a Portfolio Fund’s ability to effectively hedge its portfolio. Derivatives transactions entered into to seek to manage the risks of the Fund’s or a Portfolio Fund’s portfolio of securities
may have the effect of limiting gains from otherwise favorable market movements. The use of derivatives transactions may result in losses greater than if they had not been used. The Fund or a Portfolio Fund may enter into swap, cap or other
transactions to attempt to protect itself from increasing interest or dividend expenses resulting from increasing short-term interest rates on any leverage it incurs or increasing interest rates on securities held in its portfolio. A decline in
interest rates may result in a decline in the value of the transaction, which may result in a decline in the NAV of the Fund or a Portfolio Fund. In the event the Fund or a Portfolio Fund enters into forward currency contracts
31
COHEN
& STEERS CLOSED-END OPPORTUNITY FUND, INC.
for hedging purposes, the Fund or the Portfolio Fund will be
subject to currency exchange rates risk. Currency exchange rates may fluctuate significantly over short periods of time and also can be affected unpredictably by intervention of U.S. or foreign governments or central banks, or the failure to
intervene, or by currency controls or political developments in the United States or abroad. Furthermore, the ability to successfully use derivative instruments depends on the ability of the relevant investment manager to predict pertinent market
movements, which cannot be assured. Structured notes and other related instruments carry risks similar to those of more traditional derivatives such as futures, forward and option contracts. However, structured instruments may entail a greater
degree of market risk and volatility than other types of debt obligations. The Fund or a Portfolio Fund will be subject to credit risk with respect to the counterparties to certain derivatives transactions entered into by the Fund or the Portfolio
Fund and may experience losses in the event a counterparty fails to perform its obligations under a derivative contract.
The Investment Manager is registered with the Commodity Futures Trading Commission as a commodity pool operator (“CPO”).
However, with respect to the Fund, the Investment Manager has claimed an exclusion from the definition of the CPO under the Commodity Exchange Act, as amended (the “CEA”). Accordingly, the Investment Manager, with respect to the Fund, is
not subject to registration or regulation as a CPO under the CEA.
Active Management Risk. As an actively managed
portfolio, the value of the Fund’s investments could decline because the financial condition of an issuer may change (due to such factors as management performance, reduced demand or overall market changes), financial markets may fluctuate or
overall prices may decline, or the investment manager’s investment techniques could fail to achieve the Fund’s investment objectives or negatively affect the Fund’s investment performance.
Cyber Security Risk. With the increased use of technologies such as the Internet and the dependence on computer systems to
perform necessary business functions, the Fund and its service providers (including the investment manager) may be susceptible to operational and information security risks resulting from cyber-attacks and/or other technological malfunctions. In
general, cyber-attacks are deliberate, but unintentional events may have similar effects. Cyber-attacks include, among others, stealing or corrupting data maintained online or digitally, preventing legitimate users from accessing information or
services on a website, releasing confidential information without authorization, gaining unauthorized access to digital systems for purposes of misappropriating assets and causing operational disruption. Cyber-attacks may also be carried out in a
manner that does not require gaining unauthorized access, such as causing denial-of-service. Successful cyber-attacks against, or security breakdowns of, the Fund, the
investment manager, or a custodian, transfer agent, or other affiliated or third-party service provider may adversely affect the Fund or its shareholders. For instance, cyber-attacks may interfere with the processing of shareholder transactions,
affect the Fund’s ability to calculate its NAV, cause the release of private shareholder information or confidential Fund information, impede trading, cause reputational damage, and subject the Fund to regulatory fines, penalties or financial
losses, reimbursement or other compensation costs, and additional compliance costs. Furthermore, as a result of breaches in cyber security or other operational and technology disruptions or failures, an exchange or market may close or issue trading
halts on specific securities or an entire market, which may result in the Fund being, among other things, unable to buy or sell certain securities or financial instruments or unable to accurately price its investments. While the Fund has established
business continuity plans and systems designed to prevent cyber-attacks, there are inherent limitations
32
COHEN
& STEERS CLOSED-END OPPORTUNITY FUND, INC.
in such plans and systems including the possibility that
certain risks have not been identified. Similar types of cyber security risks also are present for issuers of securities in which the Fund invests, which could result in material adverse consequences for such issuers, and may cause the Fund’s
investment in such securities to lose value.
Each of the Fund and the investment manager may have limited ability to
prevent or mitigate cyber-attacks or security or technology breakdowns affecting the Fund’s third-party service providers. While the Fund has established business continuity plans and systems designed to prevent or reduce the impact of
cyber-attacks, such plans and systems are subject to inherent limitations.
Geopolitical Risk: Occurrence
of global events similar to those in recent years, such as war (including Russia’s military invasion of Ukraine), terrorist attacks, natural or environmental disasters, country instability, infectious disease epidemics or pandemics, such as
that caused by COVID-19, market instability, debt crises and downgrades, embargoes, tariffs, sanctions and other trade barriers and other governmental trade or market control programs, the potential exit of a
country from its respective union and related geopolitical events, may result in market volatility and may have long-lasting impacts on U.S. and global economies and financial markets. Supply chain disruptions or significant changes in the supply or
prices of commodities or other economic inputs may have material and unexpected effects on both global securities markets and individual countries, regions, sectors, companies or industries. Events occurring in one region of the world may negatively
impact industries and regions that are not otherwise directly impacted by the events. Additionally, those events, as well as other changes in foreign and domestic political and economic conditions, could adversely affect individual issuers or
related groups of issuers, securities markets, interest rates, secondary trading, credit ratings, inflation, investor sentiment and other factors affecting the value of the Fund’s investments.
Although the long-term economic fallout of COVID-19 is difficult to predict, it has
contributed to, and may continue to contribute to, market volatility, inflation and systemic economic weakness. COVID-19 and efforts to contain its spread may also exacerbate other pre-existing political, social, economic, market and financial risks. In addition, the U.S. government and other central banks across Europe, Asia, and elsewhere announced and/or adopted economic relief packages in
response to COVID-19. The end of any such program could cause market downturns, disruptions and volatility, particularly if markets view the ending as premature. The U.S. federal government ended the COVID-19 public emergency declaration on May 11, 2023, however, the effects of the COVID-19 pandemic are expected to continue and the risk that new variants of COVID-19 may emerge remains. Therefore the economic outlook, particularly for certain industries and businesses, remains inherently uncertain.
On January 31, 2020, the United Kingdom (UK) withdrew from the European Union (EU) (referred to as Brexit). An agreement
between the UK and the EU governing their future trade relationship became effective January 1, 2021. Brexit has resulted in volatility in European and global markets and could have potentially significant negative long-term impacts on
financial markets in the UK and throughout Europe.
On February 24, 2022, Russia launched a large-scale invasion of
Ukraine significantly amplifying already existing geopolitical tensions. The United States and many other countries have instituted various economic sanctions against Russia, Russian individuals and entities and Belarus. The extent and duration of
the military action, sanctions imposed and other punitive actions taken (including any Russian retaliatory responses to such sanctions and actions), and resulting disruptions in Europe and globally cannot be predicted, but could be significant and
have a severe adverse effect on the global
33
COHEN
& STEERS CLOSED-END OPPORTUNITY FUND, INC.
economy, securities markets and commodities markets
globally, including through global supply chain disruptions, increased inflationary pressures and reduced economic activity. Ongoing conflicts in the Middle East could have similar negative impacts. To the extent the Fund has exposure to the energy
sector, the Fund may be especially susceptible to these risks. Furthermore, in March 2023, the shut-down of certain financial institutions raised economic concerns over disruption in the U.S. banking system. There can be no certainty that the
actions taken by the U.S. government to strengthen public confidence in the U.S. banking system will be effective in mitigating the effects of financial institution failures on the economy and restoring public confidence in the U.S. banking system.
These disruptions may also make it difficult to value the Fund’s portfolio investments and cause certain of the Fund’s investments to become illiquid. The strengthening or weakening of the U.S. dollar relative to other currencies may,
among other things, adversely affect the Fund’s investments denominated in non-U.S. dollar currencies. It is difficult to predict when similar events affecting the U.S. or global financial markets may
occur, the effects that such events may have, and the duration of those effects.
Regulatory Risk: The U.S.
government has proposed and adopted multiple regulations that could have a long-lasting impact on the Fund and on the mutual fund industry in general. The SEC’s final rules, related requirements and amendments to modernize reporting and
disclosure, along with other potential upcoming regulations, could, among other things, restrict the Fund’s ability to engage in transactions and/or increase overall expenses of the Fund. In addition to Rule
18f-4, which governs the way derivatives are used by registered investment companies, the SEC, Congress, various exchanges and regulatory and self-regulatory authorities, both domestic and foreign, have
undertaken reviews of the use of derivatives by registered investment companies, which could affect the nature and extent of instruments used by the Fund. The Fund and the instruments in which it invests may be subject to new or additional
regulatory constraints in the future. While the full extent of all of these regulations is still unclear, these regulations and actions may adversely affect both the Fund and the instruments in which the Fund invests and its ability to execute its
investment strategy. For example, climate change regulation (such as decarbonization legislation, other mandatory controls to reduce emissions of greenhouse gases, or related disclosure requirements) could significantly affect the Fund or its
investments by, among other things, increasing compliance costs or underlying companies’ operating costs and capital expenditures. Similarly, regulatory developments in other countries may have an unpredictable and adverse impact on the Fund.
Portfolio Fund Investment Risk
Interest Rate Risk. Interest rate risk is the risk that the value of fixed income securities will fall if interest
rates increase. These securities typically fall in value when interest rates rise and rise in value when interest rates fall. Fixed income securities with longer periods before maturity are often more sensitive to interest rate changes. If a
Portfolio Fund is leveraged (i.e., borrows for investment purposes) it may be expected to have greater interest rate sensitivity.
Credit Risk; High Yield Securities. Credit risk is the risk that a borrower is unable to meet its obligation to pay principal or interest on a fixed income security. To the extent that a Portfolio Fund invests in
companies with lower-than-average credit quality, the Portfolio Fund can be expected to experience a higher rate of defaults within its portfolio than if it invested in higher quality securities. Securities rated at the time of purchase to be below BBB-by S&P Global Ratings (S&P) or Baa3 by Moody’s Investors Services, Inc. (Moody’s) (or the unrated equivalent as determined by the investment
34
COHEN
& STEERS CLOSED-END OPPORTUNITY FUND, INC.
manager) are considered “high yield” securities,
sometimes known as “junk” bonds. High yield, lower quality securities are considered speculative and, compared to certain lower yielding, higher quality securities, tend to have more volatile prices and increased price sensitivity to
changing interest rates and to adverse economic and business developments, greater risk of loss due to default or declining credit quality, greater likelihood that adverse economic or company specific events will make the issuer unable to make
interest and/or principal payments, and greater susceptibility to negative market sentiments leading to depressed prices and decrease in liquidity. It is reasonable to expect that any adverse economic conditions could disrupt the market for
lower-rated securities, have an adverse impact on the value of those securities and adversely affect the ability of the issuers of those securities to repay principal and interest on those securities.
Nationally recognized statistical rating organizations (NRSROs) are private services that provide ratings of the credit quality of
debt obligations, including convertible securities. Ratings assigned by an NRSRO are not absolute standards of credit quality and do not evaluate market risks or the liquidity of securities. NRSROs may fail to make timely changes in credit ratings
and an issuer’s current financial condition may be better or worse than a rating indicates.
Unrated securities may
be less liquid than comparable rated securities and involve the risk that the investment manager may not accurately evaluate the security’s comparative credit rating. If a security is unrated, the investment manager will assign a rating using
its own analysis of issuer quality.
Leverage Risk. Portfolio Funds may employ the use of leverage. The use of
leverage is a speculative technique and there are special risks and costs associated with leverage. The NAV of the Portfolio Fund’s shares may be reduced by the issuance and ongoing costs of leverage. So long as the Portfolio Fund is able to
invest in securities that produce an investment yield that is greater than the total cost of leverage, the leverage strategy will produce higher current net investment income for the shareholders, including the Fund. On the other hand, to the extent
that the total cost of leverage exceeds the incremental income gained from employing such leverage, shareholders, including the Fund, would realize lower net investment income. In addition to the impact on net income, the use of leverage will have
an effect of magnifying capital appreciation or depreciation for shareholders. Specifically, in an up market, leverage will typically generate greater capital appreciation than if the Portfolio Fund were not employing leverage. Conversely, in down
markets, the use of leverage will generally result in greater capital depreciation than if the Portfolio Fund had been unlevered. To the extent that the Portfolio Fund is required or elects to reduce its leverage, the Portfolio Fund may need to
liquidate investments, including under adverse economic conditions which may result in capital losses potentially reducing returns to shareholders. The use of leverage also results in the investment management fees payable to the investment manager
being higher than if the Fund did not use leverage and can increase operating costs, which may reduce total return. In some market conditions, a Portfolio Fund may not be able to employ leverage to the extent or at the cost desired. This could
prevent a Portfolio Fund from executing its portfolio strategies or could otherwise depress shareholder returns. There can be no assurance that a leveraging strategy will be successful during any period in which it is employed.
Senior Loans Risk. The Fund may invest in Portfolio Funds that invest in senior loans. The risks associated with senior
loans are similar to the risks of junk bonds, although senior loans are typically senior and secured, whereas junk bonds are often subordinated and unsecured. Investments in senior loans are typically below investment grade and are considered
speculative because of the credit risk of
35
COHEN
& STEERS CLOSED-END OPPORTUNITY FUND, INC.
their issuers. Such companies are more likely to default on
their payments of interest and principal owed, and such defaults could reduce a Portfolio Fund’s NAV and income distributions. An economic downturn generally leads to a higher non-payment rate, and a
senior loan may lose significant value before a default occurs. There is no assurance that the liquidation of the collateral would satisfy the claims of the borrower’s obligations in the event of the nonpayment of scheduled interest or
principal, or that the collateral could be readily liquidated. Economic and other events (whether real or perceived) can reduce the demand for certain senior loans or senior loans generally, which may reduce market prices. Senior loans and other
debt securities are also subject to the risk of price declines and to increases in prevailing interest rates, although floating-rate debt instruments such as senior loans in which certain Portfolio Funds may be expected to invest are substantially
less exposed to this risk than fixed-rate debt instruments.
Convertible Securities Risk. Convertible securities
are bonds, debentures, notes, preferred securities or other securities that may be converted or exchanged (by the holder or the issuer) into shares of the underlying common stock (or cash or securities of equivalent value), either at a stated price
or stated rate. Convertible securities have characteristics similar to both fixed income and equity securities. Convertible securities generally are subordinated to other similar but non-convertible securities
of the same issuer, although convertible bonds, as corporate debt obligations, enjoy seniority in right of payment to all equity securities, and convertible preferred stock is senior to common stock, of the same issuer. Because of the subordination
feature, however, convertible securities typically are considered to be lower quality than similar non-convertible securities.
Preferred Securities Risk. The Fund may invest in Portfolio Funds that invest in preferred securities. Preferred securities
are subject to credit risk, which is the risk that a security will decline in price, or the issuer of the security will fail to make dividend, interest or principal payments when due, because the issuer experiences a decline in its financial status.
Preferred securities are also subject to interest rate risk and may decline in value because of changes in market interest rates. Portfolio Funds may be subject to a greater risk of rising interest rates than would normally be the case in an
environment of low interest rates and the effect of potential government fiscal policy initiatives and resulting market reaction to those initiatives. In addition, an issuer may be permitted to defer or omit distributions. Preferred securities are
also generally subordinated to bonds and other debt instruments in a company’s capital structure. During periods of declining interest rates, an issuer may be able to exercise an option to redeem (call) its issue at par earlier than scheduled,
and the Portfolio Fund may be forced to reinvest in lower yielding securities. Certain preferred securities may be substantially less liquid than many other securities, such as common stocks. Generally, preferred security holders have no voting
rights with respect to the issuing company unless certain events occur. Certain preferred securities may give the issuers special redemption rights allowing the securities to be redeemed prior to a specified date if certain events occur, such as
changes to tax or securities laws.
Mortgage-and Asset-Backed Securities Risk. The Fund may invest in Portfolio
Funds that invest in mortgage-and asset-backed securities. The risks associated with mortgage-related securities include: (1) credit risk associated with the performance of the underlying mortgage properties and of the borrowers owning these
properties; (2) adverse changes in economic conditions and circumstances, which are more likely to have an adverse impact on mortgage-related securities secured by loans on certain types of commercial properties than on those secured by loans
on residential properties; (3) prepayment risk, which can lead to significant fluctuations in value of the mortgage-related security;
36
COHEN
& STEERS CLOSED-END OPPORTUNITY FUND, INC.
(4) loss of all or part of the premium, if any, paid;
and (5) decline in the market value of the security, whether resulting from changes in interest rates or prepayments on the underlying mortgage collateral. Asset-backed securities involve certain risks in addition to those presented by
mortgage-related securities: (1) primarily, these securities do not have the benefit of the same security interest in the underlying collateral as mortgage-related securities and are more dependent on the borrower’s ability to pay;
(2) credit card receivables are generally unsecured, and the debtors are entitled to the protection of a number of state and federal consumer credit laws, many of which give debtors the right to set off certain amounts owed on the credit cards,
thereby reducing the balance due; and (3) most issuers of automobile receivables permit the servicers to retain possession of the underlying obligations.
Master Limited Partnerships Risk. The Fund may invest in Portfolio Funds that invest in master limited partnerships (MLPs).
An investment in MLP units involves some risks that differ from an investment in the common stock of a corporation. Holders of MLP units have limited control on matters affecting the partnership. Investing in MLPs involves certain risks related to
investing in the underlying assets of the MLPs and risks associated with pooled investment vehicles. MLPs holding credit-related investments are subject to interest rate risk and the risk of default on payment obligations by debt issuers. MLPs that
concentrate in a particular industry or a particular geographic region are subject to risks associated with such industry or region. The benefit derived from the Fund’s investment in MLPs is largely dependent on the MLPs being treated as
partnerships for federal income tax purposes. Weakening energy market fundamentals may increase counterparty risk and impact MLP profitability. Specifically, energy companies suffering financial distress may be able to abrogate contracts with MLPs,
decreasing or eliminating sources of revenue.
Call Risk. Call risk is the risk that the issuer of a bond
exercises rights it may have to redeem (or “call”) the bond, in whole or in part, prior to the stated maturity date. Bonds may be subject to greater call risk when interest rates are declining. In a declining interest rate environment,
Portfolio Funds will likely receive a lower interest rate upon the reinvestment of proceeds.
Equity Securities
Risk. Common stock holds the lowest priority in the capital structure of a company, and therefore takes the largest share of the company’s risk and its accompanying volatility. An adverse event, such as an unfavorable earnings report, may
depress the value of a particular common stock. Also, prices of common stocks are sensitive to general market movements.
Sector Concentration Risk. Some Portfolio Funds invest substantially, or even exclusively, in one sector or industry group
and therefore carry risk of the particular sector or industry group. To the extent a Portfolio Fund focuses its investments in a specific sector, such as real estate, energy or utilities, the Portfolio Fund will be susceptible to adverse conditions
and economic or regulatory occurrences affecting the sector or industry group, which tends to increase volatility and result in higher risk.
| |
• |
|
Real Estate. Real property investments, including investments in real estate investment trusts
(REITs), are subject to varying degrees of risk. Property values may fall due to increasing vacancies or declining rents resulting from economic, legal, cultural or technological developments. The price of real estate company shares also may drop
because of the failure of borrowers to pay their loans and poor management. Many real estate companies utilize leverage, which increases investment risk and could adversely affect a company’s operations and market value in periods of rising
interest rates, as well as risks normally associated with debt financing. The yields available from investments in real estate depend on the amount of income and capital appreciation generated by the related properties. Income and real estate
|
37
COHEN
& STEERS CLOSED-END OPPORTUNITY FUND, INC.
| |
values also may be adversely affected by such factors as applicable laws, interest rate levels and the availability of financing. If the properties do not generate sufficient income to meet operating expenses,
including, where applicable, debt service, ground lease payments, tenant improvements, third-party leasing commissions and other capital expenditures, the income and ability of the real estate company to make payments of any interest and principal
on its debt securities will be adversely affected. In addition, real property may be subject to the quality of credit extended to and defaults by borrowers and tenants. |
| |
• |
|
Energy. The energy industry can be significantly affected by the supply of and demand for
specific products and services, the supply and demand for oil and gas, the price of oil and gas, exploration and production spending, government regulation, world events and economic conditions. The natural resources industry can be significantly
affected by events relating to international political developments, energy conservation, the success of exploration projects, commodity prices, and tax and government regulations. At times, the performance of securities of companies in the energy
and natural resources industry will lag the performance of other industries or the broader market as a whole. Other risks inherent in investing in the energy and natural resources industry include those associated with the volatility of commodity
prices; a decrease in the production of natural gas, natural gas liquids, crude oil, coal or other energy commodities or a decrease in the volume of such commodities available for transportation, mining, processing, storage or distribution; a
decline in demand for such commodities; the inability to cost-effectively acquire additional reserves sufficient to replace depletion in resources used by energy and natural resources companies; and stricter laws, regulations or enforcement
policies, which would likely increase compliance costs. |
| |
• |
|
Utilities. Issuers in the utility industry are subject to a variety of factors that may
adversely affect their business or operations, including: high interest costs in connection with capital construction and improvement programs; difficulty in raising capital in adequate amounts on reasonable terms in periods of high inflation and
unsettled capital markets; governmental regulation of rates charged to customers; costs associated with compliance with and changes in environmental and other regulations; effects of economic slowdowns and surplus capacity; increased competition
from other providers of utility services; inexperience with and potential losses resulting from a developing deregulatory environment; and costs associated with the reduced availability of certain types of fuel, occasionally reduced availability and
high costs of natural gas for resale, and the effects of energy conservation policies. |
Covered
Call Writing Risk. The Fund may invest in Portfolio Funds that engage in a strategy known as “covered call option writing,” which is designed to produce income from option premiums and offset a portion of a market decline in the
underlying security. The writer (seller) of a covered call option forgoes, during the option’s life, the opportunity to profit from increases in the market value of the security covering the call option above the sum of the premium and the
strike price of the call, but has retained the risk of loss should the price of the underlying security decline. The writer of an option has no control over the time when it may be required to fulfill its obligation as a writer of the option. Once
an option writer has received an exercise notice, it cannot effect a closing purchase transaction in order to terminate its obligation under the option and must deliver the underlying security at the exercise price.
Foreign (Non-U.S.) and Emerging Market Securities Risk. Some of the securities held
by certain of the Portfolio Funds may be issued by foreign issuers. Risks of investing in foreign securities, which can
38
COHEN
& STEERS CLOSED-END OPPORTUNITY FUND, INC.
be expected to be greater for investments in emerging
markets, include currency risks, future political and economic developments and possible imposition of foreign withholding or other taxes on income or proceeds payable on the securities. In addition, there may be less publicly available information
about a foreign issuer than about a domestic issuer, and foreign issuers may not be subject to the same accounting, auditing and financial recordkeeping standards and requirements as domestic issuers. Moreover, securities of many foreign issuers and
their markets may be less liquid and their prices more volatile than securities of comparable U.S. issuers.
Investing
in securities of companies in emerging markets may entail special risks relating to potential economic, political or social instability and the risks of expropriation, nationalization, confiscation, trade sanctions or embargoes or the imposition of
restrictions on foreign investment, the lack of hedging instruments, and repatriation of capital invested. The securities and real estate markets of some emerging market countries have in the past experienced substantial market disruptions and may
do so in the future.
REITs Risk. REITs are characterized as equity REITs, mortgage REITs and hybrid REITs.
Equity REITs, which may include operating or finance companies, own real estate directly, and the value of, and income earned by, the REITs depends upon the income of the underlying properties and the rental income they earn. An equity REIT may be
affected by changes in the value of the underlying properties owned by the REIT. Mortgage REITs can make construction, development or long-term mortgage loans and are sensitive to the credit quality of the borrower. Hybrid REITs combine the
characteristics of both equity and mortgage REITs, generally by holding both ownership interests and mortgage interests in real estate. Investing in REITs involves certain unique risks in addition to those risks associated with investing in the real
estate industry in general.
Municipal Bond Risk. The Fund may invest in Portfolio Funds that invest in municipal
bonds. Municipal bonds are debt obligations issued by states or by political subdivisions or authorities of states. Municipal bonds are typically designated as general obligation bonds, which are general obligations of a governmental entity that are
backed by the taxing power of such entity, or revenue bonds, which are payable from the income of a specific project or authority and are not supported by the issuer’s power to levy taxes. Municipal bonds are long-term fixed rate debt
obligations that generally decline in value with increases in interest rates, when an issuer’s financial condition worsens or when the rating on a bond is decreased. Many municipal bonds may be called or redeemed prior to their stated maturity.
Lower quality revenue bonds and other credit-sensitive municipal securities carry higher risks of default than general obligation bonds.
Restricted and Illiquid Securities Risk. The Fund may invest in Portfolio Funds that invest in illiquid securities (i.e., securities that may be difficult to sell at a desirable time or price). Illiquid securities are
securities that are not readily marketable and may include some restricted securities, which are securities that may not be resold to the public without an effective registration statement under the Securities Act or, if they are unregistered, may
be sold only in a privately negotiated transaction or pursuant to an exemption from registration. Illiquid investments involve the risk that the securities will not be able to be sold at the time desired by the Portfolio Fund or at prices
approximating the value at which the Portfolio Fund is carrying the securities on its books. Restricted securities and illiquid securities are often more difficult to value and the sale of such securities often requires more time and results in
higher brokerage charges or dealer discounts and other selling expenses than does the sale of liquid securities trading on national securities exchanges or in the OTC markets. Contractual restrictions on
39
COHEN
& STEERS CLOSED-END OPPORTUNITY FUND, INC.
the resale of securities result from negotiations between
the issuer and purchaser of such securities and therefore vary substantially in length and scope. To dispose of a restricted security that the Portfolio Fund has a contractual right to sell, the Portfolio Fund may first be required to cause the
security to be registered. A considerable period may elapse between a decision to sell the securities and the time when the Portfolio Fund would be permitted to sell, during which time the Portfolio Fund would bear market risks.
Investment Restrictions
Fundamental Investment Restrictions
The Fund has adopted certain investment limitations limiting the following activities except as specifically authorized. Under
these limitations, the Fund may not:
1. Issue senior securities (including borrowing money for other than temporary
purposes) except in conformity with the limits set forth in the 1940 Act or pursuant to exemptive relief therefrom; or pledge, mortgage or hypothecate its assets other than to secure such issuances or borrowings or in connection with permitted
investment strategies; provided that, notwithstanding the foregoing, the Fund may borrow up to an additional 5% of its total assets for temporary purposes;
2. Act as an underwriter of securities issued by other persons, except insofar as the Fund may be deemed an underwriter in
connection with the disposition of securities;
3. Purchase or sell real estate or mortgages on real estate, except that
Portfolio Funds may invest in securities of companies that deal in real estate or are engaged in the real estate business, including REITs and securities secured by real estate or interests therein, and a Portfolio Fund may hold and sell real estate
or mortgages on real estate acquired through default, liquidation, or other distributions of an interest in real estate as a result of the Portfolio Fund’s ownership of such securities;
4. Purchase or sell commodities or commodity futures contracts, except that the Portfolio Funds may invest in financial futures
contracts, forward contracts and options thereon, and currency options and such similar instruments;
5. Make loans to
other persons except through the lending of securities held by it (but not to exceed a value of one-third of total assets), through the use of repurchase agreements, and by the purchase of debt securities; or
6. Invest more than 25% of its total assets in securities of issuers in any one industry; provided, however, that such
limitation shall not apply to obligations issued or guaranteed by the United States Government or by its agencies or instrumentalities.
The investment restrictions above have been adopted as fundamental policies of the Fund. Under the 1940 Act, a fundamental policy may not be changed without the approval of the holders of a “majority of the outstanding”
voting securities of the Fund.
40
COHEN
& STEERS CLOSED-END OPPORTUNITY FUND, INC.
Additional Non-Fundamental Investment Restrictions
Non-fundamental policies may be changed by the Fund’s Board without shareholder
approval. Currently, the Fund may not:
1. Acquire or retain securities of any investment company other than (a) in
accordance with the limits permitted by Section 12(d)(1) of the 1940 Act, or any exemption granted under the 1940 Act and the rules thereunder, and (b) through the acquisition of securities of any investment company as part of a merger,
consolidation or similar transaction.
41
COHEN
& STEERS CLOSED-END OPPORTUNITY FUND, INC.
MANAGEMENT OF THE FUND
The business and affairs of the Fund are managed under the direction of the Board of Directors. The Board of Directors approves all
significant agreements between the Fund and persons or companies furnishing services to it, including the Fund’s agreements with its investment manager, administrator, co-administrator, custodian and
transfer agent. The management of the Fund’s day-to-day operations is delegated to its officers, the investment manager, administrator and co-administrator, subject always to the investment objective and policies of the Fund and to the general supervision of the Board of Directors.
The Board of Directors and officers of the Fund and their principal occupations during at least the past five years are set forth
below. The statement of additional information (SAI) contains additional information about the directors as of the date thereof and additional information about the directors is also included in the Fund’s most recent proxy statement, which are
available, without charge, upon request by calling 866-277-0757.
|
|
|
|
|
|
|
|
|
|
|
|
|
| Name, Address and
Year of Birth(1)
|
|
Position(s) Held
With Fund |
|
Term of
Office(2)
|
|
Principal Occupation
During At Least The Past 5 Years (Including Other
Directorships Held) |
|
Number of
Funds Within Fund Complex
Overseen by Director (Including
the Fund) |
|
|
Length
of Time
Served(3) |
|
|
|
|
|
|
| Interested Directors(4) |
|
|
|
|
|
|
|
|
|
|
|
|
|
|
|
|
|
|
| Joseph M. Harvey
1963 |
|
Director, Chair |
|
Until Next Election of Directors |
|
Chief Executive Officer since 2022 and President since 2003 of Cohen & Steers Capital Management, Inc. (CSCM), and Chief Executive Officer since 2022 and President since 2004 of Cohen & Steers, Inc.
(CNS). Chief Investment Officer of CSCM from 2003 to 2019. Prior to that, Senior Vice President and Director of Investment Research of CSCM. |
|
|
20 |
|
|
Since 2014 |
|
|
|
|
|
|
| Adam M. Derechin
1964 |
|
Director |
|
Until Next Election of Directors |
|
Chief Operating Officer of CSCM since 2003 and CNS since 2004. President and Chief Executive Officer of the Funds from 2005 to 2021. |
|
|
20 |
|
|
Since 2021 |
|
|
|
|
|
| Independent Directors |
|
|
|
|
|
|
|
|
|
|
|
|
|
|
|
|
| Michael G. Clark
1965 |
|
Director |
|
Until Next Election of Directors |
|
CFA; From 2006 to 2011, President and Chief Executive Officer of DWS Funds and Managing Director of Deutsche Asset Management. |
|
|
20 |
|
|
Since 2011 |
(table continued on next page)
42
COHEN
& STEERS CLOSED-END OPPORTUNITY FUND, INC.
(table continued from previous page)
|
|
|
|
|
|
|
|
|
|
|
| Name, Address and
Year of Birth(1)
|
|
Position(s) Held
With Fund |
|
Term of
Office(2)
|
|
Principal Occupation
During At Least The Past 5 Years (Including Other
Directorships Held) |
|
Number of
Funds Within Fund Complex
Overseen by Director (Including
the Fund) |
|
Length
of Time
Served(3) |
|
|
|
|
|
|
| George Grossman
1953 |
|
Director |
|
Until Next Election of Directors |
|
Attorney-at-law. |
|
20 |
|
Since 1993 |
|
|
|
|
|
|
| Dean A. Junkans
1959 |
|
Director |
|
Until Next Election of Directors |
|
CFA; Advisor to SigFig (a registered investment advisor) from July 2018 to July 2022; Chief Investment Officer at Wells Fargo Private Bank from 2004 to 2014 and Chief Investment Officer of the Wealth, Brokerage
and Retirement group at Wells Fargo & Company from 2011 to 2014; former Member and Chair, Claritas Advisory Committee at the CFA Institute from 2013 to 2015; former Adjunct Professor and Executive-In-Residence, Bethel University, 2015 to
2022; former Board Member and Investment Committee Member, Bethel University Foundation, 2010 to 2022; former Corporate Executive Board Member of the National Chief Investment Officers Circle, 2010 to 2015; former Member of the Board of Governors of
the University of Wisconsin Foundation, River Falls, 1996 to 2004; U.S. Army Veteran, Gulf War. |
|
20 |
|
Since 2015 |
(table continued on next page)
43
COHEN
& STEERS CLOSED-END OPPORTUNITY FUND, INC.
(table continued from previous page)
|
|
|
|
|
|
|
|
|
|
|
| Name, Address and
Year of Birth(1)
|
|
Position(s) Held
With Fund |
|
Term of
Office(2)
|
|
Principal Occupation
During At Least The Past 5 Years (Including Other
Directorships Held) |
|
Number of
Funds Within Fund Complex
Overseen by Director (Including
the Fund) |
|
Length
of Time
Served(3) |
|
|
|
|
|
|
| Gerald J. Maginnis
1955 |
|
Director |
|
Until Next Election of Directors |
|
Philadelphia Office Managing Partner, KPMG LLP from 2006 to 2015; Partner in Charge, KPMG Pennsylvania Audit Practice from 2002 to 2008; President, Pennsylvania Institute of Certified Public Accountants (PICPA)
from 2014 to 2015; Member, PICPA Board of Directors from 2012 to 2016; Member, Council of the American Institute of Certified Public Accountants (AICPA) from 2013 to 2017; Member, Board of Trustees of AICPA Foundation from 2015 to 2020; Board Member
and Audit Committee Chairman of inTEST Corporation since 2020; Chairman of the Advisory Board of Centri Consulting LLC since 2022. |
|
20 |
|
Since 2015 |
|
|
|
|
|
|
| Jane F. Magpiong
1960 |
|
Director |
|
Until Next Election of Directors |
|
President, Untap Potential since 2013; Senior Managing Director, TIAA-CREF, from 2011 to 2013; National Head of Wealth Management, TIAA- CREF, from 2008 to 2011; President, Bank of America Private Bank from
2005 to 2008; Executive Vice President, Fleet Private Clients Group, from 2003 to 2004. |
|
20 |
|
Since 2015 |
(table continued on next page)
44
COHEN
& STEERS CLOSED-END OPPORTUNITY FUND, INC.
(table continued from previous page)
|
|
|
|
|
|
|
|
|
|
|
| Name, Address and
Year of Birth(1)
|
|
Position(s) Held
With Fund |
|
Term of
Office(2)
|
|
Principal Occupation
During At Least The Past 5 Years (Including Other
Directorships Held) |
|
Number of
Funds Within Fund Complex
Overseen by Director (Including
the Fund) |
|
Length
of Time
Served(3) |
|
|
|
|
|
|
| Daphne L. Richards
1966 |
|
Director |
|
Until Next Election of Directors |
|
President and CIO of Ledge Harbor Management since 2016;
Investment Committee Member of the Berkshire Taconic Community Foundation since 2015; Member of the Advisory Board of Northeast Dutchess Fund since
2016; former Independent Director of Cartica Management, LLC, 2015 to 2022; formerly worked at Bessemer Trust Company from 1999 to 2014; Frank Russell Company from 1996 to 1999; Union Bank of Switzerland from 1993 to 1996; Credit Suisse from 1990 to
1993; Hambros International Venture Capital Fund from 1988 to 1989. |
|
20 |
|
Since 2017 |
(table continued on next page)
45
COHEN
& STEERS CLOSED-END OPPORTUNITY FUND, INC.
(table continued from previous page)
|
|
|
|
|
|
|
|
|
|
|
| Name, Address and
Year of Birth(1)
|
|
Position(s) Held
With Fund |
|
Term of
Office(2)
|
|
Principal Occupation
During At Least The Past 5 Years (Including Other
Directorships Held) |
|
Number of
Funds Within Fund Complex
Overseen by Director (Including
the Fund) |
|
Length
of Time
Served(3) |
|
|
|
|
|
|
| Ramona Rogers-Windsor 1960 |
|
Director |
|
Until Next Election of Directors |
|
CFA; Member, Capital Southwest Board of Directors since 2021; Member, Thomas Jefferson University Board of Trustees since 2020; and its insurance subsidiary board, Partners Insurance Company, Inc., since 2023;
Managing Director, Public Investments Department, Northwestern Mutual Investment Management Company, LLC from 2012 to 2019; former Member, Milwaukee Film, LLC Board of Directors from 2016 to 2019. |
|
20 |
|
Since 2021 |
| (1) |
The address for each Director is 1166 Avenue of the Americas, 30th Floor, New York, NY 10036. |
| (2) |
On March 12, 2008, the Board of Directors adopted a mandatory retirement policy stating a Director
must retire from the Board on December 31st of the year in which he or she turns 75 years of age. |
| (3) |
The length of time served represents the year in which the Director was first elected or appointed
to any fund in the Cohen & Steers Fund Complex. |
| (4) |
“Interested persons,” as defined in the 1940 Act, on the basis of their affiliation with
the Advisor (Interested Directors). |
46
COHEN
& STEERS CLOSED-END OPPORTUNITY FUND, INC.
The officers of the Fund (other than Mr.
Harvey, whose biography is provided above), their address, their year of birth and their principal occupations for at least the past five years are set forth below.
|
|
|
|
|
|
|
| Name, Address and
Year of
Birth(1) |
|
Position(s) Held
With Fund |
|
Principal Occupation During At Least
the Past 5 Years |
|
Length
of Time
Served(2) |
|
|
|
|
| James Giallanza
1966 |
|
President and Chief Executive Officer |
|
Executive Vice President of CSCM since 2014. Prior to that, Senior Vice President of CSCM since 2006. |
|
Since 2006 |
|
|
|
|
| Albert Laskaj
1977 |
|
Treasurer and Chief Financial Officer |
|
Senior Vice President of CSCM since 2019. Prior to that, Vice President of CSCM since 2015. |
|
Since 2015 |
|
|
|
|
| Dana A. DeVivo
1981 |
|
Secretary and Chief Legal Officer |
|
Senior Vice President of CSCM since 2019. Prior to that, Vice President of CSCM since 2013. |
|
Since 2015 |
|
|
|
|
| Stephen Murphy
1966 |
|
Chief Compliance Officer
and Vice President |
|
Senior Vice President of CSCM since 2019. Prior to that, Managing Director at Mirae Asset Securities (USA) Inc. since 2017. |
|
Since
2019 |
|
|
|
|
| Douglas R. Bond
1959 |
|
Vice President |
|
Executive Vice President of CSCM since 2004. |
|
Since 2007 |
|
|
|
|
| Yigal D. Jhirad
1965 |
|
Vice President |
|
Senior Vice President of CSCM since 2007. |
|
Since 2007 |
| (1) |
The address of each officer is 1166 Avenue of the Americas, 30th Floor, New York, NY 10036. |
| (2) |
Officers serve one-year terms. The length of time served
represents the year in which the officer was first elected as an officer of any fund in the Cohen & Steers fund complex. All of the officers listed above are officers of one or more of the other funds in the complex.
|
47
COHEN
& STEERS CLOSED-END OPPORTUNITY FUND, INC.
Cohen & Steers Privacy Policy
|
|
|
| |
|
| Facts |
|
What Does Cohen & Steers Do With Your Personal Information? |
|
|
| Why? |
|
Financial companies choose how they share your personal information. Federal law gives consumers the right to limit some but not all sharing. Federal law also requires
us to tell you how we collect, share, and protect your personal information. Please read this notice carefully to understand what we do. |
|
|
| What? |
|
The types of personal information we collect and share depend on the product or service
you have with us. This information can include: • Social Security number and account balances
• Transaction history and account transactions
• Purchase history and wire
transfer instructions |
|
|
| How? |
|
All financial companies need to share customers’ personal information to run their everyday business. In the section below, we list the reasons financial
companies can share their customers’ personal information; the reasons Cohen & Steers chooses to share; and whether you can limit this sharing. |
|
|
|
|
|
| Reasons we can share your personal information |
|
Does Cohen & Steers
share? |
|
Can you limit this
sharing? |
|
|
|
| For our everyday business purposes—
such as to process your transactions, maintain your account(s), respond to court orders and legal investigations, or reports to
credit bureaus |
|
Yes |
|
No |
|
|
|
| For our marketing purposes—
to offer our products and services to you |
|
Yes |
|
No |
|
|
|
| For joint marketing with other financial companies— |
|
No |
|
We don’t share |
|
|
|
| For our affiliates’ everyday business purposes—
information about your transactions and experiences |
|
No |
|
We don’t share |
|
|
|
| For our affiliates’ everyday business purposes—
information about your creditworthiness |
|
No |
|
We don’t share |
|
|
|
| For our affiliates to market to you— |
|
No |
|
We don’t share |
|
|
|
| For non-affiliates to market to you— |
|
No |
|
We don’t share |
|
|
|
|
|
|
|
|
| |
|
|
| Questions? Call 866-227-0757 |
|
|
|
|
48
COHEN
& STEERS CLOSED-END OPPORTUNITY FUND, INC.
Cohen & Steers Privacy
Policy—(Continued)
|
|
|
| |
|
| Who we are |
|
|
|
|
| Who is providing this notice? |
|
Cohen & Steers Capital Management, Inc., Cohen & Steers Asia Limited, Cohen & Steers Japan Limited, Cohen & Steers UK Limited,
Cohen & Steers Ireland Limited, Cohen & Steers Singapore Private Limited, Cohen & Steers Securities, LLC, Cohen & Steers Private Funds and Cohen & Steers Open and
Closed-End Funds (collectively, Cohen & Steers). |
|
|
| What we do |
|
|
|
|
| How does Cohen & Steers protect my personal information? |
|
To protect your personal information from unauthorized access and use, we use security measures that comply with federal law. These measures include computer
safeguards and secured files and buildings. We restrict access to your information to those employees who need it to perform their jobs, and also require companies that provide services on our behalf to protect your information. |
|
|
| How does Cohen & Steers collect my personal information? |
|
We collect your personal information, for example, when you:
• Open an account or buy
securities from us
• Provide account information or give us your contact information
• Make deposits or
withdrawals from your account We also collect your personal
information from other companies. |
|
|
| Why can’t I limit all sharing? |
|
Federal law gives you the right to limit only:
• sharing for
affiliates’ everyday business purposes—information about your creditworthiness
• affiliates from using your information to market to you
• sharing for non-affiliates to market to you
State law and individual companies may give you additional rights to limit sharing. |
|
|
| Definitions |
|
|
|
|
| Affiliates |
|
Companies related by common ownership or control. They can be financial and
nonfinancial companies.
• Cohen & Steers does not share with affiliates. |
|
|
| Non-affiliates |
|
Companies not related by common ownership or control. They can be financial and
nonfinancial companies.
• Cohen & Steers does not share with
non-affiliates. |
|
|
| Joint marketing |
|
A formal agreement between non-affiliated
financial companies that together market financial products or services to you.
• Cohen & Steers does not jointly market. |
49
COHEN
& STEERS CLOSED-END OPPORTUNITY FUND, INC.
Cohen & Steers Open-End Mutual
Funds
COHEN & STEERS REALTY SHARES
| • |
|
Designed for investors seeking total return, investing primarily in U.S. real estate securities |
| • |
|
Symbols: CSJAX, CSJCX, CSJIX, CSRSX, CSJRX, CSJZX |
COHEN & STEERS REAL ESTATE SECURITIES FUND
| • |
|
Designed for investors seeking total return, investing primarily in U.S. real estate securities |
| • |
|
Symbols: CSEIX, CSCIX, CREFX, CSDIX, CIRRX, CSZIX |
COHEN & STEERS INSTITUTIONAL REALTY SHARES
| • |
|
Designed for institutional investors seeking total return, investing primarily in U.S. real estate securities |
COHEN & STEERS
GLOBAL REALTY SHARES
| • |
|
Designed for investors seeking total return, investing primarily in global real estate equity securities |
| • |
|
Symbols: CSFAX, CSFCX, CSSPX, GRSRX, CSFZX |
COHEN & STEERS INTERNATIONAL REALTY FUND
| • |
|
Designed for investors seeking total return, investing primarily in international (non-U.S.) real estate securities |
| • |
|
Symbols: IRFAX, IRFCX, IRFIX, IRFRX, IRFZX |
COHEN & STEERS REAL ASSETS FUND
| • |
|
Designed for investors seeking total return and the maximization of real returns during inflationary environments by investing primarily in real assets |
| • |
|
Symbols: RAPAX, RAPCX, RAPIX, RAPRX, RAPZX
|
COHEN & STEERS PREFERRED
SECURITIES
AND INCOME FUND
| • |
|
Designed for investors seeking total return (high current income and capital appreciation), investing primarily in preferred and debt securities issued by U.S. and
non-U.S. companies |
| • |
|
Symbols: CPXAX, CPXCX, CPXFX, CPXIX, CPRRX, CPXZX |
COHEN & STEERS LOW DURATION PREFERRED
AND INCOME FUND
| • |
|
Designed for investors seeking high current income and capital preservation by investing in low-duration preferred and other income securities issued by U.S.
and non-U.S. companies |
| • |
|
Symbols: LPXAX, LPXCX, LPXFX, LPXIX, LPXRX, LPXZX |
COHEN & STEERS MLP & ENERGY OPPORTUNITY FUND
| • |
|
Designed for investors seeking total return, investing primarily in midstream energy master limited partnership (MLP) units and related stocks |
| • |
|
Symbols: MLOAX, MLOCX, MLOIX, MLORX, MLOZX |
COHEN & STEERS GLOBAL INFRASTRUCTURE FUND
| • |
|
Designed for investors seeking total return, investing primarily in global infrastructure securities |
| • |
|
Symbols: CSUAX, CSUCX, CSUIX, CSURX, CSUZX |
Distributed by Cohen & Steers Securities, LLC.
Please consider the investment objectives, risks, charges and expenses of any
Cohen & Steers U.S. registered open-end fund carefully before investing. A summary prospectus and prospectus containing this and other information can be obtained by calling 800-330-7348 or by visiting cohenandsteers.com. Please read the summary prospectus and prospectus carefully before investing.
50
COHEN
& STEERS CLOSED-END OPPORTUNITY FUND, INC.
OFFICERS AND DIRECTORS
Joseph M. Harvey
Director, Chair
and Vice President
Adam M. Derechin
Director
Michael G. Clark
Director
George Grossman
Director
Dean A. Junkans
Director
Gerald J. Maginnis
Director
Jane F. Magpiong
Director
Daphne L.
Richards
Director
Ramona Rogers-Windsor
Director
James Giallanza
President and Chief Executive Officer
Albert Laskaj
Treasurer and Chief Financial Officer
Dana A. DeVivo
Secretary and
Chief Legal Officer
Stephen Murphy
Chief Compliance Officer
and Vice President
Douglas R. Bond
Vice President
Yigal D. Jhirad
Vice
President
KEY INFORMATION
Investment Manager and Administrator
Cohen & Steers Capital Management, Inc.
1166 Avenue of the Americas, 30th Floor
New York, NY 10036
(212) 832-3232
Co-administrator and Custodian
State Street Bank and Trust Company
One Congress Street, Suite 1
Boston, MA 02114-2016
Transfer Agent
Computershare
150 Royall Street
Canton, MA 02021
(866) 227-0757
Legal Counsel
Ropes & Gray LLP
1211
Avenue of the Americas
New York, NY 10036
|
|
|
| New York Stock Exchange Symbol: |
|
FOF |
Website: cohenandsteers.com
This report is for shareholder information. This is not a prospectus intended for use in the purchase or sale of Fund shares. Performance data
quoted represent past performance. Past performance is no guarantee of future results and your investment may be worth more or less at the time you sell your shares.
51
eDelivery AVAILABLE
Stop traditional mail delivery;
receive your shareholder reports
and prospectus online.
Sign up at cohenandsteers.com

Annual Report December 31, 2023
Cohen & Steers
Closed-End
Opportunity
Fund (FOF)
FOFAR
Item 2. Code of Ethics.
The Registrant has adopted a code of ethics as defined in Item 2 of Form N-CSR (the “Code of
Ethics”) that applies to its Principal Executive Officer and Principal Financial Officer. The Code of Ethics was in effect during the reporting period. In December 2023, the Registrant amended the Code of Ethics to make immaterial stylistic
updates. The Registrant has not granted any waiver, including an implicit waiver, from a provision of the Code of Ethics, as described in Form N-CSR, during the reporting period. A current copy of the Code of
Ethics is available on the Registrant’s website at https://assets.cohenandsteers.com/assets/content/uploads/Code_of_Ethics_for_Principal_Executive_and_Principal_Financial_Officers_of_the_Funds.pdf. Upon request, a copy of the Code of Ethics can
be obtained free of charge by calling 800-330-7348 or writing to the Secretary of the Registrant, 1166 Avenue of the Americas, 30th Floor, New York, NY 10036.
Item 3. Audit Committee Financial Expert.
The Registrant’s board has determined that Gerald J. Maginnis qualifies as an audit committee financial expert based on his years of
experience in the public accounting profession. The Registrant’s board has determined that Michael G. Clark qualifies as an audit committee financial expert based on his years of experience in the public accounting profession and the investment
management and financial services industry. The Registrant’s board has determined that Ramona Rogers-Windsor qualifies as an audit committee financial expert based on her years of experience in the investment management and financial services
industry. Each of Messrs. Maginnis and Clark and Ms. Rogers-Windsor is a member of the board’s audit committee, and each is independent as such term is defined in Form N-CSR.
Item 4. Principal Accountant Fees and Services.
(a) – (d) Aggregate fees billed to the Registrant for the last two fiscal years ended December 31, 2023 and December 31, 2022
for professional services rendered by the Registrant’s principal accountant were as follows:
|
|
|
|
|
| |
|
2023 |
|
2022 |
| Audit Fees |
|
$49,560 |
|
$48,351 |
| Audit-Related Fees |
|
$0 |
|
$0 |
| Tax Fees |
|
$6,459 |
|
$6,301 |
| All Other Fees |
|
$0 |
|
$0 |
Tax fees were billed in connection with tax compliance services, including the preparation and review of
federal and state tax returns and the computation of corporate and franchise tax amounts.
(e)(1) The Registrant’s audit committee is
required to pre-approve audit and non-audit services performed for the Registrant by the principal accountant. The audit committee also is required to pre-approve
non-audit services performed by the Registrant’s principal accountant for the Registrant’s investment advisor (not including any sub-advisor whose role is
primarily portfolio management and is subcontracted with or overseen by another investment advisor) and/or to any entity controlling, controlled by or under common control with the Registrant’s investment advisor that provides ongoing services
to the Registrant, if the engagement for services relates directly to the operations and financial reporting of the Registrant.
The audit
committee may delegate pre-approval authority to one or more of its members who are independent members of the board of directors of the Registrant. The member or members to whom such authority is delegated shall report any pre-approval decisions to
the audit committee at its next scheduled meeting. The audit committee may not delegate its responsibility to pre-approve services to be performed by the Registrant’s principal accountant to the
investment advisor.
(e)(2) No services included in (b) – (d) above were approved by the audit committee pursuant
to paragraphs (c)(7)(i)(C) of Rule 2-01 of Regulation S-X.
(f) Not applicable.
(g) For
the fiscal years ended December 31, 2023 and December 31, 2022, the aggregate fees billed by the Registrant’s principal accountant for non-audit services rendered to the Registrant and for non-audit services rendered to the Registrant’s investment advisor (not including any sub-advisor whose role is primarily portfolio management and is subcontracted with
or overseen by another investment advisor) and/or to any entity controlling, controlled by or under common control with the Registrant’s investment advisor that provides ongoing services to the Registrant were:
|
|
|
|
|
| |
|
2023 |
|
2022 |
| Registrant |
|
$6,459 |
|
$6,301 |
| Investment Advisor |
|
$0 |
|
$0 |
(h) The Registrant’s audit committee considered whether the provision of
non-audit services that were rendered to the Registrant’s investment advisor (not including any sub-advisor whose role is primarily portfolio management and is
subcontracted with or overseen by another investment advisor) and/or to any entity controlling, controlled by or under common control with the Registrant’s investment advisor that provides ongoing services to the Registrant that were not
required to be pre-approved pursuant to paragraph (c)(7)(ii) of Rule 2-01 of Regulation S-X was compatible with maintaining the
principal accountant’s independence.
(i) Not applicable.
(j) Not applicable.
Item 5. Audit
Committee of Listed Registrants.
The Registrant has a separately designated standing audit committee established in accordance with
Section 3(a)(58)(A) of the Securities Exchange Act of 1934. The members of the committee are Gerald J. Maginnis (chairman), Michael G. Clark and Ramona Rogers-Windsor.
Item 6. Schedule of Investments.
Included in Item 1 above.
Item 7.
Disclosure of Proxy Voting Policies and Procedures for Closed-End Management Investment Companies.
The Registrant has delegated voting of proxies in respect of portfolio holdings to Cohen & Steers Capital Management, Inc.
(“C&S”), in accordance with the policies and procedures set forth below.
COHEN & STEERS CAPITAL MANAGEMENT, INC.
STATEMENT OF POLICIES AND PROCEDURES REGARDING THE VOTING OF SECURITIES
This statement sets forth the policies and procedures that Cohen & Steers Capital Management, Inc. and its affiliated advisors
(“Cohen & Steers”, “we” or “us”) follow in exercising voting rights with respect to securities held in its client portfolios. All proxy-voting rights that are exercised by Cohen & Steers shall be
subject to this Statement of Policy and Procedures.
General Proxy Voting Guidelines
Objectives
Voting rights are an
important component of corporate governance. Cohen & Steers has three overall objectives in exercising voting rights:
| |
• |
|
Responsibility. Cohen & Steers shall seek to ensure that there is an effective means in place
to hold companies accountable for their actions. While management must be accountable to its board, the board must be accountable to a company’s shareholders. Although accountability can be promoted in a variety of ways, protecting shareholder
voting rights may be among our most important tools. |
| |
• |
|
Rationalizing Management and Shareholder Concerns. Cohen & Steers seeks to ensure that the
interests of a company’s management and board are aligned with those of the company’s shareholders. In this respect, compensation must be structured to reward the creation of shareholder value. |
| |
• |
|
Shareholder Communication. Since companies are owned by their shareholders, Cohen & Steers
seeks to ensure that management effectively communicates with its owners about the company’s business operations and financial performance. It is only with effective communication that shareholders will be able to assess the performance of
management and to make informed decisions on when to buy, sell or hold a company’s securities. |
General Principles
In exercising voting rights, Cohen & Steers shall conduct itself in accordance with the general principles set forth
below.
| |
• |
|
The ability to exercise a voting right with respect to a security is a valuable right and, therefore, must be
viewed as part of the asset itself. |
| |
• |
|
In exercising voting rights, Cohen & Steers shall engage in a careful evaluation of issues that may
materially affect the rights of shareholders and the value of the security. |
| |
• |
|
Consistent with general fiduciary duties, the exercise of voting rights shall always be conducted with
reasonable care, prudence and diligence. |
| |
• |
|
In exercising voting rights on behalf of clients, Cohen & Steers shall conduct itself in the same
manner as if Cohen & Steers were the beneficial owner of the securities. |
| |
• |
|
To the extent reasonably possible, Cohen & Steers shall participate in each shareholder voting
opportunity. |
| |
• |
|
Voting rights shall not automatically be exercised in favor of management-supported proposals.
|
| |
• |
|
Cohen & Steers, and its officers and employees, shall never accept any item of value in consideration
of a favorable proxy vote. |
General Guidelines
Set forth below are general guidelines that Cohen & Steers shall follow in exercising proxy voting rights:
| |
• |
|
Prudence. In making a proxy voting decision, Cohen & Steers shall give appropriate
consideration to all relevant facts and circumstances, including the value of the securities to be voted and the likely effect any vote may have on that value. Since voting rights must be exercised on the basis of an informed judgment, investigation
shall be a critical initial step. |
| |
• |
|
Third Party Views. While Cohen & Steers may consider the views of third parties,
Cohen & Steers shall never base a proxy voting decision solely on the opinion of a third party. Rather, decisions shall be based on a reasonable and good faith determination as to how best to maximize shareholder value.
|
| |
• |
|
Shareholder Value. Just as the decision whether to purchase or sell a security is a matter of judgment,
determining whether a specific proxy resolution will increase the market value of a security is a matter of judgment as to which informed parties may differ. In determining how a proxy vote may affect the economic value of a security,
Cohen & Steers shall consider both short-term and long-term views about a company’s business and prospects, especially in light of our projected holding period on the stock (e.g., Cohen & Steers may discount long-term
views on a short-term holding). |
Specific Guidelines
Board and Director Proposals
Election of
Directors
Voting for Director Nominees in Uncontested Elections
Votes on director nominees are made on a case-by-case basis
using a “mosaic” approach, where all factors are considered and no single factor is determinative. In evaluating director nominees, Cohen & Steers considers the following factors:
| • |
|
Whether the nominee attended less than 75 percent of the board and committee meetings without a valid
excuse for the absences; |
| • |
|
Whether the nominee is an inside or affiliated outside director and sits on the audit, compensation, or
nominating committees and/or the full board serves as the audit, compensation, or nominating committees or the company does not have one of these committees; |
| • |
|
Whether the board ignored a significant shareholder proposal that was approved by a majority of the votes cast
in the previous year; |
| • |
|
Whether the board, without shareholder approval, instituted a new poison pill plan, extended an existing plan,
or adopted a new plan upon the expiration of an existing plan during the past year; |
| • |
|
Whether the nominee is the chairman or CEO of a publicly-traded company who serves on more than two
(2) public company boards; |
| • |
|
In the case of nominees other than the chairman or CEO, whether the nominee serves on more than four
(4) public company boards; |
| • |
|
If the nominee is an incumbent director, the length of tenure taking into account tenure limits recommended by
local corporate governance codes1; |
| • |
|
Whether the nominee has a material related party transaction or a material conflict of interest with the
company; |
| • |
|
Whether the nominee (or the entire board) has a record of making poor corporate or strategic decisions or has
demonstrated an overall lack of good business judgment; |
| • |
|
Material failures of governance, stewardship, or fiduciary responsibilities at the company;
|
| • |
|
Materials failures of risk oversight including, but not limited to: |
| |
¡ |
|
Large or serial fines from regulatory bodies; |
| |
¡ |
|
Demonstrably poor risk oversight of environment and social issues, including climate change;
|
| |
¡ |
|
Significant adverse legal judgments or settlements; |
| |
¡ |
|
Hedging of company stock by employees or directors of a company; or |
| |
¡ |
|
Significant pledging of company stock in the aggregate by officers or directors of a company;
|
| |
• |
|
Whether the board has oversight of material climate-related risks and opportunities including, but not limited
to: |
| |
¡ |
|
The transition and physical risks the company faces related to climate change on its operations and
investments in terms of the impact on its business and financial condition, including the company’s related disclosures; |
| |
¡ |
|
How the board identifies, measures and manages such risks; and |
| |
¡ |
|
The board’s oversight of climate-related risk as a part of governance, strategy, risk management, and
metrics and targets; |
| • |
|
Actions related to a nominee’s service on other boards that raise substantial doubt about such
nominee’s ability to effectively oversee management and serve the best interests of shareholders at any company; and |
| • |
|
In the case of a nominee that is the chair of the nominating committee (or other directors on a case-by-case basis), whether the company’s board lacks diversity including, but not limited to, diversity of gender, ethnicity, race and background.
|
Voting for Director Nominees in Contested Elections
Votes in a contested election of directors are evaluated on a
case-by-case basis considering the long-term financial performance of the company relative to its industry management’s track record, the qualifications of the
nominees and other relevant factors.
| 1 |
For example, in the UK, independent directors of publicly traded companies with tenure exceeding nine
(9) years are reclassified as non-independent unless the company can explain why they remain independent. |
Board Composition and Gender Diversity
Cohen & Steers encourages companies to continue to evolve diversity and inclusion practices. Cohen & Steers generally votes
against the chair of the nominating committee (or other directors on a case-by-case basis) at companies where the post-election board contains no female directors if the
board has not included a female director during the last 12 months and the company has not articulated a plan to include a qualified female nominee.
Non-Disclosure of Board Nominees
Cohen & Steers generally votes against the election of director nominees if the names of the nominees are not disclosed prior to the
meeting. However, Cohen & Steers recognizes that companies in certain emerging markets may have legitimate reasons for not disclosing nominee names. In such cases, if a company discloses a legitimate reason why such nominee names have not
been disclosed, Cohen & Steers may vote for the nominees even if nominee names are not disclosed.
Majority Vote Requirement for Directors
(SP)2
Cohen & Steers generally votes for proposals asking the board
to amend the company’s governance documents (charter or bylaws) to provide that director nominees will be elected by the affirmative vote of the majority of votes cast.
Separation of Chairman and CEO (SP)
Cohen & Steers generally votes for proposals to separate the CEO and chairman positions. However, Cohen & Steers does
recognize that under certain circumstances, it may be in the company’s best interest for the CEO and chairman positions to be held by one person.
Independent Chairman (SP)
Cohen & Steers reviews on a case-by-case basis
proposals requiring the chairman’s position to be filled by an independent director taking into account the company’s current board leadership and governance structure, company performance, and any other factors that may be relevant.
Lead Independent Director (SP)
In cases where the CEO and chairman roles are combined or the chairman is not independent, Cohen & Steers votes for the appointment
of a lead independent director.
Board Independence (SP)
Cohen & Steers believes that boards should have a majority of independent directors. Therefore, Cohen & Steers vote for
proposals that require the board to be comprised of a majority of independent directors.
In general, Cohen & Steers considers a
director independent if the director satisfies the independence definition set forth in local corporate governance codes and/or the applicable listing standards of the exchange on which the company’s stock is listed.
In addition, Cohen & Steers generally considers a director independent if the director has no significant financial, familial or
other ties with the company that may pose a conflict and has not been employed by the company in an executive capacity.
| 2 |
“SP” refers to a shareholder proposal. |
Board Size (SP)
Cohen & Steers generally votes for proposals to limit the size of the board to 15 members or less.
Classified Boards (SP)
Cohen & Steers generally votes in favor of proposals to declassify boards of directors. In voting on proposals to declassify a board
of directors, Cohen & Steers evaluates all facts and circumstances, including whether: (i) the current management and board have a history of making good corporate and strategic decisions and (ii) the proposal is in the best
interests of shareholders.
Tiered Boards (non-U.S.)
Cohen & Steers votes in favor of unitary boards as opposed to tiered board structures. Cohen & Steers believes that unitary
boards offer flexibility while, with a tiered structure, there is a risk of upper tier directors becoming remote from the business, while lower tier directors become deprived of contact with outsiders of wider experience. No director should be
excluded from the requirement to submit him/herself for re-election on a regular basis.
Independent
Committees (SP)
Cohen & Steers votes for proposals requesting that a board’s audit, compensation and nominating
committees consist only of independent directors.
Adoption of a Board with Audit Committee Structure (JAPAN)
Cohen & Steers votes for article amendments to adopt a board with an audit committee structure unless the structure obstructs
shareholders’ ability to submit proposals on income allocation related issues or the company already has a 3-committee (U.S. style) structure.
Non-Disclosure of Board Compensation
Cohen & Steers generally votes against the election of director nominees at companies if the compensation paid to such directors is
not disclosed prior to the meeting. However, Cohen & Steers recognizes that companies in certain emerging markets may have legitimate reasons for not disclosing such compensation. In such cases, if a company discloses a legitimate reason
why such compensation should not be disclosed, Cohen & Steers may vote for the nominees even if compensation is not disclosed.
Director
and Officer Indemnification and Liability Protection
Cohen & Steers votes in favor of proposals providing
indemnification for directors and officers for acts conducted in the normal course of business that is consistent with the laws of the jurisdiction of formation. Cohen & Steers also vote in favor of proposals that expand coverage for
directors and officers where, despite an unsuccessful legal defense, the director or officer acted in good faith and in the best interests of the company. Cohen & Steers votes against proposals that would expand indemnification beyond
coverage of legal expenses to coverage of acts, such as gross negligence, that are violations of fiduciary obligations.
Directors’ Liability (non-U.S.)
These proposals ask shareholders to give discharge from responsibility for all
decisions made during the previous financial year. Depending on the country, this resolution may or may not be legally binding, may not release the board from its legal responsibility, and does not necessarily eliminate the possibility of future
shareholder action (although it does make such action more difficult to pursue).
Cohen & Steers will generally vote for the
discharge of directors, including members of the management board and/or supervisory board, unless the board is not fulfilling its fiduciary duties as evidenced by:
| • |
|
A lack of oversight or actions by board members that amount to malfeasance or poor supervision, such as
operating in private or company interest rather than in shareholder interest; |
| • |
|
Any legal issues (e.g., civil/criminal) aimed to hold the board liable for past or current actions that
constitute a breach of trust, such as price fixing, insider trading, bribery, fraud, or other illegal actions; or |
| • |
|
Other egregious governance issues where shareholders are likely to bring legal action against the company or
its directors. |
Directors’ Contracts (non-U.S.)
Best market practice about the appropriate length of directors’ service contracts varies by jurisdiction. As such, Cohen &
Steers votes these proposals on a case-by-case basis taking into account the best interests of the company and its shareholders and local market practice.
Compensation Proposals
Votes
on Executive Compensation. “Say-on-Pay” votes are determined on a
case-by-case basis taking into account the reasonableness of the company’s compensation structure and the adequacy of the disclosure.
COHEN & STEERS GENERALLY VOTES AGAINST IN
CIRCUMSTANCES WHERE THERE ARE AN UNACCEPTABLE NUMBER OF PROBLEMATIC PAY PRACTICES
INCLUDING:
| • |
|
Poor linkage between executive pay and company performance and profitability; |
| • |
|
The presence of objectionable structural features in the compensation plan, such as excessive perquisites,
golden parachutes, tax-gross up provisions, and automatic benchmarking of pay in the top half of the peer group; and |
| • |
|
A lack of proportionality in the plan relative to the company’s size and peer group.
|
Additional Disclosure of Executive and Director Pay (SP). Cohen & Steers generally votes for
shareholder proposals that seek additional disclosure of executive and director pay information.
Frequency of Shareholder Votes on
Executive Compensation. Cohen & Steers generally votes for annual shareholder advisory votes to approve executive compensation.
Golden Parachutes. In general, Cohen & Steers votes against golden parachutes because they impede potential takeovers that
shareholders should be free to consider. Cohen & Steers opposes the use of employment agreements that result in excessive cash payments and generally withhold our vote at the next shareholder meeting for directors who approved golden
parachutes.
In the context of an acquisition, merger, consolidation, or proposed sale, Cohen & Steers votes on a case-by-case basis on proposals to approve golden parachute payments. Factors that may result in a vote against include:
| • |
|
Potentially excessive severance payments; |
| • |
|
Agreements that include excessive excise tax gross-up provisions;
|
| • |
|
Single-trigger payments upon a change in control (“CIC”), including cash payments and the
acceleration of performance-based equity despite the failure to achieve performance measures; |
| • |
|
Single-trigger vesting of equity based on a definition of change in control that requires only shareholder
approval of the transaction (rather than consummation); |
| • |
|
Recent amendments or other changes that may make packages so attractive as to encourage transactions that may
not be in the best interests of shareholders; or |
| • |
|
The company’s assertion that a proposed transaction is conditioned on shareholder approval of the golden
parachute advisory vote. |
Non-Executive Director Remuneration (non-U.S.). Cohen & Steers evaluates these proposals on a case-by-case basis taking into account the remuneration mix and
the adequacy of the disclosure. Cohen & Steers believes that non-executive directors should be compensated with a mix of cash and equity to align their interests with the interests of shareholders.
The details of such remuneration should be fully disclosed and provided with sufficient time for us to consider our vote.
Approval of
Annual Bonuses for Directors and Statutory Auditors (JAPAN). Cohen & Steers generally supports the payment of annual bonuses to directors and statutory auditors except in cases of scandals or extreme underperformance.
Equity Compensation Plans. Votes on proposals related to compensation plans are determined on a case-by-case basis taking into account plan features and equity grant practices, where positive factors may counterbalance negative factors (and vice versa), as evaluated based on three pillars:
| • |
|
Plan Cost: the total estimated cost of the company’s equity plans relative to industry/market cap peers
measured by the company’s estimated shareholder value transfer (SVT) in relation to peers, considering: |
| |
• |
|
SVT based on new shares requested plus shares remaining for future grants, plus outstanding
unvested/unexercised grants; and |
| |
• |
|
SVT based only on new shares requested plus shares remaining for future grants. |
| |
• |
|
Automatic single-trigger award vesting upon a CIC; |
| |
• |
|
Discretionary vesting authority; |
| |
• |
|
Liberal share recycling on various award types; and |
| |
• |
|
Minimum vesting period for grants made under the plan. |
| |
• |
|
The company’s three year burn rate relative to its industry/market cap peers; |
| |
• |
|
Vesting requirements for most recent CEO equity grants (3-year
look-back); |
| |
• |
|
The estimated duration of the plan based on the sum of shares remaining available and the new shares requested
divided by the average annual shares granted in the prior three years; |
| |
• |
|
The proportion of the CEO’s most recent equity grants/awards subject to performance conditions;
|
| |
• |
|
Whether the company maintains a claw-back policy; and |
| |
• |
|
Whether the company has established post exercise/vesting shareholding requirements. |
Cohen & Steers generally votes against compensation plan proposals if the combination of factors indicates that the plan, overall is
not, in the interests of shareholders, or if any of the following apply:
| • |
|
Awards may vest in connection with a liberal CIC; |
| • |
|
The plan would permit re-pricing or cash buyout of underwater options
without shareholder approval; |
| • |
|
The plan is a vehicle for problematic pay practices or a pay-for-performance disconnect; or |
| • |
|
Any other plan features that are determined to have a significant negative impact on shareholder interests.
|
Equity Compensation Plans (non-U.S.). Cohen & Steers evaluates
these proposals on a case-by-case basis. Share option plans should be clearly explained and fully disclosed to both shareholders and participants and put to shareholders
for approval. Each director’s share options should be detailed, including exercise prices, expiration dates and the market price of the shares at the date of exercise. They should take into account appropriate levels of dilution. Options should
vest in reference to challenging performance criteria, which are disclosed in advance. Share options should be fully expensed so that shareholders can assess their true cost to the company. The assumptions and methodology behind the expensing
calculation should also be disclosed to shareholders.
Long-Term Incentive Plans (non-U.S.). A long-term
incentive plan refers to any arrangement, other than deferred bonuses and retirement benefit plans, which require one or more conditions in respect of service and/or performance to be satisfied over more than one financial year.
Cohen & Steers evaluates these proposals on a
case-by-case basis. Cohen & Steers generally votes in favor of plans with robust incentives and challenging performance criteria that are fully disclosed to
shareholders in advance and vote against plans that are excessive or contain easily achievable performance metrics or where there is excessive discretion delegated to remuneration committees. Cohen & Steers would expect remuneration
committees to explain why criteria are considered to be challenging and how they align the interests of shareholders with the interests of the plan participants. Cohen & Steers will also vote against proposals that lack sufficient
disclosure.
Transferable Stock Options. Cohen & Steers evaluates on a case-by-case basis proposals to grant transferable stock options or otherwise permit the transfer of outstanding stock options, including the cost of the proposal and alignment with shareholder interests.
Approval of Cash or Cash-and-Stock Bonus Plans.
Cohen & Steers votes to approve cash or cash-and-stock bonus plans that seek to exempt executive compensation from limits on deductibility imposed by
Section 162(m) of the Internal Revenue Code.
Employee Stock Purchase Plans. Cohen & Steers votes for the approval of
employee stock purchase plans, although Cohen & Steers generally believes the discounted purchase price should not exceed 15% of the current market price.
401(k) Employee Benefit Plans. Cohen & Steers votes for proposals to implement a 401(k) savings plan for employees.
Pension Arrangements (non-U.S.). Cohen & Steers evaluates these proposals on a case-by-case basis. Pension arrangements should be transparent and cost-neutral to shareholders. Cohen & Steers believes it is inappropriate for executives to
participate in pension arrangements that are materially different than those offered to other employees (such as continuing to participate in a final salary arrangement when employees have been transferred to a money purchase plan). One-off payments into individual director’s pension plans, changes to pension entitlements, and waivers concerning early retirement provisions must be fully disclosed and justified to shareholders.
Stock Ownership Requirements (SP). Cohen & Steers supports proposals requiring senior executives and directors to hold a
minimum amount of stock in a company (often expressed as a percentage of annual compensation), which may include restricted stock or restricted stock units.
Stock Holding Periods (SP). Cohen & Steers generally votes against proposals requiring executives to hold stock received upon
option exercise for a specific period of time.
Recovery of Incentive Compensation (SP). Cohen & Steers generally votes
for proposals to recover incentive bonuses or other incentive payments made to senior executives if it is later determined that fraud, misconduct, or negligence significantly contributed to a restatement of financial results that led to the award of
incentive compensation.
Capital Structure Changes and Anti-Takeover Proposals
Increase to Authorized Shares. Cohen & Steers generally votes for increases in authorized shares, provided that the increase
is not greater than three times the number of shares outstanding and reserved for issuance (including shares reserved for stock-related plans and securities convertible into common stock, but not shares reserved for any poison pill plan).
Blank Check Preferred Stock. Cohen & Steers generally votes against proposals authorizing the creation of new classes of
preferred stock without specific voting, conversion, distribution and other rights, and proposals to increase the number of authorized blank check preferred shares. Cohen & Steers may vote in favor of these proposals if Cohen &
Steers receives reasonable assurances that (i) the preferred stock was
authorized by the board for legitimate capital formation purposes and not for anti-takeover purposes, and (ii) no preferred stock will be issued with voting power that is disproportionate to
the economic interests of the preferred stock. These representations should be made either in the proxy statement or in a separate letter from the company to us.
Pre-Emptive Rights. Cohen & Steers generally votes against the issuance of equity
shares with pre-emptive rights. However, Cohen & Steers may vote for shareholder pre-emptive rights where such
pre-emptive rights are necessary taking into account the best interests of the company’s shareholders. In addition, we acknowledge that international local practices may call for shareholder pre-emptive rights when a company seeks authority to issue shares (e.g., UK authority for the issuance of only up to 5% of outstanding shares without pre-emptive
rights). While Cohen & Steers prefers that companies be permitted to issue shares without pre-emptive rights, in deference to international local practices, Cohen & Steers will approve
issuance requests with pre-emptive rights.
Dual Class Capitalizations.
Because classes of common stock with unequal voting rights limit the rights of certain shareholders, Cohen & Steers votes against the adoption of a dual or multiple class capitalization structure. Cohen & Steers supports the one-share, one-vote principle for voting.
Restructurings/Recapitalizations. Cohen & Steers reviews proposals to increase common and/or preferred shares and to issue
shares as part of a debt restructuring plan on a case-by-case basis. In voting, Cohen & Steers considers the following:
| • |
|
Dilution: how much will the ownership interest of existing shareholders be reduced, and how extreme will
dilution to any future earnings be? |
| • |
|
Change in control: will the transaction result in a change in control of the company? |
| • |
|
Bankruptcy: generally approve proposals that facilitate debt restructurings unless there are clear signs of
self-dealing or other abuses. |
Share Repurchase Programs. Cohen & Steers generally votes in favor of
such programs where the repurchase would be in the long-term best interests of shareholders and where we believe that this is a good use of the company’s cash.
Cohen & Steers will vote against such programs when shareholders’ interests could be better served by deployment of the cash for
alternative uses, or where the repurchase is a defensive maneuver or an attempt to entrench management.
Targeted Share Placements
(SP). Cohen & Steers votes these proposals on a case-by-case basis. These proposals ask companies to seek shareholder approval before placing 10% or more of
their voting stock with a single investor. The proposals are typically in reaction to the placement of a large block of voting stock in an employee stock option plan, parent capital fund or with a single friendly investor, with the aim of protecting
the company against a hostile tender offer.
Shareholder Rights Plans. Cohen & Steers reviews proposals to ratify
shareholder rights plans (poison pills) on a case-by-case basis taking into consideration the length of the plan.
Shareholder Rights Plans (JAPAN). Cohen & Steers reviews proposals on a case-by-case basis examining not only the features of the plan itself but also factors including share price movements, shareholder composition, board composition, and the company’s announced plans to
improve shareholder value.
Reincorporation Proposals. Proposals to change a company’s jurisdiction of incorporation are
examined on a case-by-case basis. When evaluating such proposals, Cohen & Steers reviews management’s rationale for the proposal, changes to the
charter/bylaws, and differences in the applicable laws governing the companies.
Voting on State Takeover Statutes (SP). Cohen & Steers reviews on a case-by-case basis proposals to opt in or out of state takeover statutes (including control share acquisition statutes, control share
cash-out statutes, freeze-out provisions, fair price provisions, stakeholder laws, poison pill endorsements, severance pay and labor contract provisions and disgorgement
provisions). In voting on these proposals, Cohen & Steers takes into account whether the proposal is in the long-term best interests of the company and whether it would be in the best interests of the company to thwart a shareholder’s
attempt to control the board of directors.
Mergers and Corporate Restructurings
Mergers and Acquisitions. Votes on mergers and acquisitions are considered on a case-by-case basis, taking into account the anticipated financial and operating benefits, offer price (cost vs. premium), prospects of the combined companies, how the deal was negotiated and changes in
corporate governance and their impact on shareholder rights.
Cohen & Steers votes against proposals that require a
super-majority of shareholders to approve a merger or other significant business combination.
Nonfinancial Effects of a Merger or
Acquisition. Some companies have proposed charter provisions that specify that the board of directors may examine the nonfinancial effects of a merger or acquisition on the company. This provision would allow the board to evaluate the impact a
proposed change in control would have on employees, host communities, suppliers and/or others. Cohen & Steers generally vote against proposals to adopt such charter provisions. Directors should base their decisions solely on the financial
interests of the shareholders.
Spin-offs. Cohen & Steers evaluates spin-offs on a case-by-case basis taking into account the tax and regulatory advantages, planned use of sale proceeds, market focus, and managerial incentives.
Asset Sales. Cohen & Steers evaluates asset sales on a
case-by-case basis taking into account the impact on the balance sheet/working capital, value received for the assets, and potential elimination of diseconomies.
Liquidations. Cohen & Steers evaluates liquidations on a
case-by-case basis taking into account management’s efforts to pursue other alternatives, appraisal value of the assets, and the compensation plan for executives
managing the liquidation.
Issuance of Debt (non-U.S.). Cohen & Steers evaluates
these proposals on a case-by-case basis. Reasons for increased bank borrowing powers are numerous and varied, including allowing for normal growth of the company, the
financing of acquisitions, and allowing increased financial leverage. Management may also attempt to borrow as part of a takeover defense. Cohen & Steers generally votes in favor of proposals that will enhance a company’s long-term
prospects. Cohen & Steers votes against any uncapped or poorly-defined increase in bank borrowing powers or borrowing limits, issuances that would result in the company reaching an unacceptable level of financial leverage or a material
reduction in shareholder value, or where such borrowing is expressly intended as part of a takeover defense.
Ratification of Auditors
Cohen & Steers generally votes for proposals to ratify auditors, auditor remuneration and/or proposals authorizing the board to fix
audit fees, unless:
| • |
|
an auditor has a financial interest in or association with the company, and is therefore not independent;
|
| • |
|
there is reason to believe that the independent auditor has rendered an opinion that is neither accurate nor
indicative of the company’s financial position; |
| • |
|
the name of the proposed auditor and/or fees paid to the audit firm are not disclosed by the company prior to
the meeting; |
| • |
|
the auditors are being changed without explanation; or |
| • |
|
fees paid for non-audit related services are excessive and/or exceed
fees paid for audit services or limits set by local best practice recommendations or law. |
Where fees for non-audit services include fees related to significant one-time capital structure events, initial public offerings, bankruptcy emergence, and spinoffs, and the company makes
public disclosure of the amount and nature of those fees, then such fees may be excluded from the non-audit fees considered in determining whether non-audit related fees
are excessive.
Auditor Rotation
Cohen & Steers evaluates auditor rotation proposals on a
case-by-case basis taking into account the following factors: the tenure of the audit firm; establishment and disclosure of a review process whereby the auditor is
regularly evaluated for both audit quality and competitive pricing; length of the rotation period advocated in the proposal; and any significant audit related issues.
Auditor Indemnification
Cohen & Steers generally votes against auditor indemnification and limitation of liability. However, Cohen & Steers
recognizes there may be situations where indemnification and limitations on liability may be appropriate.
Annual Accounts and Reports (non-U.S.)
Annual reports and accounts should be detailed and transparent and should be
submitted to shareholders for approval in a timely manner as prescribed by law. They should meet accepted reporting standards such as those prescribed by the International Accounting Standards Board (IASB).
Cohen & Steers generally approves proposals relating to the adoption of annual accounts provided that:
| |
• |
|
The report has been examined by an independent external accountant and the accuracy of material items in the
report is not in doubt; |
| |
• |
|
The report complies with legal and regulatory requirements and best practice provisions in local markets;
|
• the company discloses which portion of the remuneration paid to the external accountant relates
to auditing activities and which portion relates to non-auditing advisory assignments;
| |
• |
|
A report on the implementation of risk management and internal control measures is incorporated, including an in-control statement from company management; |
| |
• |
|
A report should include a statement of compliance with relevant codes of best practice for markets where they
exist (e.g., for UK companies a statement of compliance with the Corporate Governance Code should be made, together with detailed explanations about any area(s) of non-compliance);
|
| |
• |
|
A conclusive response is given to all queries from shareholders; and |
| |
• |
|
Other concerns about corporate governance have not been identified. |
Appointment of Internal Statutory Auditor (JAPAN)
Cohen & Steers evaluates these proposals on a
case-by-case basis taking into account the work history of each nominee. If the nominee is designated as independent but has worked the majority of his or her career for
one of the company’s major shareholders, lenders, or business partners, Cohen & Steers considers the nominee affiliated and will withhold support.
Shareholder Access and Voting Proposals
Proxy Access. Cohen & Steers reviews proxy access proposals on a case-by-case basis taking into account the parameters of proxy access use in light of a company’s specific circumstances. Cohen & Steers generally supports proposals that provide shareholders
with a reasonable opportunity to use the right without stipulating overly restrictive or onerous parameters for use and also provide assurances that the mechanism will not be subject to abuse by short-term investors, investors without a substantial
investment in the company or investors seeking to take control of the board.
Bylaw Amendments. Cohen & Steers votes on a case-by-case basis on proposals requesting companies grant shareholders the ability to amend bylaws. Similar to proxy access, Cohen & Steers generally supports
proposals that provide assurances that this right will not be subject to abuse by short-term investors or investors without a substantial investment in a company.
Reimbursement of Proxy Solicitation Expenses (SP). In the absence of compelling reasons, Cohen & Steers will generally
not support such proposals.
Shareholder Ability to Call Special Meetings (SP). Cohen & Steers votes on a case-by-case basis on proposals requesting companies amend their governance documents (bylaws and/or charter) in order to allow shareholders to call special meetings.
Shareholder Ability to Act by Written Consent (SP). Cohen & Steers generally votes against proposals to allow or facilitate
shareholder action by written consent to provide reasonable protection of minority shareholder rights.
Shareholder Ability to Alter
the Size of the Board. Cohen & Steers generally votes for proposals that seek to fix the size of the board and vote against proposals that give the board the ability to alter the size of the board without shareholder approval. While
Cohen & Steers recognizes the importance of such proposals, these proposals may be set forth in order to promote the agenda(s) of certain special interest groups and could be disruptive to management of the company.
Cumulative Voting (SP). Having the ability to cumulate votes for the election of directors (i.e., to cast more than one vote for
a director) generally increases shareholders’ rights to effect change in the management of a company. However, Cohen & Steers acknowledges that cumulative voting promotes special candidates who may not represent the interests of all,
or even a majority, of shareholders. Therefore, when voting on proposals to institute cumulative voting, Cohen & Steers evaluates all facts and circumstances surrounding such proposal and generally vote against cumulative voting where the
company has good corporate governance practices in place, including majority voting for director elections and a de-classified board.
Supermajority Vote Requirements (SP). Cohen & Steers generally supports proposals that seek to lower supermajority voting
requirements.
Confidential Voting. Cohen & Steers votes for proposals requesting that companies adopt confidential
voting, use independent tabulators, and use independent inspectors of election as long as such proposals permit management to request that dissident groups honor its confidential voting policy in the case of proxy contests.
Virtual Shareholder Meetings (SP). Cohen & Steers generally votes for management proposals allowing for the convening of
shareholder meetings by electronic means, so long as they do not preclude in-person meetings and companies allow for comparable rights and opportunities for shareholders to participate electronically as they
would have during an in-person meeting.
Date/Location of Meeting (SP). Cohen & Steers votes against shareholder proposals
to change the date or location of the shareholders’ meeting.
Adjourn Meeting if Votes Are Insufficient. Cohen &
Steers generally votes against open-end requests for adjournment of a shareholder meeting. However, where management specifically states the reason for requesting an adjournment and the requested
adjournment is necessary to permit a proposal that would otherwise be supported under this policy to be carried out, the adjournment request will be supported.
Disclosure of Shareholder Proponents (SP). Cohen & Steers votes for shareholder proposals requesting that companies disclose
the names of shareholder proponents. Shareholders may wish to contact the proponents of a shareholder proposal for additional information.
Environmental and Social Proposals
Cohen & Steers believes that well-managed companies should be identifying, evaluating and assessing environmental and social issues
and, where material to its business, managing exposure to environmental and social risks related to these issues. When considering management or shareholder proposals relating to these issues, because of the diverse nature of environmental and
social proposals, Cohen & Steers evaluates these proposals on a case-by-case basis. The principles guiding our evaluation of these proposals include, but are
not limited to:
| |
• |
|
The current level of publicly available disclosure from the company or other publicly available sources,
including if the company already discloses similar information through existing reports or policies; |
| |
• |
|
Whether implementation of a proposal is likely to enhance or protect shareholder value; |
| |
• |
|
Whether a proposal can be implemented at a reasonable cost; |
| |
• |
|
Whether the information requested concerns business issues that relate to a meaningful percentage of the
company’s business; |
| |
• |
|
The degree to which the company’s stated position on the issues raised in the proposal could affect its
reputation or sales; |
| |
• |
|
Whether the company has already responded in some appropriate manner to the request embodied in the proposal;
|
| |
• |
|
What other companies in the relevant industry have done in response to the issue addressed in the proposal;
and |
| |
• |
|
Whether implementation would reveal proprietary or confidential information that could place the company at a
competitive disadvantage. |
Environmental Proposals (SP). Cohen & Steers acknowledges that environmental
considerations can pose significant investment risks and opportunities. Therefore, Cohen & Steers generally votes in favor of proposals requesting a company disclose information that will aid in the determination of material environmental
issues impacting the company and, where material to its business, how the company is managing exposure to environmental risks related to these issues, taking into consideration the following factors:
| |
• |
|
The general factors listed above; and |
| |
• |
|
Whether the issues presented have already been effectively dealt with through governmental regulation or
legislation. |
In particular in relation to climate-related risk and opportunities material to its business, we
expect companies to help their investors understand how they may be impacted by such risk and opportunities, and how these factors are considered within strategy in a manner consistent with the company’s business model and sector. The
principles guiding our evaluation of these proposals are:
| |
• |
|
The general factors listed above; |
| |
• |
|
The transition and physical risks the company faces related to climate change on its operations and investment
in terms of the impact on its business and financial condition, including the company’s related disclosures; |
| |
• |
|
How the company identifies, measures and manages such risks; and |
| |
• |
|
The company’s approach to climate-related risk as part of governance, strategy, risk management, and
metrics and targets. |
Social Proposals (SP). Cohen & Steers acknowledges that social considerations can
pose significant risks and opportunities. There, Cohen & Steers generally votes in favor of proposals requesting a company disclose information that will aid in the determination of material social issues impacting the company and, where
material to its business, how the company is managing exposure to social risks related to these issues.
Cohen & Steers believes
board and workforce diversity are beneficial to the decision-making process and can enhance long-term profitability. Therefore, Cohen & Steers generally votes in favor of proposals that seek to increase board and workforce diversity
including, but not limited to, diversity of gender, ethnicity, race and background. Cohen & Steers votes all other social proposals on a case-by-case basis,
including, but not limited to, proposals related to political and charitable contributions, lobbying, and gender equality and the gender pay gap.
Miscellaneous Proposals
Bundled Proposals. Cohen & Steers reviews on a
case-by-case basis bundled or “conditioned” proposals. For items that are conditioned upon each other, Cohen & Steers examines the benefits and costs
of the bundled items. In instances where the combined effect of the conditioned items is not in shareholders’ best interests, Cohen & Steers votes against such proposals. If the combined effect is positive, Cohen & Steers
supports such proposals. In the case of bundled director proposals, Cohen & Steers will vote for the entire slate only if Cohen & Steers would have otherwise voted for each director on an individual basis.
Other Business. Cohen & Steers generally votes against proposals to approve other business where Cohen & Steers
cannot determine the exact nature of the proposal(s) to be voted on.
Item 8. Portfolio Managers of
Closed-End Investment Companies.
Information pertaining to the portfolio manager of the
Registrant, as of March 8, 2024, is set forth below.
|
|
|
| Douglas R. Bond
• Vice President
• Portfolio manager since inception |
|
Executive Vice President of C&S since 2004. |
| Jeffrey Palma
• Portfolio manager since April 2022 |
|
Senior Vice President of C&S since 2021. |
C&S utilizes a team-based approach in managing the Registrant. Effective April 29,
2022, Jeffrey Palma was added as portfolio manager of the Fund. Douglas Bond continues to serve as portfolio manager of the Fund. Mr. Bond and Mr. Palma direct and supervise the execution of the Registrant’s investment strategy, and
lead and guide the other members of the team.
Each portfolio manager listed above manage other investment companies and/or
investment vehicles and accounts in addition to the Registrant. The following tables show, as of December 31, 2023, the number of other accounts the portfolio managers managed in each of the listed categories and the total assets in the
accounts managed within each category. The portfolio managers do not receive performance-based fees with respect to any of the registered investment companies, other pooled investment vehicles or other accounts that they manage.
|
|
|
|
|
|
|
| Douglas Bond |
|
Number of accounts |
|
Total assets |
|
|
|
|
| • Registered investment companies |
|
0 |
|
$ |
0 |
|
|
|
|
| • Other pooled investment vehicles |
|
0 |
|
$ |
0 |
|
|
|
|
| • Other accounts |
|
2 |
|
$ |
239,987,679 |
|
|
|
|
| Jeffrey Palma |
|
Number of accounts |
|
Total assets |
|
|
|
|
| • Registered investment companies |
|
2 |
|
$ |
888,344,894 |
|
|
|
|
| • Other pooled investment vehicles |
|
2 |
|
$ |
375,987,188 |
|
|
|
|
| • Other accounts |
|
3 |
|
$ |
449,785,827 |
|
Share Ownership. The following table indicates the dollar range of securities of the Registrant owned
by the Registrant’s portfolio manager as of December 31, 2023:
|
|
|
| |
|
Dollar Range of Securities
Owned |
|
Douglas R. Bond |
|
$100,001–$500,000 |
|
Jeffrey Palma |
|
$10,001–$50,000 |
Conflicts of Interest. It is possible that conflicts of interest may arise in connection with the
portfolio manager’s management of the Registrant’s investments on the one hand and the investments of other accounts or vehicles for which the portfolio managers are responsible on the other. For example, a portfolio manager may have
conflicts of interest in allocating management time, resources and investment opportunities among the Registrant and the other accounts or vehicles he advises. In addition, due to differences in the investment strategies or restrictions among the
Registrant and the other accounts, a portfolio manager may take action with respect to another account that differs from the action taken with respect to the Registrant.
In some cases, another account managed by a portfolio manager may provide more revenue to the Registrant’s investment advisor. While this
may appear to create additional conflicts of interest for the portfolio manager in the allocation of management time, resources and investment opportunities, the investment advisor strives to ensure that portfolio managers endeavor to exercise their
discretion in a manner that is equitable to all interested persons. In this regard, in the absence of specific account-related impediments (such as client-imposed restrictions or lack of available cash), it is the policy of the investment advisor to
allocate investment ideas pro rata to all accounts with the same primary investment objective.
In addition, certain of the portfolio managers may from time to time manage one or more accounts
on behalf of the Registrant’s investment advisor and its affiliated companies (the “CNS Accounts”). Certain securities held and traded in the CNS Accounts also may be held and traded in one or more client accounts. It is the policy of
the investment advisor however not to put the interests of the CNS Accounts ahead of the interests of client accounts. The investment advisor may aggregate orders of client accounts with those of the CNS Accounts; however, under no circumstances
will preferential treatment be given to the CNS Accounts. For all orders involving the CNS Accounts, purchases or sales will be allocated prior to trade placement, and orders that are only partially filled will be allocated across all accounts in
proportion to the shares each account, including the CNS Accounts, was designated to receive prior to trading. As a result, it is expected that the CNS Accounts will receive the same average price as other accounts included in the aggregated order.
Shares will not be allocated or re-allocated to the CNS Accounts after trade execution or after the average price is known. In the event so few shares of an order are executed that a pro-rata allocation is not practical, a rotational system of allocation may be used; however, the CNS Accounts will never be part of that rotation or receive shares of a partially filled order other than on a pro-rata basis.
Because certain CNS Accounts are managed with a cash management objective, it is
possible that a security will be sold out of the CNS Accounts but continue to be held for one or more client accounts. In situations when this occurs, such security will remain in a client account only if the portfolio manager, acting in its
reasonable judgment and consistent with its fiduciary duties, believes this is appropriate for, and consistent with the objectives and profile of, the client account.
Advisor Compensation Structure. Compensation of the investment advisor’s portfolio managers and other investment professionals has
three primary components: (1) a base salary, (2) an annual cash bonus and (3) long-term stock-based compensation consisting generally of restricted stock units of the investment advisor’s parent, CNS. The investment
advisor’s investment professionals, including the portfolio managers, also receive certain retirement, insurance and other benefits that are broadly available to all of its employees. Compensation of the investment advisor’s investment
professionals is reviewed primarily on an annual basis. Cash bonuses, stock-based compensation awards, and adjustments in base salary are typically paid or put into effect in the January following the fiscal
year-end of CNS.
Method to Determine Compensation. The Registrant’s investment
advisor compensates its portfolio managers based primarily on the total return performance of funds and accounts managed by the portfolio manager versus appropriate peer groups or benchmarks. C&S uses a variety of benchmarks to evaluate each
portfolio managers’ performance for compensation purposes, including the Morningstar U.S. All Taxable Ex-Foreign Equity Index and other broad based indexes based on the asset classes managed by each
portfolio manager. In evaluating the performance of a portfolio manager, primary emphasis is normally placed on one- and three-year performance, with secondary consideration of performance over longer periods
of time. Performance is evaluated on a pre-tax and pre-expense basis. In addition to rankings within peer groups of funds on the basis of absolute performance,
consideration may also be given to risk-adjusted performance. For funds and accounts with a primary investment objective of high current income, consideration will also be given to the fund’s and account’s success in achieving this
objective. For portfolio managers responsible for multiple funds and accounts, investment performance is evaluated on an aggregate basis. The investment advisor has three funds or accounts with performance-based advisory fees. Portfolio managers are
also evaluated on the basis of their success in managing their dedicated team of analysts. Base compensation for portfolio managers of the Advisor varies in line with the portfolio manager’s seniority and position with the firm.
Salaries, bonuses and stock-based compensation are also influenced by the operating performance
of the Registrant’s investment advisor and CNS. While the annual salaries of the Advisor’s portfolio managers are fixed, cash bonuses and stock based compensation may fluctuate significantly from year to year, based on changes in manager
performance and other factors.
Item 9. Purchases of Equity Securities by Closed-End Management
Investment Company and Affiliated Purchasers.
None.
Note: On December 12, 2023, the Board of Directors of the Fund approved continuation of the delegation of its authority to
management to effect repurchases, pursuant to management’s discretion and subject to market conditions and investment considerations, of up to 10% of the Fund’s common shares outstanding (“Share Repurchase Program”) as of
January 1, 2024 through December 31, 2024.
Item 10. Submission of Matters to a Vote of Security Holders.
There have been no material changes to the procedures by which shareholders may recommend nominees to the Registrant’s Board implemented
after the Registrant last provided disclosure in response to this Item.
Item 11. Controls and Procedures.
| (a) |
The Registrant’s principal executive officer and principal financial officer have concluded that the
Registrant’s disclosure controls and procedures are reasonably designed to ensure that information required to be disclosed by the Registrant in this Form N-CSR was recorded, processed, summarized and
reported within the time periods specified in the Securities and Exchange Commission’s rules and forms, based upon such officers’ evaluation of these controls and procedures as of a date within 90 days of the filing date of this report.
|
| (b) |
There were no changes in the Registrant’s internal control over financial reporting that occurred
during the period covered by this report that have materially affected, or are reasonably likely to materially affect, the Registrant’s internal control over financial reporting. |
Item 12. Disclosure of Securities Lending Activities for Closed-End Management Investment Companies.
| (a) |
The Fund did not engage in any securities lending activity during the fiscal year ended December 31,
2023. |
| (b) |
The Fund did not engage in any securities lending activity and did not engage a securities lending agent
during the fiscal year ended December 31, 2023. |
Item 13. Exhibits.
(a)(1) Not applicable.
(a) (2)
Certifications of principal executive officer and principal financial officer as required by Rule 30a-2(a) under the Investment Company Act of 1940.
(a)(3) Not applicable.
(a)(4) Not applicable.
(b) Certifications of principal executive officer and principal financial officer as required by Rule 30a-2(b)
under the Investment Company Act of 1940.
(c) Registrant’s notices to shareholders pursuant to
Registrant’s exemptive order granting an exemption from Section 19(b) of the 1940 Act and Rule 19b-1 thereunder regarding distributions pursuant to the Registrant’s Managed Distribution Plan.
SIGNATURES
Pursuant to the requirements of the Securities Exchange Act of 1934 and the Investment Company Act of 1940, the Registrant has duly caused
this report to be signed on its behalf by the undersigned, thereunto duly authorized.
COHEN & STEERS
CLOSED-END OPPORTUNITY FUND, INC.
|
|
|
|
|
|
|
|
|
|
By: |
|
/s/ James Giallanza |
|
|
|
|
Name: James Giallanza
Title: Principal Executive Officer
(President and Chief Executive Officer) |
|
|
|
|
|
Date: |
|
March 8, 2024 |
Pursuant to the requirements of the Securities Exchange Act of 1934 and the Investment Company Act of 1940,
this report has been signed below by the following persons on behalf of the Registrant and in the capacities and on the dates indicated.
|
|
|
|
|
|
|
|
|
|
By: |
|
/s/ James Giallanza |
|
|
|
|
Name: James Giallanza
Title: Principal Executive Officer
(President and Chief Executive Officer) |
|
|
|
|
|
By: |
|
/s/ Albert Laskaj |
|
|
|
|
Name: Albert Laskaj
Title: Principal Financial Officer
(Treasurer and Chief Financial Officer) |
|
|
|
|
Date: March 8, 2024 |
EX-99.CERT
EXHIBIT 13 (a)(2)
RULE 30a-2(a) CERTIFICATIONS
I, James Giallanza, certify that:
| 1. |
I have reviewed this report on Form N-CSR of Cohen & Steers
Closed-End Opportunity Fund, Inc.; |
| 2. |
Based on my knowledge, this report does not contain any untrue statement of a material fact or omit to state
a material fact necessary to make the statements made, in light of the circumstances under which such statements were made, not misleading with respect to the period covered by this report; |
| 3. |
Based on my knowledge, the financial statements, and other financial information included in this report,
fairly present in all material respects the financial condition, results of operations, changes in net assets, and cash flows (if the financial statements are required to include a statement of cash flows) of the Registrant as of, and for, the
periods presented in this report; |
| 4. |
The Registrant’s other certifying officer and I are responsible for establishing and maintaining
disclosure controls and procedures (as defined in Rule 30a-3(c) under the Investment Company Act of 1940) and internal control over financial reporting (as defined in Rule
30a-3(d) under the Investment Company Act of 1940) for the Registrant and have: |
| |
(a) |
designed such disclosure controls and procedures, or caused such disclosure controls and procedures to be
designed under our supervision, to ensure that material information relating to the Registrant, including its consolidated subsidiaries, is made known to us by others within those entities, particularly during the period in which this report is
being prepared; |
| |
(b) |
designed such internal control over financial reporting, or caused such internal control over financial
reporting to be designed under our supervision, to provide reasonable assurance regarding the reliability of financial reporting and the preparation of financial statements for external purposes in accordance with generally accepted accounting
principles; |
| |
(c) |
evaluated the effectiveness of the Registrant’s disclosure controls and procedures and presented in
this report our conclusions about the effectiveness of the disclosure controls and procedures, as of a date within 90 days prior to the filing date of this report based on such evaluation; and |
| |
(d) |
disclosed in this report any change in the Registrant’s internal control over financial reporting that
occurred during the period covered by this report that has materially affected, or is reasonably likely to materially affect, the Registrant’s internal control over financial reporting; and |
| 5. |
The Registrant’s other certifying officer and I have disclosed to the Registrant’s auditors and
the audit committee of the Registrant’s board of directors (or persons performing the equivalent functions): |
| |
(a) |
all significant deficiencies and material weaknesses in the design or operation of internal control over
financial reporting which are reasonably likely to adversely affect the Registrant’s ability to record, process, summarize, and report financial information; and |
| |
(b) |
any fraud, whether or not material, that involves management or other employees who have a significant role
in the Registrant’s internal control over financial reporting. |
|
| /s/ James Giallanza |
| James Giallanza Principal Executive
Officer (President and Chief Executive Officer) |
EXHIBIT 13 (a)(2)
RULE 30a-2(a) CERTIFICATIONS
I, Albert Laskaj, certify that:
| 1. |
I have reviewed this report on Form N-CSR of Cohen & Steers
Closed-End Opportunity Fund, Inc.; |
| 2. |
Based on my knowledge, this report does not contain any untrue statement of a material fact or omit to state
a material fact necessary to make the statements made, in light of the circumstances under which such statements were made, not misleading with respect to the period covered by this report; |
| 3. |
Based on my knowledge, the financial statements, and other financial information included in this report,
fairly present in all material respects the financial condition, results of operations, changes in net assets, and cash flows (if the financial statements are required to include a statement of cash flows) of the Registrant as of, and for, the
periods presented in this report; |
| 4. |
The Registrant’s other certifying officer and I are responsible for establishing and maintaining
disclosure controls and procedures (as defined in Rule 30a-3(c) under the Investment Company Act of 1940) and internal control over financial reporting (as defined in Rule
30a-3(d) under the Investment Company Act of 1940) for the Registrant and have: |
| |
(a) |
designed such disclosure controls and procedures, or caused such disclosure controls and procedures to be
designed under our supervision, to ensure that material information relating to the Registrant, including its consolidated subsidiaries, is made known to us by others within those entities, particularly during the period in which this report is
being prepared; |
| |
(b) |
designed such internal control over financial reporting, or caused such internal control over financial
reporting to be designed under our supervision, to provide reasonable assurance regarding the reliability of financial reporting and the preparation of financial statements for external purposes in accordance with generally accepted accounting
principles; |
| |
(c) |
evaluated the effectiveness of the Registrant’s disclosure controls and procedures and presented in
this report our conclusions about the effectiveness of the disclosure controls and procedures, as of a date within 90 days prior to the filing date of this report based on such evaluation; and |
| |
(d) |
disclosed in this report any change in the Registrant’s internal control over financial reporting that
occurred during the period covered by this report that has materially affected, or is reasonably likely to materially affect, the Registrant’s internal control over financial reporting; and |
| 5. |
The Registrant’s other certifying officer and I have disclosed to the Registrant’s auditors and
the audit committee of the Registrant’s board of directors (or persons performing the equivalent functions): |
| |
(a) |
all significant deficiencies and material weaknesses in the design or operation of internal control over
financial reporting which are reasonably likely to adversely affect the Registrant’s ability to record, process, summarize, and report financial information; and |
| |
(b) |
any fraud, whether or not material, that involves management or other employees who have a significant role
in the Registrant’s internal control over financial reporting. |
|
| /s/ Albert Laskaj |
| Albert Laskaj Principal Financial
Officer (Treasurer and Chief Financial Officer) |
EX-99.906CERT
EXHIBIT 13 (b)
RULE 30a-2(b) CERTIFICATIONS
In connection with the Report of Cohen & Steers Closed-End Opportunity Fund, Inc. (the “Company”) on Form N-CSR as filed with the Securities and Exchange Commission on the date hereof (the “Report”), I,
James Giallanza, Principal Executive Officer of the Company, certify, pursuant to 18 U.S.C. §1350, as adopted pursuant to Section 906 of the Sarbanes-Oxley Act of 2002, that:
(1) The Report fully complies with the requirements of Section 13(a) or 15(d) of the Securities Exchange Act of 1934, as
applicable; and
(2) The information contained in the Report fairly presents, in all material respects, the financial condition and
results of operations of the Company.
|
| /s/ James Giallanza |
| James Giallanza
Principal Executive Officer
(President and Chief Executive Officer)
Date: March 8, 2024 |
EXHIBIT 13 (b)
RULE 30a-2(b) CERTIFICATIONS
In connection with the Report of Cohen & Steers Closed-End Opportunity Fund,
Inc. (the “Company”) on Form N-CSR as filed with the Securities and Exchange Commission on the date hereof (the “Report”), I, Albert Laskaj, Principal Financial Officer of the Company,
certify, pursuant to 18 U.S.C. §1350, as adopted pursuant to Section 906 of the Sarbanes-Oxley Act of 2002, that:
(1) The
Report fully complies with the requirements of Section 13(a) or 15(d) of the Securities Exchange Act of 1934, as applicable; and
(2) The information contained in the Report fairly presents, in all material respects, the financial condition and results of operations
of the Company.
|
| /s/ Albert Laskaj |
| Albert Laskaj
Principal Financial Officer
(Treasurer and Chief Financial Officer)
Date: March 8, 2024 |
EXHIBIT 13(c)
Notification of Sources of Distribution
Pursuant to Section 19(a) of the Investment Company Act of 1940
Cohen & Steers Closed-end Opportunity Fund, Inc. (FOF)
Cohen & Steers Closed-end Opportunity Fund, Inc. (NYSE: FOF) (the “Fund”), acting in
accordance with an exemptive order received from the Securities and Exchange Commission and with approval of its Board of Directors, adopted a managed distribution policy under which the Fund intends to include long-term capital gains, where
applicable, as part of the regular monthly cash distributions to its shareholders. This policy will give the Fund greater flexibility to realize long-term capital gains and to distribute those gains on a regular monthly basis.
The Board of Directors of the Fund declared a monthly distribution per share for the month of July 2023. Please review the following
information and important disclosures set forth below.
|
|
|
|
|
|
|
| Amount of Distribution |
|
Ex-Dividend
Date |
|
Record Date |
|
Payable Date |
| $0.087 |
|
July 11, 2023 |
|
July 12, 2023 |
|
July 31, 2023 |
The following table sets forth the estimated amounts of the current
distribution and the cumulative distributions paid this fiscal year-to-date from the sources indicated in the table. All amounts are expressed per common share.
|
|
|
|
|
|
|
|
|
| |
|
|
|
|
|
|
|
|
| |
|
|
| DISTRIBUTION ESTIMATES |
|
July 2023 |
|
YEAR-TO-DATE (YTD) July 31, 2023* |
| |
|
|
|
|
| Source |
|
Per Share
Amount |
|
% of Current
Distribution |
|
Per Share
Amount |
|
% of 2023
Distributions |
|
Net Investment Income |
|
$0.0331 |
|
38.05% |
|
$0.2382 |
|
39.11% |
|
Net Realized Short-Term Capital Gains |
|
$0.0000 |
|
0.00% |
|
$0.0000 |
|
0.00% |
|
Net Realized Long-Term Capital Gains |
|
$0.0000 |
|
0.00% |
|
$0.0000 |
|
0.00% |
| Return of Capital
(or other Capital Source) |
|
$0.0539 |
|
61.95% |
|
$0.3708 |
|
60.89% |
|
Total Current Distribution |
|
$0.0870 |
|
100.00% |
|
$0.6090 |
|
100.00% |
You should not draw any conclusions about the Fund’s investment performance from the amount of this distribution
or from the terms of the Fund’s managed distribution policy. The Fund estimates that it has distributed more than its income and capital gains; therefore, a portion of your distribution may be a return of capital. A return of capital may occur,
for example, when some or all of the money that you invested in the Fund is paid back to you. A return of capital distribution does not necessarily reflect the Fund’s investment performance and should not be confused with ‘yield’ or
‘income’. The amounts and sources of distributions reported in this Notice are only estimates, are likely to change over time, and are not being provided for tax reporting purposes. The actual amounts and sources of the amounts for
accounting and tax reporting purposes will depend upon the Fund’s investment experience during the remainder of its fiscal year and may be subject to changes based on tax regulations. The amounts and sources of distributions year-to-date may be subject to additional adjustments.
*THE FUND WILL SEND YOU A FORM 1099-DIV FOR THE CALENDAR YEAR THAT WILL TELL YOU HOW TO REPORT
THESE DISTRIBUTIONS FOR FEDERAL INCOME TAX PURPOSES.
The Fund’s
Year-to-date Cumulative Total Return for fiscal year 2023 (January 1, 2023 through June 30, 2023) is set forth below. Shareholders should take note of the
relationship between the Year-to-date Cumulative Total Return with the Fund’s Cumulative Distribution Rate for 2023. In addition, the Fund’s Average Annual
Total Return for the five-year period ending June 30, 2023 is set forth below. Shareholders should note the relationship between the Average Annual Total Return with the Fund’s Current Annualized Distribution Rate for 2023. The performance
and distribution rate information disclosed in the table is based on the Fund’s net asset value per share (NAV). The Fund’s NAV is calculated as the total market value of all the securities and other assets held by the Fund minus the total
liabilities, divided by the total number of shares outstanding. While NAV performance may be indicative of the Fund’s investment performance, it does not measure the value of a shareholder’s individual investment in the Fund. The value of
a shareholder’s investment in the Fund is determined by the Fund’s market price, which is based on the supply and demand for the Fund’s shares in the open market.
Fund Performance and Distribution Rate Information:
|
|
|
|
|
| Year-to-date January 1,
2023 to June 30, 2023 |
|
| Year-to-date Cumulative Total Return1 |
|
|
6.50% |
|
| Cumulative Distribution Rate2 |
|
|
5.65% |
|
| |
|
|
|
|
| Five-year period ending June 30, 2023 |
|
| Average Annual Total Return3 |
|
|
4.27% |
|
|
Current Annualized Distribution Rate4 |
|
|
9.68% |
|
| |
1. |
Year-to-date Cumulative Total
Return is the percentage change in the Fund’s NAV over the year-to-date time period including distributions paid and assuming reinvestment of those distributions.
|
| |
2. |
Cumulative Distribution Rate for the Fund’s current fiscal period (January 1, 2023 through July 31,
2023) measured on the dollar value of distributions in the year-to-date period as a percentage of the Fund’s NAV as of June 30, 2023. |
| |
3. |
Average Annual Total Return represents the compound average of the Annual NAV Total Returns of the Fund for
the five-year period ending June 30, 2023. Annual NAV Total Return is the percentage change in the Fund’s NAV over a year including distributions paid and assuming reinvestment of those distributions. |
| |
4. |
The Current Annualized Distribution Rate is the current fiscal period’s distribution rate annualized as
a percentage of the Fund’s NAV as of June 30, 2023. |
This Fund has a managed distribution policy that seeks to
deliver the Fund’s long term total return potential through regular monthly distributions declared at a fixed rate per share. Distributions may be paid in part or in full from net investment income, realized capital gains and by returning
capital, or a combination thereof. Shareholders should note, however, that if the Fund’s aggregate net investment income and net realized capital gains are less than the amount of the distribution level, the difference will be distributed from
the Fund’s assets and will constitute a return of the shareholder’s capital. A return of capital is not taxable; rather it reduces a shareholder’s tax basis in his or her shares of the Fund. The Board of Directors of the Fund may
amend, terminate or suspend the managed distribution policy at any time, which could have an adverse effect on the market price of the Fund’s shares.
Shareholders should not use the information provided in preparing their tax returns. Shareholders will receive a Form 1099-DIV for the calendar year indicating how to report fund distributions for federal income tax purposes.
EXHIBIT 13(c)
Notification of Sources of Distribution
Pursuant to Section 19(a) of the Investment Company Act of 1940
Cohen & Steers Closed-end Opportunity Fund, Inc. (FOF)
Cohen & Steers Closed-end Opportunity Fund, Inc. (NYSE: FOF) (the “Fund”), acting in
accordance with an exemptive order received from the Securities and Exchange Commission and with approval of its Board of Directors, adopted a managed distribution policy under which the Fund intends to include long-term capital gains, where
applicable, as part of the regular monthly cash distributions to its shareholders. This policy will give the Fund greater flexibility to realize long-term capital gains and to distribute those gains on a regular monthly basis.
The Board of Directors of the Fund declared a monthly distribution per share for the month of August 2023. Please review the following
information and important disclosures set forth below.
|
|
|
|
|
|
|
| Amount of Distribution |
|
Ex-Dividend
Date |
|
Record Date |
|
Payable Date |
| $0.087 |
|
August 15, 2023 |
|
August 16, 2023 |
|
August 31, 2023 |
The following table sets forth the estimated amounts of the current
distribution and the cumulative distributions paid this fiscal year-to-date from the sources indicated in the table. All amounts are expressed per common share.
|
|
|
|
|
|
|
|
|
| |
|
|
|
|
|
|
|
|
| |
|
|
| DISTRIBUTION ESTIMATES |
|
August 2023 |
|
YEAR-TO-DATE (YTD) August 31, 2023* |
| |
|
|
|
|
| Source |
|
Per Share
Amount |
|
% of Current
Distribution |
|
Per Share
Amount |
|
% of 2023
Distributions |
|
Net Investment Income |
|
$0.0307 |
|
35.29% |
|
$0.2693 |
|
38.69% |
|
Net Realized Short-Term Capital Gains |
|
$0.0000 |
|
0.00% |
|
$0.0000 |
|
0.00% |
|
Net Realized Long-Term Capital Gains |
|
$0.0000 |
|
0.00% |
|
$0.0000 |
|
0.00% |
| Return of Capital
(or other Capital Source) |
|
$0.0563 |
|
64.71% |
|
$0.4267 |
|
61.31% |
|
Total Current Distribution |
|
$0.0870 |
|
100.00% |
|
$0.6960 |
|
100.00% |
You should not draw any conclusions about the Fund’s investment performance from the amount of this distribution
or from the terms of the Fund’s managed distribution policy. The Fund estimates that it has distributed more than its income and capital gains; therefore, a portion of your distribution may be a return of capital. A return of capital may occur,
for example, when some or all of the money that you invested in the Fund is paid back to you. A return of capital distribution does not necessarily reflect the Fund’s investment performance and should not be confused with ‘yield’ or
‘income’. The amounts and sources of distributions reported in this Notice are only estimates, are likely to change over time, and are not being provided for tax reporting purposes. The actual amounts and sources of the amounts for
accounting and tax reporting purposes will depend upon the Fund’s investment experience during the remainder of its fiscal year and may be subject to changes based on tax regulations. The amounts and sources of distributions year-to-date may be subject to additional adjustments.
*THE FUND WILL SEND YOU A FORM 1099-DIV FOR THE CALENDAR YEAR THAT WILL TELL YOU HOW TO REPORT THESE
DISTRIBUTIONS FOR FEDERAL INCOME TAX PURPOSES.
The Fund’s
Year-to-date Cumulative Total Return for fiscal year 2023 (January 1, 2023 through July 31, 2023) is set forth below. Shareholders should take note of the
relationship between the Year-to-date Cumulative Total Return with the Fund’s Cumulative Distribution Rate for 2023. In addition, the Fund’s Average Annual
Total Return for the five-year period ending July 31, 2023 is set forth below. Shareholders should note the relationship between the Average Annual Total Return with the Fund’s Current Annualized Distribution Rate for 2023. The performance
and distribution rate information disclosed in the table is based on the Fund’s net asset value per share (NAV). The Fund’s NAV is calculated as the total market value of all the securities and other assets held by the Fund minus the total
liabilities, divided by the total number of shares outstanding. While NAV performance may be indicative of the Fund’s investment performance, it does not measure the value of a shareholder’s individual investment in the Fund. The value of
a shareholder’s investment in the Fund is determined by the Fund’s market price, which is based on the supply and demand for the Fund’s shares in the open market.
Fund Performance and Distribution Rate Information:
|
|
|
|
|
| Year-to-date January 1,
2023 to July 31, 2023 |
|
| Year-to-date Cumulative Total Return1 |
|
|
9.43% |
|
| Cumulative Distribution Rate2 |
|
|
6.33% |
|
| |
|
|
|
|
| Five-year period ending July 31, 2023 |
|
| Average Annual Total Return3 |
|
|
4.32% |
|
|
Current Annualized Distribution Rate4 |
|
|
9.50% |
|
| |
1. |
Year-to-date Cumulative Total
Return is the percentage change in the Fund’s NAV over the year-to-date time period including distributions paid and assuming reinvestment of those distributions.
|
| |
2. |
Cumulative Distribution Rate for the Fund’s current fiscal period (January 1, 2023 through
August 31, 2023) measured on the dollar value of distributions in the year-to-date period as a percentage of the Fund’s NAV as of July 31, 2023.
|
| |
3. |
Average Annual Total Return represents the compound average of the Annual NAV Total Returns of the Fund for
the five-year period ending July 31, 2023. Annual NAV Total Return is the percentage change in the Fund’s NAV over a year including distributions paid and assuming reinvestment of those distributions. |
| |
4. |
The Current Annualized Distribution Rate is the current fiscal period’s distribution rate annualized as
a percentage of the Fund’s NAV as of July 31, 2023. |
This Fund has a managed distribution policy that seeks to
deliver the Fund’s long term total return potential through regular monthly distributions declared at a fixed rate per share. Distributions may be paid in part or in full from net investment income, realized capital gains and by returning
capital, or a combination thereof. Shareholders should note, however, that if the Fund’s aggregate net investment income and net realized capital gains are less than the amount of the distribution level, the difference will be distributed from
the Fund’s assets and will constitute a return of the shareholder’s capital. A return of capital is not taxable; rather it reduces a shareholder’s tax basis in his or her shares of the Fund. The Board of Directors of the Fund may
amend, terminate or suspend the managed distribution policy at any time, which could have an adverse effect on the market price of the Fund’s shares.
Shareholders should not use the information provided in preparing their tax returns. Shareholders will receive a Form 1099-DIV for the calendar year indicating how to report fund distributions for federal income tax purposes.
EXHIBIT 13(c)
Notification of Sources of Distribution
Pursuant to Section 19(a) of the Investment Company Act of 1940
Cohen & Steers Closed-end Opportunity Fund, Inc. (FOF)
Cohen & Steers Closed-end Opportunity Fund, Inc. (NYSE: FOF) (the “Fund”), acting in
accordance with an exemptive order received from the Securities and Exchange Commission and with approval of its Board of Directors, adopted a managed distribution policy under which the Fund intends to include long-term capital gains, where
applicable, as part of the regular monthly cash distributions to its shareholders. This policy will give the Fund greater flexibility to realize long-term capital gains and to distribute those gains on a regular monthly basis.
The Board of Directors of the Fund declared a monthly distribution per share for the month of September 2023. Please review the following
information and important disclosures set forth below.
|
|
|
|
|
|
|
| Amount of Distribution |
|
Ex-Dividend
Date |
|
Record Date |
|
Payable Date |
| $0.087 |
|
September 12, 2023 |
|
September 13, 2023 |
|
September 29, 2023 |
The following table sets forth the estimated amounts of the
current distribution and the cumulative distributions paid this fiscal year-to-date from the sources indicated in the table. All amounts are expressed per common share.
|
|
|
|
|
|
|
|
|
| |
|
|
|
|
|
|
|
|
| |
|
|
| DISTRIBUTION ESTIMATES |
|
September 2023 |
|
YEAR-TO-DATE (YTD) September 30, 2023* |
| |
|
|
|
|
| Source |
|
Per Share
Amount |
|
% of Current
Distribution |
|
Per Share
Amount |
|
% of 2023
Distributions |
|
Net Investment Income |
|
$0.0410 |
|
47.13% |
|
$0.3118 |
|
39.82% |
|
Net Realized Short-Term Capital Gains |
|
$0.0000 |
|
0.00% |
|
$0.0000 |
|
0.00% |
|
Net Realized Long-Term Capital Gains |
|
$0.0000 |
|
0.00% |
|
$0.0000 |
|
0.00% |
| Return of Capital
(or other Capital Source) |
|
$0.0460 |
|
52.87% |
|
$0.4712 |
|
60.18% |
|
Total Current Distribution |
|
$0.0870 |
|
100.00% |
|
$0.7830 |
|
100.00% |
You should not draw any conclusions about the Fund’s investment performance from the amount of this distribution
or from the terms of the Fund’s managed distribution policy. The Fund estimates that it has distributed more than its income and capital gains; therefore, a portion of your distribution may be a return of capital. A return of capital may occur,
for example, when some or all of the money that you invested in the Fund is paid back to you. A return of capital distribution does not necessarily reflect the Fund’s investment performance and should not be confused with ‘yield’ or
‘income’. The amounts and sources of distributions reported in this Notice are only estimates, are likely to change over time, and are not being provided for tax reporting purposes. The actual amounts and sources of the amounts for
accounting and tax reporting purposes will depend upon the Fund’s investment experience during the remainder of its fiscal year and may be subject to changes based on tax regulations. The amounts and sources of distributions year-to-date may be subject to additional adjustments.
*THE FUND WILL SEND YOU A FORM 1099-DIV FOR THE CALENDAR YEAR THAT WILL TELL YOU HOW TO REPORT THESE
DISTRIBUTIONS FOR FEDERAL INCOME TAX PURPOSES.
The Fund’s
Year-to-date Cumulative Total Return for fiscal year 2023 (January 1, 2023 through August 31, 2023) is set forth below. Shareholders should take note of the
relationship between the Year-to-date Cumulative Total Return with the Fund’s Cumulative Distribution Rate for 2023. In addition, the Fund’s Average Annual
Total Return for the five-year period ending August 31, 2023 is set forth below. Shareholders should note the relationship between the Average Annual Total Return with the Fund’s Current Annualized Distribution Rate for 2023. The
performance and distribution rate information disclosed in the table is based on the Fund’s net asset value per share (NAV). The Fund’s NAV is calculated as the total market value of all the securities and other assets held by the Fund
minus the total liabilities, divided by the total number of shares outstanding. While NAV performance may be indicative of the Fund’s investment performance, it does not measure the value of a shareholder’s individual investment in the
Fund. The value of a shareholder’s investment in the Fund is determined by the Fund’s market price, which is based on the supply and demand for the Fund’s shares in the open market.
Fund Performance and Distribution Rate Information:
|
|
|
|
|
| Year-to-date January 1,
2023 to August 31, 2023 |
|
| Year-to-date Cumulative Total Return1 |
|
|
7.21% |
|
| Cumulative Distribution Rate2 |
|
|
6.52% |
|
| |
|
|
|
|
| Five-year period ending August 31, 2023 |
|
| Average Annual Total Return3 |
|
|
3.71% |
|
|
Current Annualized Distribution Rate4 |
|
|
9.78% |
|
| |
1. |
Year-to-date Cumulative Total
Return is the percentage change in the Fund’s NAV over the year-to-date time period including distributions paid and assuming reinvestment of those distributions.
|
| |
2. |
Cumulative Distribution Rate for the Fund’s current fiscal period (January 1, 2023 through
September 30, 2023) measured on the dollar value of distributions in the year-to-date period as a percentage of the Fund’s NAV as of August 31, 2023.
|
| |
3. |
Average Annual Total Return represents the compound average of the Annual NAV Total Returns of the Fund for
the five-year period ending August 31, 2023. Annual NAV Total Return is the percentage change in the Fund’s NAV over a year including distributions paid and assuming reinvestment of those distributions. |
| |
4. |
The Current Annualized Distribution Rate is the current fiscal period’s distribution rate annualized as
a percentage of the Fund’s NAV as of August 31, 2023. |
This Fund has a managed distribution policy that seeks
to deliver the Fund’s long term total return potential through regular monthly distributions declared at a fixed rate per share. Distributions may be paid in part or in full from net investment income, realized capital gains and by returning
capital, or a combination thereof. Shareholders should note, however, that if the Fund’s aggregate net investment income and net realized capital gains are less than the amount of the distribution level, the difference will be distributed from
the Fund’s assets and will constitute a return of the shareholder’s capital. A return of capital is not taxable; rather it reduces a shareholder’s tax basis in his or her shares of the Fund. The Board of Directors of the Fund may
amend, terminate or suspend the managed distribution policy at any time, which could have an adverse effect on the market price of the Fund’s shares.
Shareholders should not use the information provided in preparing their tax returns. Shareholders will receive a Form 1099-DIV for the calendar year indicating how to report fund distributions for federal income tax purposes.
EXHIBIT 13(c)
Notification of Sources of Distribution
Pursuant to Section 19(a) of the Investment Company Act of 1940
Cohen & Steers Closed-end Opportunity Fund, Inc. (FOF)
Cohen & Steers Closed-end Opportunity Fund, Inc. (NYSE: FOF) (the “Fund”), acting in
accordance with an exemptive order received from the Securities and Exchange Commission and with approval of its Board of Directors, adopted a managed distribution policy under which the Fund intends to include long-term capital gains, where
applicable, as part of the regular monthly cash distributions to its shareholders. This policy will give the Fund greater flexibility to realize long-term capital gains and to distribute those gains on a regular monthly basis.
The Board of Directors of the Fund declared a monthly distribution per share for the month of October 2023. Please review the following
information and important disclosures set forth below.
|
|
|
|
|
|
|
| Amount of Distribution |
|
Ex-Dividend
Date |
|
Record Date |
|
Payable Date |
| $0.087 |
|
October 10, 2023 |
|
October 11, 2023 |
|
October 31, 2023 |
The following table sets forth the estimated amounts of the current
distribution and the cumulative distributions paid this fiscal year-to-date from the sources indicated in the table. All amounts are expressed per common share.
|
|
|
|
|
|
|
|
|
| |
|
|
|
|
|
|
|
|
| |
|
|
| DISTRIBUTION ESTIMATES |
|
October 2023 |
|
YEAR-TO-DATE (YTD) October 31, 2023* |
| |
|
|
|
|
| Source |
|
Per Share
Amount |
|
% of Current
Distribution |
|
Per Share
Amount |
|
% of 2023
Distributions |
|
Net Investment Income |
|
$0.0317 |
|
36.44% |
|
$0.3440 |
|
39.54% |
|
Net Realized Short-Term Capital Gains |
|
$0.0000 |
|
0.00% |
|
$0.0000 |
|
0.00% |
|
Net Realized Long-Term Capital Gains |
|
$0.0000 |
|
0.00% |
|
$0.0000 |
|
0.00% |
| Return of Capital
(or other Capital Source) |
|
$0.0553 |
|
63.56% |
|
$0.5260 |
|
60.46% |
|
Total Current Distribution |
|
$0.0870 |
|
100.00% |
|
$0.8700 |
|
100.00% |
You should not draw any conclusions about the Fund’s investment performance from the amount of this distribution
or from the terms of the Fund’s managed distribution policy. The Fund estimates that it has distributed more than its income and capital gains; therefore, a portion of your distribution may be a return of capital. A return of capital may occur,
for example, when some or all of the money that you invested in the Fund is paid back to you. A return of capital distribution does not necessarily reflect the Fund’s investment performance and should not be confused with ‘yield’ or
‘income’. The amounts and sources of distributions reported in this Notice are only estimates, are likely to change over time, and are not being provided for tax reporting purposes. The actual amounts and sources of the amounts for
accounting and tax reporting purposes will depend upon the Fund’s investment experience during the remainder of its fiscal year and may be subject to changes based on tax regulations. The amounts and sources of distributions year-to-date may be subject to additional adjustments.
*THE FUND WILL SEND YOU A FORM 1099-DIV FOR THE CALENDAR YEAR THAT WILL TELL YOU HOW TO REPORT THESE
DISTRIBUTIONS FOR FEDERAL INCOME TAX PURPOSES.
The Fund’s
Year-to-date Cumulative Total Return for fiscal year 2023 (January 1, 2023 through September 30, 2023) is set forth below. Shareholders should take note of the
relationship between the Year-to-date Cumulative Total Return with the Fund’s Cumulative Distribution Rate for 2023. In addition, the Fund’s Average Annual
Total Return for the five-year period ending September 30, 2023 is set forth below. Shareholders should note the relationship between the Average Annual Total Return with the Fund’s Current Annualized Distribution Rate for 2023. The
performance and distribution rate information disclosed in the table is based on the Fund’s net asset value per share (NAV). The Fund’s NAV is calculated as the total market value of all the securities and other assets held by the Fund
minus the total liabilities, divided by the total number of shares outstanding. While NAV performance may be indicative of the Fund’s investment performance, it does not measure the value of a shareholder’s individual investment in the
Fund. The value of a shareholder’s investment in the Fund is determined by the Fund’s market price, which is based on the supply and demand for the Fund’s shares in the open market.
Fund Performance and Distribution Rate Information:
|
|
|
| |
| Year-to-date
January 1, 2023 to September 30, 2023 |
| |
|
| Year-to-date Cumulative Total Return1 |
|
3.27% |
| |
|
| Cumulative Distribution Rate2 |
|
8.53% |
| |
|
| |
|
|
| |
| Five-year period ending September 30, 2023 |
| |
|
| Average Annual Total Return3 |
|
3.10% |
| |
|
|
Current Annualized Distribution Rate4 |
|
10.24% |
| |
1. |
Year-to-date Cumulative Total
Return is the percentage change in the Fund’s NAV over the year-to-date time period including distributions paid and assuming reinvestment of those distributions.
|
| |
2. |
Cumulative Distribution Rate for the Fund’s current fiscal period (January 1, 2023 through
October 31, 2023) measured on the dollar value of distributions in the year-to-date period as a percentage of the Fund’s NAV as of September 30, 2023.
|
| |
3. |
Average Annual Total Return represents the compound average of the Annual NAV Total Returns of the Fund for
the five-year period ending September 30, 2023. Annual NAV Total Return is the percentage change in the Fund’s NAV over a year including distributions paid and assuming reinvestment of those distributions. |
| |
4. |
The Current Annualized Distribution Rate is the current fiscal period’s distribution rate annualized as
a percentage of the Fund’s NAV as of September 30, 2023. |
This Fund has a managed distribution policy that
seeks to deliver the Fund’s long term total return potential through regular monthly distributions declared at a fixed rate per share. Distributions may be paid in part or in full from net investment income, realized capital gains and by
returning capital, or a combination thereof. Shareholders should note, however, that if the Fund’s aggregate net investment income and net realized capital gains are less than the amount of the distribution level, the difference will be
distributed from the Fund’s assets and will constitute a return of the shareholder’s capital. A return of capital is not taxable; rather it reduces a shareholder’s tax basis in his or her shares of the Fund. The Board of Directors of
the Fund may amend, terminate or suspend the managed distribution policy at any time, which could have an adverse effect on the market price of the Fund’s shares.
Shareholders should not use the information provided in preparing their tax returns. Shareholders will receive a Form 1099-DIV for the calendar year indicating how to report fund distributions for federal income tax purposes.
EXHIBIT 13(c)
Notification of Sources of Distribution
Pursuant to Section 19(a) of the Investment Company Act of 1940
Cohen & Steers Closed-end Opportunity Fund, Inc. (FOF)
Cohen & Steers Closed-end Opportunity Fund, Inc. (NYSE: FOF) (the “Fund”), acting in
accordance with an exemptive order received from the Securities and Exchange Commission and with approval of its Board of Directors, adopted a managed distribution policy under which the Fund intends to include long-term capital gains, where
applicable, as part of the regular monthly cash distributions to its shareholders. This policy will give the Fund greater flexibility to realize long-term capital gains and to distribute those gains on a regular monthly basis.
The Board of Directors of the Fund declared a monthly distribution per share for the month of November 2023. Please review the following
information and important disclosures set forth below.
|
|
|
|
|
|
|
| Amount of Distribution |
|
Ex-Dividend
Date |
|
Record Date |
|
Payable Date |
| $0.087 |
|
November 14, 2023 |
|
November 15, 2023 |
|
November 30, 2023 |
The following table sets forth the estimated amounts of the current distribution
and the cumulative distributions paid this fiscal year-to-date from the sources indicated in the table. All amounts are expressed per common share.
|
|
|
|
|
|
|
|
|
| |
|
|
|
|
|
|
|
|
| |
|
|
| DISTRIBUTION ESTIMATES |
|
November 2023 |
|
YEAR-TO-DATE (YTD) November 30, 2023* |
| |
|
|
|
|
| Source |
|
Per Share
Amount |
|
% of Current
Distribution |
|
Per Share
Amount |
|
% of 2023
Distributions |
|
Net Investment Income |
|
$0.0321 |
|
36.90% |
|
$0.3768 |
|
39.37% |
|
Net Realized Short-Term Capital Gains |
|
$0.0000 |
|
0.00% |
|
$0.0000 |
|
0.00% |
|
Net Realized Long-Term Capital Gains |
|
$0.0000 |
|
0.00% |
|
$0.0000 |
|
0.00% |
| Return of Capital
(or other Capital Source) |
|
$0.0549 |
|
63.10% |
|
$0.5802 |
|
60.63% |
|
Total Current Distribution |
|
$0.0870 |
|
100.00% |
|
$0.9570 |
|
100.00% |
You should not draw any conclusions about the Fund’s investment performance from the amount of this
distribution or from the terms of the Fund’s managed distribution policy. The Fund estimates that it has distributed more than its income and capital gains; therefore, a portion of your distribution may be a return of capital. A return of
capital may occur, for example, when some or all of the money that you invested in the Fund is paid back to you. A return of capital distribution does not necessarily reflect the Fund’s investment performance and should not be confused with
‘yield’ or ‘income’. The amounts and sources of distributions reported in this Notice are only estimates, are likely to change over time, and are not being provided for tax reporting purposes. The actual amounts and sources of
the amounts for accounting and tax reporting purposes will depend upon the Fund’s investment experience during the remainder of its fiscal year and may be subject to changes based on tax regulations. The amounts and sources of distributions year-to-date may be subject to additional adjustments.
*THE FUND WILL SEND YOU A FORM 1099-DIV FOR THE CALENDAR YEAR THAT WILL TELL YOU HOW TO REPORT THESE
DISTRIBUTIONS FOR FEDERAL INCOME TAX PURPOSES.
The Fund’s
Year-to-date Cumulative Total Return for fiscal year 2023 (January 1, 2023 through October 31, 2023) is set forth below. Shareholders should take note of the
relationship between the Year-to-date Cumulative Total Return with the Fund’s Cumulative Distribution Rate for 2023. In addition, the Fund’s Average Annual
Total Return for the five-year period ending October 31, 2023 is set forth below. Shareholders should note the relationship between the Average Annual Total Return with the Fund’s Current Annualized Distribution Rate for 2023. The
performance and distribution rate information disclosed in the table is based on the Fund’s net asset value per share (NAV). The Fund’s NAV is calculated as the total market value of all the securities and other assets held by the Fund
minus the total liabilities, divided by the total number of shares outstanding. While NAV performance may be indicative of the Fund’s investment performance, it does not measure the value of a shareholder’s individual investment in the
Fund. The value of a shareholder’s investment in the Fund is determined by the Fund’s market price, which is based on the supply and demand for the Fund’s shares in the open market.
Fund Performance and Distribution Rate Information:
|
|
|
| Year-to-date January 1, 2023 to October 31, 2023 |
| |
|
| Year-to-date Cumulative Total Return1 |
|
0.50% |
| |
|
| Cumulative Distribution Rate2 |
|
9.73% |
| |
|
| |
|
|
| |
| Five-year period ending October 31, 2023 |
| |
|
| Average Annual Total Return3 |
|
4.02% |
| |
|
|
Current Annualized Distribution Rate4 |
|
10.61% |
| |
1. |
Year-to-date Cumulative Total
Return is the percentage change in the Fund’s NAV over the year-to-date time period including distributions paid and assuming reinvestment of those distributions.
|
| |
2. |
Cumulative Distribution Rate for the Fund’s current fiscal period (January 1, 2023 through
November 30, 2023) measured on the dollar value of distributions in the year-to-date period as a percentage of the Fund’s NAV as of October 31, 2023.
|
| |
3. |
Average Annual Total Return represents the compound average of the Annual NAV Total Returns of the Fund for
the five-year period ending October 31, 2023. Annual NAV Total Return is the percentage change in the Fund’s NAV over a year including distributions paid and assuming reinvestment of those distributions. |
| |
4. |
The Current Annualized Distribution Rate is the current fiscal period’s distribution rate annualized as
a percentage of the Fund’s NAV as of October 31, 2023. |
This Fund has a managed distribution policy that seeks
to deliver the Fund’s long term total return potential through regular monthly distributions declared at a fixed rate per share. Distributions may be paid in part or in full from net investment income, realized capital gains and by returning
capital, or a combination thereof. Shareholders should note, however, that if the Fund’s aggregate net investment income and net realized capital gains are less than the amount of the distribution level, the difference will be distributed from
the Fund’s assets and will constitute a return of the shareholder’s capital. A return of capital is not taxable; rather it reduces a shareholder’s tax basis in his or her shares of the Fund. The Board of Directors of the Fund may
amend, terminate or suspend the managed distribution policy at any time, which could have an adverse effect on the market price of the Fund’s shares.
Shareholders should not use the information provided in preparing their tax returns. Shareholders will receive a Form 1099-DIV for the calendar year indicating how to report fund distributions for federal income tax purposes.
EXHIBIT 13(c)
Notification of Sources of Distribution
Pursuant to Section 19(a) of the Investment Company Act of 1940
Cohen & Steers Closed-end Opportunity Fund, Inc. (FOF)
Cohen & Steers Closed-end Opportunity Fund, Inc. (NYSE: FOF) (the “Fund”), acting in accordance with
an exemptive order received from the Securities and Exchange Commission and with approval of its Board of Directors, adopted a managed distribution policy under which the Fund intends to include long-term capital gains, where applicable, as part of
the regular monthly cash distributions to its shareholders. This policy will give the Fund greater flexibility to realize long-term capital gains and to distribute those gains on a regular monthly basis.
The Board of Directors of the Fund declared a monthly distribution per share for the month of December 2023. Please review the following information and
important disclosures set forth below.
|
|
|
|
|
|
|
| Amount of Distribution |
|
Ex-Dividend
Date |
|
Record Date |
|
Payable Date |
| $0.087 |
|
December 12, 2023 |
|
December 13, 2023 |
|
December 29, 2023 |
The following table sets forth the estimated amounts of the current distribution
and the cumulative distributions paid this fiscal year-to-date from the sources indicated in the table. All amounts are expressed per common share.
|
|
|
|
|
|
|
|
|
| |
|
|
|
|
|
|
|
|
| |
|
|
| DISTRIBUTION ESTIMATES |
|
December 2023 |
|
YEAR-TO-DATE (YTD) December 31, 2023* |
| |
|
|
|
|
| Source |
|
Per Share
Amount |
|
% of Current
Distribution |
|
Per Share
Amount |
|
% of 2023
Distributions |
|
Net Investment Income |
|
$0.0637 |
|
73.22% |
|
$0.4505 |
|
43.15% |
|
Net Realized Short-Term Capital Gains |
|
$0.0000 |
|
0.00% |
|
$0.0000 |
|
0.00% |
|
Net Realized Long-Term Capital Gains |
|
$0.0000 |
|
0.00% |
|
$0.0000 |
|
0.00% |
| Return of Capital
(or other Capital Source) |
|
$0.0233 |
|
26.78% |
|
$0.5935 |
|
56.85% |
|
Total Current Distribution |
|
$0.0870 |
|
100.00% |
|
$1.0440 |
|
100.00% |
You should not draw any conclusions about the Fund’s investment performance from the amount of this distribution
or from the terms of the Fund’s managed distribution policy. The Fund estimates that it has distributed more than its income and capital gains; therefore, a portion of your distribution may be a return of capital. A return of capital may occur,
for example, when some or all of the money that you invested in the Fund is paid back to you. A return of capital distribution does not necessarily reflect the Fund’s investment performance and should not be confused with ‘yield’ or
‘income’. The amounts and sources of distributions reported in this Notice are only estimates, are likely to change over time, and are not being provided for tax reporting purposes. The actual amounts and sources of the amounts for
accounting and tax reporting purposes will depend upon the Fund’s investment experience during the remainder of its fiscal year and may be subject to changes based on tax regulations. The amounts and sources of distributions year-to-date may be subject to additional adjustments.
*THE FUND WILL SEND YOU A FORM 1099-DIV FOR THE CALENDAR YEAR THAT WILL TELL YOU HOW TO REPORT THESE
DISTRIBUTIONS FOR FEDERAL INCOME TAX PURPOSES.
The Fund’s
Year-to-date Cumulative Total Return for fiscal year 2023 (January 1, 2023 through November 30, 2023) is set forth below. Shareholders should take note of the
relationship between the Year-to-date Cumulative Total Return with the Fund’s Cumulative Distribution Rate for 2023. In addition, the Fund’s Average Annual
Total Return for the five-year period ending November 30, 2023 is set forth below. Shareholders should note the relationship between the Average Annual Total Return with the Fund’s Current Annualized Distribution Rate for 2023. The
performance and distribution rate information disclosed in the table is based on the Fund’s net asset value per share (NAV). The Fund’s NAV is calculated as the total market value of all the securities and other assets held by the Fund
minus the total liabilities, divided by the total number of shares outstanding. While NAV performance may be indicative of the Fund’s investment performance, it does not measure the value of a shareholder’s individual investment in the
Fund. The value of a shareholder’s investment in the Fund is determined by the Fund’s market price, which is based on the supply and demand for the Fund’s shares in the open market.
Fund Performance and Distribution Rate Information:
|
|
|
| Year-to-date January 1, 2023 to November 30, 2023 |
| Year-to-date Cumulative Total Return1 |
|
8.95% |
| Cumulative Distribution Rate2 |
|
9.87% |
| |
|
|
| Five-year period ending November 30,
2023 |
| Average Annual Total Return3 |
|
5.32% |
|
Current Annualized Distribution Rate4 |
|
9.87% |
| |
1. |
Year-to-date Cumulative Total
Return is the percentage change in the Fund’s NAV over the year-to-date time period including distributions paid and assuming reinvestment of those distributions.
|
| |
2. |
Cumulative Distribution Rate for the Fund’s current fiscal period (January 1, 2023 through
December 31, 2023) measured on the dollar value of distributions in the year-to-date period as a percentage of the Fund’s NAV as of November 30, 2023.
|
| |
3. |
Average Annual Total Return represents the compound average of the Annual NAV Total Returns of the Fund for
the five-year period ending November 30, 2023. Annual NAV Total Return is the percentage change in the Fund’s NAV over a year including distributions paid and assuming reinvestment of those distributions. |
| |
4. |
The Current Annualized Distribution Rate is the current fiscal period’s distribution rate annualized as
a percentage of the Fund’s NAV as of November 30, 2023. |
This Fund has a managed distribution policy that seeks
to deliver the Fund’s long term total return potential through regular monthly distributions declared at a fixed rate per share. Distributions may be paid in part or in full from net investment income, realized capital gains and by returning
capital, or a combination thereof. Shareholders should note, however, that if the Fund’s aggregate net investment income and net realized capital gains are less than the amount of the distribution level, the difference will be distributed from
the Fund’s assets and will constitute a return of the shareholder’s capital. A return of capital is not taxable; rather it reduces a shareholder’s tax basis in his or her shares of the Fund. The Board of Directors of the Fund may
amend, terminate or suspend the managed distribution policy at any time, which could have an adverse effect on the market price of the Fund’s shares.
Shareholders should not use the information provided in preparing their tax returns. Shareholders will receive a Form 1099-DIV for the calendar year indicating how to report fund distributions for federal income tax purposes.
Cohen and Steers Closed ... (NYSE:FOF)
Historical Stock Chart
From Dec 2024 to Jan 2025

Cohen and Steers Closed ... (NYSE:FOF)
Historical Stock Chart
From Jan 2024 to Jan 2025

