The Becker Milk Company Limited: Nine Month Financial Results and Regular Dividends
14 March 2012 - 7:45AM
Marketwired Canada
The Becker Milk Company Limited (the "Company") (TSX:BEK.B) is pleased to report
the results for the nine months ending January 31, 2012.


These results are, and all future results will be, reported under International
Financial Reporting Standards (IFRS) and historical results have been restated
to IFRS for comparison purposes. Reconciliations between IFRS and Canadian
Generally Accepted Accounting Principles have been included in the Company's
unaudited interim financial statements for the period ended January 31, 2012.


HIGHLIGHTS


--  Total revenues for the nine months ended January 31, 2012 were
    $3,128,671 compared to $3,078,234 for the same period in 2011;
--  Total net operating income for the nine months was $2,642,749 compared
    to $2,587,752 in 2011;
--  Adjusted funds from operations for the nine months were $1.46 per share,
    compared to $1.43 per share in 2011.


FINANCIAL HIGHLIGHTS


----------------------------------------------------------------------------
                                                          Nine months ended
                                                                 January 31
                                                         2012          2011
----------------------------------------------------------------------------
----------------------------------------------------------------------------
Property revenue                                   $3,081,839    $3,039,080
Finance income                                         46,832        39,154
----------------------------------------------------------------------------
Total revenues                                     $3,128,671    $3,078,234
----------------------------------------------------------------------------
----------------------------------------------------------------------------

Property revenue                                   $3,081,839    $3,039,080
Property operating expenses                          (439,090)     (451,328)
----------------------------------------------------------------------------
Net operating income                               $2,642,749    $2,587,752
----------------------------------------------------------------------------
----------------------------------------------------------------------------

Adjusted funds from operations                     $1,278,653    $1,242,935
----------------------------------------------------------------------------
----------------------------------------------------------------------------

Net income attributable to common and special
 shareholders                                      $2,214,181    $2,359,340
----------------------------------------------------------------------------
----------------------------------------------------------------------------

Average common and special shares outstanding       1,808,360     1,808,360

Income per share                                   $     1.22    $     1.30
----------------------------------------------------------------------------
----------------------------------------------------------------------------


Significant components of the $145,159 change in net income between the nine
months ended January 31, 2012 compared to the nine months ended January 31, 2011
are:


         Changes in net income - nine months ended January 31, 2012
               compared to nine months ended January 31, 2011

----------------------------------------------------------------------------
----------------------------------------------------------------------------
Change in fair value adjustment on investment properties          ($536,978)
Change in deferred taxes on investment properties                   379,123
Net operating income                                                 54,996
Increase in administration expenses                                (108,947)
Reduction in current income taxes                                    58,970
Other items                                                           7,677
                                                             ---------------
Change in net income                                              ($145,159)
                                                             ---------------
                                                             ---------------


NET OPERATING INCOME

Net operating income for the nine months ended January 31, 2012, increased by
$54,997 to $2,642,749 compared to $2,587,752 in 2011. The increase was
predominantly the result of the successful completion of a number of lease
renewal negotiations and reduced property operating expenses.


ADJUSTED FUNDS FROM OPERATIONS
----------------------------------------------------------------------------
                                                          Nine months ended
                                                                 January 31
Reconciliation of reported income to AFFO                2012          2011
----------------------------------------------------------------------------
----------------------------------------------------------------------------
Net income attributable to common and special
 shareholders                                     $ 2,214,181  $  2,359,340
Items not affecting cash:
  Fair value gains on investment properties          (706,641)   (1,243,619)
  Deferred income taxes                              (125,527)      253,596
  Straight line rent                                  (59,394)      (55,611)
  Sustaining capital expenditures                     (43,966)      (70,770)
----------------------------------------------------------------------------
Adjusted funds from operations                    $ 1,278,653  $  1,242,935
----------------------------------------------------------------------------
----------------------------------------------------------------------------

Adjusted funds from operations per share          $      0.71  $       0.69
----------------------------------------------------------------------------
----------------------------------------------------------------------------


For the nine months ended January 31, 2012 the Company recorded Adjusted funds
from operations of $1,278,653 ($0.71 per share) compared to $1,242,935 ($0.69
per share) in 2011. This increase is largely the result of higher operating
income combined with reduced current income tax rates and lower sustaining
capital expenditures, offset by higher administration expenses related to the
implementation of IFRS reporting standards.


DIVIDEND

The Directors of the Company have declared a regular dividend on Class B Special
and Common Shares of 35 cents per share. The regular dividend of 35 cents will
be paid to those shareholders of record as of March 27, 2012 and payable on
April 10, 2012.


The dividends for Canadian tax purposes will be considered as an eligible dividend.

The Company's interim unaudited financial statements for the nine months ended
January 31, 2012, along with the Management's Discussion and Analysis will be
filed with SEDAR at www.sedar.com.


Readers are cautioned that although the terms "Net Operating Income", and "Funds
From Operations" are commonly used to measure, compare and explain the operating
and financial performance of Canadian real estate companies and such terms are
defined in the Management's Discussion and Analysis, such terms are not
recognized terms under Canadian generally accepted accounting principles. Such
terms do not necessarily have a standardized meaning and may not be comparable
to similarly titled measures presented by the other publicly traded entities.


For the Board of Directors,

G.W.J. Pottow, President
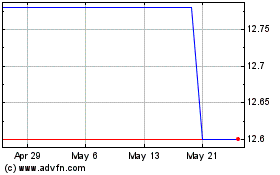
Becker Milk (TSX:BEK.B)
Historical Stock Chart
From May 2024 to Jun 2024

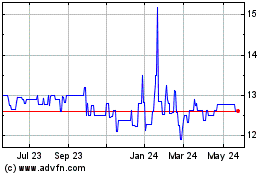
Becker Milk (TSX:BEK.B)
Historical Stock Chart
From Jun 2023 to Jun 2024
