Hypertension Diagnostics, Inc. (OTCBB: HDII) (www.hdii.com), today
announced financial results for the third quarter of fiscal year
2010 ended March 31, 2010 (Q3 2010).
Revenue for Q3 2010 totaled $126,261 compared to $64,765 for the
quarter ended March 31, 2009 (Q3 2009), which represents a 95%
increase. The Company's net loss was $334,377 for Q3 2010 or $(.01)
per share, compared with a net loss of $18,989 for Q3 2009, or
$(.00) per share. Included in the net loss for Q3 2010 are total
non-cash charges (deferred compensation, depreciation, stock
options) expenses of $229,317. In Q3 2009, total non-cash benefits
were $122,123. The increase in the Company's stock price during Q3
2010 resulted in a deferred compensation charge of $198,750. The
decrease in the Company's stock price during Q3 2009 resulted in a
deferred compensation benefit of $147,000. When deferred
compensation expense, which is largely influenced by changes in the
Company's stock price, is excluded the Company generated a non-GAAP
pro-forma net loss of $135,267 for Q3 2010 and a net loss of
$165,989 for Q3 2009.
For the nine month period ended March 31, 2010 (9 months FY
2010), total revenue was $886,661 compared to $338,484 for the nine
month period ended March 31, 2009 (9 months FY 2009), a 162%
increase. For the 9 months FY 2010, the Company incurred a net loss
of $1,347,573, including a non-cash charge of $1,400,324, or $.03
per share, compared with a net loss of $88,549, including a
non-cash benefit of $234,643, or $(.00) per share, for the 9 months
FY 2009. When deferred compensation expense, which is largely
influenced by changes in the Company's stock price, is excluded the
Company generated a non-GAAP pro-forma net loss of $25,323 for the
9 months FY 2010 and $398,299 for the 9 months FY 2009. The Company
reported a cash balance on March 31, 2010 of $942,976.
"We are pleased with the continued rebound in our sales," said
Mark Schwartz, Chairman and CEO. "Our third quarter sales results
provide encouragement that our market is recovering. We are
implementing a plan to aggressively expand our U.S. independent
distribution network. Over the next nine months, the Company's
objective is to double the number of our independent distributor
groups in the U.S.," said Schwartz.
About Hypertension Diagnostics, Inc.
Hypertension Diagnostics, Inc. ("HDI") manufactures and markets
medical devices for early detection and management of
cardiovascular disease in the U.S. and in 37 countries. Its main
product, the CVProfilor® DO-2020 CardioVascular Profiling System,
has been approved by the Food and Drug Administration (FDA), and is
being marketed to primary care physicians in the U.S. HDI's
CardioVascular Profiling Systems non-invasively measure both large
and small artery elasticity. Small artery elasticity has been shown
to be predictive of cardiovascular disease. Several large
pharmaceutical manufacturers have used HDI's CardioVascular
Profiling Systems in their multi-site clinical research trials.
There are over 300 published, peer-reviewed scientific articles and
presentations on HDI's methodology, which provides evidence on the
validity, accuracy and reproducibility of HDI's CardioVascular
Profiling technology. The technology was developed at the
University of Minnesota by a team led by world-renown cardiologist,
Dr. Jay N. Cohn.
Safe Harbor Statement
Forward-looking statements in this press release are made under
the safe harbor provisions of the Private Securities Litigation
Reform Act of 1995. The Company wishes to caution readers not to
place undue reliance on any forward-looking statements and to
recognize that the statements are not a prediction of actual future
results. Actual results could differ materially from those
presented and anticipated in the forward-looking statements due to
the risks and uncertainties set forth in the Company's 2009 Annual
Report on Form 10-K, and subsequent Quarterly Reports on Form 10-Q,
all of which were filed with the U.S. Securities and Exchange
Commission, as well as others not now anticipated.
                      Hypertension Diagnostics, Inc.
                          Summary Financial Data


Statements of Operations

                       Three Months Ended           Nine Months Ended
                             March 31                     March 31
                    --------------------------  --------------------------
                        2010          2009          2010          2009
                    ------------  ------------  ------------  ------------
Revenue:
   Equipment sales  $     71,000  $     28,000  $    730,825  $    206,837
   Equipment rental       15,092        17,627        60,335        67,443
   Warranty, parts
    & supplies
    income                40,169        19,138        95,501        64,204
                    ------------  ------------  ------------  ------------
                         126,261        64,765       886,661       338,484

                    ------------  ------------  ------------  ------------
Cost of Sales             23,586        27,369        99,564        99,155
                    ------------  ------------  ------------  ------------
Gross Profit             102,675        37,396       787,097       239,329

Selling, general
 and administrative
 expenses                440,388        58,331     2,141,895       339,671
                    ------------  ------------  ------------  ------------

                    ------------  ------------  ------------  ------------
Operating Income
 (Loss)                 (337,713)      (20,935)   (1,354,798)     (100,342)

                    ------------  ------------  ------------  ------------
Interest income            3,336         1,946         7,225        11,793
                    ------------  ------------  ------------  ------------

Net loss before
 income taxes           (334,377)      (18,989)   (1,347,573)      (88,549)
   Income Taxes                -             -             -             -
                    ------------  ------------  ------------  ------------
      Net loss      $   (334,377) $    (18,989) $ (1,347,573) $    (88,549)
                    ============  ============  ============  ============

Basic and Diluted
 Net Loss per Share $       (.01) $        .00  $       (.03) $        .00
Weighted Average
 Shares Outstanding
 Basic & Diluted      41,238,664    40,795,820    41,142,729    40,650,494

Net income (loss)   $   (334,337) $    (18,989) $ (1,347,573) $    (88,549)
Deferred
 compensation
 expense                 198,750      (147,000)    1,322,250      (309,750)
                    ------------  ------------  ------------  ------------
Non-GAPP Pro-forma
 net income (loss)
(excluding deferred
 compensation
 expense)           ($   135,627) ($   165,989) ($    25,323) ($   398,299)


Balance Sheet Data
                                             March 31, 2010  June 30, 2009
                                             --------------  -------------
Cash and cash equivalents                    $      942,976  $     697,918
Total current assets                              1,244,369      1,022,528
Total assets                                      1,252,554      1,032,787
Total current liabilities                           246,778        340,384
Accumulated deficit                             (28,782,180)   (27,434,607)
Total shareholders' equity                         (609,882)       660,041
CVProfilor is a registered trademark of Hypertension
Diagnostics, Inc.
Hypertension Diagnostics, HDI/PulseWave, PulseWave and CVProfile
are trademarks of Hypertension Diagnostics, Inc. All rights
reserved.
Website: www.hdii.com
Contact: Mark N. Schwartz CEO (651) 687-9999
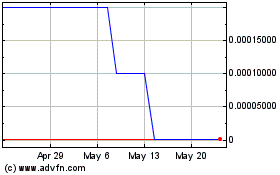
Hypertension Diagnositc (CE) (USOTC:HDII)
Historical Stock Chart
From Dec 2024 to Jan 2025

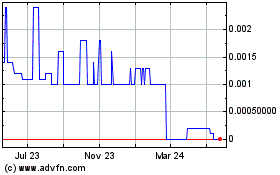
Hypertension Diagnositc (CE) (USOTC:HDII)
Historical Stock Chart
From Jan 2024 to Jan 2025
