The Company currently has no bank borrowings. However the Board recognises that to sustain and grow the business additional working capital finance is required and it is presently reviewing its options for raising additional equity and debt.

While orders have been slow in the first half of 2013 all of the signs are that order intake will improve in the second half although it is largely 2014 that will see the benefit of this trend.

Raschid Abdullah

30 September 2013

Condensed Consolidated Income Statement

for the six months ended 30 June 2013

 
                                                Unaudited  Unaudited       Audited 
                                                 6 months   6 months          year 
                                                    ended      ended         ended 
                                                  30 June    30 June   31 December 
                                Note                 2013       2012          2012 
                                                   GBP000     GBP000     GBP000 
 
Revenue                                             3,572      4,667         9,013 
Cost of sales                                     (2,147)    (2,741)       (5,125) 
 
Gross profit                                        1,425      1,926         3,888 
 
Administrative expenses                           (1,724)    (1,875)       (3,561) 
 
Operating (loss)/profit                             (299)         51           327 
Financial income                                       15          -             - 
Financial expenses                                   (54)       (29)         (121) 
 
(Loss)/profit before tax                            (338)         22           206 
Income tax                       2                      -          -           (6) 
 
(Loss)/profit for the period 
 attributable to equity 
 shareholders of the company                        (338)         22           200 
 
 
Basic and diluted earnings 
 per share                       3                (3.11)p      0.35p         2.92p 


The above results are derived from continuing operations.

Condensed Consolidated Statement of Comprehensive Income

for the six month period ended 30 June 2013

 
                                        Unaudited  Unaudited       Audited 
                                         6 months   6 months          year 
                                            ended      ended         ended 
                                          30 June    30 June   31 December 
                                             2013       2012          2012 
                                           GBP000     GBP000        GBP000 
 
(Loss)/profit for period                    (338)         22           200 
 
Other comprehensive income 
Currency translation on foreign 
 currency net investments                    (13)          -            16 
 
Total comprehensive income for 
 the period                                 (351)         22           216 


Condensed Consolidated Statement of Changes in Equity

for the six month period ended 30 June 2013

 
                                                                   Currency 
                                 Share      Share    Retained   translation     Total 
                               capital    premium    earnings   differences    equity 
                                GBP000     GBP000      GBP000        GBP000    GBP000 
 
Balance at 1 January 2012 
 (audited)                       6,367     23,223    (29,016)         (214)       360 
Profit for the period                -          -          22             -        22 
Other comprehensive income           -          -           -             -         - 
 
Total comprehensive income 
 for the period                      -          -          22             -        22 
Equity-settled share based 
 payments                            -          -           1             -         1 
 
Balance at 30 June 2012 
 (unaudited)                     6,367     23,223    (28,993)         (214)       383 
 
Balance at 1 January 2012 
 (audited)                       6,367     23,223    (29,016)         (214)       360 
Profit for the year                  -          -         200             -       200 
Other comprehensive income           -          -           -            16        16 
 
Total comprehensive income 
 for the year                        -          -         200            16       216 
Equity-settled share based 
 payments                            -          -        (33)             -      (33) 
Share issue: open offer 
 and placing                        45      1,080           -             -     1,125 
Expenses of share issue              -      (151)           -             -     (151) 
 
Balance at 31 December 
 2012 (audited)                  6,412     24,152    (28,849)         (198)     1,517 
 
 
Balance at 1 January 2013 
 (audited)                       6,412     24,152    (28,849)         (198)     1,517 
Loss for the period                  -          -       (338)             -     (338) 
Other comprehensive income           -          -           -          (13)      (13) 
 
Total comprehensive income 
 for the period                      -          -       (338)          (13)     (351) 
Equity-settled share based           -          -           -             -         - 
 payments 
 
Balance at 30 June 2013 
 (unaudited)                     6,412     24,152    (29,187)         (211)     1,166 


Condensed Consolidated Balance Sheet

at 30 June 2013

 
                                           Unaudited      Unaudited        Audited 
                                             30 June        30 June    31 December 
                                                2013           2012           2012 
ASSETS                                        GBP000         GBP000         GBP000 
Non-current assets 
   Property, plant and equipment                 182            192            172 
   Goodwill                                      401            401            401 
   Development costs                             488            575            530 
   Deferred tax assets                           587            669            587 
 
                                               1,658          1,837          1,690 
 
Current assets 
   Inventories                                 1,924            823          1,211 
   Trade and other receivables                 1,311          1,662          1,528 
   Cash and cash equivalents - 
    escrow deposits                                -             77             77 
   Cash and cash equivalents                     256             23              5 
 
                                               3,491          2,585          2,821 
 
Total assets                                   5,149          4,422          4,511 
 
EQUITY AND LIABILITIES 
Equity attributable to equity 
 holders of the parent 
   Share capital                               6,412          6,367          6,412 
   Share premium                              24,152         23,223         24,152 
   Currency translation reserve                (211)          (214)          (198) 
   Retained earnings deficit                (29,187)       (28,993)       (28,849) 
 
Total equity                                   1,166            383          1,517 
 
Non-current liabilities 
   Deferred tax liabilities                      122            132            122 
 
                                                 122            132            122 
 
Current liabilities 
   Interest-bearing loans and 
    borrowings                                 1,334            814             94 
   Trade and other payables                    2,527          3,093          2,778 
 
                                               3,861          3,907          2,872 
 
Total liabilities                              3,983          4,039          2,994 


Total equity and liabilities                      5,149          4,422     4,511 


Condensed Consolidated Statement of Cash Flows

for the six month period ended 30 June 2013

 
                                                  Unaudited  Unaudited       Audited 
                                                   6 months   6 months          year 
                                                      ended      ended         ended 
                                                    30 June    30 June   31 December 
                                                       2013       2012          2012 
                                                     GBP000     GBP000        GBP000 
Cash flows from operating activities 
(Loss)/profit for the period                          (338)         22           200 
   Adjustments for: 
   Depreciation                                          24         33            57 
   Amortisation of intangible assets                     45        158           223 
   Financial income                                    (15)          -             - 
   Financial expense                                     54         29           121 
   Equity settled share-based payment expenses            -          1          (33) 
   Income tax charge                                      -          -             6 
   Exchange differences                                (13)          -            16 
 
Operating cash flows before movement in 
 working capital                                      (243)        243           590 
   Change in trade and other receivables                217      1,425         1,559 
   Change in inventories                              (713)        414            26 
   Change in trade and other payables                 (251)    (1,299)       (1,581) 
 
Cash (absorbed by)/generated from operations          (990)        783           594 
   Interest paid                                       (39)       (29)         (123) 
   Income tax received                                    -        162           196 
 
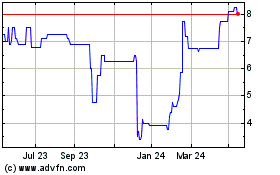
Petards (LSE:PEG)
Historical Stock Chart
From Jun 2024 to Jul 2024 Click Here for more Petards Charts.
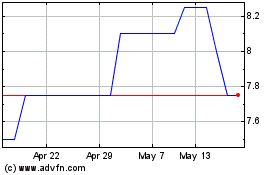
Petards (LSE:PEG)
Historical Stock Chart
From Jul 2023 to Jul 2024 Click Here for more Petards Charts.