Bitcoin Dominance Hits New Cycle High Of 58.9%, More Pain Before Altcoin Season?
17 October 2024 - 6:00PM
NEWSBTC
As Bitcoin (BTC) inches closer to $70,000, its dominance in the
wider crypto market has risen to a cycle high of 58.9%. Bitcoin
Dominance Rises, Are Altcoins In Trouble? Bitcoin dominance
(BTC.D), a metric that measures the proportion of the total
cryptocurrency market cap commanded by the leading digital asset,
has hit a new cycle high of 58.9%. The last time the crypto market
witnessed this level of BTC.D was in April 2021. After a slight
pullback following Iran’s attack on Israel earlier this month,
Bitcoin has risen by almost 10% in the past week, trading at
$67,769 at the time of writing. Related Reading: Crypto
Market’s “Shallow Sell-Off” Indicative Of Strong Bid For Risk
Assets: Trading Firm Concurrently, the total crypto market cap has
surged from $2.26 trillion on October 8, to $2.41 trillion on
October 16, according to data from CoinGecko. However, the rise in
the total crypto market cap is largely buoyed by the upward
movement in BTC price. At the start of October, BTC.D hovered
around 57.1%. Since then, it has risen by approximately 1.8%,
showcasing Bitcoin’s strong performance relative to altcoins such
as Ethereum (ETH), Solana (SOL), Binance Coin (BNB), and others.
The current level of BTC.D has cast doubt on the prospects for the
much-anticipated “altseason,” typically characterized by parabolic
price increases in altcoins and a decline in BTC.D. Notably, BTC.D
peaked at 70% during the post-COVID bull market in 2020-21 before
dropping to 40% by mid-2021. In late 2022, BTC.D bottomed out at
around 39% amid the collapse of FTX, which halted operations due to
fraud charges against its leadership. Since then, BTC.D has been on
a gradual rise, as shown in the chart below. ETH/BTC Ratio Must
Rebound For A Potential Altseason As BTC.D continues to rise, it is
important to consider the ETH/BTC trading pair. For the
uninitiated, the ETH/BTC trading pair – colloquially known as the
ETH/BTC ratio – tracks Ethereum’s (ETH) performance against BTC.
Related Reading: Ethereum Gains On Bitcoin Following Fed Rate Cut:
Altseason Soon? At press time, ETH/BTC trading pair stands at
0.0385, a level last seen in April 2021. The chart below shows that
Ethereum has failed to establish a higher high against Bitcoin
since at least November 2022, reflecting weak ETH price action over
the past two years. A strong ETH performance against BTC often
precedes an altseason, but there are no clear signs of a meaningful
trend reversal. Further, the total value locked (TVL) in
decentralized finance (DeFi) protocols across all blockchains has
slid from almost $110 billion in June 2024 to $88 billion,
indicating weak demand for altcoins among crypto investors.
However, some crypto analysts and technical indicators still
suggest a potential altseason may be on the horizon. For example,
earlier this month, the altcoin market cap surpassed its 200-day
exponential moving average (EMA), a key resistance level that
signals strong altcoin performance in recent days. Similarly, Steno
Research recently remarked that ETH is set for a comeback following
the US Federal Reserve (Fed) interest rate cuts. BTC trades at
$67,769 at press time, up 2.5% in the past 24 hours. Featured image
from Unsplash, Charts from Tradingview.com
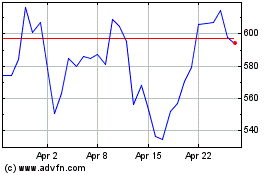
Binance Coin (COIN:BNBUSD)
Historical Stock Chart
From Oct 2024 to Nov 2024

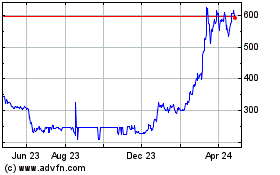
Binance Coin (COIN:BNBUSD)
Historical Stock Chart
From Nov 2023 to Nov 2024
