Worldcoin Gains Upside Momentum: Is A Major Breakout Ahead?
16 October 2024 - 4:00AM
NEWSBTC
Worldcoin (WLD) is showing signs of a strong upward push, gaining
traction toward the $3.2 key resistance level. As market optimism
builds, many are wondering whether Worldcoin is on the verge of a
major breakout that could propel it to new highs or if current
gains might face resistance in the near term. With growing
momentum in its favor, this analysis explores the recent bullish
momentum behind WLD and assesses whether it has the potential to
trigger a major breakout. By evaluating key resistance levels,
technical indicators, and overall market sentiment, we seek to
determine if this rally can push the token to new highs or if a
reversal is on the horizon. Analyzing Recent Gains Of Worldcoin WLD
is currently trading above the 4-hour 100-day Simple Moving Average
(SMA), indicating a robust bullish trend. The recent breakout above
the key $2.1 resistance level further strengthens its upward
momentum, suggesting that buyers are actively pushing the price
higher. Should WLD maintain its position above this key
threshold, it could open the door for more gains, with the next
target potentially set at the $3.2 resistance level in the near
future. An analysis of the 4-hour Relative Strength Index (RSI)
reveals renewed bullish potential, as the RSI has surged to 77%
after dipping to 52%. A reading above 70% often signals that an
asset is approaching overbought conditions, indicating that WLD
could experience short-term consolidation or profit-taking.
However, if the buying pressure persists, it could lead to further
upward movement, driving the price toward higher resistance levels.
Related Reading: No Ties To OpenAI: Worldcoin Drops 9% As Top
Trader Issues Warning Furthermore, the daily chart shows that
Worldcoin is experiencing considerable pressure on the upside,
characterized by a series of bullish candlestick formations. This
positive trend is underscored by the asset’s position above the
critical $2.1 support level and the 100-day SMA. As WLD maintains
this upward trajectory, it reinforces optimistic sentiment in the
market, setting the stage for potential gains as it approaches
higher resistance levels. Lastly, the RSI on the daily chart is
currently positioned at 72%, well above the pivotal 50% threshold,
which suggests that buying pressure significantly outweighs selling
pressure in the market. Can WLD Maintain Its Uptrend, Or Will Bears
Intervene? WLD is currently exhibiting strong, upbeat momentum as
it approaches the $3.2 resistance level. A successful breakout
above this mark could unlock additional gains, potentially driving
the price toward the $5.2 resistance level. Related Reading:
Worldcoin Drops 6% Amid Alameda Research 1.5 Million Token Sale,
Will WLD Price Hold? Conversely, if bears take control at the $3.2
resistance level, the price may start to decline toward the $2.1
support range. A drop below this level could trigger a deeper
decline, possibly leading to a test of the $1.2 support level and
beyond. Featured image from LinkedIn, chart from Tradingview.com
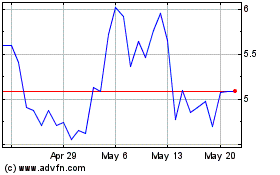
Worldcoin (COIN:WLDUSD)
Historical Stock Chart
From Oct 2024 to Nov 2024

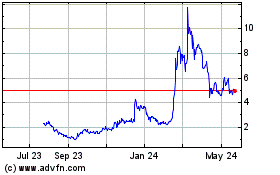
Worldcoin (COIN:WLDUSD)
Historical Stock Chart
From Nov 2023 to Nov 2024
