FTSE 4Good Global 100 Key Figures
|
FTSE 4Good Global 100 Balance Sheet| %1$s Balance Sheet | | Sorry No Data Available |
|
 Share Price Performance| Share Price Performance | | Sample Period † | High | Low | | 1 week | 15,006.87 | 14,683.10 |
| 4 weeks | 15,183.02 | 14,365.87 |
| 12 weeks | 15,183.02 | 14,328.71 |
| 1 year | 15,183.02 | 12,544.65 |
Share Price Chart (5 years)| Share Price Chart (5 years) | 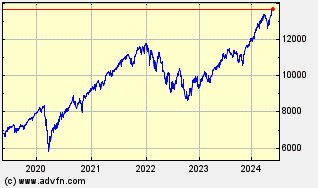 |
|
FTSE 4Good Global 100 Historic Returns| %1$s Historic Returns | | Period † | Open | Change | % | Open Avg. | Avg. Daily Vol [m] | Total Vol [m] | VWAP | | 1 week | 14,704.19 | 232.53 | 1.58 | 14,683.10 | - | | - |
| 4 weeks | 14,457.46 | 479.26 | 3.31 | 14,365.87 | - | | - |
| 12 weeks | 14,480.47 | 456.25 | 3.15 | 14,328.71 | - | | - |
| 26 weeks | 13,682.63 | 1,254.09 | 9.17 | 13,662.72 | - | | - |
| 1 year | 12,882.48 | 2,054.24 | 15.95 | 12,544.65 | - | | - |
| 3 years | 11,237.55 | 3,699.17 | 32.92 | 8,401.72 | - | | - |
| 5 years | 8,280.65 | 6,656.07 | 80.38 | 5,637.32 | - | | - |
| † periods calculated are whole weeks rather than calendar months | |
|
