CME Group, Cheniere Energy Team Up to Launch LNG Futures Contract
11 July 2018 - 2:17AM
Dow Jones News
By Alistair MacDonald
CME Group Inc. said Tuesday that it is launching a
liquefied-natural-gas futures contract, as industry participants
continue their efforts to revolutionize this market by providing a
global benchmark to help price and trade the commodity.
Last May, Intercontinental Exchange Inc. and S&P Global
Platts launched a futures contract based on U.S. LNG exports.
The two attempts come as increasing shipments of LNG from the
U.S. and elsewhere have helped create a spot, or short-term,
market. A widely used futures contract could help integrate several
regional gas markets and become an international benchmark like
Brent and West Texas Intermediate became for oil. That will make it
easier to price LNG while offering investors a vehicle to speculate
on its price and market players a way to hedge their risks in this
market.
The CME is launching its product with Houston-based Cheniere
Energy Inc. The futures will be referenced to physical delivery of
LNG to Cheniere's Sabine Pass terminal on the U.S. Gulf Coast.
"This agreement with Cheniere is significant because it will be
the foundation for developing a new LNG risk management tool for
producers, consumers and traders around the globe," Peter Keavey,
CME Group's Global Head of Energy, said in an emailed
statement.
Currently, there is no global price benchmark for LNG. Buyers
and sellers mainly agree to yearslong LNG contracts priced off oil,
gas that is piped and price-reporting agencies' data.
The Wall Street Journal reported in December 2016 that the two
exchange groups were looking to create LNG futures contracts.
Companies have tried before to create LNG benchmarks with
limited success, including Japan OTC Exchange and the Singapore
Exchange, better known as SGX. But industry analysts say that the
chance of success is greater with an increasingly large spot market
underpinning the futures contract -- an agreement to buy or sell an
underlying asset.
--Sarah Mcfarlane contributed to this article.
Write to Alistair MacDonald at alistair.macdonald@wsj.com
(END) Dow Jones Newswires
July 10, 2018 12:02 ET (16:02 GMT)
Copyright (c) 2018 Dow Jones & Company, Inc.
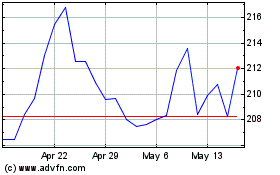
CME (NASDAQ:CME)
Historical Stock Chart
From Jun 2024 to Jul 2024

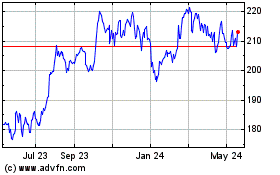
CME (NASDAQ:CME)
Historical Stock Chart
From Jul 2023 to Jul 2024
