Regeneron Pharmaceuticals Up Over 6%, On Pace for Highest Close Since November 2015 -- Data Talk
06 May 2020 - 2:29AM
Dow Jones News
Regeneron Pharmaceuticals, Inc. (REGN) is currently at $574.69,
up $32.87 or 6.07%
-- Would be highest close since Nov. 20, 2015, when it closed at
$579.57
-- On pace for largest percent increase since March 17, 2020,
when it rose 11.54%
-- Earlier Tuesday, Regeneron Pharmaceuticals reported
first-quarter earnings of $624.6 million, or $5.43 a share, in the
first quarter, compared with $461.1 million, or $3.99 a year ago.
Adjusted earnings were $6.60 a share. Analysts had forecasted
adjusted earnings of $5.25 a share. Sales were $1.83 billion in the
quarter, up from $1.37 billion a year ago. Analysts had expected
$1.76 billion
-- The company said human trials of a new Covid-19 drug are
slated to begin in summer. The drugmaker said its novel antibody
cocktail, REGN-COV2, could be used to prevent and treat Covid-19
and will enter human trials in June, said Leonard Schleifer, chief
executive at Regeneron
-- Regeneron Pharmaceuticals and Sanofi SA on Tuesday said
Libtayo showed clinically meaningful and durable responses in
second-line advanced basal cell carcinoma in an open-label phase 2
study
-- Up 53.05% year-to-date
-- Down 2.99% from its all-time closing high of $592.40 on Aug.
5, 2015
-- Up 78.25% from 52 weeks ago (May 7, 2019), when it closed at
$322.40
-- Would be a new 52 week closing high
-- Up 110.16% from its 52 week closing low of $273.46 on Sept.
27, 2019
-- Traded as high as $581.00; highest intraday level since Nov.
23, 2015, when it hit $584.59
-- Up 7.23% at today's intraday high; largest intraday percent
increase since March 23, 2020, when it rose as much as 8.79%
-- Ninth best performer in the S&P 500 today
-- Third best performer in the Nasdaq 100 today
All data as of 11:47:42 AM
Source: Dow Jones Market Data, FactSet
(END) Dow Jones Newswires
May 05, 2020 12:14 ET (16:14 GMT)
Copyright (c) 2020 Dow Jones & Company, Inc.
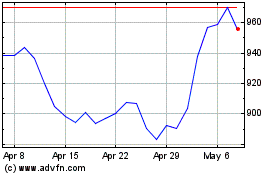
Regeneron Pharmaceuticals (NASDAQ:REGN)
Historical Stock Chart
From Jun 2024 to Jul 2024

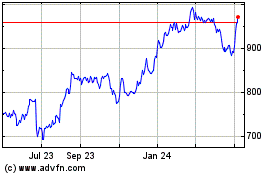
Regeneron Pharmaceuticals (NASDAQ:REGN)
Historical Stock Chart
From Jul 2023 to Jul 2024
