false
N-2
N-CSRS
LIBERTY ALL STAR GROWTH FUND INC.
0000786035
0000786035
2024-01-01
2024-06-30
iso4217:USD
xbrli:shares
iso4217:USD
xbrli:shares
xbrli:pure
UNITED STATES
SECURITIES AND EXCHANGE COMMISSION
Washington, D.C. 20549
FORM N-CSR
CERTIFIED SHAREHOLDER REPORT OF REGISTERED
MANAGEMENT INVESTMENT COMPANIES
Investment Company Act file number: 811-04537
Liberty All-Star Growth Fund, Inc.
(Exact name of registrant as specified in charter)
1290 Broadway, Suite 1000, Denver, Colorado 80203
(Address of principal executive offices) (Zip code)
Sareena Khwaja-Dixon, Esq.
ALPS Fund Services, Inc.
1290 Broadway, Suite 1000
Denver, Colorado 80203
(Name and address of agent for service)
Registrant’s telephone number, including area
code: 303-623-2577
Date of fiscal year end: December 31
Date of reporting period: January 1, 2024 - June 30, 2024
Item 1. Report to Stockholders.
(a)
Contents
| 1 |
President’s
Letter |
| 5 |
Table
of Distributions, Rights Offerings and Distribution Policy |
| 6 |
Stock
Changes in the Quarter |
| 7 |
Top
20 Holdings and Economic Sectors |
| 8 |
Investment
Managers/Portfolio Characteristics |
| 9 |
Manager
Interview |
| 11 |
Schedule
of Investments |
| 17 |
Statement
of Assets and Liabilities |
| 18 |
Statement
of Operations |
| 19 |
Statements
of Changes in Net Assets |
| 20 |
Financial
Highlights |
| 22 |
Notes
to Financial Statements |
| 31 |
Consideration
of the Advisory Agreement |
| 34 |
Description
of Lipper Benchmark and Market Indices |
| Inside
Back Cover: Fund Information |
A
SINGLE INVESTMENT...
A
DIVERSIFIED GROWTH PORTFOLIO
A
single fund that offers:
| ● | A
diversified, multi-managed portfolio of small-, mid- and large-cap growth stocks |
| ● | Exposure
to many of the industries that make the U.S. economy one of the world’s most dynamic |
| ● | Access
to institutional quality investment managers |
| ● | Objective
and ongoing manager evaluation |
| ● | Active
portfolio rebalancing |
| ● | A
quarterly fixed distribution policy |
| ● | Actively
managed, exchange-traded, closed-end fund listed on the New York Stock Exchange (ticker symbol: ASG) |
LIBERTY
ALL-STAR® GROWTH FUND, INC.
| Liberty
All-Star® Growth Fund |
President’s
Letter |
(Unaudited)
| Fellow
Shareholders: |
July
2024 |
Mega-cap
technology stocks rallied around the Artificial Intelligence (AI) themed names that posted exceptional returns in the second quarter
and first half of 2024. In their wake, they carried the rest of the market higher, but it was the same tale of two markets that
over the past 18 months has seen outsized gains concentrated in a handful of names while the rest of the market delivered middling
or even negative returns. For the second quarter the group of stocks known as the “Magnificent Seven1”
shored up the return of the S&P 500®; NVIDIA led returns with a gain of 36.74 percent for the quarter and 149.50
percent for the first half after rising 239.02 percent in 2023.
Through
the first half of 2024, this extreme concentration grew even more pronounced. Information technology and communication services
were the only two sectors out of the 11 S&P 500® sectors to outperform the overall index. By itself, information
technology accounted for over 50 percent of the first half return for the S&P 500® Index.
Among
the growth style indexes, there was great disparity across the capitalization range. For the first half, the large-cap Russell
1000® Growth Index returned 20.70 percent while the Russell Midcap® Growth Index returned 5.98 percent
and the small-cap Russell 2000® Growth Index returned 4.44 percent. Underscoring the disparity across the capitalization
range, in the second quarter the midcap and small-cap growth indices declined -3.21 percent and -2.92 percent, respectively. Only
the Russell 1000® Growth showed a positive return (8.33 percent). (Please refer to the chart on page 3 for a visual
display of first half returns.)
One
metric that demonstrates how concentrated even a diversified index like the S&P 500® has become: 74 percent
of stocks in the index underperformed the index as a whole in the second quarter. Further, the S&P 500® Equal
Weight Index actually lost -2.63 percent in the second quarter. (S&P 500® Index returns are usually reported
on a capitalization-weighted basis in which larger stocks are given proportionally more weight; when returns are reported on an
equal-weighted basis every company in the index is treated equally regardless of market capitalization.) Finally, of the 11 S&P
sectors, six actually posted negative returns for the quarter.
While
overall stock market performance was skewed by robust returns from just a few stocks, the overall economic and business backdrop
in the second quarter (and first half) was relatively sound. Perhaps of greatest significance, the ongoing battle against inflation
showed progress. The Federal Reserve’s preferred inflation measure—the core Personal Consumption Expenditure Price
Index (PCE), which strips out volatile food and energy items—declined in May, falling to a yearly increase of 2.6 percent
from 2.9 percent in December and 4.6 percent in May 2023. A strong employment market showed some cooling in May as well, with
recurring applications for U.S. jobless benefits rising to the highest level since the end of 2021, indicating it is beginning
to take longer for the unemployed to find work. Hiring in general has slowed significantly from the pandemic era of labor shortages
and the unemployment rate rose in May to 4 percent for the first time in over two years. Another indicator of a lessening in inflationary
pressure was a meager 0.1 percent increase in retail sales in May, while April sales were revised downward.
| 1 | Those
stocks are Alphabet, Amazon, Apple, Meta Platforms, Microsoft, NVIDIA and Tesla. |
| Semi-Annual
Report (Unaudited) | June 30, 2024 |
1 |
| Liberty
All-Star® Growth Fund |
President’s
Letter |
(Unaudited)
These
indicators pointed to a slowing economy and thus heightened the possibility of lower interest rates. Economic data also indicated
the economy was on an even keel and therefore likely to avoid a “hard landing” that could mean recession. The S&P
500® was lower in April, but a key driver was concerns over geopolitical tensions in the Middle East. Spurred by
a 629 percent jump in year-over-year profits for NVIDIA, corporate earnings increased in the first quarter (reported in 2Q), led
by renewed sentiment favoring technology stocks. This sent the S&P 500® and NASDAQ Composite to multiple record
highs leading into the close of the first half.
Liberty
All-Star® Growth Fund
Liberty
All-Star® Growth Fund saw moderate losses in the second quarter, returning -1.93 percent when shares are valued
at net asset value (NAV) with dividends reinvested and -0.52 percent when shares are valued at market price with dividends reinvested.
(Fund returns are net of expenses.) Compared with the first quarter, returns were muted not only for the Fund, but for its primary
benchmark and other key indices. That primary benchmark, the Lipper Multi-Cap Growth Mutual Fund Average, returned 1.85 percent.
As noted, the S&P 500® returned 4.28 percent and the DJIA returned -1.27 percent. The NASDAQ Composite posted
the strongest return, 8.47 percent.
For
the first half the Fund returned 5.82 percent when shares are valued at NAV and 5.55 percent when shares are valued at market
price (with dividends reinvested in both instances). The Lipper benchmark gained 13.93 percent. Respective returns for the S&P
500®, DJIA and the NASDAQ Composite were 15.29 percent, 4.79 percent and 18.57 percent.
The
factors that affected Fund performance in the first quarter remained in place in the second. First, in an environment that continued
to reward mega-cap growth stocks, the Fund was hurt by holding stocks in its large-cap allocation with an average weighted market
capitalization that is less than half that of the Russell 1000® Growth Index. Second, as noted in the market commentary,
mid-cap and small-cap stocks trailed large-cap stocks by a considerable margin, a situation exacerbated by the dominance of those
few, select mega-cap names in information technology. Moreover, concentration was also a factor with the mid- and small- cap indexes
driven by the AI move. This condition is illustrated by the chart on the next page.
During
the second quarter the discount at which Fund shares traded relative to their underlying NAV widened to a range of -8.2 percent
to -10.2 percent, ending the quarter at -8.4 percent. For the full first half, the discount ranged from -6.7 percent to -10.2
percent.
In
accordance with the Fund’s distribution policy, the Fund paid a distribution of $0.12 per share in the second quarter, bringing
the total distributed to shareholders since 1997, when the distribution policy commenced, to $17.16 per share for a total of more
than $450 million. The Fund’s distribution policy is a major component of the Fund’s total return, and we continue
to emphasize that shareholders should include these distributions when determining the total return on their investment in the
Fund.
Turning
to Fund news, the Board of Directors has approved the selection of Westfield Capital Management to replace Sustainable Growth
Advisers as the Fund’s large-cap growth manager. This change is subject to shareholder approval at the annual meeting of
shareholders to be held on August 28. Westfield practices a growth at a reasonable price investment approach, which will be used
to manage the large-cap growth portion of this Fund’s portfolio. Additional information on Westfield can be found in the
proxy statement that was sent to shareholders and Westfield will be featured in future shareholder reports.
| Liberty
All-Star® Growth Fund |
President’s
Letter |
(Unaudited)
GROWTH
STOCK RETURNS FOR FIRST HALF 2024
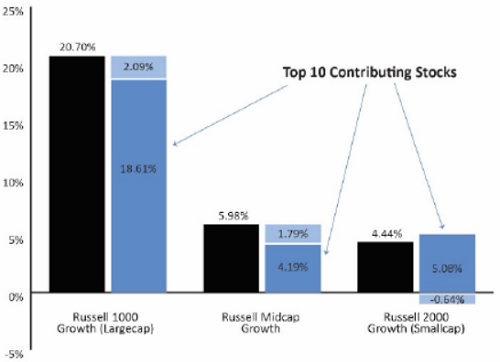
This
chart shows how concentrated growth stock returns were in the first half of 2024. The bar on the extreme left shows the 20.70
percent return of large-cap stocks comprising the Russell 1000® Growth Index. The bar next to it shows the top
10 contributing stocks accounted for 18.61 percentage points of that return, leaving the remaining stocks to generate a return
of just 2.09 percent. The middle set of bars shows the return of the Russell Midcap® Growth Index, 5.98 percent,
and that the top 10 stocks contributed 4.19 percent, meaning that all the remaining stocks returned 1.79 percent. The bars on
the right show returns for small-cap stocks comprising the Russell 2000® Growth Index. In this case, the top 10
returning stocks generated all (100 percent) of the index’s 4.44 percent return because these 10 names returned 5.08 percent
while the rest of index lost -0.64 percent.
There
is an old Wall Street adage that it’s not so much a stock market as it is a market of stocks. Thus far, in 2024, that piece
of Street wisdom is bearing out. The stock market as a whole is posting mediocre results while the market of stocks—and
a very few stocks at that—is soaring and pulling the others along with it. The fact that these stellar performers are large-
and mega-cap stocks only serves to leave behind what ordinarily would be attractive mid- and small-cap stocks. This is an unusual
set of circumstances, but such conditions have been known to persist. Eventually, the sentiment changes—and the change can
be quite dramatic. In the meantime, deviating from proven investment and portfolio construction principles to mirror the present
market invites an unacceptable level of risk. We will stay patient and manage in keeping with fundamentals that have proven effective
not in the moment, but over the years. Thank you for your support of the Fund.
Sincerely,
Mark
T. Haley, CFA
President
Liberty
All-Star® Growth Fund, Inc.
| Semi-Annual
Report (Unaudited) | June 30, 2024 |
3 |
| Liberty
All-Star® Growth Fund |
President’s
Letter |
(Unaudited)
| Fund Statistics (Periods ended June 30, 2024) |
| Net
Asset Value (NAV) |
$5.83 |
| Market
Price |
$5.34 |
| Discount |
-8.4% |
| |
Quarter |
Year-to-Date |
| Distributions* |
$0.12 |
$0.23 |
| Market
Price Trading Range |
$4.97
to $5.52 |
$4.97
to $5.54 |
| Discount
Range |
-8.2%
to -10.2% |
-6.7%
to -10.2% |
| Performance (Periods ended June 30, 2024) |
| Shares
Valued at NAV with Dividends Reinvested |
-1.93% |
5.82% |
| Shares
Valued at Market Price with Dividends Reinvested |
-0.52% |
5.55% |
| Dow
Jones Industrial Average |
-1.27% |
4.79% |
| Lipper
Multi-Cap Growth Mutual Fund Average |
1.85% |
13.93% |
| NASDAQ
Composite Index |
8.47% |
18.57% |
| Russell
Growth Average |
1.30% |
11.11% |
| S&P
500® Index |
4.28% |
15.29% |
| S&P
500® Equal Weight Index |
-2.63% |
5.08% |
| * | Sources
of distributions to shareholders may include ordinary dividends, long-term capital gains and return of capital. The final determination
of the source of all distributions in 2024 for tax reporting purposes will be made after year end. The actual amounts and sources
of the amounts for tax reporting purposes will depend upon the Fund’s investment experience during its fiscal year and may
be subject to changes based on tax regulations. Based on current estimates a portion of the distributions consist of a return
of capital. Pursuant to Section 852 of the Internal Revenue Code, the taxability of these distributions will be reported on Form
1099-DIV for 2024. |
Performance
returns for the Fund are total returns, which include dividends. Returns are net of management fees and other Fund expenses. The
returns shown for the Lipper Multi-Cap Growth Mutual Fund Average are based on open -end mutual funds’ total returns, which
include dividends, and are net of fund expenses. Returns for the unmanaged Dow Jones Industrial Average, NASDAQ Composite Index,
the Russell Growth Benchmark and the S&P 500® Indices are total returns, including dividends. A description
of the Lipper benchmark and the market indices can be found on page 34.
Past
performance cannot predict future results. Performance will fluctuate with market conditions. Current performance may be lower
or higher than the performance data shown. Performance information does not reflect the deduction of taxes that shareholders would
pay on Fund distributions or the sale of Fund shares. An investment in the Fund involves risk, including loss of principal. Closed-end
funds raise money in an initial public offering and shares are listed and traded on an exchange. Open-end mutual funds continuously
issue and redeem shares at net asset value. Shares of closed-end funds frequently trade at a discount to net asset value. The
price of the Fund’s shares is determined by a number of factors, several of which are beyond the control of the Fund. Therefore,
the Fund cannot predict whether its shares will trade at, below or above net asset value.
The
views expressed in the President’s letter and the Manager Interview reflect the views of the President and Manager as of
July 2024 and may not reflect their views on the date this report is first published or anytime thereafter. These views are not
guarantees of future performance and involve certain risks, uncertainties and assumptions that are difficult to predict so actual
outcomes and results may differ significantly from the views expressed. These views are subject to change at any time based upon
economic, market or other conditions and the Fund disclaims any responsibility to update such views. These views may not be relied
on as investment advice and, because investment decisions for the Fund are based on numerous factors, may not be relied on as
an indication of trading intent.
| Liberty
All-Star® Growth Fund |
Table
of Distributions,
Rights Offerings and Distribution Policy |
(Unaudited)
| |
|
Rights Offerings |
Year |
Per Share
Distributions |
Month
Completed |
Shares Needed to Purchase
One Additional Share |
Subscription
Price |
| 1997 |
$1.24 |
|
|
|
| 1998 |
1.35 |
July |
10 |
$12.41 |
| 1999 |
1.23 |
|
|
|
| 2000 |
1.34 |
|
|
|
| 2001 |
0.92 |
September |
8 |
6.64 |
| 2002 |
0.67 |
|
|
|
| 2003 |
0.58 |
September |
81 |
5.72 |
| 2004 |
0.63 |
|
|
|
| 2005 |
0.58 |
|
|
|
| 2006 |
0.59 |
|
|
|
| 2007 |
0.61 |
|
|
|
| 2008 |
0.47 |
|
|
|
| 20092 |
0.24 |
|
|
|
| 2010 |
0.25 |
|
|
|
| 2011 |
0.27 |
|
|
|
| 2012 |
0.27 |
|
|
|
| 2013 |
0.31 |
|
|
|
| 2014 |
0.33 |
|
|
|
| 20153 |
0.77 |
|
|
|
| 2016 |
0.36 |
|
|
|
| 2017 |
0.42 |
|
|
|
| 2018 |
0.46 |
November |
3 |
4.81 |
| 2019 |
0.46 |
|
|
|
| 2020 |
0.63 |
March |
5 |
4.34 |
| 2021 |
1.02 |
June |
51 |
8.21 |
| 2022 |
0.50 |
|
|
|
| 2023 |
0.43 |
|
|
|
| 2024 |
|
|
|
|
| 1st
Quarter |
0.11 |
|
|
|
| 2nd
Quarter |
0.12 |
|
|
|
| Total |
$17.16 |
|
|
|
| 1 | The
number of shares offered was increased by an additional 25 percent to cover a portion of the over-subscription requests. |
| 2 | Effective
with the second quarter distribution, the annual distribution rate was changed from 10 percent to 6 percent. |
| 3 | Effective
with the second quarter distribution, the annual distribution rate was changed from 6 percent to 8 percent. |
DISTRIBUTION
POLICY
The
current policy is to pay distributions on its shares totaling approximately 8 percent of its net asset value per year, payable
in four quarterly installments of 2 percent of the Fund’s net asset value at the close of the New York Stock Exchange on
the Friday prior to each quarterly declaration date. Sources of distributions to shareholders may include ordinary dividends,
long-term capital gains and return of capital. The final determination of the source of all distributions in 2024 for tax reporting
purposes will be made after year end. The actual amounts and sources of the amounts for tax reporting purposes will depend upon
the Fund’s investment experience during the remainder of its fiscal year and may be subject to changes based on tax regulations.
If a distribution includes anything other than net investment income, the Fund provides a Section 19(a) notice of the best estimate
of its distribution sources at that time. These estimates may not match the final tax characterization (for the full year’s
distributions) contained in shareholder 1099-DIV forms after the end of the year. If the Fund’s ordinary dividends and long-term
capital gains for any year exceed the amount distributed under the distribution policy, the Fund may, in its discretion, retain
and not distribute capital gains and pay income tax thereon to the extent of such excess.
| Semi-Annual
Report (Unaudited) | June 30, 2024 |
5 |
| Liberty All-Star® Growth Fund |
Stock Changes in the Quarter |
(Unaudited)
The
following are the largest ($2 million or more) stock changes - both purchases and sales - that were made in the Fund’s portfolio
during the second quarter of 2024.
| |
SHARES |
| Security
Name |
Purchases
(Sales) |
Held
as of 6/30/24 |
| Purchases |
|
|
| Apple, Inc. |
17,842 |
17,842 |
| Descartes Systems
Group, Inc. |
30,000 |
30,000 |
| Gartner, Inc. |
5,443 |
5,443 |
| Meta Platforms, Inc. |
7,498 |
7,498 |
| Penumbra, Inc. |
15,500 |
15,500 |
| Pure Storage, Inc. |
55,000 |
55,000 |
| Synopsys, Inc. |
4,508 |
4,508 |
| Weatherford International
PLC |
26,000 |
26,000 |
| Sales |
|
|
| Ball Corp. |
(41,432) |
0 |
| Bruker Corp. |
(35,000) |
0 |
| ChampionX Corp. |
(95,000) |
0 |
| Equinix, Inc. |
(3,291) |
0 |
| IQVIA Holdings, Inc. |
(13,863) |
0 |
| Mettler-Toledo International,
Inc. |
(2,150) |
0 |
| Paycom Software, Inc. |
(12,500) |
0 |
| Sherwin-Williams Co. |
(9,406) |
0 |
| Liberty
All-Star® Growth Fund |
Top
20 Holdings & Economic Sectors |
| |
June
30, 2024 (Unaudited) |
| Top
20 Holdings* |
Percent
of Net Assets |
| Microsoft
Corp. |
2.38% |
| Amazon.com,
Inc. |
2.31 |
| SPS
Commerce, Inc. |
2.26 |
| Glaukos
Corp. |
1.87 |
| Natera,
Inc. |
1.86 |
| Vertex,
Inc. |
1.81 |
| Casella
Waste Systems, Inc. |
1.80 |
| FirstService
Corp. |
1.70 |
| StepStone
Group, Inc. |
1.63 |
| Visa,
Inc. |
1.63 |
| UnitedHealth
Group, Inc. |
1.58 |
| Hamilton
Lane, Inc. |
1.41 |
| Crane
Co. |
1.34 |
| S&P
Global, Inc. |
1.34 |
| Novo
Nordisk A/S |
1.30 |
| Monolithic
Power Systems, Inc. |
1.29 |
| Transcat,
Inc. |
1.25 |
| NVIDIA
Corp. |
1.24 |
| Workday,
Inc. |
1.23 |
| Danaher
Corp. |
1.19 |
| |
32.42% |
| Economic
Sectors* |
Percent
of Net Assets |
| Information
Technology |
26.61% |
| Health
Care |
19.79 |
| Industrials |
17.06 |
| Financials |
13.40 |
| Consumer
Discretionary |
10.18 |
| Communication
Services |
3.93 |
| Consumer
Staples |
1.93 |
| Materials |
1.89 |
| Real
Estate |
1.70 |
| Energy |
1.09 |
| Other
Net Assets |
2.42 |
| |
100.00% |
| * | Because
the Fund is actively managed, there can be no guarantee that the Fund will continue to
hold securities of the indicated issuers and sectors in the future. |
| Semi-Annual Report (Unaudited)
| June 30, 2024 |
7 |
| Liberty All-Star®
Growth Fund |
|
Investment
Managers/
Portfolio Characteristics |
(Unaudited)
THE
FUND’S THREE GROWTH INVESTMENT MANAGERS
AND THE MARKET CAPITALIZATION ON WHICH EACH FOCUSES:

ALPS
Advisors, Inc., the investment advisor to the Fund, has the ultimate authority (subject to oversight by the Board of Directors)
to oversee the investment managers and recommend their hiring, termination and replacement.
MANAGERS’
DIFFERING INVESTMENT STRATEGIES
ARE
REFLECTED IN PORTFOLIO CHARACTERISTICS
The
portfolio characteristics table below is a regular feature of the Fund’s shareholder reports. It serves as a useful tool
for understanding the value of the Fund’s multi-managed portfolio. The characteristics are different for each of the Fund’s
three investment managers. These differences are a reflection of the fact that each has a different capitalization focus and investment
strategy. The shaded column highlights the characteristics of the Fund as a whole, while the first three columns show portfolio
characteristics for the Russell Smallcap, Midcap and Largecap Growth indices. See page 34 for a description of these indices.
PORTFOLIO
CHARACTERISTICS As of June 30, 2024 (Unaudited)
| |
RUSSELL
GROWTH |
Market
Capitalization Spectrum |
|
| |
Small |
|
Large |
Total |
| |
Smallcap |
Midcap |
Largecap |
 |
| |
Index |
Index |
Index |
Weatherbie |
Congress |
Sustainable |
Fund |
| Number
of Holdings |
1,054 |
330 |
440 |
50 |
39 |
29 |
117* |
| Percent
of Holdings in Top 10 |
11% |
16% |
57% |
51% |
33% |
46% |
20% |
| Weighted
Average Market Capitalization
(billions) |
$6.0 |
$32.8 |
$1,528.5 |
$4.8 |
$17.6 |
$849.7 |
$300.0 |
| Average Five-Year
Earnings Per
Share Growth |
21% |
18% |
21% |
7% |
17% |
17% |
15% |
| Average Five-Year
Sales Per
Share Growth |
11% |
14% |
18% |
12% |
13% |
15% |
13% |
| Price/Sales
Ratio |
2.1x |
3.5x |
5.4x |
3.3x |
3.3x |
5.5x |
3.8x |
| Price/Book
Value Ratio |
4.3x |
9.4x |
9.9x |
5.4x |
5.7x |
7.9x |
6.2x |
| * | Certain
holdings are held by more than one manager. |
| Liberty All-Star® Growth Fund |
Manager Interview |
(Unaudited)
 |
|
Todd
Solomon, CFA
Senior
Vice President, Portfolio Manager
Congress
Asset Management Company, LLP
|
CONGRESS’
PORTFOLIO OF 40 MID-CAP NAMES BALANCES PROPER DIVERSIFICATION AND DEEP INSIGHT INTO EACH HOLDING
Congress
Asset Management is the Fund’s mid-cap growth manager. Congress employs a strategy focused on established, high-quality
companies that are growing earnings and generating attractive levels of free cash flow. The firm also strives to construct portfolios
with relatively low levels of volatility. We recently had the chance to talk with Todd Solomon, CFA, Senior Vice President and
Portfolio Manager at Congress. The Fund’s Investment Advisor, ALPS Advisors, Inc., conducted the interview.
How
is Congress’ actively managed mid-cap portfolio different than the relevant passive index, in this case the Russell Midcap
Growth® Index? Is this primarily a product of Congress’ strategy and the research behind it? Or other factors?
Our
portfolio is more focused with approximately 40 stocks versus over 300 for the Russell Midcap Growth® Index. Also,
our portfolio is closer to equal-weighted than the benchmark’s allocation, which is capitalization weighted and thus tilted
toward companies at the larger end of the mid-cap range.
“We
believe that a portfolio of 40 names can give us proper diversification while maintaining a strong knowledge base of our current
investments and their main competitors.”
We
believe that a portfolio of 40 names can give us proper diversification while maintaining a strong knowledge base of our current
investments and their main competitors. Since the inception of the portfolio, our process and philosophy have maintained that
having the best ideas in the portfolio in similar position sizes is more important than focusing on relative conviction to determine
allocation.
What
are the factors—quantitative and qualitative—that you consider first and foremost when you are researching candidates
for inclusion in the mid-cap portfolio?
A
“good company” doesn’t always equate to a “good stock.” We employ a four-part process outlined
as follows: First, we seek to identify a successful company with the following attributes: increasing margins and free cash
flow; positive, consistent growth; increasing market share; strong balance sheet; and shareholder consciousness. Second, we
want to determine if this success is likely to continue. In this regard, the primary characteristics we assess are whether
the company operates
in a growing industry; the uniqueness of its business model; how defensible its market position is; and whether its business is
sustainable through market cycles. Next, we want to understand the “bear” case for the company to assess if there
is anything we may have overlooked including a different viewpoint of the business risks and valuation. Finally, we want to understand
how adding this name will affect the current portfolio if it’s purchased. For instance, will we be maintaining the current
portfolio diversification? Does the company depend on similar drivers of growth as current holdings, or different? Two additional
primary considerations are how correlated/uncorrelated the stock under consideration is with the rest of the portfolio and whether
it changes the portfolio’s overall risk profile.
| Semi-Annual Report (Unaudited)
| June 30, 2024 |
9 |
| Liberty All-Star® Growth Fund |
Manager Interview |
(Unaudited)
Large-cap
growth, driven by AI/information technology, has been posting exceptional returns and capturing the lion’s share of media
attention. Is AI the realm of large- and mega-cap companies or have you identified mid-cap growth companies that are already participating
in AI directly or those that are positioned to benefit downstream? What are some examples?
“We
have been able to identify several mid-cap companies that have exposure to AI trends, but do not solely rely on the theme.”
We
have been able to identify several mid-cap companies that have exposure to AI trends, but do not solely rely on the theme. Investments
in, and acceptance of, AI may be too volatile to successfully invest in a “pure play” in the mid-cap space, where
profitability and consistency of results may be elusive.
Turning
to examples, nVent Electric (NVT), first purchased in August 2023, is a manufacturer of cable management products, racks and cabinets,
and liquid cooling equipment. The company expects approximately 14 percent of 2024 sales to come from its Data Solutions segment,
which is growing strong double digits. In its most recent earnings release, the company said they “continue to see great
demand for Data Solutions, growing with the acceleration of AI and high-performance computing.” nVent is also well positioned
in other “electrification, sustainability and digitization trends,” which may allow the company to offset any possible
receding of AI spending.
A
more recent investment, Fabrinet (FN), purchased in December 2023, provides advanced precision optical, electronic and mechanical
manufacturing services. It produces equipment for telecom and datacom optical communications, which are the “pipelines”
for data movement. The company reported continued strong demand for high-data-rate products in its most recent earnings release.
However, the company has exposure to the automotive industry, industrial lasers, and medical and other components and subsystems.
Such diversification should improve the consistency of reported results in the future.
Thank
you, Todd. The market has shown some broadening recently. We will hope that investors continue to recognize the value of mid-cap
stocks in a diversified growth portfolio.
| Liberty All-Star®
Growth Fund |
Schedule
of Investments |
June
30, 2024 (Unaudited)
| | |
SHARES | | |
VALUE | |
| COMMON STOCKS (97.58%) | |
| | | |
| | |
| COMMUNICATION SERVICES (3.93%) | |
| | | |
| | |
| Entertainment (1.81%) | |
| | | |
| | |
| Netflix, Inc.(a) | |
| 5,377 | | |
$ | 3,628,830 | |
| Take-Two Interactive Software, Inc.(a) | |
| 17,500 | | |
| 2,721,075 | |
| | |
| | | |
| 6,349,905 | |
| Interactive Media & Services (2.12%) | |
| | | |
| | |
| Alphabet, Inc., Class C | |
| 19,875 | | |
| 3,645,472 | |
| Meta Platforms, Inc., Class A | |
| 7,498 | | |
| 3,780,642 | |
| | |
| | | |
| 7,426,114 | |
| CONSUMER DISCRETIONARY (10.18%) | |
| | | |
| | |
| Broadline Retail (3.55%) | |
| | | |
| | |
| Amazon.com, Inc.(a) | |
| 41,887 | | |
| 8,094,663 | |
| Ollie's Bargain Outlet Holdings, Inc.(a) | |
| 41,643 | | |
| 4,088,093 | |
| Savers Value Village, Inc.(a) | |
| 21,730 | | |
| 265,975 | |
| | |
| | | |
| 12,448,731 | |
| Distributors (0.61%) | |
| | | |
| | |
| Pool Corp. | |
| 7,000 | | |
| 2,151,310 | |
| | |
| | | |
| | |
| Hotels, Restaurants & Leisure (3.56%) | |
| | | |
| | |
| Darden Restaurants, Inc. | |
| 19,500 | | |
| 2,950,740 | |
| Planet Fitness, Inc., Class A(a) | |
| 17,484 | | |
| 1,286,648 | |
| Starbucks Corp. | |
| 36,540 | | |
| 2,844,639 | |
| Wingstop, Inc. | |
| 3,634 | | |
| 1,535,946 | |
| Yum! Brands, Inc. | |
| 29,206 | | |
| 3,868,627 | |
| | |
| | | |
| 12,486,600 | |
| Specialty Retail (1.49%) | |
| | | |
| | |
| Ulta Beauty, Inc.(a) | |
| 6,250 | | |
| 2,411,688 | |
| Valvoline, Inc.(a) | |
| 65,000 | | |
| 2,808,000 | |
| | |
| | | |
| 5,219,688 | |
| Textiles, Apparel & Luxury Goods (0.97%) | |
| | | |
| | |
| Deckers Outdoor Corp.(a) | |
| 3,500 | | |
| 3,387,825 | |
| | |
| | | |
| | |
| CONSUMER STAPLES (1.93%) | |
| | | |
| | |
| Consumer Staples Distribution & Retail (1.09%) | |
| | | |
| | |
| Casey's General Stores, Inc. | |
| 10,000 | | |
| 3,815,600 | |
| | |
| | | |
| | |
| Household Products (0.81%) | |
| | | |
| | |
| Church & Dwight Co., Inc. | |
| 27,500 | | |
| 2,851,200 | |
See
Notes to Financial Statements.
| Semi-Annual Report (Unaudited)
| June 30, 2024 |
11 |
| Liberty All-Star®
Growth Fund |
Schedule
of Investments |
June
30, 2024 (Unaudited)
| | |
SHARES | | |
VALUE | |
| COMMON STOCKS (continued) | |
| | | |
| | |
| Personal Care Products (0.03%) | |
| | | |
| | |
| Oddity Tech, Ltd.(a) | |
| 2,827 | | |
$ | 110,988 | |
| | |
| | | |
| | |
| ENERGY (1.09%) | |
| | | |
| | |
| Energy Equipment & Services (1.09%) | |
| | | |
| | |
| Core Laboratories, Inc. | |
| 31,812 | | |
| 645,465 | |
| Weatherford International PLC(a) | |
| 26,000 | | |
| 3,183,700 | |
| | |
| | | |
| 3,829,165 | |
| FINANCIALS (13.40%) | |
| | | |
| | |
| Capital Markets (6.98%) | |
| | | |
| | |
| FactSet Research Systems, Inc. | |
| 7,000 | | |
| 2,857,890 | |
| Hamilton Lane, Inc., Class A | |
| 40,005 | | |
| 4,943,818 | |
| MSCI, Inc. | |
| 7,178 | | |
| 3,458,002 | |
| Raymond James Financial, Inc. | |
| 22,500 | | |
| 2,781,225 | |
| S&P Global, Inc. | |
| 10,556 | | |
| 4,707,976 | |
| StepStone Group, Inc., Class A | |
| 124,696 | | |
| 5,722,299 | |
| | |
| | | |
| 24,471,210 | |
| Consumer Finance (1.33%) | |
| | | |
| | |
| American Express Co. | |
| 17,090 | | |
| 3,957,189 | |
| Upstart Holdings, Inc.(a)(b) | |
| 30,440 | | |
| 718,080 | |
| | |
| | | |
| 4,675,269 | |
| Financial Services (2.68%) | |
| | | |
| | |
| Corpay, Inc.(a) | |
| 9,939 | | |
| 2,647,849 | |
| Flywire Corp.(a) | |
| 63,446 | | |
| 1,039,880 | |
| Visa, Inc., Class A | |
| 21,717 | | |
| 5,700,061 | |
| | |
| | | |
| 9,387,790 | |
| Insurance (2.41%) | |
| | | |
| | |
| Aon PLC, Class A | |
| 12,845 | | |
| 3,771,035 | |
| Brown & Brown, Inc. | |
| 36,000 | | |
| 3,218,760 | |
| Palomar Holdings, Inc.(a) | |
| 17,990 | | |
| 1,459,888 | |
| | |
| | | |
| 8,449,683 | |
| HEALTH CARE (19.79%) | |
| | | |
| | |
| Biotechnology (3.05%) | |
| | | |
| | |
| ACADIA Pharmaceuticals, Inc.(a) | |
| 167,222 | | |
| 2,717,358 | |
| Natera, Inc.(a) | |
| 60,173 | | |
| 6,516,134 | |
| Ultragenyx Pharmaceutical, Inc.(a) | |
| 35,660 | | |
| 1,465,626 | |
| | |
| | | |
| 10,699,118 | |
| Health Care Equipment & Supplies (8.36%) | |
| | | |
| | |
| Cooper Cos., Inc. | |
| 30,000 | | |
| 2,619,000 | |
| Glaukos Corp.(a) | |
| 55,337 | | |
| 6,549,134 | |
| Hologic, Inc.(a) | |
| 32,500 | | |
| 2,413,125 | |
See
Notes to Financial Statements.
| Liberty All-Star®
Growth Fund |
Schedule
of Investments |
June
30, 2024 (Unaudited)
| | |
SHARES | | |
VALUE | |
| COMMON STOCKS (continued) | |
| | | |
| | |
| Health Care Equipment & Supplies (continued) | |
| | | |
| | |
| Inmode, Ltd.(a) | |
| 26,918 | | |
$ | 490,984 | |
| Inogen, Inc.(a) | |
| 41,696 | | |
| 338,989 | |
| Inspire Medical Systems, Inc.(a) | |
| 8,465 | | |
| 1,132,871 | |
| iRhythm Technologies, Inc.(a) | |
| 15,560 | | |
| 1,674,878 | |
| Neogen Corp.(a) | |
| 106,041 | | |
| 1,657,421 | |
| Nevro Corp.(a) | |
| 124,271 | | |
| 1,046,362 | |
| Penumbra, Inc.(a) | |
| 15,500 | | |
| 2,789,535 | |
| ResMed, Inc. | |
| 14,000 | | |
| 2,679,880 | |
| STERIS PLC | |
| 12,500 | | |
| 2,744,250 | |
| Tandem Diabetes Care, Inc.(a) | |
| 79,000 | | |
| 3,182,910 | |
| | |
| | | |
| 29,319,339 | |
| Health Care Providers & Services (3.42%) | |
| | | |
| | |
| NeoGenomics, Inc.(a) | |
| 110,945 | | |
| 1,538,807 | |
| Progyny, Inc.(a) | |
| 132,399 | | |
| 3,787,936 | |
| UnitedHealth Group, Inc. | |
| 10,874 | | |
| 5,537,693 | |
| US Physical Therapy, Inc. | |
| 12,148 | | |
| 1,122,718 | |
| | |
| | | |
| 11,987,154 | |
| Health Care Technology (0.17%) | |
| | | |
| | |
| Definitive Healthcare Corp.(a) | |
| 108,603 | | |
| 592,972 | |
| | |
| | | |
| | |
| Life Sciences Tools & Services (3.49%) | |
| | | |
| | |
| Charles River Laboratories International, Inc.(a) | |
| 10,500 | | |
| 2,169,090 | |
| Danaher Corp. | |
| 16,638 | | |
| 4,157,004 | |
| Thermo Fisher Scientific, Inc. | |
| 6,249 | | |
| 3,455,697 | |
| West Pharmaceutical Services, Inc. | |
| 7,500 | | |
| 2,470,425 | |
| | |
| | | |
| 12,252,216 | |
| Pharmaceuticals (1.30%) | |
| | | |
| | |
| Novo Nordisk A/S(c) | |
| 31,850 | | |
| 4,546,269 | |
| | |
| | | |
| | |
| INDUSTRIALS (17.06%) | |
| | | |
| | |
| Aerospace & Defense (1.52%) | |
| | | |
| | |
| AAR Corp.(a) | |
| 31,952 | | |
| 2,322,910 | |
| Cadre Holdings, Inc. | |
| 24,213 | | |
| 812,588 | |
| Kratos Defense & Security Solutions, Inc.(a) | |
| 73,621 | | |
| 1,473,156 | |
| Loar Holdings, Inc.(a) | |
| 13,111 | | |
| 700,259 | |
| | |
| | | |
| 5,308,913 | |
| Commercial Services & Supplies (4.55%) | |
| | | |
| | |
| Casella Waste Systems, Inc., Class A(a) | |
| 63,768 | | |
| 6,327,061 | |
| CECO Environmental Corp.(a) | |
| 3,731 | | |
| 107,640 | |
| Copart, Inc. | |
| 60,000 | | |
| 3,249,600 | |
| Montrose Environmental Group, Inc.(a) | |
| 82,547 | | |
| 3,678,294 | |
See
Notes to Financial Statements.
| Semi-Annual Report (Unaudited)
| June 30, 2024 |
13 |
| Liberty All-Star®
Growth Fund |
Schedule
of Investments |
June
30, 2024 (Unaudited)
| | |
SHARES | | |
VALUE | |
| COMMON STOCKS (continued) | |
| | | |
| | |
| Commercial Services & Supplies (continued) | |
| | | |
| | |
| Waste Management, Inc. | |
| 12,168 | | |
$ | 2,595,921 | |
| | |
| | | |
| 15,958,516 | |
| Construction & Engineering (1.63%) | |
| | | |
| | |
| EMCOR Group, Inc. | |
| 10,000 | | |
| 3,650,800 | |
| WillScot Mobile Mini Holdings Corp.(a) | |
| 55,000 | | |
| 2,070,200 | |
| | |
| | | |
| 5,721,000 | |
| Electrical Equipment (1.15%) | |
| | | |
| | |
| nVent Electric PLC | |
| 52,500 | | |
| 4,022,025 | |
| | |
| | | |
| | |
| Ground Transportation (2.67%) | |
| | | |
| | |
| Canadian Pacific Kansas City, Ltd. | |
| 51,083 | | |
| 4,021,765 | |
| RXO, Inc.(a) | |
| 77,253 | | |
| 2,020,166 | |
| Saia, Inc.(a) | |
| 7,000 | | |
| 3,320,030 | |
| | |
| | | |
| 9,361,961 | |
| Machinery (2.13%) | |
| | | |
| | |
| Crane Co. | |
| 32,500 | | |
| 4,711,850 | |
| Watts Water Technologies, Inc., Class A | |
| 15,000 | | |
| 2,750,550 | |
| | |
| | | |
| 7,462,400 | |
| Professional Services (1.24%) | |
| | | |
| | |
| Booz Allen Hamilton Holding Corp. | |
| 23,500 | | |
| 3,616,650 | |
| First Advantage Corp. | |
| 45,444 | | |
| 730,285 | |
| | |
| | | |
| 4,346,935 | |
| Trading Companies & Distributors (2.17%) | |
| | | |
| | |
| SiteOne Landscape Supply, Inc.(a) | |
| 25,164 | | |
| 3,055,161 | |
| Transcat, Inc.(a) | |
| 36,703 | | |
| 4,392,615 | |
| Xometry, Inc., Class A(a) | |
| 14,974 | | |
| 173,100 | |
| | |
| | | |
| 7,620,876 | |
| INFORMATION TECHNOLOGY (26.61%) | |
| | | |
| | |
| Electronic Equipment, Instruments & Components (2.61%) | |
| | | |
| | |
| Fabrinet | |
| 13,000 | | |
| 3,182,270 | |
| Keysight Technologies, Inc.(a) | |
| 15,000 | | |
| 2,051,250 | |
| Novanta, Inc.(a) | |
| 8,578 | | |
| 1,399,158 | |
| Teledyne Technologies, Inc.(a) | |
| 6,500 | | |
| 2,521,870 | |
| | |
| | | |
| 9,154,548 | |
| IT Services (0.70%) | |
| | | |
| | |
| Gartner, Inc.(a) | |
| 5,443 | | |
| 2,444,234 | |
| | |
| | | |
| | |
| Semiconductors & Semiconductor Equipment (4.15%) | |
| | | |
| | |
| Entegris, Inc. | |
| 20,000 | | |
| 2,708,000 | |
| Impinj, Inc.(a) | |
| 6,451 | | |
| 1,011,323 | |
See
Notes to Financial Statements.
| Liberty
All-Star® Growth Fund |
Schedule
of Investments |
|
June
30, 2024 (Unaudited)
| | |
| SHARES | | |
| VALUE | |
| COMMON STOCKS (continued) | |
| | | |
| | |
| Semiconductors & Semiconductor Equipment (continued) | |
| | | |
| | |
| Monolithic Power Systems, Inc. | |
| 5,500 | | |
$ | 4,519,240 | |
| NVIDIA Corp. | |
| 35,290 | | |
| 4,359,727 | |
| Semtech Corp.(a) | |
| 28,321 | | |
| 846,231 | |
| SiTime Corp.(a) | |
| 8,873 | | |
| 1,103,624 | |
| | |
| | | |
| 14,548,145 | |
| Software (17.07%) | |
| | | |
| | |
| Agilysys, Inc.(a) | |
| 27,729 | | |
| 2,887,698 | |
| Autodesk, Inc.(a) | |
| 12,365 | | |
| 3,059,719 | |
| Descartes Systems Group, Inc.(a) | |
| 30,000 | | |
| 2,905,200 | |
| DoubleVerify Holdings, Inc.(a) | |
| 90,000 | | |
| 1,752,300 | |
| Dynatrace, Inc.(a) | |
| 45,000 | | |
| 2,013,300 | |
| Intapp, Inc.(a) | |
| 10,700 | | |
| 392,369 | |
| Intuit, Inc. | |
| 5,532 | | |
| 3,635,686 | |
| Microsoft Corp. | |
| 18,710 | | |
| 8,362,434 | |
| nCino, Inc.(a) | |
| 47,023 | | |
| 1,478,873 | |
| PROS Holdings, Inc.(a) | |
| 38,838 | | |
| 1,112,709 | |
| Qualys, Inc.(a) | |
| 18,000 | | |
| 2,566,800 | |
| Salesforce, Inc. | |
| 14,954 | | |
| 3,844,673 | |
| ServiceNow, Inc.(a) | |
| 4,410 | | |
| 3,469,215 | |
| Sprout Social, Inc.(a) | |
| 31,709 | | |
| 1,131,377 | |
| SPS Commerce, Inc.(a) | |
| 42,147 | | |
| 7,930,380 | |
| Synopsys, Inc.(a) | |
| 4,508 | | |
| 2,682,530 | |
| Vertex, Inc., Class A(a) | |
| 175,653 | | |
| 6,332,291 | |
| Workday, Inc., Class A(a) | |
| 19,227 | | |
| 4,298,388 | |
| | |
| | | |
| 59,855,942 | |
| Technology Hardware, Storage & Peripherals (2.08%) | |
| | | |
| | |
| Apple, Inc. | |
| 17,842 | | |
| 3,757,882 | |
| Pure Storage, Inc.(a) | |
| 55,000 | | |
| 3,531,550 | |
| | |
| | | |
| 7,289,432 | |
| MATERIALS (1.89%) | |
| | | |
| | |
| Chemicals (1.02%) | |
| | | |
| | |
| Ecolab, Inc. | |
| 15,002 | | |
| 3,570,476 | |
| | |
| | | |
| | |
| Containers & Packaging (0.87%) | |
| | | |
| | |
| Avery Dennison Corp. | |
| 14,000 | | |
| 3,061,100 | |
See
Notes to Financial Statements.
| Semi-Annual Report (Unaudited)
| June 30, 2024 |
15 |
| Liberty All-Star®
Growth Fund |
Schedule of Investments |
June
30, 2024 (Unaudited)
| | |
SHARES | | |
VALUE | |
| COMMON STOCKS (continued) | |
| | | |
| | |
| REAL
ESTATE (1.70%) | |
| | | |
| | |
| Real
Estate Management & Development (1.70%) | |
| | | |
| | |
| FirstService
Corp. | |
| 39,143 | | |
$ | 5,964,219 | |
| | |
| | | |
| | |
| TOTAL
COMMON STOCKS | |
| | | |
| | |
| (COST OF $230,270,813) | |
| | | |
| 342,148,868 | |
| | |
| | | |
| | |
| SHORT TERM INVESTMENTS
(2.55%) | |
| | | |
| | |
| MONEY MARKET FUND
(2.51%) | |
| | | |
| | |
| State
Street Institutional US Government Money Market Fund, Premier Class, 5.27%(d) | |
| | | |
| | |
| (COST OF $8,818,062) | |
| 8,818,062 | | |
| 8,818,062 | |
| | |
| | | |
| | |
| INVESTMENTS
PURCHASED WITH COLLATERAL FROM | |
| | | |
| | |
| SECURITIES
LOANED (0.04%) | |
| | | |
| | |
| State
Street Navigator Securities Lending Government Money Market Portfolio, 5.33% | |
| | | |
| | |
| (COST OF $146,082) | |
| 146,082 | | |
| 146,082 | |
| | |
| | | |
| | |
| TOTAL
SHORT TERM INVESTMENTS | |
| | | |
| | |
| (COST OF $8,964,144) | |
| | | |
| 8,964,144 | |
| | |
| | | |
| | |
| TOTAL
INVESTMENTS (100.13%) | |
| | | |
| | |
| (COST OF $239,234,957) | |
| | | |
| 351,113,012 | |
| | |
| | | |
| | |
| LIABILITIES
IN EXCESS OF OTHER ASSETS (-0.13%) | |
| | | |
| (454,045 | ) |
| | |
| | | |
| | |
| NET
ASSETS (100.00%) | |
| | | |
$ | 350,658,967 | |
| | |
| | | |
| | |
| NET ASSET VALUE PER
SHARE | |
| | | |
| | |
| (60,155,589 SHARES
OUTSTANDING) | |
| | | |
$ | 5.83 | |
| (a) | Non-income
producing security. |
| (b) | Security,
or a portion of the security position, is currently on loan. The total market value of
securities on loan is $142,106. |
| (c) | American
Depositary Receipt. |
| (d) | Rate
reflects seven-day effective yield on June 30, 2024. |
See
Notes to Financial Statements.
| Liberty All-Star® Growth Fund |
Statement
of Assets and Liabilities |
June
30, 2024 (Unaudited)
| ASSETS: | |
|
| Investments at value (Cost $239,234,957)(a) | |
$ | 351,113,012 | |
| Dividends and interest receivable | |
| 90,446 | |
| Tax reclaim receivable | |
| 6,106 | |
| Prepaid and other assets | |
| 39,665 | |
| TOTAL ASSETS | |
| 351,249,229 | |
| | |
| | |
| LIABILITIES: | |
| | |
| Investment advisory fee payable | |
| 224,678 | |
| Payable for administration, pricing and bookkeeping fees | |
| 116,950 | |
| Payable for collateral upon return of securities loaned | |
| 146,082 | |
| Accrued Directors' fees payable | |
| 6,892 | |
| Accrued expenses | |
| 95,660 | |
| TOTAL LIABILITIES | |
| 590,262 | |
| NET ASSETS | |
$ | 350,658,967 | |
| | |
| | |
| NET ASSETS REPRESENTED BY: | |
| | |
| Paid-in capital | |
$ | 280,801,274 | |
| Total distributable earnings | |
| 69,857,693 | |
| NET ASSETS | |
$ | 350,658,967 | |
| | |
| | |
| Shares of common stock outstanding
(authorized 200,000,000 shares at $0.10 Par) | |
| 60,155,589 | |
| NET ASSET VALUE PER SHARE | |
$ | 5.83 | |
| (a) |
Includes securities
on loan of $142,106. |
See
Notes to Financial Statements.
| Semi-Annual Report (Unaudited)
| June 30, 2024 |
17 |
| Liberty All-Star® Growth Fund |
Statement of Operations |
For the Six Months Ended June 30, 2024 (Unaudited)
| INVESTMENT INCOME: | |
|
| Dividends (Net of foreign taxes withheld at source which amounted to $9,979) | |
$ | 1,019,669 | |
| Securities lending income | |
| 3,135 | |
| TOTAL INVESTMENT INCOME | |
| 1,022,804 | |
| | |
| | |
| EXPENSES: | |
| | |
| Investment advisory fee | |
| 1,356,679 | |
| Administration, pricing and bookkeeping fees | |
| 340,913 | |
| Audit fee | |
| 10,050 | |
| Custodian fee | |
| 19,338 | |
| Directors' fees and expenses | |
| 92,988 | |
| Insurance expense | |
| 7,883 | |
| Legal fees | |
| 18,208 | |
| NYSE fee | |
| 32,541 | |
| Proxy fees | |
| 15,671 | |
| Shareholder communication expenses | |
| 15,510 | |
| Transfer agent fees | |
| 39,410 | |
| Miscellaneous expenses | |
| 5,350 | |
| TOTAL EXPENSES | |
| 1,954,541 | |
| NET INVESTMENT LOSS | |
| (931,737 | ) |
| | |
| | |
| REALIZED AND UNREALIZED GAIN/(LOSS) ON INVESTMENTS: | |
| | |
| Net realized gain on investments | |
| 9,083,798 | |
| Net realized loss on foreign currency transactions | |
| (151 | ) |
| Net change in unrealized appreciation on investments | |
| 10,743,972 | |
| Net change in unrealized appreciation on foreign currency transactions | |
| 11 | |
| NET REALIZED AND UNREALIZED GAIN/(LOSS) ON INVESTMENTS | |
| 19,827,630 | |
| NET INCREASE IN NET ASSETS RESULTING FROM OPERATIONS | |
$ | 18,895,893 | |
See
Notes to Financial Statements.
| Liberty All-Star® Growth Fund |
Statements of Changes in Net Assets |
| | |
For the Six Months Ended June 30, 2024 (Unaudited) |
| |
For the Year Ended December 31, 2023 |
|
| FROM OPERATIONS: | |
| | | |
| | |
| Net investment loss | |
$ | (931,737 | ) | |
$ | (1,548,156 | ) |
| Net realized gain/(loss) on investments | |
| 9,083,647 | | |
| (8,850,848 | ) |
| Net change in unrealized appreciation on investments | |
| 10,743,983 | | |
| 66,429,106 | |
| Net Increase in Net Assets From Operations | |
| 18,895,893 | | |
| 56,030,102 | |
| | |
| | | |
| | |
| DISTRIBUTIONS TO SHAREHOLDERS: | |
| | | |
| | |
| From distributable earnings | |
| (13,675,253 | ) | |
| (1,404,630 | ) |
| Return of capital | |
| – | | |
| (23,519,102 | ) |
| Total Distributions | |
| (13,675,253 | ) | |
| (24,923,732 | ) |
| | |
| | | |
| | |
| CAPITAL SHARE TRANSACTIONS: | |
| | | |
| | |
| Dividend reinvestments | |
| 4,988,323 | | |
| 10,391,899 | |
| Net increase resulting from Capital
Share Transactions | |
| 4,988,323 | | |
| 10,391,899 | |
| Total Increase in Net Assets | |
| 10,208,963 | | |
| 41,498,269 | |
| | |
| | | |
| | |
| NET ASSETS: | |
| | | |
| | |
| Beginning of period | |
| 340,450,004 | | |
| 298,951,735 | |
| End of period | |
$ | 350,658,967 | | |
$ | 340,450,004 | |
See
Notes to Financial Statements.
| Semi-Annual Report (Unaudited)
| June 30, 2024 |
19 |
Liberty
All-Star® Growth Fund
Financial
Highlights
| PER
SHARE OPERATING PERFORMANCE: |
| Net
asset value at beginning of period |
| INCOME
FROM INVESTMENT OPERATIONS: |
| Net
investment loss(a) |
| Net
realized and unrealized gain/(loss) on investments |
| Total
from Investment Operations |
| |
| LESS
DISTRIBUTIONS TO SHAREHOLDERS: |
| Net
investment income |
| Net
realized gain on investments |
| Return
of capital |
| Total
Distributions |
| Change
due to rights offering(b) |
| Net
asset value at end of period |
| Market
price at end of period |
| |
| TOTAL
INVESTMENT RETURN FOR SHAREHOLDERS:(c) |
| Based
on net asset value |
| Based
on market price |
| |
| RATIOS
AND SUPPLEMENTAL DATA: |
| Net
assets at end of period (millions) |
| Ratio
of expenses to average net assets |
| Ratio
of net investment loss to average net assets |
| Portfolio
turnover rate |
| (a) | Calculated
using average shares outstanding during the period. |
| (b) | Effect
of Fund's rights offering for shares at a price below net asset value, net of costs. |
| (c) | Calculated
assuming all distributions are reinvested at actual reinvestment prices and all primary
rights in the Fund's rights offering were exercised. The net asset value and market price
returns will differ depending upon the level of any discount from or premium to net asset
value at which the Fund's shares traded during the period. Past performance is not a
guarantee of future results. |
| (d) | Not
annualized. |
| (e) | Annualized. |
See
Notes to Financial Statements.
Financial
Highlights
| For the Six Months Ended June 30, 2024 |
| |
For the Year Ended December 31, |
|
| (Unaudited) |
| |
2023 |
| |
2022 |
| |
2021 |
| |
2020 |
| |
2019 |
|
| $ | 5.75 | | |
$ | 5.23 | | |
$ | 8.25 | | |
$ | 7.98 | | |
$ | 6.19 | | |
$ | 4.94 | |
| | | | |
| | | |
| | | |
| | | |
| | | |
| | |
| | (0.02 | ) | |
| (0.03 | ) | |
| (0.04 | ) | |
| (0.06 | ) | |
| (0.05 | ) | |
| (0.03 | ) |
| | 0.33 | | |
| 0.98 | | |
| (2.48 | ) | |
| 1.46 | | |
| 2.51 | | |
| 1.74 | |
| | 0.31 | | |
| 0.95 | | |
| (2.52 | ) | |
| 1.40 | | |
| 2.46 | | |
| 1.71 | |
| | | | |
| | | |
| | | |
| | | |
| | | |
| | |
| | (0.23 | ) | |
| (0.02 | ) | |
| – | | |
| – | | |
| – | | |
| – | |
| | – | | |
| – | | |
| (0.50 | ) | |
| (1.02 | ) | |
| (0.63 | ) | |
| (0.46 | ) |
| | – | | |
| (0.41 | ) | |
| – | | |
| – | | |
| – | | |
| – | |
| | (0.23 | ) | |
| (0.43 | ) | |
| (0.50 | ) | |
| (1.02 | ) | |
| (0.63 | ) | |
| (0.46 | ) |
| | – | | |
| – | | |
| – | | |
| (0.11 | ) | |
| (0.04 | ) | |
| – | |
| $ | 5.83 | | |
$ | 5.75 | | |
$ | 5.23 | | |
$ | 8.25 | | |
$ | 7.98 | | |
$ | 6.19 | |
| $ | 5.34 | | |
$ | 5.28 | | |
$ | 4.93 | | |
$ | 9.00 | | |
$ | 8.20 | | |
$ | 6.50 | |
| | | | |
| | | |
| | | |
| | | |
| | | |
| | |
| | 5.8 | %(d) | |
| 19.4 | % | |
| (31.0 | %) | |
| 18.1 | % | |
| 42.4 | % | |
| 35.8 | % |
| | 5.6 | %(d) | |
| 16.3 | % | |
| (40.4 | %) | |
| 25.4 | % | |
| 39.4 | % | |
| 60.5 | % |
| | | | |
| | | |
| | | |
| | | |
| | | |
| | |
| $ | 351 | | |
$ | 340 | | |
$ | 299 | | |
$ | 456 | | |
$ | 338 | | |
$ | 235 | |
| | 1.14 | %(e) | |
| 1.13 | % | |
| 1.14 | % | |
| 1.12 | % | |
| 1.20 | % | |
| 1.22 | % |
| | (0.54 | %)(e) | |
| (0.49 | %) | |
| (0.60 | %) | |
| (0.66 | %) | |
| (0.69 | %) | |
| (0.57 | %) |
| | 19 | %(d) | |
| 39 | % | |
| 31 | % | |
| 42 | % | |
| 55 | % | |
| 34 | % |
| Semi-Annual Report (Unaudited)
| June 30, 2024 |
21 |
| Liberty
All-Star® Growth Fund |
Notes
to Financial Statements |
June
30, 2024 (Unaudited)
NOTE
1. ORGANIZATION
Liberty
All-Star® Growth Fund, Inc. (the “Fund”) is a Maryland corporation registered under the Investment
Company Act of 1940 (the “1940 Act”), as amended, as a diversified, closed-end management investment company.
Investment
Goal
The
Fund seeks long-term capital appreciation.
Fund
Shares
The
Fund may issue 200,000,000 shares of common stock at $0.10 par.
NOTE
2. SIGNIFICANT ACCOUNTING POLICIES
The
following is a summary of significant accounting policies consistently followed by the Fund in the preparation of its financial
statements. The Fund is considered an investment company under U.S. generally accepted accounting principles (“GAAP”)
and follows the accounting and reporting guidance applicable to investment companies in the Financial Accounting Standards Board
Accounting Standards Codification Topic 946 Financial Services - Investment Companies.
Use
of Estimates
The
preparation of financial statements in conformity with GAAP requires management to make estimates and assumptions that affect
the reported amounts of assets and liabilities and disclosures of contingent assets and liabilities at the date of the financial
statements and the reported amounts of increases and decreases in net assets from operations during the reporting period. Actual
results could differ from these estimates.
Security
Valuation
Equity
securities are valued at the last sale price at the close of the principal exchange on which they trade, except for securities
listed on the NASDAQ Stock Market LLC (“NASDAQ”), which are valued at the NASDAQ official closing price. Unlisted
securities or listed securities for which there were no sales during the day are valued at the closing bid price on such exchanges
or over-the-counter markets.
Cash
collateral from securities lending activity is reinvested in the State Street Navigator Securities Lending Government Money Market
Portfolio (“State Street Navigator”), a registered investment company under the 1940 Act, which operates as a money
market fund in compliance with Rule 2a-7 under the 1940 Act. Shares of registered investment companies are valued daily at that
investment company’s net asset value ("NAV") per share.
The
Fund’s investments are valued at market value or, in the absence of market value with respect to any portfolio securities,
at fair value according to procedures adopted by the Fund's Board of Directors (the "Board"). The Board has designated
ALPS Advisors, Inc. (the “Advisor”) as the Fund’s Valuation Designee (as defined in Rule 2a-5 under the 1940
Act). The Valuation Designee is responsible for determining fair value in good faith for all Fund investments, subject to oversight
by the Board. When market quotations are not readily available, or in management’s judgment they do not accurately reflect
fair value of a security, or an event occurs after the market close but before the Fund is priced that materially affects the
value of a security, the security will be valued by the Advisor's Valuation Committee, using fair valuation procedures established
by the Valuation Designee. Examples of potentially significant events that could materially impact a Fund’s net asset value
include, but are not limited to: single issuer events such as corporate actions, reorganizations, mergers, spin-offs, liquidations,
acquisitions and buyouts; corporate announcements on earnings or product offerings; regulatory news; and litigation and multiple
issuer events such as governmental actions; natural disasters or armed conflicts that affect a country or a region; or significant
market fluctuations. Potential significant events are monitored by the Advisor, Sub-Advisers and/or the Valuation Committee through
independent reviews of market indicators, general news sources and communications from the Fund’s custodian.
| Liberty
All-Star® Growth Fund |
Notes
to Financial Statements |
June
30, 2024 (Unaudited)
Security
Transactions
Security
transactions are recorded on trade date. Cost is determined and gains/(losses) are based upon the specific identification method
for both financial statement and federal income tax purposes.
Income
Recognition
Interest
income is recorded on the accrual basis. Corporate actions are recorded on the ex-date.
Dividend
income is recognized on the ex-dividend date, or for certain foreign securities, as soon as information is available to the Fund.
Withholding taxes on foreign dividends are paid (a portion of which may be reclaimable) or provided for in accordance with the
applicable country’s tax rules and rates and are disclosed in the Statement of Operations.
The
Fund estimates components of distributions from real estate investment trusts (“REITs”). Distributions received in
excess of income are recorded as a reduction of the cost of the related investments. Once the REIT reports annually the tax character
of its distributions, the Fund revises its estimates. If the Fund no longer owns the applicable securities, any distributions
received in excess of income are recorded as realized gains.
Lending
of Portfolio Securities
The
Fund may lend its portfolio securities only to borrowers that are approved by the Fund’s securities lending agent, State
Street Bank & Trust Co. (“SSB”). The Fund will limit such lending to not more than 20% of the value of its total
assets. The borrower pledges and maintains with the Fund collateral consisting of cash (U.S. Dollar only), securities issued or
guaranteed by the U.S. government or its agencies or instrumentalities, or by irrevocable bank letters of credit issued by a person
other than the borrower or an affiliate of the borrower. The initial collateral received by the Fund is required to have a value
of no less than 102% of the market value of the loaned securities for securities traded on U.S. exchanges and a value of no less
than 105% of the market value for all other securities. The collateral is maintained thereafter, at a market value equal to no
less than 100% of the current value of the securities on loan. The market value of the loaned securities is determined at the
close of each business day and any additional required collateral is delivered to the Fund on the next business day. During the
term of the loan, the Fund is entitled to all distributions made on or in respect of the loaned securities. Loans of securities
are terminable at any time and the borrower, after notice, is required to return borrowed securities within the standard time
period for settlement of securities transactions.
Any
cash collateral received is reinvested in State Street Navigator. Non-cash collateral, in the form of securities issued or guaranteed
by the U.S. government or its agencies or instrumentalities, is not disclosed in the Fund’s Schedule of Investments as it
is held by the lending agent on behalf of the Fund, and the Fund does not have the ability to re-hypothecate these securities.
Income earned by the Fund from securities lending activity is disclosed in the Statement of Operations.
| Semi-Annual
Report (Unaudited) | June 30, 2024 |
23 |
| Liberty
All-Star® Growth Fund |
Notes
to Financial Statements |
June
30, 2024 (Unaudited)
The
following is a summary of the Fund's securities lending positions and related cash and non-cash collateral received as of June
30, 2024:
Market Value of
Securities on Loan | | |
Cash Collateral
Received | | |
Non-Cash Collateral
Received | | |
Total Collateral
Received | |
| $ | 142,106 | | |
$ | 146,082 | | |
$ | – | | |
$ | 146,082 | |
The
risks of securities lending include the risk that the borrower may not provide additional collateral when required or may not
return the securities when due. To mitigate these risks, the Fund benefits from a borrower default indemnity provided by SSB.
SSB’s indemnity allows for full replacement of securities lent wherein SSB will purchase the unreturned loaned securities
on the open market by applying the proceeds of the collateral or to the extent such proceeds are insufficient or the collateral
is unavailable, SSB will purchase the unreturned loan securities at SSB’s expense. However, the Fund could suffer a loss
if the value of the investments purchased with cash collateral falls below the value of the cash collateral received.
The
following table reflects a breakdown of transactions accounted for as secured borrowings, the gross obligation by the type of
collateral pledged or securities loaned, and the remaining contractual maturity of those transactions as of June 30, 2024:
| | |
| | |
Remaining contractual maturity of the agreements | |
| |
| | |
| | |
| |
| |
Securities Lending
Transactions | |
Overnight &
Continuous | | |
Up to 30
days |
|
|
30-90
days | | |
Greater
than 90
days | | |
Total | |
| State Street Navigator | |
$ | 146,082 | | |
$ |
– |
|
|
$ | – | | |
$ | – | | |
$ | 146,082 | |
| Total Borrowings | |
| | | |
|
|
|
| | | |
| | | |
$ | 146,082 | |
| Gross amount of recognized liabilities for securities lending (collateral received) | | |
$ | 146,082 | |
Fair
Value Measurements
The
Fund discloses the classification of its fair value measurements following a three-tier hierarchy based on the inputs used to
measure fair value. Inputs refer broadly to the assumptions that market participants would use in pricing the asset or liability,
including assumptions about risk. Inputs may be observable or unobservable. Observable inputs reflect the assumptions market participants
would use in pricing the asset or liability that are developed based on market data obtained from sources independent of the reporting
entity. Unobservable inputs reflect the reporting entity’s own assumptions about the assumptions market participants would
use in pricing the asset or liability that are developed based on the best information available.
| Liberty
All-Star® Growth Fund |
Notes
to Financial Statements |
June
30, 2024 (Unaudited)
Valuation
techniques used to value the Fund's investments by major category are as follows:
Equity
securities that are valued based on unadjusted quoted prices in active markets are categorized as Level 1 in the hierarchy. In
the event there were no sales during the day or closing prices are not available, securities are valued at the mean of the most
recent quoted bid and ask prices on such day and are generally categorized as Level 2 in the hierarchy. Investments in open-end
mutual funds are valued at their closing NAV each business day and are categorized as Level 1 in the hierarchy.
Various
inputs are used in determining the value of the Fund’s investments as of the end of the reporting period. When inputs used
fall into different levels of the fair value hierarchy, the level in the hierarchy within which the fair value measurement falls
is determined based on the lowest level input that is significant to the fair value measurement in its entirety. The designated
input levels are not necessarily an indication of the risk or liquidity associated with these investments.
These
inputs are categorized in the following hierarchy under applicable financial accounting standards:
| Level
1 |
– |
Unadjusted
quoted prices in active markets for identical investments, unrestricted assets or liabilities that a Fund has the ability
to access at the measurement date; |
| |
|
|
| Level
2 |
– |
Quoted
prices which are not active, quoted prices for similar assets or liabilities in active markets or inputs other than quoted
prices that are observable (either directly or indirectly) for substantially the full term of the asset or liability; and |
| |
|
|
| Level
3 |
– |
Significant
unobservable prices or inputs (including the Fund’s own assumptions in determining the fair value of investments) where
there is little or no market activity for the asset or liability at the measurement date. |
The
following is a summary of the inputs used to value the Fund’s investments as of June 30, 2024:
| |
Valuation Inputs | | |
| | |
| Investments in Securities at Value | |
| Level 1 | | |
| Level 2 | | |
| Level 3 | | |
| Total | |
| Common Stocks* | |
$ | 342,148,868 | | |
$ | – | | |
$ | – | | |
$ | 342,148,868 | |
| Short Term Investments | |
| 8,964,144 | | |
| – | | |
| – | | |
| 8,964,144 | |
| Total | |
$ | 351,113,012 | | |
$ | – | | |
$ | – | | |
$ | 351,113,012 | |
| * | See
Schedule of Investments for industry classifications. |
The
Fund did not have any securities that used significant unobservable inputs (Level 3) in determining fair value during the period.
There were no transfers into or out of Level 3 during the six months ended June 30, 2024.
| Semi-Annual
Report (Unaudited) | June 30, 2024 |
25 |
| Liberty
All-Star® Growth Fund |
Notes
to Financial Statements |
June
30, 2024 (Unaudited)
Distributions
to Shareholders
The
Fund currently has a policy of paying distributions on its common shares totaling approximately 8% of its net asset value per
year. The distributions are payable in four quarterly distributions of 2% of the Fund’s net asset value at the close of
the New York Stock Exchange on the Friday prior to each quarterly declaration date. Distributions to shareholders are recorded
on ex-date.
NOTE
3. RISKS
Investment
and Market Risk
An
investment in shares is subject to investment risk, including the possible loss of the entire amount invested. An investment in
shares represents an indirect investment in the securities owned by the Fund, most of which are anticipated to be traded on a
national securities exchange or in the over-the-counter markets. The value of these securities, like other market investments,
may move up or down, sometimes rapidly and unpredictably. Shares at any point in time may be worth less than their original cost,
even after taking into account the reinvestment of dividends and other distributions.
Common
Stock Risk
The
Fund is not limited in the percentage of its assets that may be invested in common stocks and other equity securities, and therefore
a risk of investing in the Fund is common stock or equity risk. Equity risk is the risk that the market value of securities held
by the Fund will fall due to general market or economic conditions, perceptions regarding the industries in which the issuers
of securities held by the Fund participate, and the particular circumstances and performance of particular companies whose securities
the Fund holds. In addition, common stock of an issuer in the Fund’s portfolio may decline in price if the issuer fails
to make anticipated dividend payments because, among other reasons, the issuer of the security experiences a decline in its financial
condition. Common equity securities in which the Fund will invest are structurally subordinated to preferred stocks, bonds and
other debt instruments in a company’s capital structure, in terms of priority to corporate income, and therefore will be
subject to greater payment risk than preferred stocks or debt instruments of such issuers. In addition, while broad market measures
of common stocks have historically generated higher average returns than fixed income securities, common stocks have also experienced
significantly more volatility in their returns.
Growth
stocks are stocks of companies believed to have above-average potential for growth in revenue and earnings. In certain market
conditions, prices of growth stocks may be more sensitive to changes in current or expected earnings than the prices of other
stocks. Growth stocks may not perform as well as the stock market in general.
Foreign
Currency Risk
Investment
securities and other assets and liabilities denominated in foreign currencies are translated into U.S. dollar amounts at the date
of valuation. Purchases and sales of investment securities and income and expense items denominated in foreign currencies are
translated into U.S. dollar amounts on the respective dates of such transactions. The Portfolios do not isolate that portion of
the results of operations resulting from changes in foreign exchange rates on investments from the fluctuations arising from changes
in market prices of securities held. Such fluctuations are included with the net realized and unrealized gain or loss from investments.
Reported net realized foreign exchange gains or losses arise from sales of foreign currencies, currency gains or losses realized
between the trade and settlement dates on securities transactions, and the difference between the amounts of dividends, interest,
and foreign withholding taxes recorded on the Portfolios books and the U.S. dollar equivalent of the amounts actually received
or paid. Net unrealized foreign exchange gains and losses arise from changes in the fair values of assets and liabilities, other
than investments insecurities at fiscal period end, resulting from changes in exchange rates.
| Liberty
All-Star® Growth Fund |
Notes
to Financial Statements |
June
30, 2024 (Unaudited)
Market
Disruption and Geopolitical Risk
Social,
political, and economic events, such as natural disasters and health emergencies (e.g., epidemics and pandemics, such as the recent
COVID-19 outbreak), ongoing U.S military activities and political developments, as well as the threat of terrorist attacks, could
have significant adverse effects on the U.S. economy, the stock market, world economies and markets generally, and may lead to
volatility in the value of the Fund’s investments. These types of events may develop quickly and unexpectedly and could
significantly impact issuers, industries, governments and other systems, including financial markets. Global systems are increasingly
interconnected, and an event in one area of the world may have adverse effects in other economies and financial markets. It is
difficult to predict the timing or duration of an event, or its impact on the Fund and its shareholders.
NOTE
4. FEDERAL TAX INFORMATION
The
timing and character of income and capital gain distributions are determined in accordance with income tax regulations, which
may differ from GAAP. Reclassifications are made to the Fund’s capital accounts for permanent tax differences to reflect
income and gains available for distribution (or available capital loss carryforwards) under income tax regulations. If, for any
calendar year, the total distributions made under the distribution policy exceed the Fund’s net investment income and net
realized capital gains, the excess will generally be treated as a non-taxable return of capital, reducing the shareholder’s
adjusted basis in his or her shares. If the Fund’s net investment income and net realized capital gains for any year exceed
the amount distributed under the distribution policy, the Fund may, in its discretion, retain and not distribute net realized
capital gains and pay income tax thereon to the extent of such excess. The Fund recognizes interest and penalties, if any, related
to tax liabilities as income tax expense in the Statement of Operations.
Classification
of Distributions to Shareholders
Net
investment income/(loss) and net realized gain/(loss) may differ for financial statement and tax purposes. The character of distributions
made during the year from net investment income or net realized gains may differ from its ultimate characterization for federal
income tax purposes. Due to the timing of dividend distributions, the fiscal year in which amounts are distributed may differ
from the fiscal year in which the income or realized gain was recorded by the Fund. The amounts and characteristics of tax basis
distributions and composition of distributable earnings/(accumulated losses) are determined at the time in which distributions
are paid, which may occur after the fiscal year end. Accordingly, tax basis balances have not been determined as of June 30, 2024.
| Semi-Annual
Report (Unaudited) | June 30, 2024 |
27 |
| Liberty
All-Star® Growth Fund |
Notes
to Financial Statements |
June
30, 2024 (Unaudited)
The
tax character of distributions paid during the year ended December 31, 2023 were as follows:
| Distributions Paid From: | |
December 31, 2023 | |
| Return of Capital | |
$ | 23,519,102 | |
| Total | |
$ | 23,519,102 | |
The
Fund declared a distribution of $5,876,670 with an ex-date in 2023 that was paid in 2024. Such amount is not included above, and
the tax character of such distributions will be determined at the end of 2024.
As
of June 30, 2024, the cost of investments for federal income tax purposes and accumulated net unrealized appreciation/(depreciation)
on investments was as follows:
| Cost of Investments | | |
Gross unrealized
Appreciation (excess of
value over tax cost) | | |
Gross unrealized
Depreciation (excess of
tax cost over value) | | |
Net Unrealized
Appreciation | |
| $ | 241,776,377 | | |
$ | 122,817,386 | | |
$ | (13,480,751 | ) | |
$ | 109,336,635 | |
The
differences between book-basis and tax-basis are primarily due to deferral of losses from wash sales. In addition, certain tax
cost basis adjustments are finalized at fiscal year-end and therefore have not been determined as of June 30, 2024.
Federal
Income Tax Status
For
federal income tax purposes, the Fund currently qualifies, and intends to remain qualified, as a regulated investment company
under the provisions of Subchapter M of the Internal Revenue Code of 1986, as amended, by distributing substantially all of its
investment company taxable net income including realized gain, not offset by capital loss carryforwards, if any, to its shareholders.
Accordingly, no provision for federal income or excise taxes has been made.
As
of and during the six months ended June 30, 2024, the Fund did not have a liability for any unrecognized tax benefits. The Fund
files U.S. federal, state, and local tax returns as required. The Fund’s tax returns are subject to examination by the relevant
tax authorities until expiration of the applicable statute of limitations, which is generally three years after the filing of
the tax return. Tax returns for open years have incorporated no uncertain tax positions that require a provision for income taxes.
NOTE
5. FEES AND COMPENSATION PAID TO AFFILIATES
Investment
Advisory Fee
AAI
serves as the investment advisor to the Fund. AAI receives a monthly investment advisory fee based on the Fund’s average
daily net assets at the following annual rates:
| Average
Daily Net Assets |
Annual
Fee Rate |
| First
$300 million |
0.80% |
| Over
$300 million |
0.72% |
| Liberty
All-Star® Growth Fund |
Notes
to Financial Statements |
June
30, 2024 (Unaudited)
Investment
Advisory Fees for the six monthd ended June 30, 2024 are reported on the Statement of Operations.
AAI
retains multiple Portfolio Managers to manage the Fund’s investments in various asset classes. AAI pays each Portfolio Manager
a portfolio management fee based on the assets of the investment portfolio that they manage. The portfolio management fee is paid
from the investment advisory fees collected by AAI and is based on the Fund’s average daily net assets at the following
annual rates:
| Average
Daily Net Assets |
Annual
Fee Rate |
| First
$300 million |
0.40% |
| Over
$300 million |
0.36% |
Administration,
Bookkeeping and Pricing Services
ALPS
Fund Services, Inc. (“ALPS”), an affiliate of AAI, serves as the administrator to the Fund and the Fund has agreed
to pay expenses incurred in connection with this service. Pursuant to an Administrative, Bookkeeping and Pricing Services Agreement,
ALPS provides operational services to the Fund including, but not limited to, fund accounting and fund administration and generally
assists in the Fund’s operations. The Fund’s administration fee is accrued on a daily basis and paid monthly. Administration,
Pricing and Bookkeeping fees paid by the Fund for the six months ended June 30, 2024 are disclosed in the Statement of Operations.
The
Fund also reimburses ALPS for out-of-pocket expenses and charges, including fees payable to third parties for pricing the Fund’s
portfolio securities and direct internal costs incurred by ALPS in connection with providing fund accounting oversight and monitoring
and certain other services.
Fees
Paid to Officers
All
officers of the Fund, including the Fund’s Chief Compliance Officer, are employees of AAI or its affiliates, and receive
no compensation from the Fund. The Board of Directors has appointed a Chief Compliance Officer to the Fund in accordance with
federal securities regulations.
NOTE
6. PORTFOLIO INFORMATION
Purchases
and Sales of Securities
For
the six month period ended June 30, 2024, the cost of purchases and proceeds from sales of securities, excluding short-term obligations,
were $65,660,583 and $78,882,814 respectively.
NOTE
7. CAPITAL TRANSACTIONS
During
the six months ended June 30, 2024 and the year ended December 31, 2023, distributions in the amounts of $4,988,323 and $10,391,899,
respectively, were paid in newly issued shares valued at market value or net asset value, but not less than 95% of market value.
Such distributions resulted in the issuance of 936,988 and of 2,008,316 shares, respectively.
Under
the Fund’s Automatic Dividend Reinvestment and Direct Purchase Plan (the “Plan”), shareholders automatically
participate and have all their Fund dividends and distributions reinvested. Under the Plan, all dividends and distributions will
be reinvested in additional shares of the Fund. Distributions declared payable in cash will be reinvested for the accounts of
participants in the Plan in additional shares purchased by the Plan Agent on the open market at prevailing market prices, subject
to certain limitations as described more fully in the Plan. Distributions declared payable in shares are paid to participants
in the Plan entirely in newly issued full and fractional shares valued at the lower of market value or net asset value per share
on the valuation date for the distribution (but not at a discount of more than 5 percent from market price). Dividends and distributions
are subject to taxation, whether received in cash or in shares.
| Semi-Annual
Report (Unaudited) | June 30, 2024 |
29 |
| Liberty
All-Star® Growth Fund |
Notes
to Financial Statements |
June
30, 2024 (Unaudited)
NOTE
8. INDEMNIFICATION
In
the normal course of business, the Fund enters into contracts that contain a variety of representations and warranties and which
provide general indemnities. The Fund’s maximum exposure under these arrangements is unknown, as this would involve future
claims against the Fund. Also, under the Fund’s organizational documents and by contract, the Directors and Officers of
the Fund are indemnified against certain liabilities that may arise out of their duties to the Fund. However, based on experience,
the Fund expects the risk of loss due to these warranties and indemnities to be minimal.
NOTE
9. OTHER MATTERS
Maryland
Statutes
By
resolution of the Board of Directors, the Fund has opted into the Maryland Control Share Acquisition Act and the Maryland Business
Combination Act. In general, the Maryland Control Share Acquisition Act provides that “control shares” of a Maryland
corporation acquired in a control share acquisition may not be voted except to the extent approved by shareholders at a meeting
by a vote of two-thirds of the votes entitled to be cast on the matter (excluding shares owned by the acquirer and by officers
or directors who are employees of the corporation). “Control shares” are voting shares of stock which, if aggregated
with all other shares of stock owned by the acquirer or in respect of which the acquirer is able to exercise or direct the exercise
of voting power (except solely by virtue of a revocable proxy), would entitle the acquirer to exercise voting power in electing
directors within certain statutorily defined ranges (one-tenth but less than one-third, one-third but less than a majority, and
more than a majority of the voting power). In general, the Maryland Business Combination Act prohibits an interested shareholder
(a shareholder that holds 10% or more of the voting power of the outstanding stock of the corporation) of a Maryland corporation
from engaging in a business combination (generally defined to include a merger, consolidation, share exchange, sale of a substantial
amount of assets, a transfer of the corporation’s securities and similar transactions to or with the interested shareholder
or an entity affiliated with the interested shareholder) with the corporation for a period of five years after the most recent
date on which the interested shareholder became an interested shareholder. At the time of adoption, March 19, 2009, the Board
and the Fund were not aware of any shareholder that held control shares or that was an interested shareholder under the statutes.
A January 2023 Memorandum of Decision and Order issued by a Massachusetts Superior Court judge has held that a by-laws provision
limiting the ability of shareholders to vote shares in excess of a specified amount is not permissible under the Investment Company
Act of 1940. As a result of this decision, there is some uncertainty whether a registered investment company such as the Fund
may rely on the Maryland Business Control Share Acquisition Act.
NOTE
10. SUBSEQUENT EVENTS
Subsequent
events, if any, after the date of the Statement of Assets and Liabilities have been evaluated through the date the financial statements
are issued. Management has determined that there were no subsequent events to report through the issuance of these financial statements.
| Liberty
All-Star® Growth Fund |
Consideration
of the Advisory Agreement |
June
30, 2024 (Unaudited)
Board
Consideration of the Initial Approval of the Portfolio Management Agreement with Westfield Capital Management Company, L.P.
The
Investment Company Act of 1940 and applicable rules require that the Board of Directors (“Board”) of Liberty All-Star
Growth Fund, Inc. (“Growth Fund”), including all of the Directors who are not “interested persons” of
the Growth Fund (“Independent Directors”), consider on an initial basis and annually thereafter, at a meeting called
for such purpose, whether to approve the Growth Fund’s investment advisory and portfolio management agreements. At its meeting
on June 6, 2024, the Board, including a majority of the Independent Directors, conducted such a review and approved the initial
Portfolio Management Agreement (“Agreement”) among the Growth Fund, ALPS Advisors, Inc. (“AAI”), investment
adviser to the Growth Fund, and Westfield Capital Management Company, L.P. (“Westfield”), an independent investment
management firm, pending shareholder approval.
Prior
to the Board’s action at the June meeting, the Independent Directors met to consider management’s recommendations
with respect to the initial approval of the Agreement. In reaching its decision to approve the Agreement, the Board considered
the overall fairness of the Agreement and whether the Agreement was in the best interest of the Growth Fund. The Board further
considered factors it deemed relevant with respect to the Growth Fund, including, but not limited to: (1) the nature, extent and
quality of the services to be provided to the Growth Fund under the Agreement; (2) Westfield's investment performance; (3) the
fees to be paid by the Growth Fund and the fees charged by Westfield to other clients, as applicable; (4) whether fee rate levels
reflect economies of scale for the benefit of investors; (5) the costs of the services provided and profits to be realized by
Westfield from its relationship with the Growth Fund; and (6) any other benefits to be derived by Westfield because of its relationship
with the Growth Fund. In considering the Agreement, the Board did not consider any single factor or particular information most
relevant to its consideration to approve the Agreement and each Director might have afforded different weight to the various factors.
The
Board considered these factors in the context of the Growth Fund’s multi-manager methodology, which seeks to achieve more
consistent and less volatile performance over the long term than if a single investment sub-adviser (each, a “Portfolio
Manager”) was employed. The Growth Fund allocates its portfolio assets among Portfolio Managers recommended by AAI and approved
by the Board, currently three for the Growth Fund. The Board considered that each Portfolio Manager employs a different investment
style and/or strategy, and from time-to-time AAI rebalances the Growth Fund’s portfolio assets among the Portfolio Managers.
The Board also took into account that AAI continuously analyzes and evaluates each Portfolio Manager’s investment performance
and portfolio composition and, from time to time, recommends changes in the Portfolio Managers.
In
connection with its deliberations, the Board considered information furnished throughout the year at regular Board meetings, as
well as information prepared specifically in connection with the annual renewal and approval process. Information furnished and
discussed throughout the year included AAI’s analysis of the Growth Fund’s investment performance and related financial
information for the Growth Fund, presentations given by the Growth Fund’s Portfolio Managers, as well as periodic reports
on legal, compliance, brokerage commissions and execution and other services provided by AAI, the Portfolio Managers and their
affiliates.
| Semi-Annual
Report (Unaudited) | June 30, 2024 |
31 |
| Liberty
All-Star® Growth Fund |
Consideration
of the Advisory Agreement |
June
30, 2024 (Unaudited)
As
part of the process to consider the Agreement, legal counsel to the Independent Directors requested certain information from Westfield.
In response to their request, the Board received reports from AAI and Westfield that addressed specific factors to be considered
by the Board in approving the Agreement. Counsel also provided the Independent Directors and the Board with a memorandum discussing
the legal standards applicable to their consideration of the Agreement and their responsibilities in connection therewith. Based
on its evaluation of all material factors, the Board unanimously concluded that the terms of the Agreement were reasonable and
fair and that the initial approval of the Agreement was in the best interests of the Fund and its shareholders.
The
following is a summary of the Board’s considerations.
Nature,
Extent and Quality of Services
The
Board considered information regarding Westfield’s investment philosophy and investment style and the services to be provided
by Westfield. In addition, the Board reviewed information regarding Westfield’s financial condition and the background and
experience of the personnel who would be responsible for managing a large cap growth equity allocation of the Growth Fund’s
portfolio pursuant to Westfield’s U.S. large cap growth equity strategy. The Board also considered information regarding
Westfield’s compliance program and compliance record. The Board concluded that the nature, extent and quality of the services
to be provided by Westfield were consistent with the terms of the Agreement and that the Growth Fund was likely to benefit from
services provided by Westfield under the Agreement.
Investment
Performance
The
Board considered the performance of Westfield’s U.S. large cap growth equity composite (“Composite”) relative
to the eVestment US Large Cap Growth Equity returns (“eVestment”) and the Russell 1000® Growth Index
(“Russell Index”). The Composite includes all seperately managed accounts in the U.S. large cap growth equity strategy.
The
Board considered that, as of March 31, 2024, the Composite ranked above the median of the eVestment universe for the 1-year, 3-year,
5-year, 10-year, 15-year and 20-year periods. The Board also considered that the Composite outperformed the Russell Index for
the 1-year and 20-year periods and was close to the Russell Index for the 3-year, 5-year, 10-year and 15-year periods. Therefore,
the Board considered that the long-term performance of the Composite generally compared favorably to the eVestment peer group
and the Russell Index. The Board concluded that the investment performance of Westfield’s U.S. large cap growth equity strategy
has been good.
Fees
and Expenses
In
evaluating the Agreement, the Board reviewed the proposed fee rate for services to be performed by Westfield on behalf of the
Growth Fund. The Board considered Westfield’s representation that the fee rate under the Agreement is less than the fee
schedule for most of Westfield’s accounts managed pursuant to the U.S. large cap growth equity strategy. The Board also
considered that the fee schedule for the Agreement has breakpoints at which the fee rate declines as Growth Fund assets allocated
to Westfield increase above a certain threshold. The Board concluded that the fees payable to Westfield under the Agreement were
reasonable in relation to the nature and quality of the services expected to be provided, taking into account the fee rates that
Westfield charges to other clients.
| Liberty
All-Star® Growth Fund |
Consideration
of the Advisory Agreement |
June
30, 2024 (Unaudited)
Economies
of Scale
The
Board considered Westfield’s representation that Westfield does not anticipate experiencing economies of scale in connection
with the services that it provides to the Growth Fund. The Board took into consideration that there might be economies of scale
in the future in the event that the Growth Fund’s assets increase.
Costs
of Services
The
Board considered that the fee under the Agreement would be paid to Westfield by AAI, not the Growth Fund, and noted the arm’s-length
nature of the relationship between AAI and Westfield with respect to the negotiation of the fee rate on behalf of the Growth Fund.
Accordingly, the Board determined that AAI’s costs and profitability in providing services to the Growth Fund were generally
more relevant to the Board’s evaluation of the fees and expenses paid by the Growth Fund than Westfield’s costs and
profitability. The Board also noted that it had considered AAI’s costs and profitability in connection with its review of
the Growth Fund’s Management Agreement in September 2023.
Other
Benefits to be Derived By Westfield
The
Board considered the potential “fall-out” benefits (including the receipt of research from unaffiliated brokers) that
Westfield might receive in connection with its association with the Growth Fund. Based on the foregoing information, the Board
concluded that the potential benefits accruing to Westfield by virtue of its relationship with the Growth Fund, if any, appear
to be fair and reasonable.
Conclusions
Based
on its evaluation, the Board unanimously concluded that the terms of the Agreement were reasonable and fair and that the approval
of the Agreement was in the best interests of the Growth Fund and its shareholders. The Board unanimously voted to approve and
recommend to the shareholders of the Growth Fund that they approve the Agreement.
| Semi-Annual
Report (Unaudited) | June 30, 2024 |
33 |
| Liberty
All-Star® Growth Fund |
Description
of Lipper
Benchmark and Market Indices |
(Unaudited)
Dow
Jones Industrial Average
A
price-weighted measure of 30 U.S. blue-chip companies.
Lipper
Multi-Cap Growth Mutual Fund Average
The
average of funds that, by portfolio practice, invest in a variety of market capitalization ranges without concentrating 75% of
their equity assets in any one market capitalization range over an extended period of time. Multi-Cap growth funds typically have
above-average characteristics compared to the S&P SuperComposite 1500® Index.
NASDAQ
Composite Index
Measures
all NASDAQ domestic and international based common type stocks listed on the NASDAQ Stock Market.
Russell
3000® Growth Index
Measures
the performance of those Russell 3000® companies with lower book-to-price ratios and higher growth values. The
Russell 3000® Index measures the performance of the 3,000 largest U.S. companies based on total market capitalization,
which represents approximately 96% of the investable U.S. equity market.
Russell
Top 200® Growth Index
Measures
the performance of those Russell Top 200® companies with lower book-to-price-ratios and higher growth values. The
Russell Top 200® Index measures the performance of the 200 largest companies in the Russell 3000®
Index.
Russell
1000® Growth Index (Largecap)
Measures
the performance of those Russell 1000® companies with lower book-to-price-ratios and higher growth values. The
Russell 1000® Index measures the performance of the 1,000 largest companies in the Russell 3000®
Index.
Russell
Midcap® Growth Index
Measures
the performance of those Russell Midcap® companies with lower book-to-price-ratios and higher growth values. The
Russell Midcap® Index measures the performance of the 800 smallest companies in the Russell 1000®
Index.
Russell
2000® Growth Index (Smallcap)
Measures
the performance of those Russell 2000® companies with lower book-to-price-ratios and higher growth values. The
Russell 2000® Index measures the performance of the 2,000 smallest companies in the Russell 3000®
Index.
Russell
Growth Average
The
average of the Russell Top 200®, Midcap® and 2000® Growth Indices.
S&P
500® Index
A
large cap U.S. equities index that includes 500 leading companies and represents approximately 80% of the total domestic U.S.
equity market capitalization.
S&P
500® Equal Weight Index
The
equal-weight version of the S&P 500®.
An
investor cannot invest directly in an index.
Intentionally
Left Blank
Intentionally
Left Blank
(b) Not Applicable.
Item 2. Code of Ethics.
Not applicable to
this report.
Item 3. Audit Committee Financial Expert.
Not applicable to
this report.
Item 4. Principal Accountant Fees and Services.
Not applicable to
this report.
Item 5. Audit Committee of Listed Registrants.
Not applicable to
this report.
Item 6. Investments.
| (a) | The registrant’s “Schedule I – Investments in securities of unaffiliated issuers” (as set forth in 17 CFR
210.12-12) is included as part of the report of shareholders filed under Item 1 of this Form N-CSR. |
Item 7. Financial Statements and Financial
Highlights for Open-End Management Investment Companies.
Not applicable.
Item 8. Changes in and Disagreements
with Accountants for Open-End Management Investment Companies.
Not applicable.
Item 9. Proxy Disclosures for Open-End
Management Investment Companies.
Not applicable.
Item 10. Remuneration Paid to Directors,
Officers, and Others of Open-End Management Investment Companies.
Not applicable.
Item 11. Statement Regarding Basis
for Approval of Investment Advisory Contract.
See Consideration of the Advisory Agreement in Item 1(a).
Item 12. Disclosure of Proxy Voting Policies and Procedures for Closed-End
Management Investment Companies.
Not applicable to this report.
Item 13. Portfolio Managers of Closed-End
Management Investment Companies.
| (a) | Not applicable to the semi-annual report. |
| (b) | As of the date of this filing, there have been no changes in any of the portfolio managers identified in the most recent annual report
on Form N-CSR. |
Item 14. Purchases of Equity Securities by Closed-End Management Investment
Company and Affiliated Purchasers.
During the six months ended June 30, 2024, there were no purchases made
by or on behalf of the registrant or any “affiliated purchaser”, as defined in Rule 10b-18(a)(3) under the Securities Exchange
Act of 1934 (“Exchange Act”), of shares or other units of any class of the registrant’s equity securities that are registered
by the registrant pursuant to Section 12 of the Exchange Act.
Item 15. Submission of Matters to a Vote of Security Holders.
There have not been any material changes to the procedures by which shareholders
may recommend nominees to the registrant’s board of directors, since those procedures were last disclosed in response to the requirements
of Item 407(c)(2)(iv) of Regulation S-K or this Item.
Item 16. Controls and Procedures.
| (a) | The Registrant’s Principal Executive Officer and Principal Financial Officer have concluded that the Registrant’s disclosure
controls and procedures (as defined in Rule 30a-3(c) under the Investment Company Act of 1940, as amended) are effective based on their
evaluation of these controls and procedures as of a date within 90 days of the filing date of this document. |
| (b) | There was no change in the Registrant's internal control over financial reporting (as defined in Rule 30a-3(d) under the Investment
Company Act of 1940, as amended) during the period covered by this report that has materially affected, or is reasonably likely to materially
affect, the Registrant's internal control over financial reporting. |
Item 17. Disclosure of Securities Lending Activities for Closed-End
Management Investment Companies.
Not applicable to the semi-annual report.
Item 18. Recovery of Erroneously Awarded Compensation.
Item 19. Exhibits.
| (a)(1) | Not applicable to this report. |
| (a)(2) | Not applicable to this report. |
SIGNATURES
Pursuant to the requirements of the Securities Exchange Act of 1934 and
the Investment Company Act of 1940, the registrant has duly caused this report to be signed on its behalf by the undersigned, thereunto
duly authorized.
LIBERTY ALL-STAR GROWTH FUND, INC.
| By: |
/s/ Mark Haley |
|
| |
Mark Haley (Principal Executive Officer) |
|
| |
President |
|
| |
|
|
| Date: |
August 30, 2024 |
|
| |
|
|
| By: |
/s/ Erich Rettinger |
|
| |
Erich Rettinger (Principal Financial Officer) |
|
| |
Treasurer |
|
| |
|
|
| Date: |
August 30, 2024 |
|
Ex. 99.Cert
I, Mark Haley, President and Principal Executive Officer of the Liberty
All-Star Growth Fund, Inc. (the “Registrant”) certify that:
| 1. | I have
reviewed this report on Form N-CSR of the Liberty All-Star Growth Fund, Inc.; |
| 2. | Based
on my knowledge, this report does not contain any untrue statement of a material fact or omit to state a material fact necessary to make
the statements made, in light of the circumstances under which such statements were made, not misleading with respect to the period covered
by this report; |
| 3. | Based
on my knowledge, the financial statements, and other financial information included in this report, fairly present in all material respects
the financial condition, results of operations, changes in net assets, and cash flows (if the financial statements are required to include
a statement of cash flows) of the registrant as of, and for, the periods presented in this report; |
| 4. | The registrant’s
other certifying officer(s) and I are responsible for establishing and maintaining disclosure controls and procedures (as defined in
Rule 30a-3(c) under the Investment Company Act of 1940) and internal control over financial reporting (as defined in Rule 30a-3(d) under
the Investment Company Act of 1940) for the registrant and have: |
| |
(a) |
Designed such disclosure controls and procedures, or caused such disclosure controls and procedures to be designed under our supervision, to ensure that material information relating to the registrant, including its consolidated subsidiaries, is made known to us by others within those entities, particularly during the period in which this report is being prepared; |
| |
(b) |
Designed such internal control over financial reporting, or caused such internal control over financial reporting to be designed under our supervision, to provide reasonable assurance regarding the reliability of financial reporting and the preparation of financial statements for external purposes in accordance with generally accepted accounting principles; |
| |
(c) |
Evaluated the effectiveness of the registrant’s disclosure controls and procedures and presented in this report our conclusions about the effectiveness of the disclosure controls and procedures, as of a date within 90 days prior to the filing date of this report based on such evaluation; and |
| |
(d) |
Disclosed in this report any change in the registrant’s internal control over financial reporting that occurred during the period covered by this report that has materially affected, or is reasonably likely to materially affect, the registrant’s internal control over financial reporting; and |
| 5. | The registrant’s
other certifying officer(s) and I have disclosed to the registrant’s auditors and the audit committee of the registrant’s
board of directors (or persons performing the equivalent functions): |
| |
(a) |
All significant deficiencies and material weaknesses in the design or operation of internal control over financial reporting which are reasonably likely to adversely affect the registrant’s ability to record, process, summarize, and report financial information; and |
| |
(b) |
Any fraud, whether or not material, that involves management or other employees who have a significant role in the registrant’s internal control over financial reporting. |
| By: |
/s/ Mark Haley |
|
| |
Mark Haley (Principal Executive Officer) |
|
| |
President |
|
| |
|
|
| Date: |
August 30, 2024 |
|
I, Erich Rettinger, Treasurer and Principal Financial Officer of
the Liberty All-Star Growth Fund, Inc. (the “Registrant”) certify that:
| 1. | I have
reviewed this report on Form N-CSR of the Liberty All-Star Growth Fund, Inc.; |
| 2. | Based
on my knowledge, this report does not contain any untrue statement of a material fact or omit to state a material fact necessary to make
the statements made, in light of the circumstances under which such statements were made, not misleading with respect to the period covered
by this report; |
| 3. | Based
on my knowledge, the financial statements, and other financial information included in this report, fairly present in all material respects
the financial condition, results of operations, changes in net assets, and cash flows (if the financial statements are required to include
a statement of cash flows) of the registrant as of, and for, the periods presented in this report; |
| 4. | The registrant’s
other certifying officer(s) and I are responsible for establishing and maintaining disclosure controls and procedures (as defined in
Rule 30a-3(c) under the Investment Company Act of 1940) and internal control over financial reporting (as defined in Rule 30a-3(d) under
the Investment Company Act of 1940) for the registrant and have: |
| |
(a) |
Designed such disclosure controls and procedures, or caused such disclosure controls and procedures to be designed under our supervision, to ensure that material information relating to the registrant, including its consolidated subsidiaries, is made known to us by others within those entities, particularly during the period in which this report is being prepared; |
| |
(b) |
Designed such internal control over financial reporting, or caused such internal control over financial reporting to be designed under our supervision, to provide reasonable assurance regarding the reliability of financial reporting and the preparation of financial statements for external purposes in accordance with generally accepted accounting principles; |
| |
(c) |
Evaluated the effectiveness of the registrant’s disclosure controls and procedures and presented in this report our conclusions about the effectiveness of the disclosure controls and procedures, as of a date within 90 days prior to the filing date of this report based on such evaluation; and |
| |
(d) |
Disclosed in this report any change in the registrant’s internal control over financial reporting that occurred during the period covered by this report that has materially affected, or is reasonably likely to materially affect, the registrant’s internal control over financial reporting; and |
| 5. | The registrant’s
other certifying officer(s) and I have disclosed to the registrant’s auditors and the audit committee of the registrant’s
board of directors (or persons performing the equivalent functions): |
| |
(a) |
All significant deficiencies and material weaknesses in the design or operation of internal control over financial reporting which are reasonably likely to adversely affect the registrant’s ability to record, process, summarize, and report financial information; and |
| |
(b) |
Any fraud, whether or not material, that involves management or other employees who have a significant role in the registrant’s internal control over financial reporting. |
| By: |
/s/ Erich Rettinger |
|
|
Erich Rettinger (Principal Financial Officer) |
|
|
Treasurer |
|
| |
|
|
| Date: |
August 30, 2024 |
|
Exhibit 99.906Cert
This certification is furnished pursuant to Section 906 of the Sarbanes-Oxley
Act of 2002, 18 U.S.C. § 1350, and accompanies the report on Form N-CSR for the period ended June 30, 2024 (the “Report”),
of the Liberty All-Star Growth Fund, Inc. (the “Company”).
I, Mark Haley, the President and Principal Executive Officer of the Company,
certify that:
| |
(i) |
the Report fully complies with the requirements of Section 13(a) or Section 15(d), as applicable, of the Securities Exchange Act of 1934 (15 U.S.C. 78m or 78o(d)); and |
| |
(ii) |
the information contained in the Report fairly presents, in all material respects, the financial condition and results of operations of the Company. |
| Dated: |
August 30, 2024 |
|
| |
|
|
| By: |
/s/ Mark Haley |
|
| |
Mark Haley (Principal Executive Officer) |
|
| |
President |
|
This certification is furnished pursuant to Section 906 of the Sarbanes-Oxley
Act of 2002, 18 U.S.C. § 1350, and accompanies the report on Form N-CSR for the period ended June 30, 2024 (the “Report”),
of the Liberty All-Star Growth Fund, Inc. (the “Company”).
I, Erich Rettinger, the Treasurer and Principal Financial Officer of the
Company, certify that:
| |
(i) |
the Report fully complies with the requirements of Section 13(a) or Section 15(d), as applicable of the Securities Exchange Act of 1934 (15 U.S.C. 78m or 78o(d)); and |
| |
(ii) |
the information contained in the Report fairly presents, in all material respects, the financial condition and results of operations of the Company. |
| Dated: |
August 30, 2024 |
|
| |
|
|
| By: |
/s/ Erich Rettinger |
|
| |
Erich Rettinger (Principal Financial Officer) |
|
| |
Treasurer |
|
v3.24.2.u1
| X |
- DefinitionBoolean flag that is true when the XBRL content amends previously-filed or accepted submission.
| Name: |
dei_AmendmentFlag |
| Namespace Prefix: |
dei_ |
| Data Type: |
xbrli:booleanItemType |
| Balance Type: |
na |
| Period Type: |
duration |
|
| X |
- DefinitionThe type of document being provided (such as 10-K, 10-Q, 485BPOS, etc). The document type is limited to the same value as the supporting SEC submission type, or the word 'Other'.
| Name: |
dei_DocumentType |
| Namespace Prefix: |
dei_ |
| Data Type: |
dei:submissionTypeItemType |
| Balance Type: |
na |
| Period Type: |
duration |
|
| X |
- DefinitionA unique 10-digit SEC-issued value to identify entities that have filed disclosures with the SEC. It is commonly abbreviated as CIK. Reference 1: http://www.xbrl.org/2003/role/presentationRef
-Publisher SEC
-Name Exchange Act
-Number 240
-Section 12
-Subsection b-2
| Name: |
dei_EntityCentralIndexKey |
| Namespace Prefix: |
dei_ |
| Data Type: |
dei:centralIndexKeyItemType |
| Balance Type: |
na |
| Period Type: |
duration |
|
| X |
- DefinitionOne of: N-1A (Mutual Fund), N-1 (Open-End Separate Account with No Variable Annuities), N-2 (Closed-End Investment Company), N-3 (Separate Account Registered as Open-End Management Investment Company), N-4 (Variable Annuity UIT Separate Account), N-5 (Small Business Investment Company), N-6 (Variable Life UIT Separate Account), S-1 or S-3 (Face Amount Certificate Company), S-6 (UIT, Non-Insurance Product). Reference 1: http://www.xbrl.org/2003/role/presentationRef
-Publisher SEC
-Name Regulation S-T
-Number 232
-Section 313
| Name: |
dei_EntityInvCompanyType |
| Namespace Prefix: |
dei_ |
| Data Type: |
dei:invCompanyType |
| Balance Type: |
na |
| Period Type: |
duration |
|
| X |
- DefinitionThe exact name of the entity filing the report as specified in its charter, which is required by forms filed with the SEC. Reference 1: http://www.xbrl.org/2003/role/presentationRef
-Publisher SEC
-Name Exchange Act
-Number 240
-Section 12
-Subsection b-2
| Name: |
dei_EntityRegistrantName |
| Namespace Prefix: |
dei_ |
| Data Type: |
xbrli:normalizedStringItemType |
| Balance Type: |
na |
| Period Type: |
duration |
|
Liberty All Star Growth (NYSE:ASG)
Historical Stock Chart
From Dec 2024 to Jan 2025

Liberty All Star Growth (NYSE:ASG)
Historical Stock Chart
From Jan 2024 to Jan 2025

