UNITED STATES
SECURITIES AND EXCHANGE COMMISSION
Washington, DC 20549
FORM 6-K
REPORT OF FOREIGN PRIVATE ISSUER
PURSUANT TO RULE 13a-16 OR 15d-16
UNDER THE SECURITIES EXCHANGE ACT OF 1934
For the month of May, 2024.
Commission File Number 001-38755
Suzano S.A.
(Exact name of registrant as specified in its charter)
SUZANO INC.
(Translation of Registrant’s Name into English)
Av. Professor Magalhaes Neto, 1,752
10th Floor, Rooms 1010 and 1011
Salvador, Brazil 41 810-012
(Address of principal executive office)
Indicate by check mark whether the registrant files or will file annual reports under cover of Form 20-F or Form 40-F.
Form 20-F ☒ Form 40-F ☐
Indicate by check mark if the registrant is submitting the Form 6-K in paper as permitted by Regulation S-T Rule 101(b)(1): ☐
Indicate by check mark if the registrant is submitting the Form 6-K in paper as permitted by Regulation S-T Rule 101(b)(7): ☐
Enclosures:
SIGNATURE
Pursuant to the requirements of the Securities Exchange Act of 1934, the registrant has duly caused this report to be signed on its behalf by the undersigned, thereunto duly authorized.
Date: May 10, 2024
| | | | | | | | |
| | SUZANO S.A. |
| | |
| By: | /s/ Marcelo Feriozzi Bacci |
| Name: | Marcelo Feriozzi Bacci |
| Title: | Chief Financial and Investor Relations Officer |
SUZANO
Earnings Conference Call 1Q24
SUZB / B3 LISTED NM
SUZ / LISTED / NYSE
This presentation contains what are considered “forward-looking statements,” as defined in Section 27A of the 1933 Securities Act and Section 21E of the 1934 Securities Exchange Act, as amended. Some of these forward-looking statements are identified with words such as “believe,” “may,” “could,” “would,” “possible,” “will,” “should,” “expect,” “intend,” “plan,” “anticipate,” “estimate,” “potential,” “outlook” or “continue,” as well as the negative forms of these words, other terms of similar meaning or the use of future dates.
The forward-looking statements include, without limitation, statements related to the declaration or payment of dividends, implementation of the key operational and financial strategies and investment plans, guidance about future operations and factors or trends that influence the financial situation, liquidity or operational results. Such statements reflect the current view of the management and are subject to diverse risks and uncertainties. These are qualified in accordance with the inherent risks and uncertainties involving future expectations in general, and actual results could differ materially from those currently anticipated due to various risks and uncertainties. There is no guarantee that the expected events, trends or results will actually occur. The statements are based on diverse assumptions and factors, including general economic and market conditions, industry conditions and operating factors. Any changes in such assumptions or factors could cause actual results to differ materially from current expectations. Suzano does not undertake any obligation to update any such forward-looking statements as a result of new information, future events or otherwise, except as expressly required by law. All forward-looking statements in this presentation are covered in their entirety by this disclaimer.
In addition, this presentation contains some financial indicators that are not recognized by the BR GAAP or IFRS. These indicators do not have a standard meaning and may not be comparable to indicators with a similar description used by other companies. We provide these indicators because we use them as measurements of Suzano's performance; they should not be considered separately or as a replacement for other financial metrics that have been disclosed in accordance with BR GAAP or IFRS.
SUZANO
HIGHLIGHTS More favorable market scenareriod Sales Volume Pulp: 2.4 million tons (vs. 2.5 million tons 1Q23 and 2.8 million tons 4Q23) Paper and packaging1: 256 thousand tons (vs. 249 thousand tons 1Q23 and 320 thousand tons 4Q23) Pulp Inventory: Partial replenishment to normalize service levels Operating Performance Adjusted EBITDA: R$4.6 bn (vs. R$6.2 billion 1Q23 and R$4.5 billion 4Q23) Operating Cash Generation2: R$2.5 bn (vs. R$4.7 billion 1Q23 and R$2.8 billion 4Q23) Cash cost ex-downtimes: R$812/ton (vs. R$937/ton 1Q23 and R$816/ton 4Q23) Financial Management Liquidity3 : US$6.3 bn (vs. US$6.1 billion 1Q23 and US$6.8 billion 4Q23) Net debt: US$11.9 bn (vs. US$10.9 billion 1Q23 and US$11.5 billion 4Q23) Leverage4 : 3.5x in US$ (vs. 1.9x in 1Q23 and 3.1x in 4Q23) 1 Excluding Consumer Goods. | 2 Operating Cash Generation = Adjusted EBITDA less Sustaining Capex. | 3 Considers Finnvera and IFC credit line. | 4 Net Debt / Adjusted EBITDA in the last twelve months. SUZANO
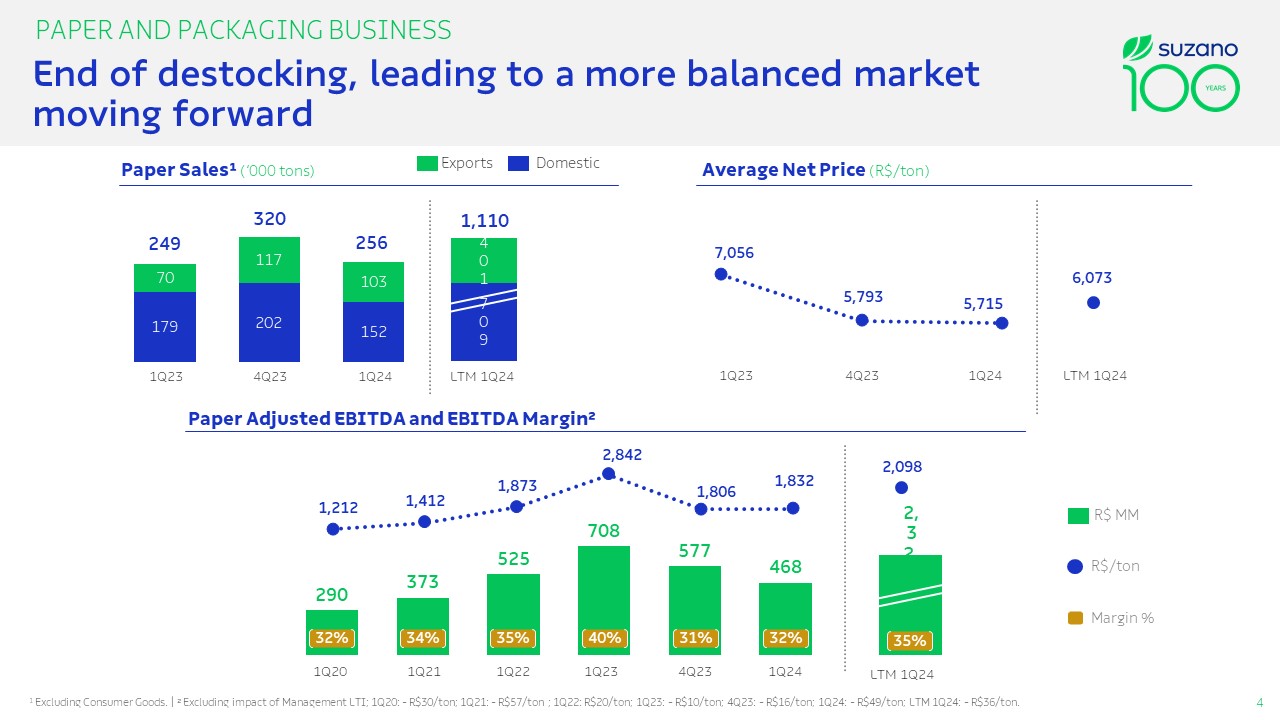
PAPER AND PACKAGING BUSINESS End of destocking, leading to a more balanced market moving forward
1 Excluding Consumer Goods.| ² Excluding impact of Management LTI; 1Q20: - R$30/ton; 1Q21: - R$57/ton ; 1Q22: R$20/ton; 1Q23: - R$10/ton; 4Q23: - R$16/ton; 1Q24: - R$49/ton; LTM 1Q24: - R$36/ton.
Paper Sales¹ (‘000 tons) Average Net Price (R$/ton) Paper Adjusted EBITDA and EBITDA Margin²
R$ MM R$/ton Margin %
LTM 1Q24 LTM 1Q24 1Q20 1Q21 1Q22 1Q23 4Q23 1Q24 Exports Domestic. SUZANO
249 70 179 320 117 202 256 103 152 1,110 401 709 7,056 5,793 5,715 6,073
1,212 1,412 1,873 2,842 1,806 1,832 2,098 2,328 290 373 525 708 577 468 32% 34% 35% 40% 31% 32% 35%
PULP BUSINESS 1Q23 4Q23 1Q24 LTM 1Q24 1Q23 4Q23 1Q24 LTM 1Q24 Average FX R$ 5.20 R$ 4.96 R$ 4.95 R$ 4.93 Supply disruptions and demand pick up drive positive price dynamic R$ MM R$/ton Margin % 1Q23 4Q23 1Q24 US$ BRL LTM 1Q24 Sales Volume (‘000 tons) Average Net Price –Export Market ($/tons) Adjusted EBITDA and EBITDA Margin (%) SUZANO 2,455 2,761 2,401 10,161 3,737 2,835 3,092 2,174 1,360 1,625 1,354 719 572 624 576 5,336 3,756 3,902 13,761 58% 48% 53% 48%
PULP BUSINESS Stable cash cost ex-downtimes, delivering performance as planned Pulp Cash Cost – 1Q24 vs. 4Q23 (ex-downtimes –R$/ton) Commodity price effect: -R$5/ton 816 337 339 176 (36) (19) 3 10 2 0 812 318 342 186 (34) 4Q23 Wood Input Fixed Cost Energy FX 1Q24 Pulp Cash Cost – 1Q24 vs. 1Q23 (ex-downtimes –R$/ton) Commodity price effect: -R$53/ton 937 363 430 182 (38) (45) (81) 4 4 (7) 812 318 342 186 (34) 1Q23 1Q24 SUZANO
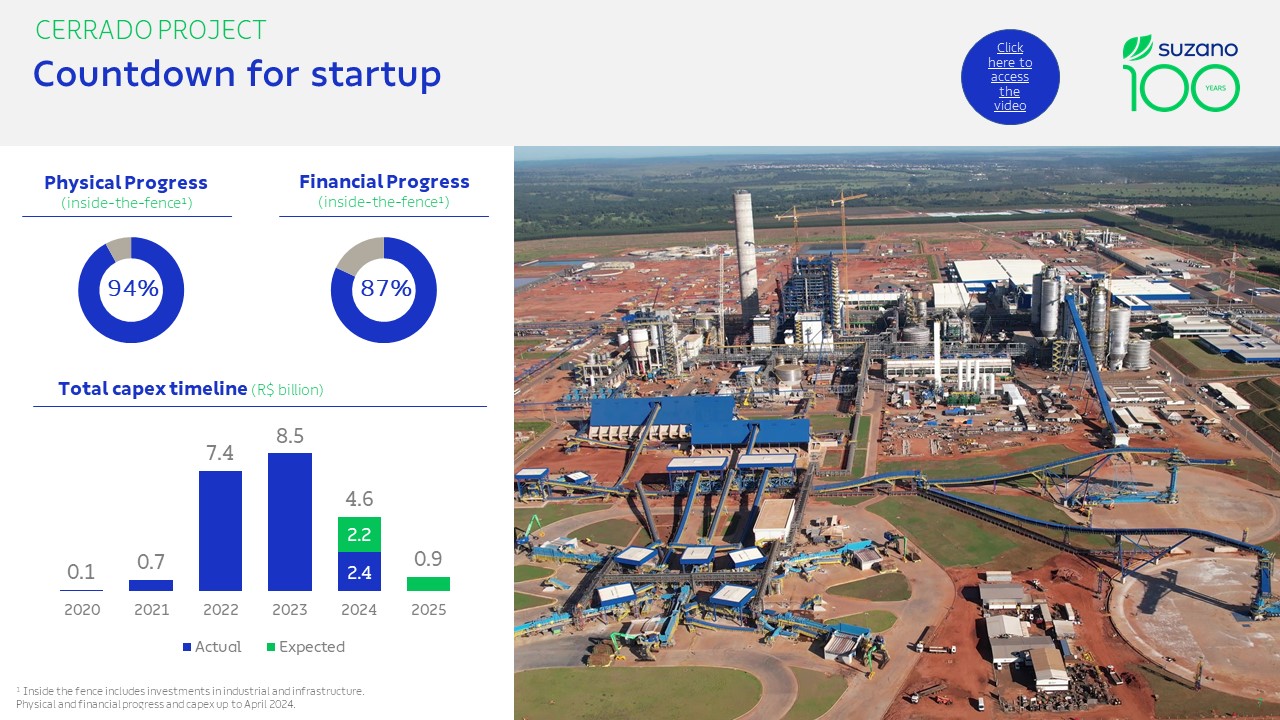 CERRADO PROJECT Countdown for startup 95% Physical Progress (inside-the-fence¹) 87% Financial Progress (insidece¹) Total capex timeline (R$ billion) 0.1 0.7 7.4 8.5 4.6 0.9 2020 2021 2022 2023 2024 2025 Actual Expected 1 Insidethe fence includes investments in industrial and infrastructure. Physicaland financial progress and capex up to April 2024. Click here to access the video SUZANO
CERRADO PROJECT Countdown for startup Learning curve ~9 months Sales volume 2024 700 k tons Production volume 2024 900 k tons Monthly production rate (t/month) Scheduled downtime Learning curve conclusion Accumulated Monthly 2Mt Monthly 1 Monthly 2 Monthly 3 Monthly 4 Monthly 5 Monthly 6 Monthly 7 Monthly 8 Monthly 9 Monthly 10 Monthly 11 Monthly 12 250 200 150 100 50 SUZANO
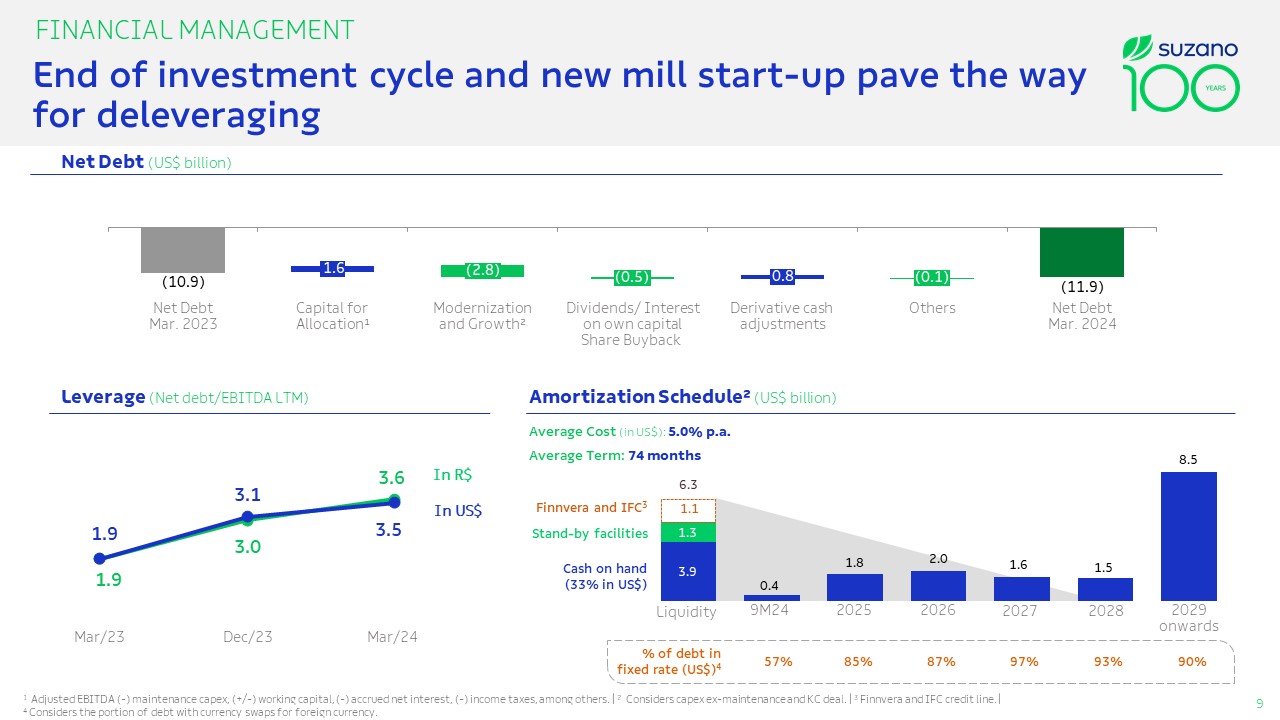
FINANCIAL MANAGEMENT End of investment cycle and new mill start-up pave the way for deleveraging Net Debt (US$ billion) 10.9 Net Debt Mar. 2023 1.6 Capital for Allocation 2.8 Modernization and Growth Inverter bridge Dividends/ Interest on own capital Share Buyback (0.8) Derivative cash adjustments 0.1 Others 11.9 Net Debt Mar. 2024 Leverage (Net debt/EBITDA LTM) In R$ In US$ Mar/23 Dec/23 Mar/24 1.9 3.1 3.6 3.0 3.5 Amortization Schedule² (US$ billion) Average Cost (in US$): 5.0% p.a. Average Term: 74 months Finnvera and IFC3 Stand-by facilities Cash on hand (33% in US$) Liquidity 9M24 2025 2026 2027 2028 2029 onwards 6,3 1,1 1.3 3.9 0.4 1.8 2.0 1.6 1.5 8.5 % of debt in fixed rate (US$)4 57% 85% 87% 97% 93% 90% 1 Adjusted EBITDA (-) maintenance capex, (+/-) working capital, (-) accrued net interest, (-) income taxes, among others. | 2 Considers capex ex-maintenance and KC deal.. | 3 Finnvera and IFC credit line. | 4 Considers the portion of debt with currency swaps for foreign currencANO

Q&A 1Q24 Investor Relations www.suzano.com.br/ir ri@suzano.com.br SUZANO SUZB / B3 LISTED NM
SUZ / LISTED / NYSE
Suzano (NYSE:SUZ)
Historical Stock Chart
From Apr 2024 to May 2024

Suzano (NYSE:SUZ)
Historical Stock Chart
From May 2023 to May 2024
