Marimaca Files Technical Report on Updated Mineral Resource Estimation
27 June 2023 - 9:00PM

Marimaca Copper Corp. (“Marimaca Copper” or the “Company”)
(TSX: MARI) is pleased to announce that further to its
news release dated May 18th, 2023 it has filed a technical report
in accordance with Canadian Securities Administrator’s National
Instrument 43-101 – Standards of Disclosure for Mineral Projects
(“
NI 43-101”) on the Marimaca Copper Project
titled “Updated Mineral Resource Estimation for the Marimaca Copper
Project, Antofagasta Region, Chile” (the “
Technical
Report”
or “
2023 MRE”).
The Technical Report is dated June 26th, 2023, with an effective
date of May 18th, 2023, and is available under the Company's
profile on SEDAR at www.sedar.com.
The 2023 MRE incorporates 28,374m of new
drilling data completed since the Company’s previous technical
report for the Marimaca Copper Project having an effective date of
October 13th, 2022 and filed on November 28th, 2022 (the
“2022 MRE”). The Marimaca Oxide Deposit (the
“MOD”) database now consists of 139,164m of
drilling completed since discovery in 2016. New drilling data
captured following the 2022 MRE was largely targeted at conversion
of Inferred Resources to the Measured and Indicated categories.
|
Mineral Resource Category and Type |
Quantity |
CuT |
CuS |
CuT |
CuS |
|
(kt) |
(%) |
(%) |
(t) |
(t) |
|
Total Measured |
96,954 |
0.49 |
0.28 |
473,912 |
268,628 |
|
Total Indicated |
103,358 |
0.41 |
0.21 |
425,797 |
219,690 |
|
Total Measured and Indicated |
200,312 |
0.45 |
0.24 |
899,709 |
488,319 |
|
Total Inferred |
37,289 |
0.38 |
0.15 |
141,252 |
55,802 |
Table 1. 2023 Mineral Resource Estimate
(reported at 0.15% CuT cutoff)
* Pit shell constrained resources with demonstrated
reasonable prospects for eventual economic extraction (RPEEE) are
generated using series of Lerchs-Grossmann pit shell optimizations
completed by NCL* CuT means total copper and CuS means acid soluble
copper. Technical and economic parameters include: copper price
US$4.00/lb; base mining cost of US$1.51/t with a mining cost
adjustment factor of US$0.04/t-10m bench; Heap Leach “HL”
processing cost US$5.94/t (incl. G&A); Run-of-Mine “ROM”
processing cost US$1.65/t (incl. G&A); SX-EW processing cost
and selling cost US$0.16/lb Cu; heap leach recovery 76% of CuT; ROM
recovery 40% of CuT; and 42°-52° pit slope angles* Mineral
resources which are not mineral reserves do not have demonstrated
economic viability. Due to the uncertainty which may attach to
inferred mineral resources, it cannot be assumed that all or any
part of an inferred mineral resource will be upgraded to an
indicated or measured mineral resource as a result of continued
exploration
|
Cut-off grade (% CuT) |
Measured |
Indicated |
Measured + Indicated |
Inferred |
|
|
|
|
Quantity kt |
CuT [%] |
CuS [%] |
Quantity kt |
CuT [%] |
CuS [%] |
Quantity kt |
CuT [%] |
CuS [%] |
Quantity kt |
CuT [%] |
CuS [%] |
|
|
0.40 |
44.0 |
0.77 |
0.44 |
37.5 |
0.69 |
0.38 |
81.6 |
0.73 |
0.41 |
12.1 |
0.64 |
0.24 |
|
|
0.30 |
60.2 |
0.65 |
0.38 |
55.5 |
0.58 |
0.31 |
115.7 |
0.62 |
0.35 |
18.8 |
0.54 |
0.21 |
|
|
0.22 |
77.8 |
0.56 |
0.32 |
77.0 |
0.49 |
0.26 |
154.9 |
0.53 |
0.29 |
27.2 |
0.45 |
0.18 |
|
|
0.20 |
83.0 |
0.54 |
0.31 |
83.8 |
0.47 |
0.25 |
166.8 |
0.50 |
0.28 |
30.2 |
0.43 |
0.17 |
|
|
0.18 |
88.3 |
0.52 |
0.30 |
91.3 |
0.44 |
0.23 |
179.6 |
0.48 |
0.26 |
33.0 |
0.41 |
0.16 |
|
|
0.15 |
97.0 |
0.49 |
0.28 |
103.4 |
0.41 |
0.21 |
200.3 |
0.45 |
0.24 |
37.3 |
0.38 |
0.15 |
|
|
0.10 |
113.3 |
0.44 |
0.24 |
127.6 |
0.36 |
0.18 |
241.0 |
0.39 |
0.21 |
46.6 |
0.33 |
0.13 |
|
|
0.00 |
146.1 |
0.35 |
0.19 |
178.2 |
0.27 |
0.14 |
324.3 |
0.31 |
0.16 |
72.0 |
0.24 |
0.09 |
|
Table 2. 2023 Mineral Resource
Sensitivity
* Pit shell constrained resources with demonstrated
reasonable prospects for eventual economic extraction (RPEEE) are
generated using series of Lerchs-Grossmann pit shell optimizations
completed by NCL* CuT means total copper and CuS means acid soluble
copper. Technical and economic parameters include: copper price
US$4.00/lb; base mining cost of US$1.51/t with a mining cost
adjustment factor of US$0.04/t-10m bench; Heap Leach “HL”
processing cost US$5.94/t (incl. G&A); Run-of-Mine “ROM”
processing cost US$1.65/t (incl. G&A); SX-EW processing cost
and selling cost US$0.16/lb Cu; heap leach recovery 76% of CuT; ROM
recovery 40% of CuT; and 42°-52° pit slope angles* Mineral
resources which are not mineral reserves do not have demonstrated
economic viability. Due to the uncertainty which may attach to
inferred mineral resources, it cannot be assumed that all or any
part of an inferred mineral resource will be upgraded to an
indicated or measured mineral resource as a result of continued
exploration
Qualified Person
The technical information in this news release,
including the information related to drilling, modeling and
resource estimation, and the application of technical and economic
parameters has been reviewed and approved by Luis Oviedo, P. Geo,
an independent Consulting Geologist with more than 45 years of
experience. Mr. Oviedo is a member of the Colegio de Geólogos and
the Institute of Mining Engineers of Chile and is an Independent
Qualified Person as defined by NI 43-101.
Mr. Oviedo confirms he has visited the project
area, has reviewed relevant project information, is responsible for
the information contained in this news release, and consents to its
publication.
Contact InformationFor further
information please visit www.marimaca.com or contact:
Tavistock +44 (0) 207 920
3150Emily Moss / Adam Baynes
marimaca@tavistock.co.uk
Forward Looking Statements
This news release includes certain
“forward-looking statements” under applicable Canadian securities
legislation. There can be no assurance that such statements will
prove to be accurate, and actual results and future events could
differ materially from those anticipated in such statements.
Forward-looking statements reflect the beliefs, opinions and
projections on the date the statements are made and are based upon
a number of assumptions and estimates that, while considered
reasonable by Marimaca Copper, are inherently subject to
significant business, economic, competitive, political and social
uncertainties and contingencies. Many factors, both known and
unknown, could cause actual results, performance or achievements to
be materially different from the results, performance or
achievements that are or may be expressed or implied by such
forward-looking statements and the parties have made assumptions
and estimates based on or related to many of these factors. Such
factors include, without limitation: risks related to share price
and market conditions, the inherent risks involved in the mining,
exploration and development of mineral properties, the
uncertainties involved in interpreting drilling results and other
geological data, fluctuating metal prices, the possibility of
project delays or cost overruns or unanticipated excessive
operating costs and expenses, uncertainties related to the
necessity of financing, uncertainties relating to regulatory
procedure and timing for permitting reviews, the availability of
and costs of financing needed in the future as well as those
factors disclosed in the annual information form of the Company
dated March 27, 2023 and other filings made by the Company with the
Canadian securities regulatory authorities (which may be viewed
at www.sedar.com). Accordingly, readers should not place undue
reliance on forward-looking statements. Marimaca Copper undertakes
no obligation to update publicly or otherwise revise any
forward-looking statements contained herein whether as a result of
new information or future events or otherwise, except as may be
required by law.
Neither the Toronto Stock Exchange nor the
Canadian Investment Regulatory Organization accepts
responsibility for the adequacy or accuracy of this
release.
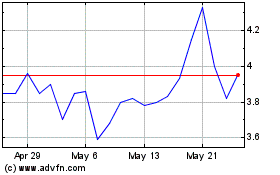
Marimaca Copper (TSX:MARI)
Historical Stock Chart
From Jan 2025 to Feb 2025

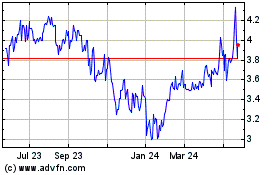
Marimaca Copper (TSX:MARI)
Historical Stock Chart
From Feb 2024 to Feb 2025
