UNITED STATES
SECURITIES AND EXCHANGE COMMISSION
Washington, D.C. 20549
Form 6-K
REPORT OF FOREIGN PRIVATE ISSUER PURSUANT TO
RULE 13a-16 OR 15d-16
UNDER THE SECURITIES EXCHANGE ACT OF 1934
For the month of February 2024
Commission File No. 001-35193
Grifols, S.A.
(Translation of registrant’s name into English)
Avinguda de la Generalitat, 152-158
Parc de Negocis Can Sant Joan
Sant Cugat del Valles 08174
Barcelona, Spain
(Address of registrant’s principal executive
office)
Indicate by check mark whether the registrant files or will file annual
reports under cover Form 20-F or Form 40-F.
Form 20-F x Form 40-F
¨
Grifols, S.A.
TABLE OF CONTENTS

Full
Year 2023 Interim Condensed Consolidated Financial Statements [unaudited]1
Grifols
closes a record year and accelerates profitable growth for 2024
Revenue
reaches EUR 6,592 million (+11% cc2), EBITDA adjusted improves to EUR 1,474 million (an increase of 26% cc), with clear
progress towards the 4x leverage target3
| · | Focused
commitment to best-in-class corporate governance and leadership |
| · | Revenue
growth driven by Biopharma (+13.3% cc) on the back of solid growth of key plasma proteins.
Diagnostic and Bio Supplies also grow by +2.3% cc and +11.3% cc, respectively |
| · | EBITDA
adjusted margin increases to 24.0%, up by 580bps to 26.1% in Q4’23 compared Q4’22,
both excluding Biotest |
| · | Full
execution of the Operational Improvement Plan, resulting in more than EUR 450 million3
annualized cash cost savings, with cost per liter of plasma declining by -22% in December 2023
compared to July 2022 peak |
| · | Achieved
all innovation milestones set for 2023; Fibrinogen ADFIRST trial positive topline results |
| · | Reported
net profit at EUR 59 million, which includes one-offs amounting to EUR 147 million mainly related to restructuring costs |
| · | Operating
cash flow increases by EUR 300 million to EUR 351 million, and free cash flow turns from
negative to positive in the second half of 2023, both excluding one-offs |
| · | Leverage
ratio down to 6.3x4 (5.4x pro-forma with SRAAS partial disposal, which is expected
to close in the first half of 2024); on track towards 4x target |
| · | Guidance
for 2024, with revenue growth of 7%+ at cc driven by Biopharma (+8-10% cc), and EBITDA adjusted
at EUR 1,800+ million (excluding EUR 50m SRAAS 2023 contribution) |
Barcelona,
Spain, February 29, 2024 – Grifols (MCE:GRF, MCE:GRF.P, NASDAQ:GRFS), a global healthcare company and leading manufacturer
of plasma-derived medicines, reported a strong year marked by a significant improvement of operational and financial performance. The
company further accelerated growth, improved EBITDA margins and cash flow generation, thereby making good progress towards its deleveraging
target.
Thomas Glanzmann,
Grifols’ Executive Chairman and CEO commented: “We delivered fully on our commitments in a record 2023 marked by focus
on governance and progressively stronger operational and financial performance. From a re-energized plasma business to completing innovation
milestones to the strategic alliance with Haier Group in support of deleveraging, our actions have built a strong momentum and set us
up for sustainable profitable growth into 2024 and beyond.”
1 The Interim
Condensed Consolidated Financial Statements have been prepared in accordance with IFRS and approved by the Grifols Board of Directors.
Grifols has received written confirmation from KPMG that it expects to complete its internal procedures and issue its audit opinion by
8 March 2024, ahead of Spanish current legislation deadline
2 Operating
or constant currency (cc) excludes changes rate variations reported in the period
3 Compared
to 2022 full year figures, before the effect of inflation
4 Leverage ratio consistently
calculated as per the Credit Agreement and including Biotest
Committed to
best-in-class governance and leadership team
During 2023, the
company began searching for a new CEO to ensure the separation of ownership and management as part of a broader initiative to strengthening
the company’s governance, resulting in the naming of the incoming CEO, Nacho Abia, effective, April 1, 2024.
His appointment
strengthens the company’s leadership, which in recent months has made key hires including Roland Wandeler as President of the Biopharma
Business Unit; Camille Alpi as Chief Human Resources and Talent Officer; Joerg Schüttrumpf as Chief Scientific Innovation Officer;
and Miguel Louzan, Chief Digital Information Officer. The new executive lineup, in combination with the existing team, will further strengthen
Grifols’ senior management team.
With Grifols commitment
to meeting the highest standards of governance, the company is also actively working to simplify structures.
Business performance
In 2023, total
revenue grew 10.9% cc (+8.7% on a reported basis), reaching EUR 6,592 million, with all business units and key regions reporting growth.
Biopharma revenue
reached EUR 5,558 million growing by 13.3% cc (+11.0%), driven by increasing plasma supply, robust underlying demand for key proteins,
favorable pricing, and product mix.
Grifols continued
increasing the value of its immunoglobulin (IG) franchise with a clear strategy. The growth of this flagship product by 15.8% cc for
the year, excluding Biotest, was notable, especially with the increased adoption of its subcutaneous immunoglobulin (SCIG), Xembify®,
which reported a significant growth of 37.3% cc.
As part of the
subcutaneous IG commercialization plan, mainly in Europe, Xembify® was launched in Spain in the second quarter of the
year, as well as in Australia in the fourth quarter, with expected additional launches in the near future. Grifols aims to capitalize
on the growing demand for IG following past launches along with obtaining regulatory approvals across 13 EU countries in 2023.
The company is
focused on the immunodeficiency market, targeting primary immunodeficiency (PID) and secondary immunodeficiencies (SID), which are the
indications with the highest growth potential. Concurrently, it continues to uphold its leadership position in the fields of neurology
and acute care.
Albumin reported
an increase of +17.0% cc primarily driven by China and, to a lesser extent, other European countries. Additionally, Alpha-1 showed positive
growth in the last quarter of the year, recording a 0.2% cc increase. This upward trend is expected to continue in 2024.
Plasma supply
increased by 10%5 over the entire year. In 2023, cost per liter (CPL) declined by 22% compared to July 2022 peak.
This decrease was largely driven by the successful execution of the Operational improvement Plan. Notable achievements of this plan include
a 32%5 rise in plasma collections per full-time employee (FTE), signalling improved labour productivity, a 5%5
reduction in manufacturing costs, as well as optimization of the plasma-center network, improvements in process efficiencies, enhancement
of cost structures, and improved experiences for both donors and employees.
5 FY23 vs. FY22
Diagnostic revenue
was up by 2.3% cc (-0.2%) totalling EUR 670 million, primarily driven by blood typing solutions (+8.9% cc), which reported strong sales
across key regions.
Bio Supplies
revenue increased by 11.3% cc (+9.5%) totalling EUR 160 million, primarily driven by Bio Supplies Biopharma due to new customers
and higher demand from current customers. The company continues to leverage the integration of Access Biologicals to capture the full
potential of this business unit.
Financial performance
and leverage
Gross margin
adjusted reached 41.4% in the fourth quarter of 2023, improving by 570bps compared to the same quarter of 2022, contributing to a
39.7% margin for the full year (37.6% in 2022), excluding Biotest. Based on the 9-month lag industry’s inventory accounting, the
company recognizes the positive impact on its profit and loss (P&L) from the CPL decline of 22% that started in the third quarter
of 2022, as well as from the 5% drop in the manufacturing cost.
EBITDA adjusted
amounted to EUR 1,474 million, exceeding guidance, with a margin of 22.4% (24.0% excluding Biotest). The sequential improvement throughout
the year is reflected on the 26.1% margin reported in the fourth quarter, excluding Biotest. This was supported by Biopharma’s
strong performance, the positive impact on the profit and loss (P&L) from the Operational Improvement Plan’s cost savings,
triggering a CPL decline of 22%, as well as operational leverage.
EBITDA adjusted
excludes EUR 223 million of one-off charges (EUR 190 million excluding Biotest), mainly comprising EUR 159 million restructuring costs.
EBITDA reported
grew to EUR 1,251 million, representing a 19.0% margin (20.8% excl. Biotest).
Reported net
profit totalled EUR 59 million in 2023. Excluding one-offs, which mainly includes restructuring costs, this figure increased to EUR
206 million.
Cash flow
generation showed a positive trend backed by a strong turnaround in operating performance. Operating cash flow, excluding one-offs6,
significantly improved quarter over quarter and reached EUR 351 million in 2023, increasing by EUR 300 million compared to the previous
year.
Free cash flow,
excluding one-offs6, turned from negative to positive throughout the year, generating close to EUR 120 million in the second
half of the year. This was driven by strong momentum across the business and EBITDA expansion.
Deleveraging
remains a key priority, with the leverage ratio declining to 6.3x as of year-end, mainly driven by EBITDA improvement. Additionally,
the proceeds from the sale of the c.20% stake of Shanghai RAAS to Haier Group will be fully utilized to repay debt. Proforma for this
transaction, the leverage ratio stands at 5.4x, which supports clear progress towards the 4x target.
6 Excluding mainly restructuring
costs. See Annex for reconciliations
In that respect,
Grifols expects to address its 2025 maturities in H1 2024 and will seek to do this in an efficient manner, taking into account both the
planned disposal proceeds and the various other options available to company, including refinancing these maturities whilst remaining
consistent with its deleveraging objectives.
The strategic alliance
with Haier is expected to close in the first half of 2024 and will also drive synergies and capitalize on China’s high-growth market
potential in the plasma and diagnostic industries. On top of this, the alliance lengthens the exclusive albumin distribution agreement
with SRAAS for the next ten years, with a potential extension of up to 20 years.
Excluding the impact
of IFRS 167, net financial debt totalled EUR 9,420 million.
As of December 31,
2023, Grifols had a liquidity position of EUR 1,141 million and a cash position of EUR 526 million.
Grifols projects
sustainable profitable growth for 2024
As Grifols moves
into 2024, it is well-positioned to accelerate improvements in financial performance and operational efficiency. Central to Grifols'
strategy are five levers aimed at securing long-term success and meeting the expectations of patients, donors, customers, and all stakeholders:
| - | Focus
on core areas: Building presence in Biopharma, Diagnostic, and Bio Supplies |
| - | Accelerate
innovation: Leveraging new technologies to expand the plasma pipeline and explore non-plasma
opportunities |
| - | Global
market influence: Seeking strategic partnerships to shape the global market |
| - | Elevate
donor experience: Digitalizing processes for a seamless donor journey |
| - | Optimize
operations continuously: Pursuing efficiencies to excel in business operations |
Innovation:
Fibrinogen top line phase 3 positive results
Grifols not only
achieved all of its projected innovation milestones for 2023 but also made a mark with the top-line results of the Fibrinogen ADFIRST,
which demonstrated effectiveness in treating AFD in treating acquired fibrinogen deficiency (AFD) as equivalent to standard of care while
maintaining an excellent safety profile.
The regulatory
approval process in the EU and US will begin in the fourth quarter of 2024. It would be the first FC approved for an AFD indication in
the U.S. in a global market with an estimated potential of USD 800 million.
The innovation
pipeline milestones for 2024 are fuelled by internal research and external innovation, focusing on developing assets with long-lasting
competitive advantages. Key milestones are the Alpha-1 AT 15% SC with the first sites active and first patient screened, PRECIOSA study
with the last patients finalizing treatment, Xembify bi-weekly dose FDA approval, and Yimmugo BLA FDA approval.
7
As of December 2023, the impact of IFRS on total debt is EUR 997 million
2024 Guidance
| REVENUE (at cc) | |
| | |
| Total revenue growth (incl. Biotest) | |
| 7%+ | |
| Biopharma revenue growth (incl. Biotest) | |
| 8-10% | |
| | |
| | |
| EBITDA adjusted (excl. EUR 50m SRAAS 2023 contribution) | |
| | |
| EBITDA adjusted (incl. Biotest) | |
| EUR 1,800m+ | |
| EBITDA adjusted margin (excl. Biotest) | |
| 27-28% | |
CONFERENCE CALL
Grifols will host
today a conference call at 2.30pm CET/8.30am EST on Thursday, February 29, 2024, to discuss its full year business update. To listen
to the webcast and view the Business Update Presentation, visit our web site www.grifols.com/en/investors. Participants are advised
to register in advance of the conference call.
The transcript
and webcast replay of the call will be available on our web site at www.grifols.com/en/investors within 24 hours after the end
of the live conference call.
INVESTORS:
Grifols Investors
Relations & Sustainability
inversores@grifols.com
- investors@grifols.com
sostenibilidad@grifols.com
- sustainability@grifols.com
Tel. +34 93 571
02 21
MEDIA CONTACTS:
Grifols
Press Office
media@grifols.com
/ Tel. +34 93 571 00 02 |
Spain
Duomo Comunicación
Tel.: +34 91
311 92 89 – +34 91 311 92 90
Raquel Lumbreras
(M. +34 659 572 185)
Raquel_lumbreras@duomocomunicacion.com
Borja Gómez
(M. +34 650 402 225)
Borja_gomez@duomocomunicacion.com |
About Grifols
Grifols is a global
healthcare company founded in Barcelona in 1909 committed to improving the health and well-being of people around the world. A leader
in essential plasma-derived medicines and transfusion medicine, the company develops, produces, and provides innovative healthcare services
and solutions in more than 110 countries.
Patient needs and
Grifols’ ever-growing knowledge of many chronic, rare and prevalent conditions, at times life-threatening, drive the company’s
innovation in both plasma and other biopharmaceuticals to enhance quality of life. Grifols is focused on treating conditions across a
broad range of therapeutic areas: immunology, hepatology and intensive care, pulmonology, hematology, neurology, and infectious diseases.
A pioneer in the
plasma industry, Grifols continues to grow its network of donation centers, the world’s largest with over 390 across North America,
Europe, Africa and the Middle East, and China.
As a recognized
leader in transfusion medicine, Grifols offers a comprehensive portfolio of solutions designed to enhance safety from donation to transfusion,
in addition to clinical diagnostic technologies. It provides high-quality biological supplies for life-science research, clinical trials,
and for manufacturing pharmaceutical and diagnostic products. The company also supplies tools, information and services that enable hospitals,
pharmacies and healthcare professionals to efficiently deliver expert medical care.
Grifols, with more
than 23,000 employees in more than 30 countries and regions, is committed to a sustainable business model that sets the standard for
continuous innovation, quality, safety, and ethical leadership.
In 2023, Grifols’
economic impact in its core countries of operation was EUR 9.6 billion. The company also generated 193,000 jobs, including indirect and
induced.
The company’s
class A shares are listed on the Spanish Stock Exchange, where they are part of the Ibex-35 (MCE:GRF). Grifols non-voting class B shares
are listed on the Mercado Continuo (MCE:GRF.P) and on the U.S. NASDAQ through ADRs (NASDAQ:GRFS). For more information about Grifols,
please visit www.grifols.com

| DECLARACIÓN DE RESPONSABILIDAD
ESTADOS FINANCIEROS
CONSOLIDADOS RESUMIDOS
De conformidad con lo dispuesto en el artículo
11.1.b del Real Decreto 1362/2007, de 19 de
octubre, los consejeros de Grifols, S.A. (la
"Sociedad")
DECLARATION OF RESPONSIBILITY
SUMMARIZED CONSOLIDATED
FINANCIAL STATEMENTS
Pursuant to the provisions of article 11.1.b of
Royal Decree 1362/2007, of 19 October, the
directors of Grifols, S.A. (the "Company")
DECLARAN DECLARE
Bajo su responsabilidad que, hasta donde alcanza
su conocimiento, los estados financieros
intermedios resumidos consolidados del ejercicio
comprendido entre el 1 de enero de 2023 y el 31
de diciembre de 2023, elaboradas con arreglo a
los principios decontabilidad aplicables, ofrecen la
imagen fiel del patrimonio, de la situación
financiera y de los resultados de la Sociedad y de
las empresas comprendidas en la consolidación
tomados en su conjunto, y que el informe de
gestión intermedio consolidado incluye un análisis
fiel de la información exigida.
On their own responsibility that, to the best of their
knowledge, the summarized consolidated interim
financial statements for the period from 1 January
2023 to 31 December 2023, prepared in
accordance with applicable accounting standards,
give a fair view of the net worth, financial situation
and results of the Company and of the companies
included in its consolidation scope, considered as
a whole, and that the consolidated interim
director's report contains an accurate analysis of
the required information.
En Barcelona, a 28 de febrero 2024 In Barcelona, on 28 February 2024
Thomas Glanzmann
Executive Chairman
Jose Ignacio Abia
Board Member
Raimon Grifols Roura
Board Member
Víctor Grifols Deu
Board Member
Albert Grifols Coma-Cros
Board Member
Carina Szpilka Lázaro
Board Member
Tomás Dagà Gelabert
Board Member
Íñigo Sánchez-Asiaín
Mardones
Board Member
Enriqueta Felip Font
Board Member
James Costos (*)
Board Member
Montserrat Muñoz Abellana
Board Member
Susana González Rodríguez
Board Member
Núria Martín Barnés
Secretary
(*) Ausente por motivos personales. No obstante, no ha manifestado disconformidad ni oposición
alguna con la documentación./ Absent due to personal reasons. However, he did not express any
disconformity nor opposition with the documentation. |
| GRIFOLS, S.A.
and subsidiaries
Condensed Consolidated Interim Financial Statements
for twelve-month period ended 31 December 2023 |
| GRIFOLS, S.A. AND SUBSIDIARIES
Condensed Consolidated Interim Financial Statements for the twelve-month period ended at 31 December 2023 and 2022
SUMMARY
(Free translation from the original in Spanish. In the event of discrepancy, the Spanish-language version prevails)
Condensed consolidated financial statements
Condensed Consolidated Balance Sheet
Condensed Consolidated Statements of Profit and Loss
Condensed Consolidated Statements of Comprehensive Income
Condensed Consolidated Statements of Cash Flows
Condensed Statements of Changes in Consolidated Equity
Notes
(1) Nature, Principal Activities and Subsidiaries
(2) Basis of Presentation
(3) Business Combinations and Sales
(4) Significant Accounting Policies
(5) Segment Reporting
(6) Goodwill
(7) Other Intangible Assets
(8) Leases
(9) Property, Plant and Equipment
(10) Equity-Accounted Investees
(11) Financial Assets
(12) Non-current assets held for sale
(13) Inventories
(14) Contract assets
(15) Trade and Other Receivables
(16) Cash and Cash Equivalents
(17) Equity
(18) Earnings per Share
(19) Non-Controlling Interests
(20) Provisions
(21) Financial Liabilities
(22) Trade and Other Payables
(23) Other Current Liabilities
(24) Net Revenues
(25) Personnel Expenses
(26) Expenses by Nature
(27) Finance Result
(28) Taxation
(29) Other Commitments with Third Parties and Other Contingent
Liabilities
(30) Financial Instruments
(31) Balances and Transactions with Related Parties
(32) Environmental Information
(33) Other Information
(34) Subsequent events |
| GRIFOLS, S.A. AND SUBSIDIARIES
Condensed Consolidated Interim Financial Statements for the twelve-month period ended at 31 December 2023 and 2022
SUMMARY
(Free translation from the original in Spanish. In the event of discrepancy, the Spanish-language version prevails)
Appendices
Appendix I Information on Group Companies, Associates
and Others
Appendix II Operating Segments
Appendix III Changes in Other Intangible Assets
Appendix IV Movement in Rights of Use
Appendix V Movement in Property, Plant and Equipment |

| (Free translation from the original Spanish. In the event of discrepancy, the Spanish-language version prevails)
Assets Reference 31/12/23 31/12/22
Goodwill Note 6 6,802,127 7,011,909
Other intangible assets Note 7 2,832,196 2,949,147
Rights of use Note 8 864,067 897,552
Property, plant and equipment Note 9 3,219,621 3,270,937
Investment in equity-accounted investees Note 10 534,970 1,955,177
Non-current financial assets
Non-current financial assets measured at fair value 12,182 38,570
Non-current financial assets at amortized cost 328,423 582,175
Total non-current financial assets Note 11 340,605 620,745
Deferred tax assets Note 28 299,843 174,923
Total non-current assets 14,893,429 16,880,390
Non-current assets held for sale Note 12 1,433,867 4,969
Inventories Note 13 3,444,993 3,201,357
Current contract assets Note 14 47,751 35,154
Trade and other receivables
Trade receivables 629,045 608,688
Other receivables 90,876 73,181
Current income tax assets 47,213 56,782
Trade and other receivables Note 15 767,134 738,651
Other current financial assets Note 11
Current financial assets measured at fair value 23,644 12,629
Current financial assets at amortized cost 116,588 31,034
Total current financial assets Note 11 140,232 43,663
Other current assets 72,922 81,814
Cash and cash equivalents Note 16 525,567 547,979
Total current assets 6,432,466 4,653,587
Total assets 21,325,895 21,533,977
The accompanying notes form an integral part of the Condensed Consolidated Interim Financial Statements.
Condensed Consolidated Balance Sheet
at 31 December 2023 and 2022
GRIFOLS, S.A. AND SUBSIDIARIES
(Expressed in thousands of Euros) |

| (Free translation from the original Spanish. In the event of discrepancy, the Spanish-language version prevails)
Equity and liabilities Reference 31/12/23 31/12/22
Share capital 119,604 119,604
Share premium 910,728 910,728
Reserves 4,522,142 4,326,436
Treasury stock (152,748) (162,220)
Profit attributable to the Parent 59,315 208,279
Total equity 5,459,041 5,402,827
Cash Flow hedges 998 (438)
Other comprehensive Income (9,117) (8,084)
Other comprehensive income from non-current assets held for sale 1,520 0
Translation differences 413,206 735,633
Other comprehensive expenses 406,607 727,111
Equity attributable to the Parent Note 17 5,865,648 6,129,938
Non-controlling interests Note 19 2,145,319 2,327,606
Total equity 8,010,967 8,457,544
Liabilities
Grants 13,807 15,123
Provisions Note 20 116,925 110,063
Non-current financial liabilities Note 21 9,925,505 9,960,562
Other non-current liabilities 0 15
Deferred tax liabilities Note 28 988,629 1,034,823
Total non-current liabilities 11,044,866 11,120,586
Provisions Note 20 47,806 56,339
Current financial liabilities Note 21 1,017,402 795,686
Trade and other payables
Suppliers 781,456 731,918
Other payables 133,181 114,730
Current income tax liabilities 14,523 15,687
Total trade and other payables Note 22 929,160 862,335
Other current liabilities Note 23 275,694 241,487
Total current liabilities 2,270,062 1,955,847
Total liabilities 13,314,928 13,076,433
Total equity and liabilities 21,325,895 21,533,977
The accompanying notes form an integral part of the Condensed Consolidated Interim Financial Statements.
at 31 December 2023 and 2022
(Expressed in thousands of Euros)
GRIFOLS, S.A. AND SUBSIDIARIES
Condensed Consolidated Balance Sheet |
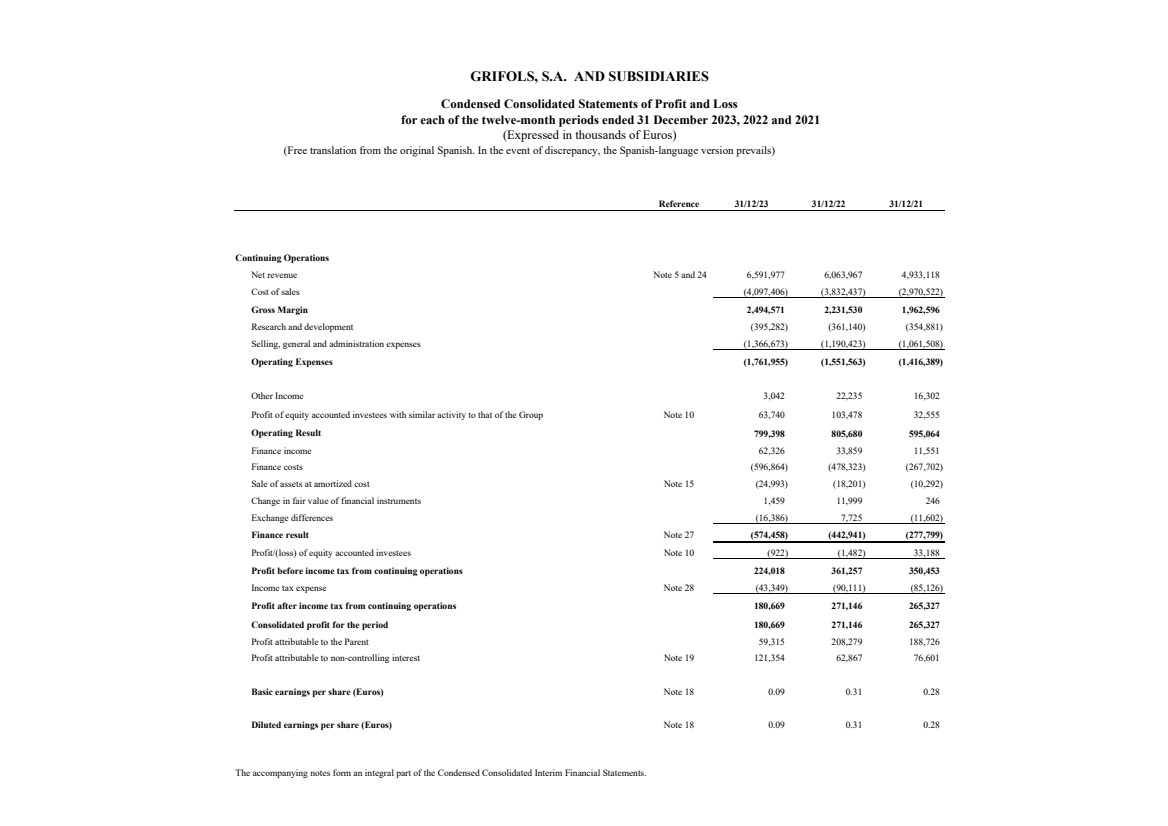
| (Free translation from the original Spanish. In the event of discrepancy, the Spanish-language version prevails)
Reference 31/12/23 31/12/22 31/12/21
Continuing Operations
Net revenue Note 5 and 24 6,591,977 6,063,967 4,933,118
Cost of sales (4,097,406) (3,832,437) (2,970,522)
Gross Margin 2,494,571 2,231,530 1,962,596
Research and development (395,282) (361,140) (354,881)
Selling, general and administration expenses (1,366,673) (1,190,423) (1,061,508)
Operating Expenses (1,761,955) (1,551,563) (1,416,389)
Other Income 3,042 22,235 16,302
Profit of equity accounted investees with similar activity to that of the Group Note 10 63,740 103,478 32,555
Operating Result 799,398 805,680 595,064
Finance income 62,326 33,859 11,551
Finance costs (596,864) (478,323) (267,702)
Sale of assets at amortized cost Note 15 (24,993) (18,201) (10,292)
Change in fair value of financial instruments 1,459 11,999 246
Exchange differences (16,386) 7,725 (11,602)
Finance result Note 27 (574,458) (442,941) (277,799)
Profit/(loss) of equity accounted investees Note 10 (922) (1,482) 33,188
Profit before income tax from continuing operations 224,018 361,257 350,453
Income tax expense Note 28 (43,349) (90,111) (85,126)
Profit after income tax from continuing operations 180,669 271,146 265,327
Consolidated profit for the period 180,669 271,146 265,327
Profit attributable to the Parent 59,315 208,279 188,726
Profit attributable to non-controlling interest Note 19 121,354 62,867 76,601
Basic earnings per share (Euros) Note 18 0.09 0.31 0.28
Diluted earnings per share (Euros) Note 18 0.09 0.31 0.28
The accompanying notes form an integral part of the Condensed Consolidated Interim Financial Statements.
GRIFOLS, S.A. AND SUBSIDIARIES
Condensed Consolidated Statements of Profit and Loss
(Expressed in thousands of Euros)
for each of the twelve-month periods ended 31 December 2023, 2022 and 2021 |
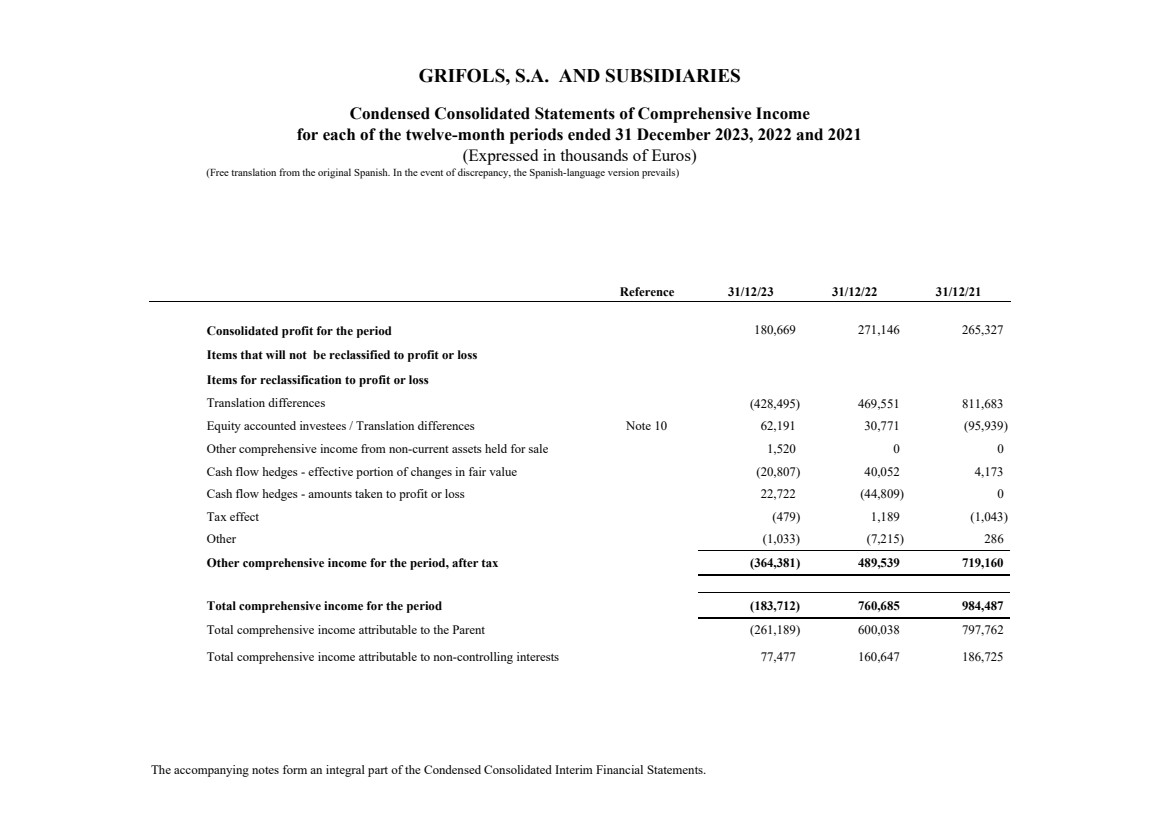
| (Free translation from the original Spanish. In the event of discrepancy, the Spanish-language version prevails)
Reference 31/12/23 31/12/22 31/12/21
Consolidated profit for the period 180,669 271,146 265,327
Items that will not be reclassified to profit or loss
Items for reclassification to profit or loss
(428,495) 469,551 811,683
Note 10 62,191 30,771 (95,939)
Other comprehensive income from non-current assets held for sale 1,520 0 0
Cash flow hedges - effective portion of changes in fair value (20,807) 40,052 4,173
Cash flow hedges - amounts taken to profit or loss 22,722 (44,809) 0
Tax effect (479) 1,189 (1,043)
(1,033) (7,215) 286
Other comprehensive income for the period, after tax (364,381) 489,539 719,160
Total comprehensive income for the period (183,712) 760,685 984,487
Total comprehensive income attributable to the Parent (261,189) 600,038 797,762
77,477 160,647 186,725
The accompanying notes form an integral part of the Condensed Consolidated Interim Financial Statements.
Total comprehensive income attributable to non-controlling interests
Equity accounted investees / Translation differences
Other
GRIFOLS, S.A. AND SUBSIDIARIES
Condensed Consolidated Statements of Comprehensive Income
for each of the twelve-month periods ended 31 December 2023, 2022 and 2021
(Expressed in thousands of Euros)
Translation differences |
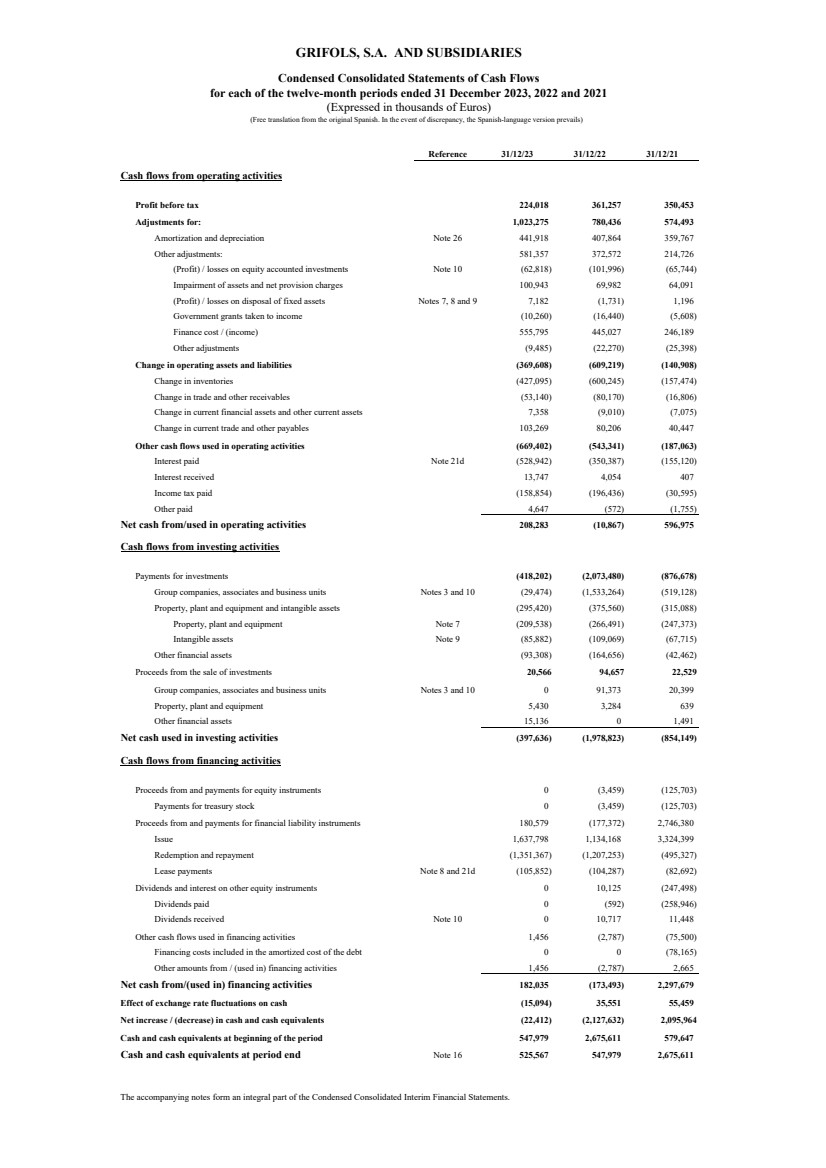
| Reference 31/12/23 31/12/22 31/12/21
Cash flows from operating activities
Profit before tax 224,018 361,257 350,453
Adjustments for: 1,023,275 780,436 574,493
Amortization and depreciation Note 26 441,918 407,864 359,767
Other adjustments: 581,357 372,572 214,726
(Profit) / losses on equity accounted investments Note 10 (62,818) (101,996) (65,744)
Impairment of assets and net provision charges 100,943 69,982 64,091
(Profit) / losses on disposal of fixed assets Notes 7, 8 and 9 7,182 (1,731) 1,196
Government grants taken to income (10,260) (16,440) (5,608)
Finance cost / (income) 555,795 445,027 246,189
Other adjustments (9,485) (22,270) (25,398)
Change in operating assets and liabilities (369,608) (609,219) (140,908)
Change in inventories (427,095) (600,245) (157,474)
Change in trade and other receivables (53,140) (80,170) (16,806)
Change in current financial assets and other current assets 7,358 (9,010) (7,075)
Change in current trade and other payables 103,269 80,206 40,447
Other cash flows used in operating activities (669,402) (543,341) (187,063)
Interest paid Note 21d (528,942) (350,387) (155,120)
Interest received 13,747 4,054 407
Income tax paid (158,854) (196,436) (30,595)
Other paid 4,647 (572) (1,755)
Net cash from/used in operating activities 208,283 (10,867) 596,975
Cash flows from investing activities
Payments for investments (418,202) (2,073,480) (876,678)
Group companies, associates and business units Notes 3 and 10 (29,474) (1,533,264) (519,128)
Property, plant and equipment and intangible assets (295,420) (375,560) (315,088)
Property, plant and equipment Note 7 (209,538) (266,491) (247,373)
Intangible assets Note 9 (85,882) (109,069) (67,715)
Other financial assets (93,308) (164,656) (42,462)
Proceeds from the sale of investments 20,566 94,657 22,529
Group companies, associates and business units Notes 3 and 10 0 91,373 20,399
Property, plant and equipment 5,430 3,284 639
Other financial assets 15,136 0 1,491
Net cash used in investing activities (397,636) (1,978,823) (854,149)
Cash flows from financing activities
Proceeds from and payments for equity instruments 0 (3,459) (125,703)
Payments for treasury stock 0 (3,459) (125,703)
Proceeds from and payments for financial liability instruments 180,579 (177,372) 2,746,380
Issue 1,637,798 1,134,168 3,324,399
Redemption and repayment (1,351,367) (1,207,253) (495,327)
Lease payments Note 8 and 21d (105,852) (104,287) (82,692)
Dividends and interest on other equity instruments 0 10,125 (247,498)
Dividends paid 0 (592) (258,946)
Dividends received Note 10 0 10,717 11,448
Other cash flows used in financing activities 1,456 (2,787) (75,500)
0 0 (78,165)
Other amounts from / (used in) financing activities 1,456 (2,787) 2,665
Net cash from/(used in) financing activities 182,035 (173,493) 2,297,679
Effect of exchange rate fluctuations on cash (15,094) 35,551 55,459
Net increase / (decrease) in cash and cash equivalents (22,412) (2,127,632) 2,095,964
Cash and cash equivalents at beginning of the period 547,979 2,675,611 579,647
Cash and cash equivalents at period end Note 16 525,567 547,979 2,675,611
The accompanying notes form an integral part of the Condensed Consolidated Interim Financial Statements.
Financing costs included in the amortized cost of the debt
GRIFOLS, S.A. AND SUBSIDIARIES
Condensed Consolidated Statements of Cash Flows
for each of the twelve-month periods ended 31 December 2023, 2022 and 2021
(Expressed in thousands of Euros)
(Free translation from the original Spanish. In the event of discrepancy, the Spanish-language version prevails) |
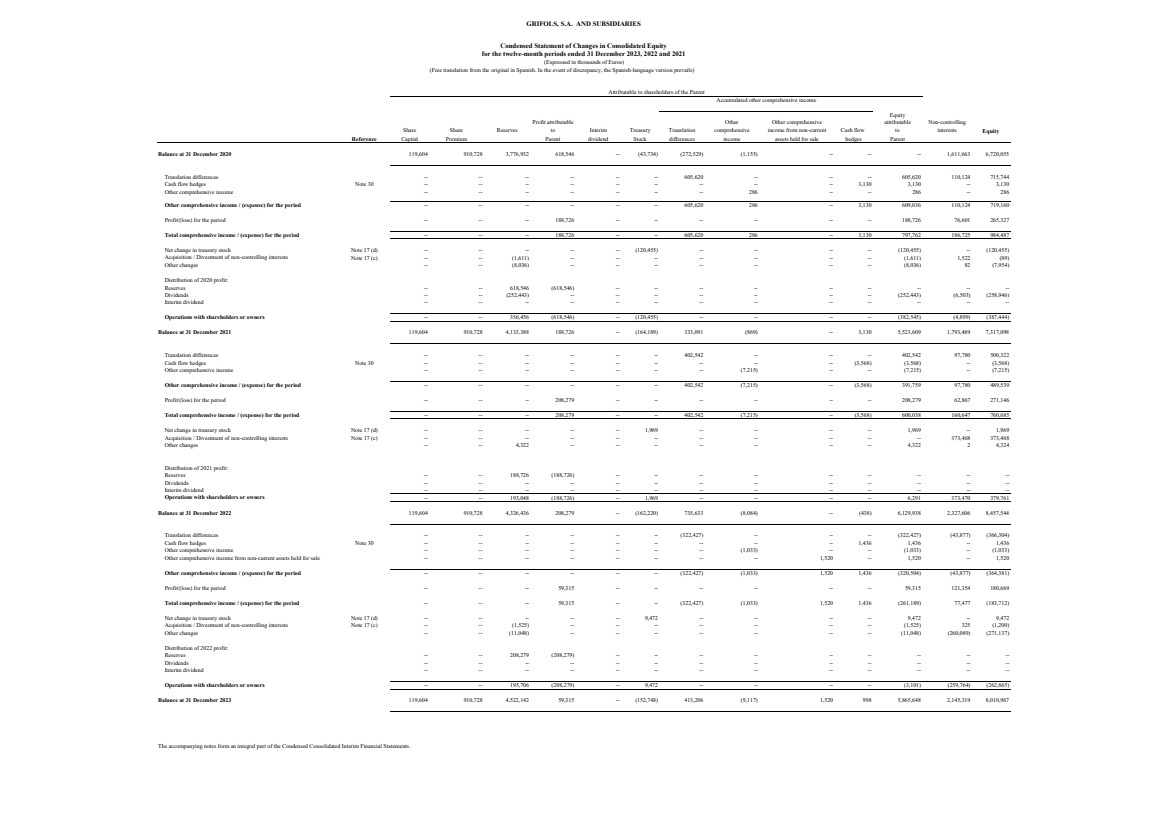
| (Free translation from the original in Spanish. In the event of discrepancy, the Spanish-language version prevails)
Equity
Profit attributable Other Other comprehensive attributable Non-controlling
Share Share Reserves to Interim Treasury Translation comprehensive income from non-current Cash flow to interests Equity
Reference Capital Premium Parent dividend Stock differences income assets held for sale hedges Parent
Balance at 31 December 2020 119,604 910,728 3,776,932 618,546 -- (43,734) (272,529) (1,155) -- -- -- 1,611,663 6,720,055
Translation differences -- -- -- -- -- -- 605,620 -- -- -- 605,620 110,124 715,744
Cash flow hedges Note 30 -- -- -- -- -- -- -- -- -- 3,130 3,130 -- 3,130
Other comprehensive income -- -- -- -- -- -- -- 286 -- -- 286 -- 286
Other comprehensive income / (expense) for the period -- -- -- -- -- -- 605,620 286 -- 3,130 609,036 110,124 719,160
Profit/(loss) for the period -- -- -- 188,726 -- -- -- -- -- -- 188,726 76,601 265,327
Total comprehensive income / (expense) for the period -- -- -- 188,726 -- -- 605,620 286 -- 3,130 797,762 186,725 984,487
Net change in treasury stock Note 17 (d) -- -- -- -- -- (120,455) -- -- -- -- (120,455) -- (120,455)
Acquisition / Divestment of non-controlling interests Note 17 (c) -- -- (1,611) -- -- -- -- -- -- -- (1,611) 1,522 (89)
Other changes -- -- (8,036) -- -- -- -- -- -- -- (8,036) 82 (7,954)
Distribution of 2020 profit:
Reserves -- -- 618,546 (618,546) -- -- -- -- -- -- -- -- --
Dividends -- -- (252,443) -- -- -- -- -- -- -- (252,443) (6,503) (258,946)
Interim dividend -- -- -- -- -- -- -- -- -- -- -- -- --
Operations with shareholders or owners -- -- 356,456 (618,546) -- (120,455) -- -- -- -- (382,545) (4,899) (387,444)
Balance at 31 December 2021 119,604 910,728 4,133,388 188,726 -- (164,189) 333,091 (869) -- 3,130 5,523,609 1,793,489 7,317,098
Translation differences -- -- -- -- -- -- 402,542 -- -- -- 402,542 97,780 500,322
Cash flow hedges Note 30 -- -- -- -- -- -- -- -- -- (3,568) (3,568) -- (3,568)
Other comprehensive income -- -- -- -- -- -- -- (7,215) -- -- (7,215) -- (7,215)
Other comprehensive income / (expense) for the period -- -- -- -- -- -- 402,542 (7,215) -- (3,568) 391,759 97,780 489,539
Profit/(loss) for the period -- -- -- 208,279 -- -- -- -- -- -- 208,279 62,867 271,146
Total comprehensive income / (expense) for the period -- -- -- 208,279 -- -- 402,542 (7,215) -- (3,568) 600,038 160,647 760,685
Net change in treasury stock Note 17 (d) -- -- -- -- -- 1,969 -- -- -- -- 1,969 -- 1,969
Acquisition / Divestment of non-controlling interests Note 17 (c) -- -- -- -- -- -- -- -- -- -- -- 373,468 373,468
Other changes -- -- 4,322 -- -- -- -- -- -- -- 4,322 2 4,324
Distribution of 2021 profit:
Reserves -- -- 188,726 (188,726) -- -- -- -- -- -- -- -- --
Dividends -- -- -- -- -- -- -- -- -- -- -- -- --
Interim dividend -- -- -- -- -- -- -- -- -- -- -- -- --
Operations with shareholders or owners -- -- 193,048 (188,726) -- 1,969 -- -- -- -- 6,291 373,470 379,761
Balance at 31 December 2022 119,604 910,728 4,326,436 208,279 -- (162,220) 735,633 (8,084) -- (438) 6,129,938 2,327,606 8,457,544
Translation differences -- -- -- -- -- -- (322,427) -- -- -- (322,427) (43,877) (366,304)
Cash flow hedges Note 30 -- -- -- -- -- -- -- -- -- 1,436 1,436 -- 1,436
Other comprehensive income -- -- -- -- -- -- -- (1,033) -- -- (1,033) -- (1,033)
Other comprehensive income from non-current assets held for sale -- -- -- -- -- -- -- -- 1,520 -- 1,520 -- 1,520
Other comprehensive income / (expense) for the period -- -- -- -- -- -- (322,427) (1,033) 1,520 1,436 (320,504) (43,877) (364,381)
Profit/(loss) for the period -- -- -- 59,315 -- -- -- -- -- -- 59,315 121,354 180,669
Total comprehensive income / (expense) for the period -- -- -- 59,315 -- -- (322,427) (1,033) 1,520 1,436 (261,189) 77,477 (183,712)
Net change in treasury stock Note 17 (d) -- -- -- -- -- 9,472 -- -- -- -- 9,472 -- 9,472
Acquisition / Divestment of non-controlling interests Note 17 (c) -- -- (1,525) -- -- -- -- -- -- -- (1,525) 325 (1,200)
Other changes -- -- (11,048) -- -- -- -- -- -- -- (11,048) (260,089) (271,137)
Distribution of 2022 profit:
Reserves -- -- 208,279 (208,279) -- -- -- -- -- -- -- -- --
Dividends -- -- -- -- -- -- -- -- -- -- -- -- --
Interim dividend -- -- -- -- -- -- -- -- -- -- -- -- --
Operations with shareholders or owners -- -- 195,706 (208,279) -- 9,472 -- -- -- -- (3,101) (259,764) (262,865)
Balance at 31 December 2023 119,604 910,728 4,522,142 59,315 -- (152,748) 413,206 (9,117) 1,520 998 5,865,648 2,145,319 8,010,967
The accompanying notes form an integral part of the Condensed Consolidated Interim Financial Statements.
Condensed Statement of Changes in Consolidated Equity
GRIFOLS, S.A. AND SUBSIDIARIES
Accumulated other comprehensive income
(Expressed in thousands of Euros)
for the twelve-month periods ended 31 December 2023, 2022 and 2021
Attributable to shareholders of the Parent |
| GRIFOLS, S.A. AND SUBSIDIARIES
Notes to the Condensed Consolidated Interim Financial Statements for the
twelve-month period ended 31 December 2023
(in thousand Euros)
(Free translation from the original in Spanish. In the event of discrepancy, the Spanish-language version prevails)
1
(1) Nature, Principal Activities and Subsidiaries
Grifols, S.A. (hereinafter the Company) was incorporated with limited liability under Spanish law on 22 June 1987.
Its registered and tax offices are in Jesús i Maria, 6, 08022, Barcelona. The Company's statutory activity consists of
providing corporate and business administrative, management and control services, as well as investing in assets and
property. Its principal activity involves rendering administrative, management and control services to its subsidiaries.
On 17 May 2006 the Company completed its flotation on the Spanish securities market, which was conducted through
the public offering of 71,000,000 ordinary shares of Euros 0.50 par value each and a share premium of Euros 3.90
per share. The total capital increase (including the share premium) amounted to Euros 312.4 million, equivalent to a
price of Euros 4.40 per share.
The Company’s shares were floated on the Spanish stock exchange IBEX-35 index on 2 January 2008.
All of the Company’s shares are listed on the Barcelona, Madrid, Valencia and Bilbao securities markets and on the
Spanish Automated Quotation System (SIBE/Continuous Market). On 2 June 2011, Class B non-voting shares
(ADRs) were listed on the NASDAQ (USA) and on the Spanish Automated Quotation System (SIBE/Continuous
Market).
Grifols, S.A. is the Parent of the subsidiaries listed in Appendix I of this note to the condensed consolidated interim
financial statements.
Grifols, S.A. and subsidiaries (hereinafter the Group) act on an integrated basis and under common management and
their principal activity is the procurement, manufacture, preparation and sale of therapeutic products, especially
hemoderivatives.
The main factory locations of the Group’s Spanish companies are in Parets del Vallés (Barcelona) and Torres de
Cotilla (Murcia), while the US companies are located in Los Angeles (California), Clayton (North Carolina),
Emeryville (California), and San Diego (California).
(2) Basis of Presentation
The condensed consolidated interim financial statements for the twelve-month period ended 31 December 2023 have
been prepared on the basis of the accounting records of Grifols, S.A. and of the Group companies. The condensed
consolidated interim financial statements have been prepared under International Financial Reporting Standards as
adopted by the European Union (IFRS-EU) and, in particular in accordance with IAS 34 Interim Financial Statements
which for Grifols Group purposes, are identical to the standards as issued by the International Accounting Standard
Board (IFRS-IASB) to present fairly the consolidated equity and consolidated financial position of Grifols, S.A. and
subsidiaries at 31 December 2023, as well as the consolidated results from their operations, consolidated cash flows
and consolidated changes in equity for the twelve-month period ended 31 December 2023.
These condensed consolidated interim financial statements have been formulated by the Board of Directors at its
meeting held on 28 February 2024.
The condensed consolidated interim financial statements are presented in thousands of Euros, which is the functional
and presentation currency of the Parent.
These condensed consolidated interim financial statements for the twelve-month period ended 31 December 2023
show comparative figures for 2022 and voluntarily show figures for 2021 from the consolidated statement of profit
and loss, consolidated statement of comprehensive income, consolidated statement of changes in equity and
consolidated statement of cash flows and their corresponding notes thereto. For the purposes of comparing the
consolidated statement of profit and loss for the twelve-month periods ended 31 December 2023, 2022 and 2021 and |
| GRIFOLS, S.A. AND SUBSIDIARIES
Notes to the Condensed Consolidated Interim Financial Statements for the
twelve-month period ended 31 December 2023
(in thousand Euros)
(Free translation from the original in Spanish. In the event of discrepancy, the Spanish-language version prevails)
2
the consolidated balance sheet for 2023 and 2022, the effects of the application new standards described in note 2
must be taken into account.
The Group adopted IFRS-EU for the first time on 1 January 2004 and has been preparing its condensed consolidated
interim financial statements under International Financial Reporting Standards, as adopted by the European Union
(IFRS-EU) as required by Spanish capital market regulations governing the presentation of financial statements by
companies whose debt or own equity instruments are listed on a regulated market.
In accordance with the provision of section 357 of the Irish Companies Act 2014, the Company has irrevocably
guaranteed all liabilities of an Irish subsidiary undertaking, Grifols Worldwide Operations Limited (Ireland) (see
Appendix I), for the twelve-month period ended 31 December 2023 as referred to in subsection 1(b) of that Act, for
the purposes of enabling Grifols Worldwide Operations Limited to claim exemption from the requirement to file their
own financial statements in Ireland.
(a) Relevant accounting estimates, assumptions and judgments used when applying accounting principles
The preparation of the condensed consolidated interim financial statements in conformity with IFRS-EU requires
management to make judgments, estimates and assumptions that affect the application of Group accounting
policies. The following notes include a summary of the relevant accounting estimates and judgments used to
apply accounting policies which have the most significant effect on the amounts recognized in the condensed
consolidated interim financial statements.
• Determination of the fair value of assets, liabilities and contingent liabilities in relation to business
combinations. The fair value methods used by the Group are detailed in note 3. During the twelve-month
period ended 31 December 2023, there were no significant business combinations.
• Assumptions used to test non-current assets and goodwill for impairment. Relevant cash generating units
are tested annually for impairment. These are based on risk-adjusted future cash flows discounted using
appropriate interest rates. The key assumptions used are specified in note 6. Assumptions relating to risk-adjusted future cash flows and discount rates are based on business forecasts and are therefore inherently
subjective. Future events could cause a change in business forecasts, with a consequent adverse effect on
the future results of the Group. To the extent considered a reasonably possible change in key assumptions
could result in an impairment of goodwill, a sensitivity analysis has been disclosed to show the effect of
changes to these assumptions and the effect of the cash generating unit (CGU) on the recoverable amount.
• Evaluation of the capitalization of development costs (see note 4(d)). The key assumption is related to the
estimation of sufficient future economic benefits of the projects.
• The calculation of the income tax expense requires tax legislation interpretations in the jurisdictions where
Grifols operates. The decision as to whether the tax authority will accept a given uncertain tax treatment
and the expected outcome of outstanding litigation requires significant estimates and judgements. Likewise,
Grifols recognizes deferred tax assets, mainly from tax credits and rights to deduct to the extent that it is
probable that sufficient taxable income will be available against which temporary differences can be
utilized, based on management assumptions regarding amount and payments of future taxable profits (see
notes 4(q) and 28).
• Determination of chargebacks made to certain customers in the United States (see note 4 (p)).
• The assumptions used for the calculation of the fair value of financial instruments (see notes 3, 29 and 31).
Evaluation of whether Grifols controls a subsidiary or not, analyzing factors such as rights derived from
contractual agreements, as well as actual and potential voting rights, considering for these purposes the
potential voting rights held by Grifols exercisable at the closing date. |
| GRIFOLS, S.A. AND SUBSIDIARIES
Notes to the Condensed Consolidated Interim Financial Statements for the
twelve-month period ended 31 December 2023
(in thousand Euros)
(Free translation from the original in Spanish. In the event of discrepancy, the Spanish-language version prevails)
3
No changes have been made to prior year judgments relating to existing uncertainties.
The Group is also exposed to interest rate and currency risks. Refer to sensitivity analysis in note 30.
(b) Basis of consolidation
Appendix I shows details of the percentages of direct or indirect ownership of subsidiaries by the Company at
31 December 2023, 2022 and 2021, as well as the consolidation method used in each case for preparation of the
accompanying condensed consolidated interim financial statements.
Subsidiaries in which the Company directly or indirectly owns the majority of equity or voting rights have been
fully consolidated. Associates in which the Company owns between 20% and 50% of share capital and over
which it has no control but does have significant influence, have been accounted for under the equity method.
Although the Group holds 49% of the shares with voting rights of Grifols Malaysia Sdn Bhd, it controls the
majority of the economic and voting rights of Grifols Malaysia Sdn Bhd through a contract with the other
shareholder and a pledge on its shares. As a consequence, it has been fully consolidated.
On the other hand,, although the Group holds the 75% of the share capital of Biotek America LLC (“ITK JV”),
a company created as a result of a collaboration with Immunotek GH, LLC (Immunotek) with the aim of building
and managing 28 plasma donor centers (see note 11), it has been accounted for under the equity method based
on the judgements exposed in note 11.
The entities Haema AG, BPC Plasma, Inc. and Haema Plasma Kft., of which Grifols does not hold shares, but
there exists control over them (see notes 3(d) and 19), have been fully consolidated.
Grifols (Thailand) Ltd. has two classes of shares and it grants the majority of voting rights to the class of shares
held by the Group. As a consequence, it has been fully consolidated.
Changes in associates and jointly controlled entities are detailed in note 10.
Changes in subsidiaries
In 2023:
• Grifols Escrow Issuer, S.A. and Gripdan Invest, S.L.
With effect as of 1 January 2023, Grifols Escrow Issuer, S.A., Gripdan Invest, S.L and Grifols, S.A. entered into
a merger agreement, with Grifols, S.A. being the surviving company.
This operation has had no impact on these condensed consolidated interim financial statements.
• Access Biologicals LLC. and Chiquito Acquisition Corp.
With effect as of 1 April 2023, Access Biologicals, L.L.C, Chiquito Acquisition Corp. and Grifols Bio Supplies,
Inc. (formerly Interstate Blood Bank, Inc. (IBBI)) entered into a merger agreement, with Grifols Bio Supplies,
Inc. being the surviving company.
This operation has had no impact on these condensed consolidated interim financial statements. |
| GRIFOLS, S.A. AND SUBSIDIARIES
Notes to the Condensed Consolidated Interim Financial Statements for the
twelve-month period ended 31 December 2023
(in thousand Euros)
(Free translation from the original in Spanish. In the event of discrepancy, the Spanish-language version prevails)
4
• Goetech LLC
On 30 June 2023, the company Geotech LLC (D/B/A Medkeeper) has been dissolved.
This operation has had no impact on these condensed consolidated interim financial statements.
..
• AlbaJuna Therapeutics, S.L.
On 9 October 2023, Grifols, through its wholly owned subsidiary Grifols Innovation and New Technologies
Limited, Inc., reached an agreement to acquire the remaining 51% of shares of AlbaJuna Therapeutics, S.L. for
a total amount of 1 Euro (see note 3 (b)).
• Biotest (U.K.), Ltd.
On 1
st June 2023, Grifols U.K., Ltd. reached an agreement with Biotest AG to acquire the total shares of Biotest
(U.K. Ltd.) for a total amount of Euros 20,079 thousand. With effect 1st November 2023, Biotest (U.K., Ltd.)
has transferred its net assets to Grifols U.K., resulting in an amalgamation.
The following companies were formed during 2023 and became part of the Grifols Group consolidated:
• Biomat Holdings, LLC
• Canada, Inc. (subsequently changed its name to Grifols Plasma Canada - Ontario Inc.)
In 2022:
• Albimmune, S.L.
On 13 January 2022, Grifols, through its wholly owned subsidiary Grifols Innovation and New Technologies
Limited, Inc., reached an agreement to acquire 51% of the shares of Albimmune, S.L. for a total amount of Euros
3,000.
• VCN Biosciences, S.L.
On 10 March 2022, Grifols, together with the other shareholders, reached an agreement to sell one hundred
percent of the issued and outstanding shares of VCN Bioscience, S.L. for US Dollars 7,700 thousand.
As a result of this divestment, the Group has recognized income of Euros 7,557 thousand in the statement of
profit and loss.
• Biomat USA, Inc.
Effective 1 April 2022, Biomat USA Inc. and Talecris Plasma Resources, Inc. entered into a merger agreement,
and the resulting company was Biomat USA, Inc.
• Biotest AG and Grifols Biotest Holdings GmbH
On 25 April 2022, and once all regulatory approvals had been obtained, Grifols completed the acquisition of
70.18% of the share capital of Biotest AG and the entire share capital of Tiancheng (Germany) Pharmaceutical
Holdings AG, whose current corporate name is Grifols Biotest Holdings GmbH, for Euros 1,460,853 thousand
(see note 3). |
| GRIFOLS, S.A. AND SUBSIDIARIES
Notes to the Condensed Consolidated Interim Financial Statements for the
twelve-month period ended 31 December 2023
(in thousand Euros)
(Free translation from the original in Spanish. In the event of discrepancy, the Spanish-language version prevails)
5
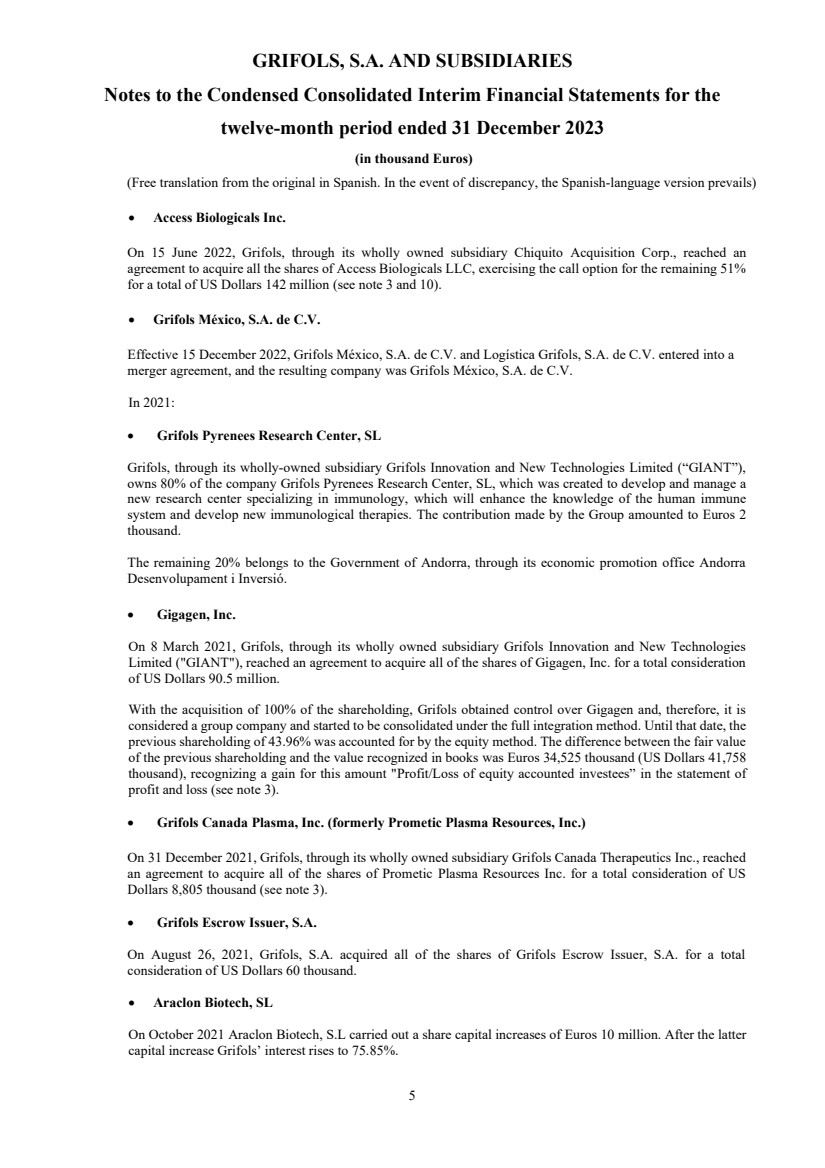
• Access Biologicals Inc.
On 15 June 2022, Grifols, through its wholly owned subsidiary Chiquito Acquisition Corp., reached an
agreement to acquire all the shares of Access Biologicals LLC, exercising the call option for the remaining 51%
for a total of US Dollars 142 million (see note 3 and 10).
• Grifols México, S.A. de C.V.
Effective 15 December 2022, Grifols México, S.A. de C.V. and Logística Grifols, S.A. de C.V. entered into a
merger agreement, and the resulting company was Grifols México, S.A. de C.V.
In 2021:
• Grifols Pyrenees Research Center, SL
Grifols, through its wholly-owned subsidiary Grifols Innovation and New Technologies Limited (“GIANT”),
owns 80% of the company Grifols Pyrenees Research Center, SL, which was created to develop and manage a
new research center specializing in immunology, which will enhance the knowledge of the human immune
system and develop new immunological therapies. The contribution made by the Group amounted to Euros 2
thousand.
The remaining 20% belongs to the Government of Andorra, through its economic promotion office Andorra
Desenvolupament i Inversió.
• Gigagen, Inc.
On 8 March 2021, Grifols, through its wholly owned subsidiary Grifols Innovation and New Technologies
Limited ("GIANT"), reached an agreement to acquire all of the shares of Gigagen, Inc. for a total consideration
of US Dollars 90.5 million.
With the acquisition of 100% of the shareholding, Grifols obtained control over Gigagen and, therefore, it is
considered a group company and started to be consolidated under the full integration method. Until that date, the
previous shareholding of 43.96% was accounted for by the equity method. The difference between the fair value
of the previous shareholding and the value recognized in books was Euros 34,525 thousand (US Dollars 41,758
thousand), recognizing a gain for this amount "Profit/Loss of equity accounted investees” in the statement of
profit and loss (see note 3).
• Grifols Canada Plasma, Inc. (formerly Prometic Plasma Resources, Inc.)
On 31 December 2021, Grifols, through its wholly owned subsidiary Grifols Canada Therapeutics Inc., reached
an agreement to acquire all of the shares of Prometic Plasma Resources Inc. for a total consideration of US
Dollars 8,805 thousand (see note 3).
• Grifols Escrow Issuer, S.A.
On August 26, 2021, Grifols, S.A. acquired all of the shares of Grifols Escrow Issuer, S.A. for a total
consideration of US Dollars 60 thousand.
• Araclon Biotech, SL
On October 2021 Araclon Biotech, S.L carried out a share capital increases of Euros 10 million. After the latter
capital increase Grifols’ interest rises to 75.85%. |

| GRIFOLS, S.A. AND SUBSIDIARIES
Notes to the Condensed Consolidated Interim Financial Statements for the
twelve-month period ended 31 December 2023
(in thousand Euros)
(Free translation from the original in Spanish. In the event of discrepancy, the Spanish-language version prevails)
6
• Haema Plasma Kft.
On 1 February 2021, Scranton Plasma B.V. acquired 100% of the shares of Haema Plasma Kft. (see note 3 (b)).
The following companies were incorporated during 2021 and were included in the consolidated Grifols Group.
• Grifols Middle East&Africa, LLC
• Grifols Bio North America, LLC
• Biomat Holdco, LLC
• Biomat Newco, Corp
(c) Amendments to IFRS in 2023, 2022 and 2021
In accordance with IFRS, the following should be noted in connection with the scope of application of IFRS and
the preparation of these condensed consolidated interim financial statements of the Group.
Effective in 2023
The following standards published by the IASB and the IFRS Interpretations Committee and adopted by the
European Union for application in Europe came into force in 2023 and, therefore, have been taken into account
in the preparation of these condensed consolidated interim financial statements:
Normas EU effective date IASB effective date
IAS 12
Amendments to IAS 12 Income Taxes: Deferred Tax related
to Assets and Liabilities arising from a Single Transaction
(issued on 7 May 2021)
1 January 2023 1 January 2023
IFRS 17 Insurance Contracts (issued on 18 May 2017); including
Amendments to IFRS 17 (issued on 25 June 2020) 1 January 2023 1 January 2023
IAS 8
Amendments to IAS 8 Accounting policies, Changes in
Accounting Estimates and Errors: Definition of Accounting
Estitmates (issued on 12 February 2021)
1 January 2023 1 January 2023
IAS 1
Amendments to IAS 1 Presentation of Financial Statements
and IFRS Practice Statement 2: Disclosure of Accounting
policies (issued on 12 February 2021)
1 January 2023 1 January 2023
IAS 12 Amendments to IAS 12 Income taxes: International Tax
Reform – Pillar Two Model Rules (issued 23 May 2023) 1 January 2023 1 January 2023
IFRS 17
Amendments to IFRS 17 Isurance contracts: Initial
Application of IFRS 17 and IFRS 9 - Comparative
Information (issued on 9 December 2021)
1 January 2023 1 January 2023
Mandatory application for annual periods
The application of these standards and interpretations has had no significant impact on these condensed
consolidated interim financial statements.
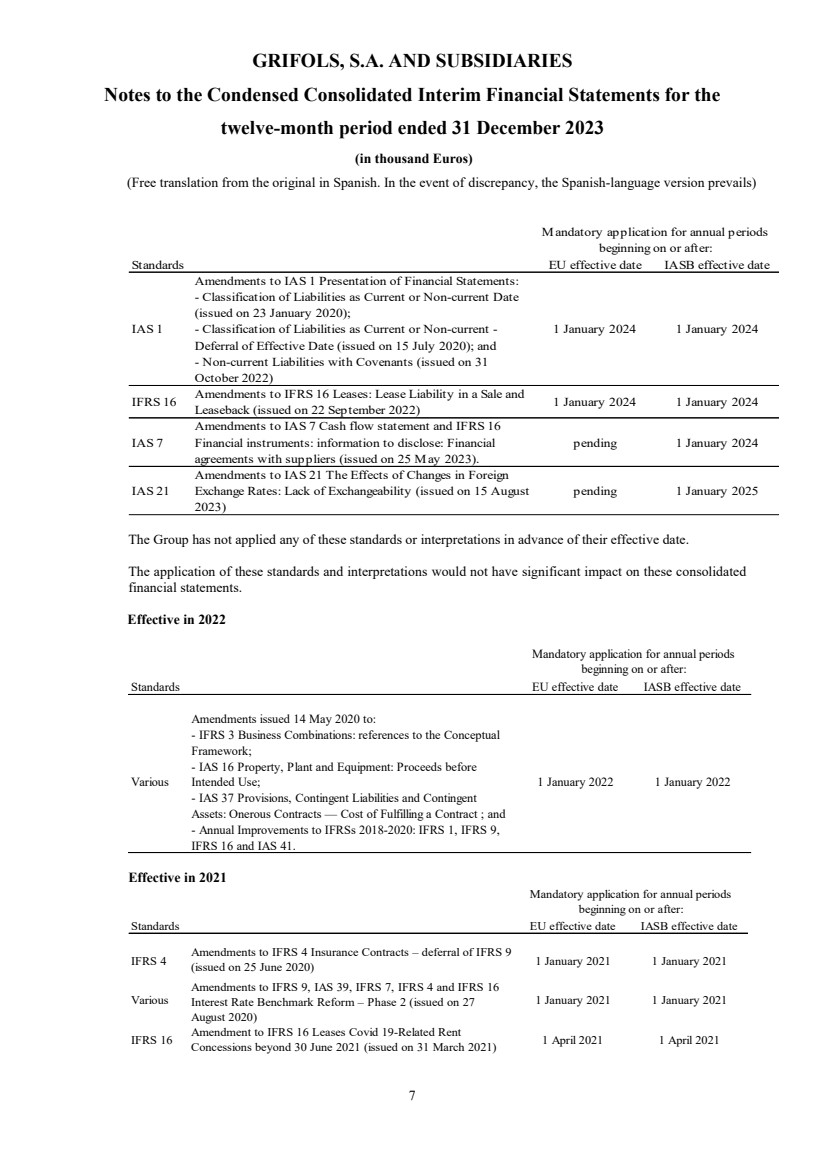
Standards issued but not effective in 2023
At the date these condensed consolidated interim financial statements were authorized for issue, the following
IFRS and amendments have been published by the IASB but their application is not mandatory until the future
periods indicated below: |
| GRIFOLS, S.A. AND SUBSIDIARIES
Notes to the Condensed Consolidated Interim Financial Statements for the
twelve-month period ended 31 December 2023
(in thousand Euros)
(Free translation from the original in Spanish. In the event of discrepancy, the Spanish-language version prevails)
7
Standards EU effective date IASB effective date
IAS 1
Amendments to IAS 1 Presentation of Financial Statements:
- Classification of Liabilities as Current or Non-current Date
(issued on 23 January 2020);
- Classification of Liabilities as Current or Non-current -
Deferral of Effective Date (issued on 15 July 2020); and
- Non-current Liabilities with Covenants (issued on 31
October 2022)
1 January 2024 1 January 2024
IFRS 16 Amendments to IFRS 16 Leases: Lease Liability in a Sale and
Leaseback (issued on 22 September 2022) 1 January 2024 1 January 2024
IAS 7
Amendments to IAS 7 Cash flow statement and IFRS 16
Financial instruments: information to disclose: Financial
agreements with suppliers (issued on 25 May 2023).
pending 1 January 2024
IAS 21
Amendments to IAS 21 The Effects of Changes in Foreign
Exchange Rates: Lack of Exchangeability (issued on 15 August
2023)
pending 1 January 2025
Mandatory application for annual periods
beginning on or after:
The Group has not applied any of these standards or interpretations in advance of their effective date.
The application of these standards and interpretations would not have significant impact on these consolidated
financial statements.
Effective in 2022
Effective in 2021
Standards EU effective date IASB effective date
Various
Amendments issued 14 May 2020 to:
- IFRS 3 Business Combinations: references to the Conceptual
Framework;
- IAS 16 Property, Plant and Equipment: Proceeds before
Intended Use;
- IAS 37 Provisions, Contingent Liabilities and Contingent
Assets: Onerous Contracts — Cost of Fulfilling a Contract ; and
- Annual Improvements to IFRSs 2018-2020: IFRS 1, IFRS 9,
IFRS 16 and IAS 41.
1 January 2022 1 January 2022
Mandatory application for annual periods
beginning on or after:
Standards EU effective date IASB effective date
IFRS 4
Amendments to IFRS 4 Insurance Contracts – deferral of IFRS 9
(issued on 25 June 2020) 1 January 2021 1 January 2021
Various
Amendments to IFRS 9, IAS 39, IFRS 7, IFRS 4 and IFRS 16
Interest Rate Benchmark Reform – Phase 2 (issued on 27
August 2020)
1 January 2021 1 January 2021
IFRS 16 Amendment to IFRS 16 Leases Covid 19-Related Rent
Concessions beyond 30 June 2021 (issued on 31 March 2021) 1 April 2021 1 April 2021
Mandatory application for annual periods
beginning on or after: |
| GRIFOLS, S.A. AND SUBSIDIARIES
Notes to the Condensed Consolidated Interim Financial Statements for the
twelve-month period ended 31 December 2023
(in thousand Euros)
(Free translation from the original in Spanish. In the event of discrepancy, the Spanish-language version prevails)
8
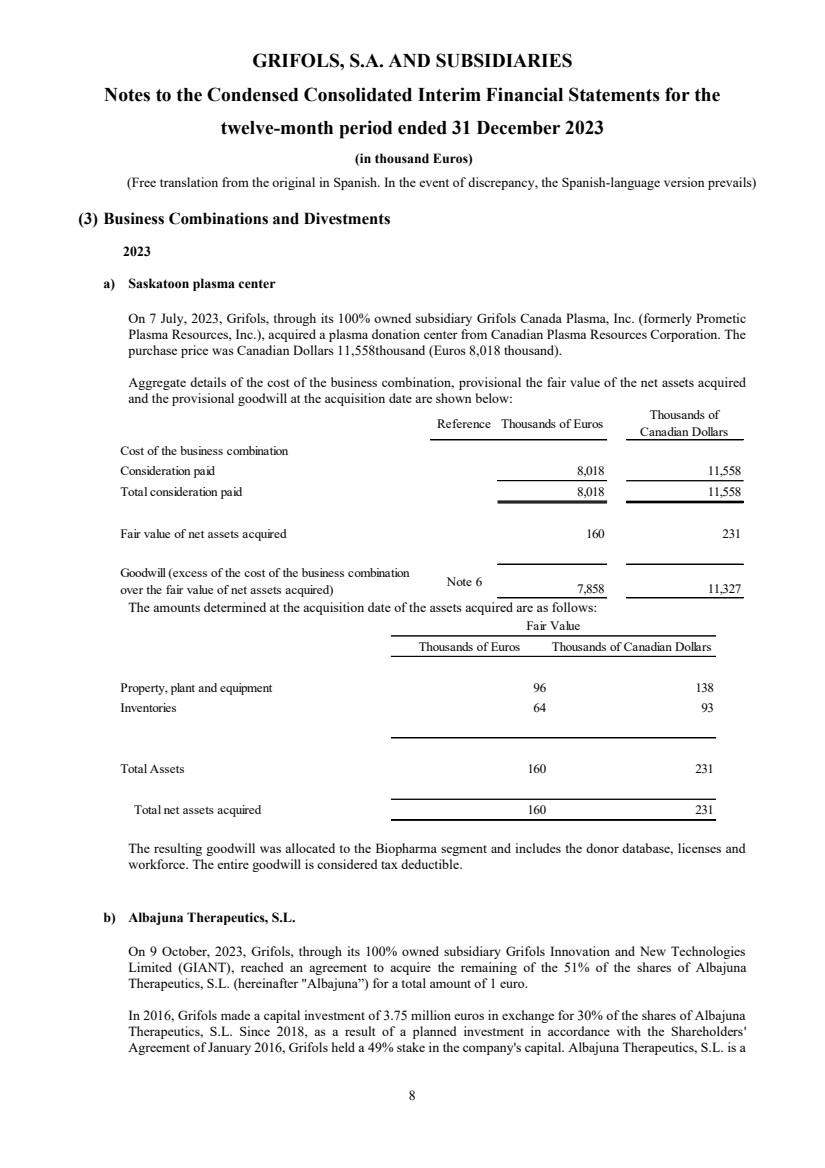
(3) Business Combinations and Divestments
2023
a) Saskatoon plasma center
On 7 July, 2023, Grifols, through its 100% owned subsidiary Grifols Canada Plasma, Inc. (formerly Prometic
Plasma Resources, Inc.), acquired a plasma donation center from Canadian Plasma Resources Corporation. The
purchase price was Canadian Dollars 11,558thousand (Euros 8,018 thousand).
Aggregate details of the cost of the business combination, provisional the fair value of the net assets acquired
and the provisional goodwill at the acquisition date are shown below:
Reference Thousands of Euros Thousands of
Canadian Dollars
Cost of the business combination
Consideration paid 8,018 11,558
Total consideration paid 8,018 11,558
Fair value of net assets acquired 160 231
Goodwill (excess of the cost of the business combination
over the fair value of net assets acquired) Note 6 7,858 11,327
The amounts determined at the acquisition date of the assets acquired are as follows:
Thousands of Euros Thousands of Canadian Dollars
Property, plant and equipment 96 138
Inventories 64 93
Total Assets 160 231
Total net assets acquired 160 231
Fair Value
The resulting goodwill was allocated to the Biopharma segment and includes the donor database, licenses and
workforce. The entire goodwill is considered tax deductible.
b) Albajuna Therapeutics, S.L.
On 9 October, 2023, Grifols, through its 100% owned subsidiary Grifols Innovation and New Technologies
Limited (GIANT), reached an agreement to acquire the remaining of the 51% of the shares of Albajuna
Therapeutics, S.L. (hereinafter "Albajuna”) for a total amount of 1 euro.
In 2016, Grifols made a capital investment of 3.75 million euros in exchange for 30% of the shares of Albajuna
Therapeutics, S.L. Since 2018, as a result of a planned investment in accordance with the Shareholders'
Agreement of January 2016, Grifols held a 49% stake in the company's capital. Albajuna Therapeutics, S.L. is a |
| GRIFOLS, S.A. AND SUBSIDIARIES
Notes to the Condensed Consolidated Interim Financial Statements for the
twelve-month period ended 31 December 2023
(in thousand Euros)
(Free translation from the original in Spanish. In the event of discrepancy, the Spanish-language version prevails)
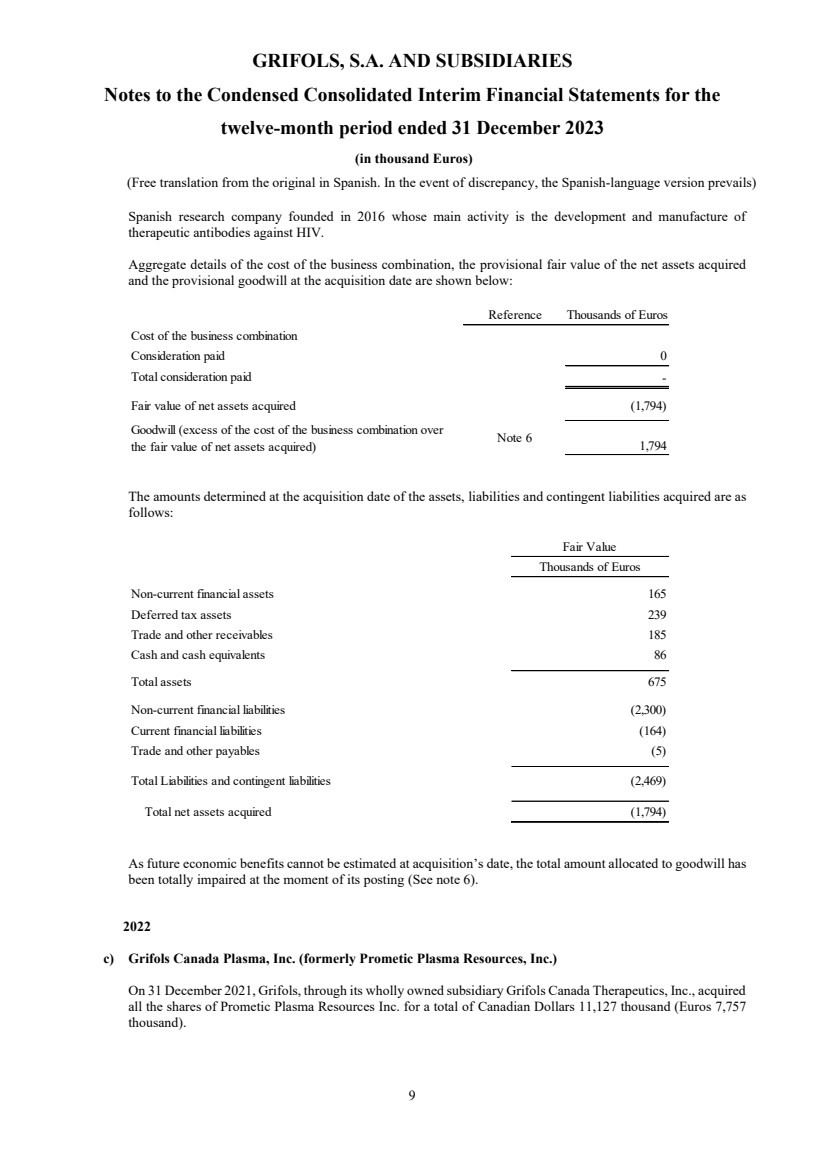
9
Spanish research company founded in 2016 whose main activity is the development and manufacture of
therapeutic antibodies against HIV.
Aggregate details of the cost of the business combination, the provisional fair value of the net assets acquired
and the provisional goodwill at the acquisition date are shown below:
Reference Thousands of Euros
Cost of the business combination
Consideration paid 0
Total consideration paid -
Fair value of net assets acquired (1,794)
Goodwill (excess of the cost of the business combination over
the fair value of net assets acquired) Note 6 1,794
The amounts determined at the acquisition date of the assets, liabilities and contingent liabilities acquired are as
follows:
Fair Value
Thousands of Euros
Non-current financial assets 165
Deferred tax assets 239
Trade and other receivables 185
Cash and cash equivalents 86
Total assets 675
Non-current financial liabilities (2,300)
Current financial liabilities (164)
Trade and other payables (5)
Total Liabilities and contingent liabilities (2,469)
Total net assets acquired (1,794)
As future economic benefits cannot be estimated at acquisition’s date, the total amount allocated to goodwill has
been totally impaired at the moment of its posting (See note 6).
2022
c) Grifols Canada Plasma, Inc. (formerly Prometic Plasma Resources, Inc.)
On 31 December 2021, Grifols, through its wholly owned subsidiary Grifols Canada Therapeutics, Inc., acquired
all the shares of Prometic Plasma Resources Inc. for a total of Canadian Dollars 11,127 thousand (Euros 7,757
thousand). |
| GRIFOLS, S.A. AND SUBSIDIARIES
Notes to the Condensed Consolidated Interim Financial Statements for the
twelve-month period ended 31 December 2023
(in thousand Euros)
(Free translation from the original in Spanish. In the event of discrepancy, the Spanish-language version prevails)
10
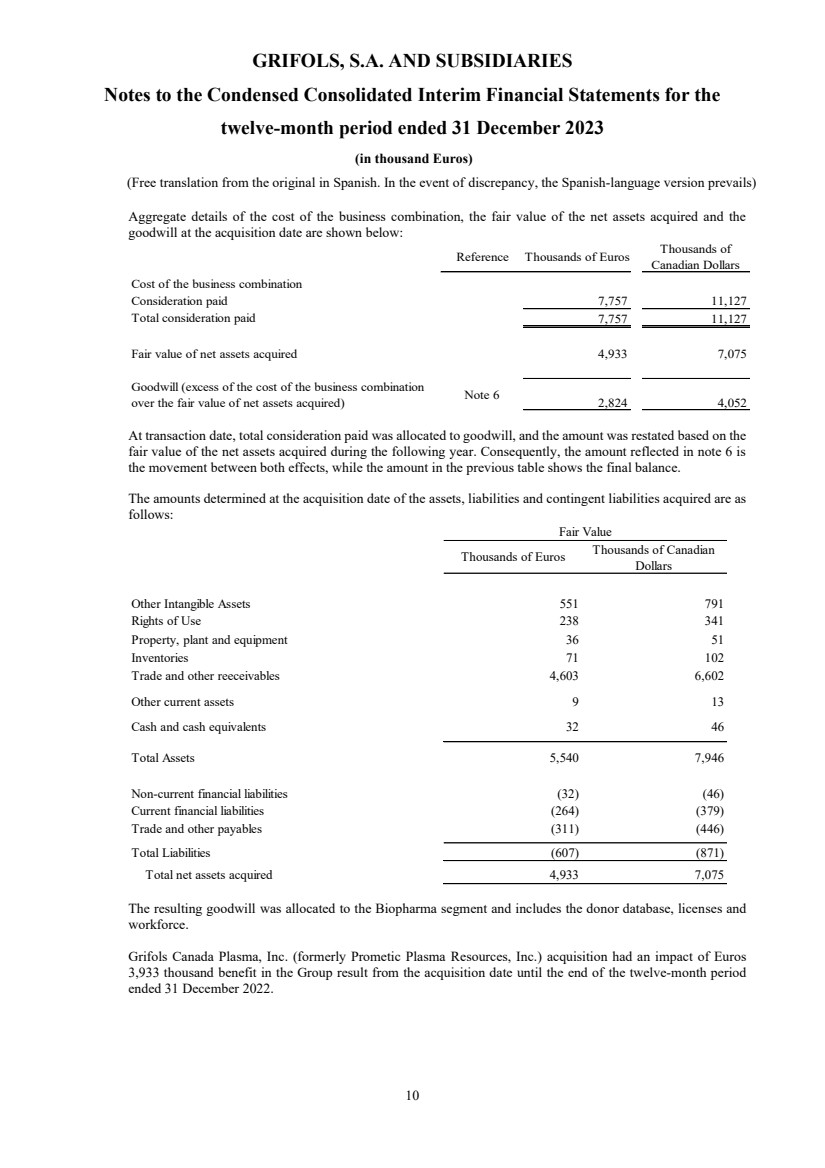
Aggregate details of the cost of the business combination, the fair value of the net assets acquired and the
goodwill at the acquisition date are shown below:
Reference Thousands of Euros Thousands of
Canadian Dollars
Cost of the business combination
Consideration paid 7,757 11,127
Total consideration paid 7,757 11,127
Fair value of net assets acquired 4,933 7,075
Goodwill (excess of the cost of the business combination
over the fair value of net assets acquired) Note 6 2,824 4,052
At transaction date, total consideration paid was allocated to goodwill, and the amount was restated based on the
fair value of the net assets acquired during the following year. Consequently, the amount reflected in note 6 is
the movement between both effects, while the amount in the previous table shows the final balance.
The amounts determined at the acquisition date of the assets, liabilities and contingent liabilities acquired are as
follows:
Thousands of Euros Thousands of Canadian
Dollars
Other Intangible Assets 551 791
Rights of Use 238 341
Property, plant and equipment 36 51
Inventories 71 102
Trade and other reeceivables 4,603 6,602
Other current assets 9 13
Cash and cash equivalents 32 46
Total Assets 5,540 7,946
Non-current financial liabilities (32) (46)
Current financial liabilities (264) (379)
Trade and other payables (311) (446)
Total Liabilities (607) (871)
Total net assets acquired 4,933 7,075
Fair Value
The resulting goodwill was allocated to the Biopharma segment and includes the donor database, licenses and
workforce.
Grifols Canada Plasma, Inc. (formerly Prometic Plasma Resources, Inc.) acquisition had an impact of Euros
3,933 thousand benefit in the Group result from the acquisition date until the end of the twelve-month period
ended 31 December 2022. |
| GRIFOLS, S.A. AND SUBSIDIARIES
Notes to the Condensed Consolidated Interim Financial Statements for the
twelve-month period ended 31 December 2023
(in thousand Euros)
(Free translation from the original in Spanish. In the event of discrepancy, the Spanish-language version prevails)
11
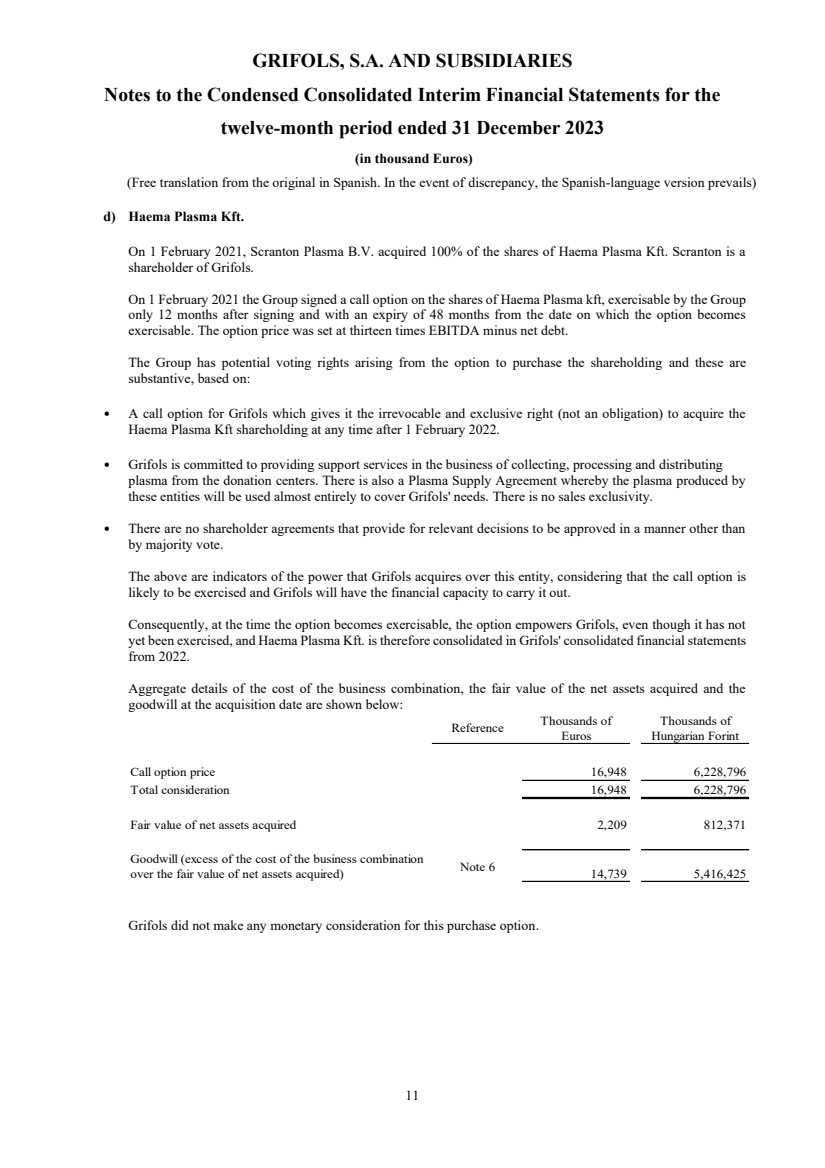
d) Haema Plasma Kft.
On 1 February 2021, Scranton Plasma B.V. acquired 100% of the shares of Haema Plasma Kft. Scranton is a
shareholder of Grifols.
On 1 February 2021 the Group signed a call option on the shares of Haema Plasma kft, exercisable by the Group
only 12 months after signing and with an expiry of 48 months from the date on which the option becomes
exercisable. The option price was set at thirteen times EBITDA minus net debt.
The Group has potential voting rights arising from the option to purchase the shareholding and these are
substantive, based on:
• A call option for Grifols which gives it the irrevocable and exclusive right (not an obligation) to acquire the
Haema Plasma Kft shareholding at any time after 1 February 2022.
• Grifols is committed to providing support services in the business of collecting, processing and distributing
plasma from the donation centers. There is also a Plasma Supply Agreement whereby the plasma produced by
these entities will be used almost entirely to cover Grifols' needs. There is no sales exclusivity.
• There are no shareholder agreements that provide for relevant decisions to be approved in a manner other than
by majority vote.
The above are indicators of the power that Grifols acquires over this entity, considering that the call option is
likely to be exercised and Grifols will have the financial capacity to carry it out.
Consequently, at the time the option becomes exercisable, the option empowers Grifols, even though it has not
yet been exercised, and Haema Plasma Kft. is therefore consolidated in Grifols' consolidated financial statements
from 2022.
Aggregate details of the cost of the business combination, the fair value of the net assets acquired and the
goodwill at the acquisition date are shown below:
Reference Thousands of
Euros
Thousands of
Hungarian Forint
Call option price 16,948 6,228,796
Total consideration 16,948 6,228,796
Fair value of net assets acquired 2,209 812,371
Goodwill (excess of the cost of the business combination
over the fair value of net assets acquired) Note 6 14,739 5,416,425
Grifols did not make any monetary consideration for this purchase option. |
| GRIFOLS, S.A. AND SUBSIDIARIES
Notes to the Condensed Consolidated Interim Financial Statements for the
twelve-month period ended 31 December 2023
(in thousand Euros)
(Free translation from the original in Spanish. In the event of discrepancy, the Spanish-language version prevails)
12
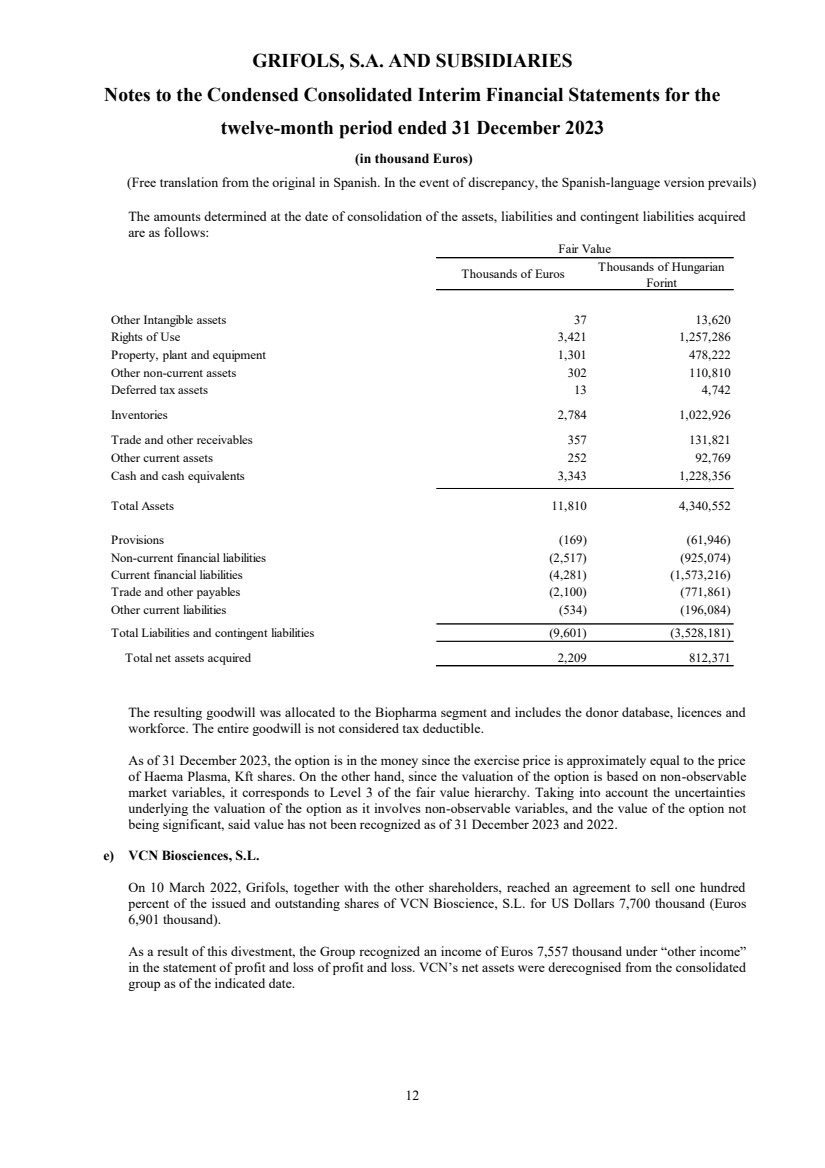
The amounts determined at the date of consolidation of the assets, liabilities and contingent liabilities acquired
are as follows:
Thousands of Euros Thousands of Hungarian
Forint
Other Intangible assets 37 13,620
Rights of Use 3,421 1,257,286
Property, plant and equipment 1,301 478,222
Other non-current assets 302 110,810
Deferred tax assets 13 4,742
Inventories 2,784 1,022,926
Trade and other receivables 357 131,821
Other current assets 252 92,769
Cash and cash equivalents 3,343 1,228,356
Total Assets 11,810 4,340,552
Provisions (169) (61,946)
Non-current financial liabilities (2,517) (925,074)
Current financial liabilities (4,281) (1,573,216)
Trade and other payables (2,100) (771,861)
Other current liabilities (534) (196,084)
Total Liabilities and contingent liabilities (9,601) (3,528,181)
Total net assets acquired 2,209 812,371
Fair Value
The resulting goodwill was allocated to the Biopharma segment and includes the donor database, licences and
workforce. The entire goodwill is not considered tax deductible.
As of 31 December 2023, the option is in the money since the exercise price is approximately equal to the price
of Haema Plasma, Kft shares. On the other hand, since the valuation of the option is based on non-observable
market variables, it corresponds to Level 3 of the fair value hierarchy. Taking into account the uncertainties
underlying the valuation of the option as it involves non-observable variables, and the value of the option not
being significant, said value has not been recognized as of 31 December 2023 and 2022.
e) VCN Biosciences, S.L.
On 10 March 2022, Grifols, together with the other shareholders, reached an agreement to sell one hundred
percent of the issued and outstanding shares of VCN Bioscience, S.L. for US Dollars 7,700 thousand (Euros
6,901 thousand).
As a result of this divestment, the Group recognized an income of Euros 7,557 thousand under “other income”
in the statement of profit and loss of profit and loss. VCN’s net assets were derecognised from the consolidated
group as of the indicated date. |
| GRIFOLS, S.A. AND SUBSIDIARIES
Notes to the Condensed Consolidated Interim Financial Statements for the
twelve-month period ended 31 December 2023
(in thousand Euros)
(Free translation from the original in Spanish. In the event of discrepancy, the Spanish-language version prevails)
13
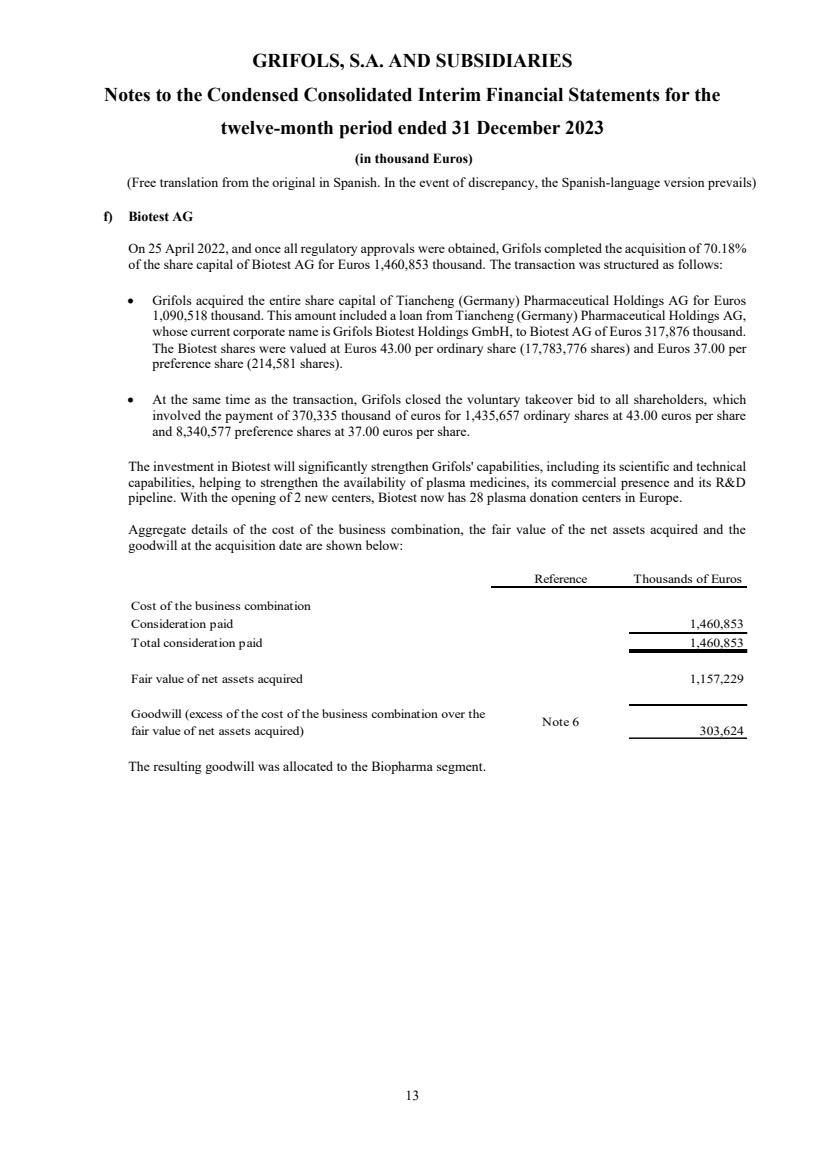
f) Biotest AG
On 25 April 2022, and once all regulatory approvals were obtained, Grifols completed the acquisition of 70.18%
of the share capital of Biotest AG for Euros 1,460,853 thousand. The transaction was structured as follows:
• Grifols acquired the entire share capital of Tiancheng (Germany) Pharmaceutical Holdings AG for Euros
1,090,518 thousand. This amount included a loan from Tiancheng (Germany) Pharmaceutical Holdings AG,
whose current corporate name is Grifols Biotest Holdings GmbH, to Biotest AG of Euros 317,876 thousand.
The Biotest shares were valued at Euros 43.00 per ordinary share (17,783,776 shares) and Euros 37.00 per
preference share (214,581 shares).
• At the same time as the transaction, Grifols closed the voluntary takeover bid to all shareholders, which
involved the payment of 370,335 thousand of euros for 1,435,657 ordinary shares at 43.00 euros per share
and 8,340,577 preference shares at 37.00 euros per share.
The investment in Biotest will significantly strengthen Grifols' capabilities, including its scientific and technical
capabilities, helping to strengthen the availability of plasma medicines, its commercial presence and its R&D
pipeline. With the opening of 2 new centers, Biotest now has 28 plasma donation centers in Europe.
Aggregate details of the cost of the business combination, the fair value of the net assets acquired and the
goodwill at the acquisition date are shown below:
Reference Thousands of Euros
Cost of the business combination
Consideration paid 1,460,853
Total consideration paid 1,460,853
Fair value of net assets acquired 1,157,229
Goodwill (excess of the cost of the business combination over the
fair value of net assets acquired) Note 6 303,624
The resulting goodwill was allocated to the Biopharma segment. |
| GRIFOLS, S.A. AND SUBSIDIARIES
Notes to the Condensed Consolidated Interim Financial Statements for the
twelve-month period ended 31 December 2023
(in thousand Euros)
(Free translation from the original in Spanish. In the event of discrepancy, the Spanish-language version prevails)
14
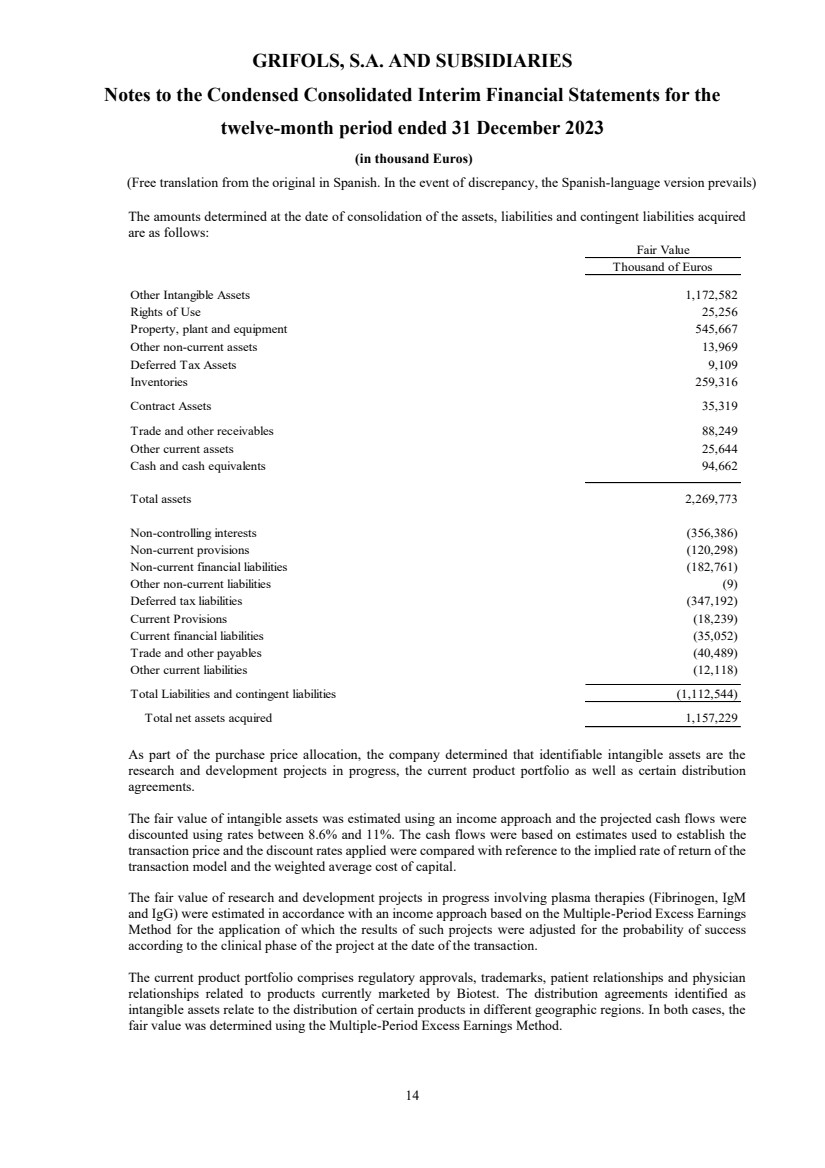
The amounts determined at the date of consolidation of the assets, liabilities and contingent liabilities acquired
are as follows:
Fair Value
Thousand of Euros
Other Intangible Assets 1,172,582
Rights of Use 25,256
Property, plant and equipment 545,667
Other non-current assets 13,969
Deferred Tax Assets 9,109
Inventories 259,316
Contract Assets 35,319
Trade and other receivables 88,249
Other current assets 25,644
Cash and cash equivalents 94,662
Total assets 2,269,773
Non-controlling interests (356,386)
Non-current provisions (120,298)
Non-current financial liabilities (182,761)
Other non-current liabilities (9)
Deferred tax liabilities (347,192)
Current Provisions (18,239)
Current financial liabilities (35,052)
Trade and other payables (40,489)
Other current liabilities (12,118)
Total Liabilities and contingent liabilities (1,112,544)
Total net assets acquired 1,157,229
As part of the purchase price allocation, the company determined that identifiable intangible assets are the
research and development projects in progress, the current product portfolio as well as certain distribution
agreements.
The fair value of intangible assets was estimated using an income approach and the projected cash flows were
discounted using rates between 8.6% and 11%. The cash flows were based on estimates used to establish the
transaction price and the discount rates applied were compared with reference to the implied rate of return of the
transaction model and the weighted average cost of capital.
The fair value of research and development projects in progress involving plasma therapies (Fibrinogen, IgM
and IgG) were estimated in accordance with an income approach based on the Multiple-Period Excess Earnings
Method for the application of which the results of such projects were adjusted for the probability of success
according to the clinical phase of the project at the date of the transaction.
The current product portfolio comprises regulatory approvals, trademarks, patient relationships and physician
relationships related to products currently marketed by Biotest. The distribution agreements identified as
intangible assets relate to the distribution of certain products in different geographic regions. In both cases, the
fair value was determined using the Multiple-Period Excess Earnings Method. |
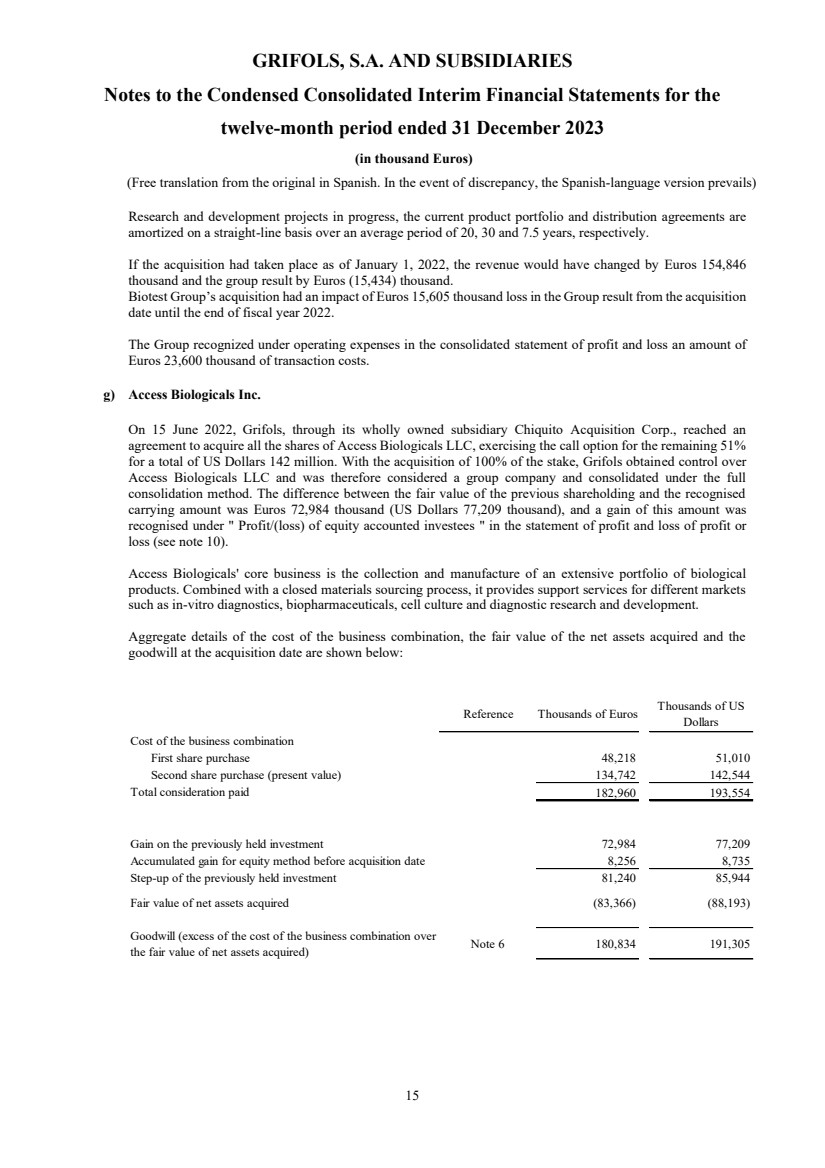
| GRIFOLS, S.A. AND SUBSIDIARIES
Notes to the Condensed Consolidated Interim Financial Statements for the
twelve-month period ended 31 December 2023
(in thousand Euros)
(Free translation from the original in Spanish. In the event of discrepancy, the Spanish-language version prevails)
15
Research and development projects in progress, the current product portfolio and distribution agreements are
amortized on a straight-line basis over an average period of 20, 30 and 7.5 years, respectively.
If the acquisition had taken place as of January 1, 2022, the revenue would have changed by Euros 154,846
thousand and the group result by Euros (15,434) thousand.
Biotest Group’s acquisition had an impact of Euros 15,605 thousand loss in the Group result from the acquisition
date until the end of fiscal year 2022.
The Group recognized under operating expenses in the consolidated statement of profit and loss an amount of
Euros 23,600 thousand of transaction costs.
g) Access Biologicals Inc.
On 15 June 2022, Grifols, through its wholly owned subsidiary Chiquito Acquisition Corp., reached an
agreement to acquire all the shares of Access Biologicals LLC, exercising the call option for the remaining 51%
for a total of US Dollars 142 million. With the acquisition of 100% of the stake, Grifols obtained control over
Access Biologicals LLC and was therefore considered a group company and consolidated under the full
consolidation method. The difference between the fair value of the previous shareholding and the recognised
carrying amount was Euros 72,984 thousand (US Dollars 77,209 thousand), and a gain of this amount was
recognised under " Profit/(loss) of equity accounted investees " in the statement of profit and loss of profit or
loss (see note 10).
Access Biologicals' core business is the collection and manufacture of an extensive portfolio of biological
products. Combined with a closed materials sourcing process, it provides support services for different markets
such as in-vitro diagnostics, biopharmaceuticals, cell culture and diagnostic research and development.
Aggregate details of the cost of the business combination, the fair value of the net assets acquired and the
goodwill at the acquisition date are shown below:
Reference Thousands of Euros Thousands of US
Dollars
Cost of the business combination
First share purchase 48,218 51,010
Second share purchase (present value) 134,742 142,544
Total consideration paid 182,960 193,554
Gain on the previously held investment 72,984 77,209
Accumulated gain for equity method before acquisition date 8,256 8,735
Step-up of the previously held investment 81,240 85,944
Fair value of net assets acquired (83,366) (88,193)
Goodwill (excess of the cost of the business combination over
the fair value of net assets acquired) Note 6 180,834 191,305 |
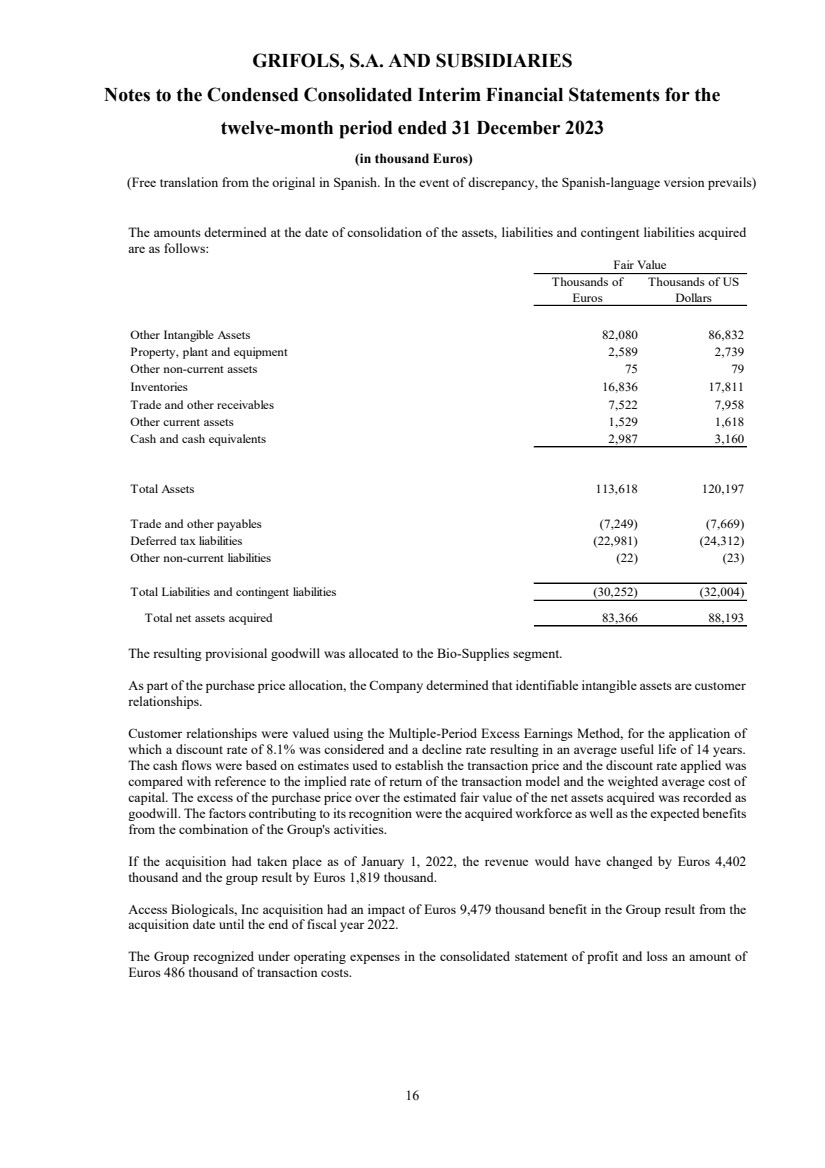
| GRIFOLS, S.A. AND SUBSIDIARIES
Notes to the Condensed Consolidated Interim Financial Statements for the
twelve-month period ended 31 December 2023
(in thousand Euros)
(Free translation from the original in Spanish. In the event of discrepancy, the Spanish-language version prevails)
16
The amounts determined at the date of consolidation of the assets, liabilities and contingent liabilities acquired
are as follows:
Thousands of
Euros
Thousands of US
Dollars
Other Intangible Assets 82,080 86,832
Property, plant and equipment 2,589 2,739
Other non-current assets 75 79
Inventories 16,836 17,811
Trade and other receivables 7,522 7,958
Other current assets 1,529 1,618
Cash and cash equivalents 2,987 3,160
Total Assets 113,618 120,197
Trade and other payables (7,249) (7,669)
Deferred tax liabilities (22,981) (24,312)
Other non-current liabilities (22) (23)
Total Liabilities and contingent liabilities (30,252) (32,004)
Total net assets acquired 83,366 88,193
Fair Value
The resulting provisional goodwill was allocated to the Bio-Supplies segment.
As part of the purchase price allocation, the Company determined that identifiable intangible assets are customer
relationships.
Customer relationships were valued using the Multiple-Period Excess Earnings Method, for the application of
which a discount rate of 8.1% was considered and a decline rate resulting in an average useful life of 14 years.
The cash flows were based on estimates used to establish the transaction price and the discount rate applied was
compared with reference to the implied rate of return of the transaction model and the weighted average cost of
capital. The excess of the purchase price over the estimated fair value of the net assets acquired was recorded as
goodwill. The factors contributing to its recognition were the acquired workforce as well as the expected benefits
from the combination of the Group's activities.
If the acquisition had taken place as of January 1, 2022, the revenue would have changed by Euros 4,402
thousand and the group result by Euros 1,819 thousand.
Access Biologicals, Inc acquisition had an impact of Euros 9,479 thousand benefit in the Group result from the
acquisition date until the end of fiscal year 2022.
The Group recognized under operating expenses in the consolidated statement of profit and loss an amount of
Euros 486 thousand of transaction costs. |
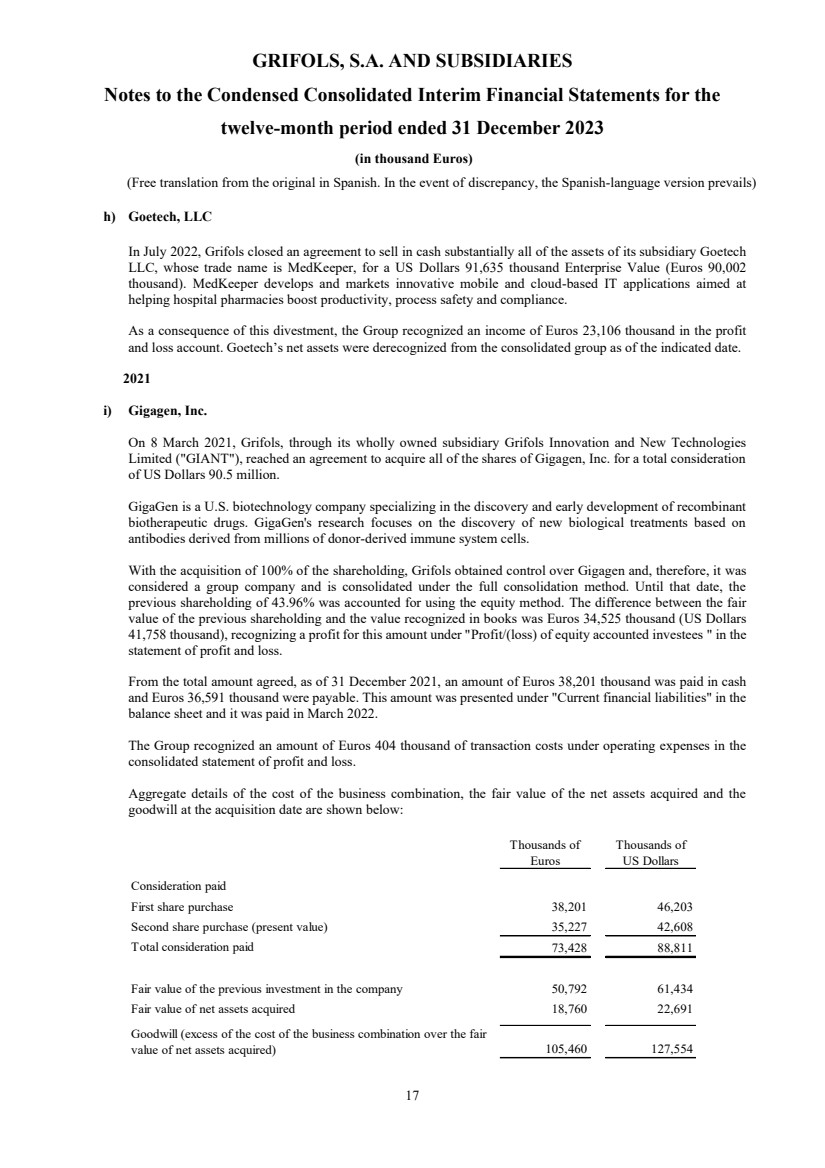
| GRIFOLS, S.A. AND SUBSIDIARIES
Notes to the Condensed Consolidated Interim Financial Statements for the
twelve-month period ended 31 December 2023
(in thousand Euros)
(Free translation from the original in Spanish. In the event of discrepancy, the Spanish-language version prevails)
17
h) Goetech, LLC
In July 2022, Grifols closed an agreement to sell in cash substantially all of the assets of its subsidiary Goetech
LLC, whose trade name is MedKeeper, for a US Dollars 91,635 thousand Enterprise Value (Euros 90,002
thousand). MedKeeper develops and markets innovative mobile and cloud-based IT applications aimed at
helping hospital pharmacies boost productivity, process safety and compliance.
As a consequence of this divestment, the Group recognized an income of Euros 23,106 thousand in the profit
and loss account. Goetech’s net assets were derecognized from the consolidated group as of the indicated date.
2021
i) Gigagen, Inc.
On 8 March 2021, Grifols, through its wholly owned subsidiary Grifols Innovation and New Technologies
Limited ("GIANT"), reached an agreement to acquire all of the shares of Gigagen, Inc. for a total consideration
of US Dollars 90.5 million.
GigaGen is a U.S. biotechnology company specializing in the discovery and early development of recombinant
biotherapeutic drugs. GigaGen's research focuses on the discovery of new biological treatments based on
antibodies derived from millions of donor-derived immune system cells.
With the acquisition of 100% of the shareholding, Grifols obtained control over Gigagen and, therefore, it was
considered a group company and is consolidated under the full consolidation method. Until that date, the
previous shareholding of 43.96% was accounted for using the equity method. The difference between the fair
value of the previous shareholding and the value recognized in books was Euros 34,525 thousand (US Dollars
41,758 thousand), recognizing a profit for this amount under "Profit/(loss) of equity accounted investees " in the
statement of profit and loss.
From the total amount agreed, as of 31 December 2021, an amount of Euros 38,201 thousand was paid in cash
and Euros 36,591 thousand were payable. This amount was presented under "Current financial liabilities" in the
balance sheet and it was paid in March 2022.
The Group recognized an amount of Euros 404 thousand of transaction costs under operating expenses in the
consolidated statement of profit and loss.
Aggregate details of the cost of the business combination, the fair value of the net assets acquired and the
goodwill at the acquisition date are shown below:
Thousands of
Euros
Thousands of
US Dollars
Consideration paid
First share purchase 38,201 46,203
Second share purchase (present value) 35,227 42,608
Total consideration paid 73,428 88,811
Fair value of the previous investment in the company 50,792 61,434
Fair value of net assets acquired 18,760 22,691
Goodwill (excess of the cost of the business combination over the fair
value of net assets acquired) 105,460 127,554 |
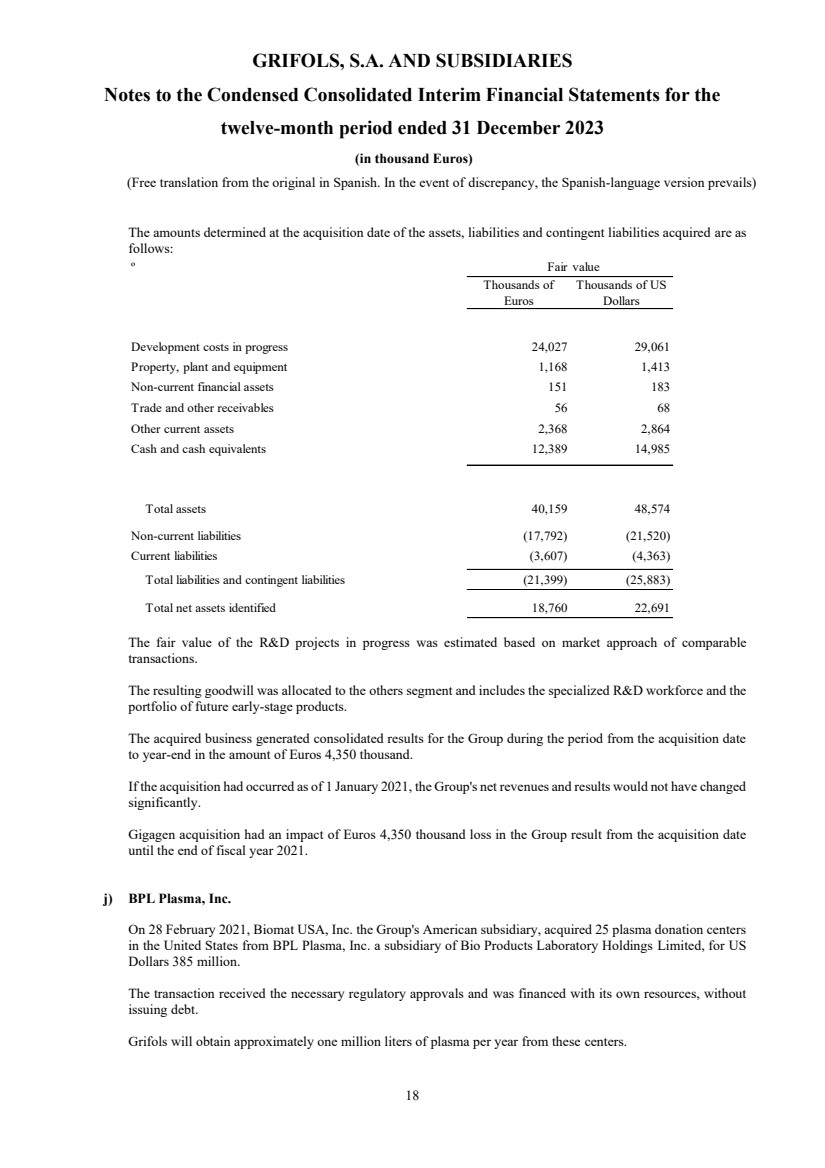
| GRIFOLS, S.A. AND SUBSIDIARIES
Notes to the Condensed Consolidated Interim Financial Statements for the
twelve-month period ended 31 December 2023
(in thousand Euros)
(Free translation from the original in Spanish. In the event of discrepancy, the Spanish-language version prevails)
18
The amounts determined at the acquisition date of the assets, liabilities and contingent liabilities acquired are as
follows:
º Fair value
Thousands of
Euros
Thousands of US
Dollars
Development costs in progress 24,027 29,061
Property, plant and equipment 1,168 1,413
Non-current financial assets 151 183
Trade and other receivables 56 68
Other current assets 2,368 2,864
Cash and cash equivalents 12,389 14,985
Total assets 40,159 48,574
Non-current liabilities (17,792) (21,520)
Current liabilities (3,607) (4,363)
Total liabilities and contingent liabilities (21,399) (25,883)
Total net assets identified 18,760 22,691
The fair value of the R&D projects in progress was estimated based on market approach of comparable
transactions.
The resulting goodwill was allocated to the others segment and includes the specialized R&D workforce and the
portfolio of future early-stage products.
The acquired business generated consolidated results for the Group during the period from the acquisition date
to year-end in the amount of Euros 4,350 thousand.
If the acquisition had occurred as of 1 January 2021, the Group's net revenues and results would not have changed
significantly.
Gigagen acquisition had an impact of Euros 4,350 thousand loss in the Group result from the acquisition date
until the end of fiscal year 2021.
j) BPL Plasma, Inc.
On 28 February 2021, Biomat USA, Inc. the Group's American subsidiary, acquired 25 plasma donation centers
in the United States from BPL Plasma, Inc. a subsidiary of Bio Products Laboratory Holdings Limited, for US
Dollars 385 million.
The transaction received the necessary regulatory approvals and was financed with its own resources, without
issuing debt.
Grifols will obtain approximately one million liters of plasma per year from these centers. |
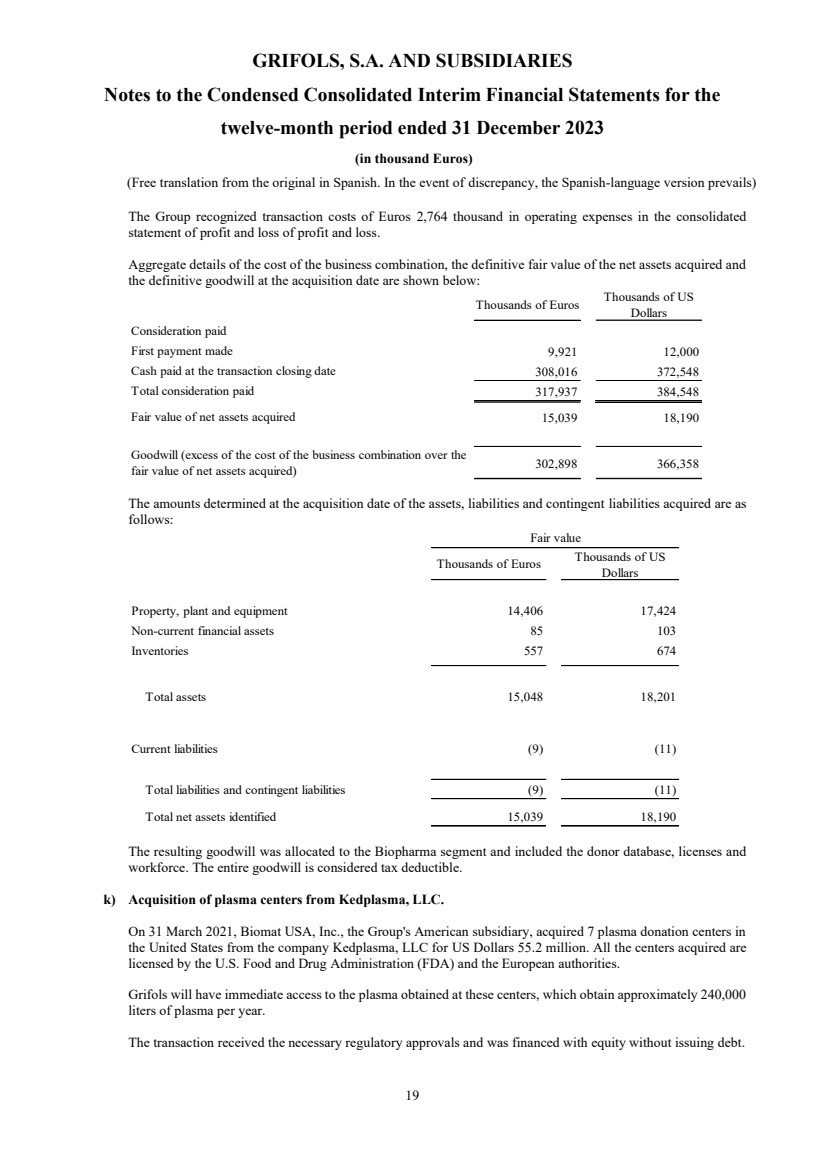
| GRIFOLS, S.A. AND SUBSIDIARIES
Notes to the Condensed Consolidated Interim Financial Statements for the
twelve-month period ended 31 December 2023
(in thousand Euros)
(Free translation from the original in Spanish. In the event of discrepancy, the Spanish-language version prevails)
19
The Group recognized transaction costs of Euros 2,764 thousand in operating expenses in the consolidated
statement of profit and loss of profit and loss.
Aggregate details of the cost of the business combination, the definitive fair value of the net assets acquired and
the definitive goodwill at the acquisition date are shown below:
Thousands of Euros Thousands of US
Dollars
Consideration paid
First payment made 9,921 12,000
Cash paid at the transaction closing date 308,016 372,548
Total consideration paid 317,937 384,548
Fair value of net assets acquired 15,039 18,190
Goodwill (excess of the cost of the business combination over the
fair value of net assets acquired) 302,898 366,358
The amounts determined at the acquisition date of the assets, liabilities and contingent liabilities acquired are as
follows:
Thousands of Euros Thousands of US
Dollars
Property, plant and equipment 14,406 17,424
Non-current financial assets 85 103
Inventories 557 674
Total assets 15,048 18,201
Current liabilities (9) (11)
Total liabilities and contingent liabilities (9) (11)
Total net assets identified 15,039 18,190
Fair value
The resulting goodwill was allocated to the Biopharma segment and included the donor database, licenses and
workforce. The entire goodwill is considered tax deductible.
k) Acquisition of plasma centers from Kedplasma, LLC.
On 31 March 2021, Biomat USA, Inc., the Group's American subsidiary, acquired 7 plasma donation centers in
the United States from the company Kedplasma, LLC for US Dollars 55.2 million. All the centers acquired are
licensed by the U.S. Food and Drug Administration (FDA) and the European authorities.
Grifols will have immediate access to the plasma obtained at these centers, which obtain approximately 240,000
liters of plasma per year.
The transaction received the necessary regulatory approvals and was financed with equity without issuing debt. |
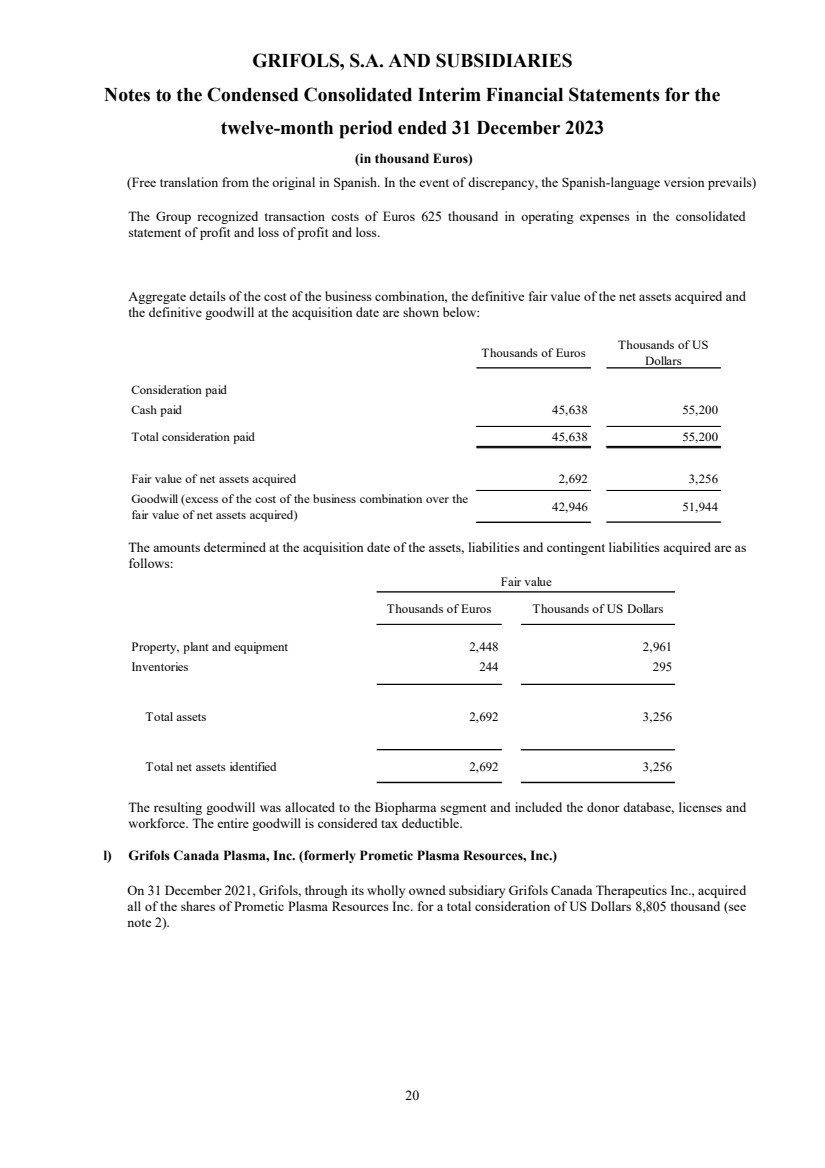
| GRIFOLS, S.A. AND SUBSIDIARIES
Notes to the Condensed Consolidated Interim Financial Statements for the
twelve-month period ended 31 December 2023
(in thousand Euros)
(Free translation from the original in Spanish. In the event of discrepancy, the Spanish-language version prevails)
20
The Group recognized transaction costs of Euros 625 thousand in operating expenses in the consolidated
statement of profit and loss of profit and loss.
Aggregate details of the cost of the business combination, the definitive fair value of the net assets acquired and
the definitive goodwill at the acquisition date are shown below:
Thousands of Euros Thousands of US
Dollars
Consideration paid
Cash paid 45,638 55,200
Total consideration paid 45,638 55,200
Fair value of net assets acquired 2,692 3,256
Goodwill (excess of the cost of the business combination over the
fair value of net assets acquired) 42,946 51,944
The amounts determined at the acquisition date of the assets, liabilities and contingent liabilities acquired are as
follows:
Thousands of Euros Thousands of US Dollars
Property, plant and equipment 2,448 2,961
Inventories 244 295
Total assets 2,692 3,256
Total net assets identified 2,692 3,256
Fair value
The resulting goodwill was allocated to the Biopharma segment and included the donor database, licenses and
workforce. The entire goodwill is considered tax deductible.
l) Grifols Canada Plasma, Inc. (formerly Prometic Plasma Resources, Inc.)
On 31 December 2021, Grifols, through its wholly owned subsidiary Grifols Canada Therapeutics Inc., acquired
all of the shares of Prometic Plasma Resources Inc. for a total consideration of US Dollars 8,805 thousand (see
note 2).
|
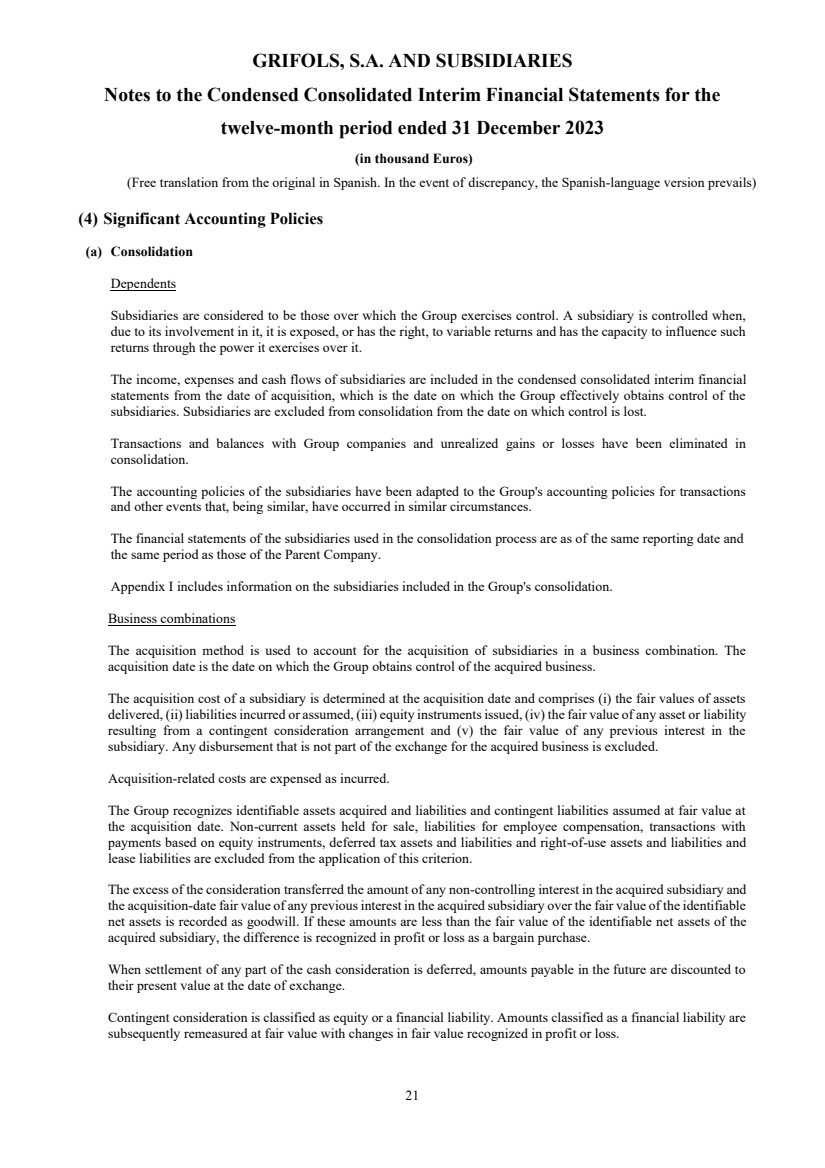
| GRIFOLS, S.A. AND SUBSIDIARIES
Notes to the Condensed Consolidated Interim Financial Statements for the
twelve-month period ended 31 December 2023
(in thousand Euros)
(Free translation from the original in Spanish. In the event of discrepancy, the Spanish-language version prevails)
21
(4) Significant Accounting Policies
(a) Consolidation
Dependents
Subsidiaries are considered to be those over which the Group exercises control. A subsidiary is controlled when,
due to its involvement in it, it is exposed, or has the right, to variable returns and has the capacity to influence such
returns through the power it exercises over it.
The income, expenses and cash flows of subsidiaries are included in the condensed consolidated interim financial
statements from the date of acquisition, which is the date on which the Group effectively obtains control of the
subsidiaries. Subsidiaries are excluded from consolidation from the date on which control is lost.
Transactions and balances with Group companies and unrealized gains or losses have been eliminated in
consolidation.
The accounting policies of the subsidiaries have been adapted to the Group's accounting policies for transactions
and other events that, being similar, have occurred in similar circumstances.
The financial statements of the subsidiaries used in the consolidation process are as of the same reporting date and
the same period as those of the Parent Company.
Appendix I includes information on the subsidiaries included in the Group's consolidation.
Business combinations
The acquisition method is used to account for the acquisition of subsidiaries in a business combination. The
acquisition date is the date on which the Group obtains control of the acquired business.
The acquisition cost of a subsidiary is determined at the acquisition date and comprises (i) the fair values of assets
delivered, (ii) liabilities incurred or assumed, (iii) equity instruments issued, (iv) the fair value of any asset or liability
resulting from a contingent consideration arrangement and (v) the fair value of any previous interest in the
subsidiary. Any disbursement that is not part of the exchange for the acquired business is excluded.
Acquisition-related costs are expensed as incurred.
The Group recognizes identifiable assets acquired and liabilities and contingent liabilities assumed at fair value at
the acquisition date. Non-current assets held for sale, liabilities for employee compensation, transactions with
payments based on equity instruments, deferred tax assets and liabilities and right-of-use assets and liabilities and
lease liabilities are excluded from the application of this criterion.
The excess of the consideration transferred the amount of any non-controlling interest in the acquired subsidiary and
the acquisition-date fair value of any previous interest in the acquired subsidiary over the fair value of the identifiable
net assets is recorded as goodwill. If these amounts are less than the fair value of the identifiable net assets of the
acquired subsidiary, the difference is recognized in profit or loss as a bargain purchase.
When settlement of any part of the cash consideration is deferred, amounts payable in the future are discounted to
their present value at the date of exchange.
Contingent consideration is classified as equity or a financial liability. Amounts classified as a financial liability are
subsequently remeasured at fair value with changes in fair value recognized in profit or loss. |
| GRIFOLS, S.A. AND SUBSIDIARIES
Notes to the Condensed Consolidated Interim Financial Statements for the
twelve-month period ended 31 December 2023
(in thousand Euros)
(Free translation from the original in Spanish. In the event of discrepancy, the Spanish-language version prevails)
22
When the business combination could only be determined on a provisional basis, the identifiable net assets are
initially recorded at their provisional values, recognizing the adjustments made during the measurement period as if
they had been known at the acquisition date, restating comparative figures for the previous year, if applicable. The
adjustments to the provisional values only incorporate information relating to facts and circumstances that existed
at the acquisition date and which, had they been known, would have affected the amounts recognized at that date.
The measurement period should not exceed twelve months from the date of acquisition.
If the business combination is carried out in stages, the acquisition-date carrying amount of the previously held
equity interest of the acquiree is remeasured at its acquisition-date fair value, with any resulting gain or loss
recognized in profit or loss.
Non-controlling interests
Non-controlling interests in subsidiaries are recorded at the acquisition date at their percentage of interest in the fair
value of the identifiable net assets, without considering potential voting rights. In addition, the profit or loss for the
year and each component of other comprehensive income allocated to the non-controlling interest is allocated in
proportion to its percentage of ownership. Non-controlling interests in the results and equity of subsidiaries are
shown separately in the consolidated statement of profit and loss, the consolidated statement of comprehensive
income, the consolidated statement of changes in equity and the consolidated balance sheet, respectively.
The increase and reduction of non-controlling interests in a subsidiary while maintaining control is recognized as an
equity transaction in reserves.
Associated
Associated entities are those over which the Group exercises significant influence, understood as the capacity to
intervene in financial and operating decisions, without the existence of control or joint control.
Investments in associates are initially recognized at acquisition cost, including costs directly attributable to the
acquisition and any active or passive contingent consideration that depends on future events or the fulfillment of
certain conditions.
Subsequently, investments in associates are accounted for by the equity method from the date on which significant
influence is exercised until the date on which the Company can no longer justify the existence of significant
influence.
The excess between the cost of the investment and the Group's share of the fair values of the identifiable net assets
is recorded as goodwill, which is included in the carrying amount of the investment. The shortfall, once the amounts
of the cost of the investment and the identification and valuation of the net assets of the associate have been
evaluated, is recorded as income in the determination of the investor's share in the results of the associate for the
year in which it was acquired.
The accounting policies of the associated companies have been subject to time and valuation homogenization in the
same terms as those referred to in the subsidiaries.
The Group's share in the profits or losses of associates obtained from the date of acquisition is recorded as an increase
or decrease in the value of the investments with a credit or debit to "Profit of equity accounted investees with similar
activity to that of the Group" when the investee companies carry out the same activity as the corporate purpose of
the Group described in note 1 and, otherwise, in “Profit /(loss) of equity accounted investees”. Likewise, the Group's
share in the other comprehensive income of associates obtained since the acquisition date is recorded as an increase
or decrease in the value of the investments in associates, with the balancing entry by nature being recognized in |
| GRIFOLS, S.A. AND SUBSIDIARIES
Notes to the Condensed Consolidated Interim Financial Statements for the
twelve-month period ended 31 December 2023
(in thousand Euros)
(Free translation from the original in Spanish. In the event of discrepancy, the Spanish-language version prevails)
23
other comprehensive income. Dividend distributions are recorded as decreases in the value of investments. To
determine the Group's share of profits or losses, including impairment losses recognized by associates, income or
expenses arising from the acquisition method are considered.
When the Group's share of losses on an equity accounted investment equals or exceeds its interest in the entity, the
Group does not recognize additional losses unless it has incurred obligations or made payments on behalf of the
other entity.
The Group's share in the profits or losses of associates and changes in equity is determined on the basis of the
ownership interest at year-end, without considering the possible exercise or conversion of potential voting rights.
However, the Group's share is determined considering the possible exercise of potential voting rights and other
derivative financial instruments that, in substance, grant current access to the economic benefits associated with
ownership interests, i.e. the right to participate in future dividends and changes in the value of associates.
After applying the equity method, the Group assesses whether there is objective evidence of impairment of the net
investment in the associate. Some of the main evidence include significant cumulative losses, contractual default,
financial difficulties and adverse changes in technology, industry or economy affecting the associate. The
impairment calculation is determined by comparing the carrying amount of the net investment in the associate with
its recoverable amount, where recoverable amount is the higher of value in use or fair value less costs of disposal.
In this regard, the value in use is calculated based on the Group's share of the present value of the estimated cash
flows from ordinary activities and the amounts that could result from the final disposal of the associate. The
recoverable amount of the investment in an associate is assessed in relation to each associate (see note 10), unless it
does not constitute a cash-generating unit (CGU). Impairment losses are not allocated to goodwill or other assets
implicit in the investment in associates arising from the application of the acquisition method. In subsequent years,
reversals of the value of investments are recognized against income, to the extent that there is an increase in the
recoverable value. Impairment losses are presented separately from the Group's share in the results of associates.
Appendix I includes information on subsidiaries and associates included in the Group's consolidation.
Joint agreements
Joint arrangements are those in which there is a contractual agreement to share control over an economic activity,
so that decisions on the relevant activities require the unanimous consent of the Group and the other operators.
Investments in joint arrangements are classified as joint operations or joint ventures, depending on the contractual
rights and obligations of each investor, rather than the legal structure of the joint arrangement.
Interests in joint ventures are accounted for by the equity method, after initially being recognized at cost in the
consolidated balance sheet.
(b) Transactions and balances in foreign currencies
Transactions in foreign currencies are translated to the functional currency using the average exchange rate of the
previous month provided that it does not differ significantly from the exchange rate at the date of the transaction.
Foreign currency gains and losses resulting from the settlement of these transactions and from the translation of
monetary assets and liabilities denominated in foreign currencies at closing exchange rates are recognized in profit
or loss except when there are qualified cash flow hedges and qualified net investment hedges that are deferred to
equity.
The effect of exchange rate changes on cash and cash equivalents denominated in foreign currencies is presented
separately in the statement of cash flows as "Effect of exchange rate changes on cash". |
| GRIFOLS, S.A. AND SUBSIDIARIES
Notes to the Condensed Consolidated Interim Financial Statements for the
twelve-month period ended 31 December 2023
(in thousand Euros)
(Free translation from the original in Spanish. In the event of discrepancy, the Spanish-language version prevails)
24
The translation of foreign operations whose functional currency is not that of a hyperinflationary country has been
made by applying the following criteria:
m) Assets and liabilities, including goodwill and adjustments to net assets arising from the acquisition of businesses,
are translated at the closing exchange rate at each balance sheet date;
n) Revenues and expenses are translated at the average exchange rate of the previous month, as an approximation
of the exchange rate at the date of the transaction;
o) Translation differences resulting from the application of the above criteria are recognized in other comprehensive
income.
(c) Goodwill
After initial recognition, goodwill is recorded at cost, less any accumulated impairment loss, which is not reversible.
Goodwill is not amortized, but is tested for impairment on an annual basis or more frequently in the event that
events indicative of a potential loss in the value of the asset have been identified. For these purposes, goodwill
resulting from business combinations is allocated to each of the cash generating units (CGUs) or groups of CGUs
that are expected to benefit from the synergies of the combination and the criteria referred to in note 6 are applied.
CGUs or groups of CGUs are identified at the lowest level that goodwill is controlled for the purpose of internal
management (Note 6).
(d) Intangible assets
Intangible assets are recorded at cost (acquisition or development) or at fair value when acquired in a business
combination, less accumulated amortization and any accumulated impairment losses.
Any costs incurred during the research phase of projects are recognized as an expense when incurred.
Costs related to development activities for internally generated intangible assets are capitalized to the extent that:
• The Group has technical studies that justify the viability of the production process;
• There is a commitment by the Group to complete production of the asset so that it is in a condition for sale or
internal use;
• The asset will generate sufficient economic benefits;
• The Group has the technical and financial resources to complete the development of the asset and has developed
budget control and analytical accounting systems that make it possible to monitor the budgeted costs, the
modifications introduced and the costs actually charged to the various projects.
In relation to the development costs of new products or drugs, they are capitalized as long as their economic
profitability is reasonably assured and when they are either in a pivotal phase or correspond to projects related to
products that are currently being marketed in various markets, in both cases with expected technical feasibility.
Development costs previously recognized as an expense are not recognized as an asset in a subsequent period.
The separate acquisition or through a business combination of an research and development project in progress is
capitalized in any case, in accordance with the provisions of IAS 38, since the price paid for the acquisition reflects
expectations about the probability that the future economic benefits of the asset are used by the Group. Subsequent
costs are recorded following the provisions for internally generated intangible assets. |
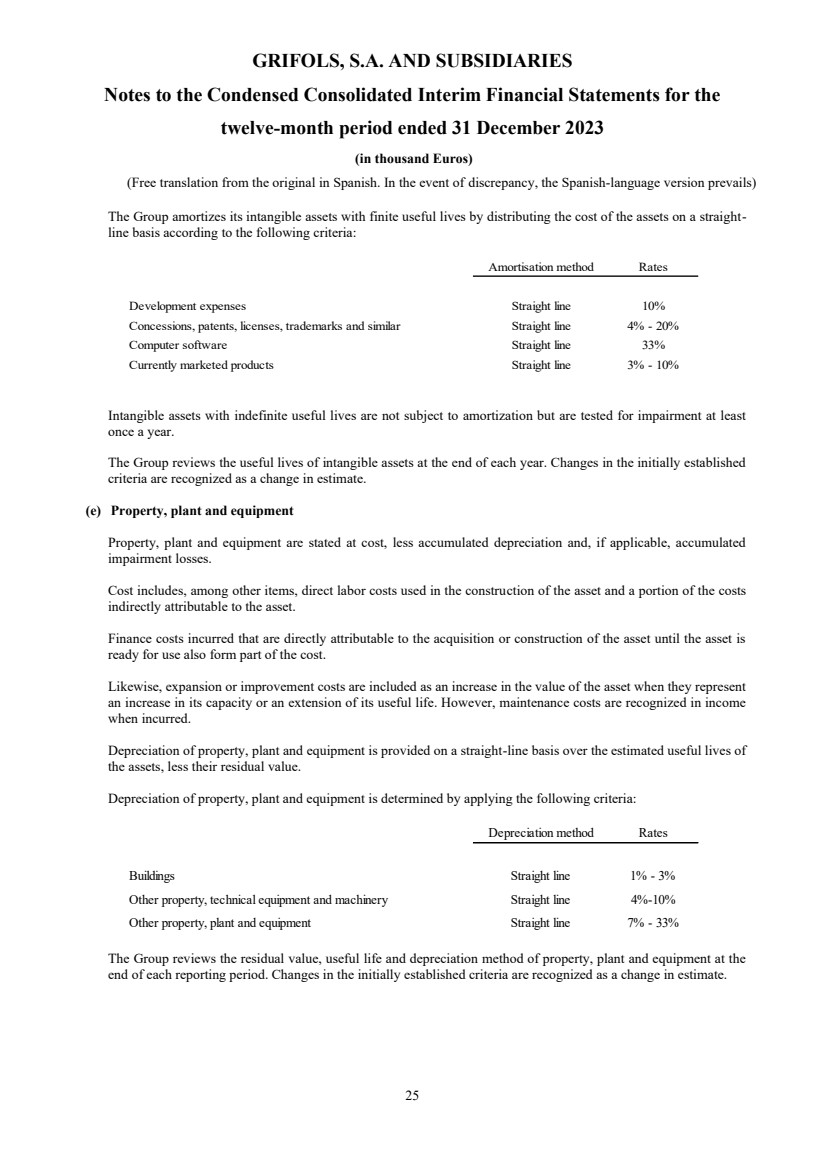
| GRIFOLS, S.A. AND SUBSIDIARIES
Notes to the Condensed Consolidated Interim Financial Statements for the
twelve-month period ended 31 December 2023
(in thousand Euros)
(Free translation from the original in Spanish. In the event of discrepancy, the Spanish-language version prevails)
25
The Group amortizes its intangible assets with finite useful lives by distributing the cost of the assets on a straight-line basis according to the following criteria:
Amortisation method Rates
Development expenses Straight line 10%
Concessions, patents, licenses, trademarks and similar Straight line 4% - 20%
Computer software Straight line 33%
Currently marketed products Straight line 3% - 10%
Intangible assets with indefinite useful lives are not subject to amortization but are tested for impairment at least
once a year.
The Group reviews the useful lives of intangible assets at the end of each year. Changes in the initially established
criteria are recognized as a change in estimate.
(e) Property, plant and equipment
Property, plant and equipment are stated at cost, less accumulated depreciation and, if applicable, accumulated
impairment losses.
Cost includes, among other items, direct labor costs used in the construction of the asset and a portion of the costs
indirectly attributable to the asset.
Finance costs incurred that are directly attributable to the acquisition or construction of the asset until the asset is
ready for use also form part of the cost.
Likewise, expansion or improvement costs are included as an increase in the value of the asset when they represent
an increase in its capacity or an extension of its useful life. However, maintenance costs are recognized in income
when incurred.
Depreciation of property, plant and equipment is provided on a straight-line basis over the estimated useful lives of
the assets, less their residual value.
Depreciation of property, plant and equipment is determined by applying the following criteria:
Depreciation method Rates
Buildings Straight line 1% - 3%
Other property, technical equipment and machinery Straight line 4%-10%
Other property, plant and equipment Straight line 7% - 33%
The Group reviews the residual value, useful life and depreciation method of property, plant and equipment at the
end of each reporting period. Changes in the initially established criteria are recognized as a change in estimate. |
| GRIFOLS, S.A. AND SUBSIDIARIES
Notes to the Condensed Consolidated Interim Financial Statements for the
twelve-month period ended 31 December 2023
(in thousand Euros)
(Free translation from the original in Spanish. In the event of discrepancy, the Spanish-language version prevails)
26
(f) Leases
Lessee
The determination of whether a contract is or contains a lease is based on an analysis of the contractual arrangement
and requires an assessment of whether the lessee has the right to control the use of the identified asset and to obtain
all of the economic benefits from the use of the asset throughout the lease term.
The lease term is the non-cancelable period considering the initial term of each contract unless the Group has a
unilateral extension or termination option and there is reasonable certainty that such option will be exercised in
which case the corresponding extension or early termination term will be considered.
In lease contracts where the Group acts as lessee, it is recognized at the lease commencement date (i.e. the date on
which the underlying asset is available for use):
• A liability for the present value of the installments to be paid over the lease term, using the incremental borrowing
or implicit interest rate as the discount rate when expressly indicated in the contract and,
• A right-of-use asset representing the right to use the underlying leased asset during the term of the lease.
Lease liabilities include fixed lease payments less any incentives, as well as variable payments that depend on an
index or interest rate known at the date of inception of the lease. Also included is the exercise price of the purchase
option when the lessee is reasonably certain of exercising it. After initial recognition, the liability is increased by the
interest on the lease liability and reduced by the payments made. The liability is also remeasured if there are changes
in the amounts payable and the lease terms. Payments included in the lease payments corresponding to maintenance,
electricity, water, gas, security, cleaning, among others, are not part of the lease liability and are recognized as an
expense.
The incremental borrowing rate is determined taking into account: (i) geographic areas, (ii) financial term, (iii) lease
term, (iv) risk-free rate as reference rate and (v) financial spread.
Rights-of-use assets are measured at cost, less accumulated amortization and impairment losses (if any) and adjusted
as a result of the remeasurement of the lease liability. Cost includes the amount of the initial valuation of the lease
liability, as well as any amounts previously paid to the lessor prior to or at the commencement date of the lease less
any incentives received by the lessor and estimated costs to decommission the leased asset. Amortization of rights
of use is provided on a straight-line basis over the shorter of the estimated useful life of the asset or the lease term.
The Group applies the exception to recognition for those contracts where the lease term is 12 months or less or where
the value of the leased asset (individually) when new, is less than US Dollars 5,000 or its equivalent in another
currency. Consequently, in these cases, the amounts accrued will be recognized as an expense during the lease term.
Lessor
When the Group acts as lessor, it classifies contracts between operating and finance leases. Leases in which the
Group acts as lessor while retaining a significant portion of the risks and rewards incidental to ownership of the
leased asset are treated as operating leases. Otherwise, the lease is treated as a finance lease.
(g) Impairment of non-financial assets
Goodwill and intangible assets that have an indefinite useful life are not subject to amortization and are tested for
impairment annually, or more frequently in the event of events or changes in circumstances that indicate that they
may be impaired. |
| GRIFOLS, S.A. AND SUBSIDIARIES
Notes to the Condensed Consolidated Interim Financial Statements for the
twelve-month period ended 31 December 2023
(in thousand Euros)
(Free translation from the original in Spanish. In the event of discrepancy, the Spanish-language version prevails)
27
Other assets are tested for impairment whenever events or changes in circumstances indicate that the carrying
amount may not be recoverable.
When the recoverable amount is less than the carrying amount of the asset, an impairment loss is recognized in the
consolidated statement of profit and loss for the difference between both amounts.
The recoverable amount is the higher of an asset's fair value less costs of disposal and the estimated value in use
based on discounted future cash flows expected to arise from the use of the asset. The estimate of value in use
considers expectations about possible variations in the amount or timing of cash flows, the time value of money, the
price to be paid for bearing the uncertainty related to the asset and other factors that affect the valuation of future
cash flows related to the asset.
For the purpose of assessing impairment losses, assets are grouped at the lowest levels for which there are separately
identifiable cash inflows that are largely independent of the cash inflows of other assets or groups of assets (cash-generating units). Impairment losses on non-financial assets (other than goodwill) are reviewed for possible reversal
at the end of each reporting period.
Losses related to the impairment of CGUs are initially allocated to reduce, if applicable, the value of goodwill
attributed to the CGU and then to the other assets of the CGU, pro rata based on the carrying amount of each asset,
with the limit for each asset being the higher of its fair value less costs of disposal, its value in use and zero.
Impairment losses related to goodwill are not reversible.
(h) Financial instruments
Financial assets
Ranking
The classification of financial assets is determined based on the characteristics of the contractual cash flows of those
assets and the business model that represents how the financial assets are managed to achieve a particular business
objective. In determining whether the cash flows are obtained through the receipt of contractual cash flows from the
assets, consideration is given to the frequency, value and timing of sales in prior periods, the reasons for those sales
and expectations regarding future sales activity. This information provides indicative data on how the Group's stated
objective regarding the management of financial assets is achieved and, more specifically, how cash flows are
obtained.
Therefore, financial assets are classified according to the following valuation categories based on the business model
and are only reclassified when, and only when their business model for managing them changes:
a. Financial assets at amortized cost: includes financial assets, including those admitted to trading on an
organized market, for which the Group holds the investment under a business model whose objective is to
hold financial assets to receive cash flows from the execution of the contract, and the contractual terms of
the asset give rise, at specified dates, to cash flows that are solely collections of principal and interest on
the principal amount outstanding.
In general, the following are included in this category:
i. Trade receivables: arising from the sale of goods or the rendering of services for trade transactions
with deferred payment, and
ii. Receivables from non-trade operations: these arise from loans or credits granted by the Group whose
collections are of a determined or determinable amount. |
| GRIFOLS, S.A. AND SUBSIDIARIES
Notes to the Condensed Consolidated Interim Financial Statements for the
twelve-month period ended 31 December 2023
(in thousand Euros)
(Free translation from the original in Spanish. In the event of discrepancy, the Spanish-language version prevails)
28
b. Financial assets at fair value through other comprehensive income: this category includes financial assets
whose contractual conditions give rise, at specified dates, to cash flows that are solely collections of
principal and interest on the principal amount outstanding, and are held within the framework of a business
model whose objective is achieved by obtaining contractual cash flows and selling financial assets.
Investments in equity instruments irrevocably designated by the Group at the time of their initial
recognition are also included in this category, provided that they are not held for trading and are not to be
valued at cost.
c. Financial assets at fair value through profit or loss: includes financial assets held for trading and those
financial assets that have not been classified in any of the above categories. Also included in this category
are financial assets that are optionally designated by the Group at the time of initial recognition, which
otherwise would have been included in another category, because such designation eliminates or
significantly reduces a valuation inconsistency or accounting missmatch that would otherwise arise.
Initial measurement
Financial assets are recorded, in general terms, initially at the fair value of the consideration given plus directly
attributable transaction costs. However, transaction costs directly attributable to assets recorded at fair value through
profit or loss are recognized in the statement of profit and loss for the year.
Subsequent measurement
Financial assets at amortized cost are recorded by applying this valuation criterion, charging to the statement of
profit and loss the interest accrued by applying the effective interest rate method.
Financial assets included in the fair value category through other comprehensive income are recorded at fair value,
without deducting any transaction costs that may be incurred in their disposal. Changes in fair value are recorded
directly in equity until the financial asset is derecognized or impaired, at which time the amount so recognized is
taken to the statement of profit and loss.
Financial assets at fair value through profit or loss are measured at fair value and the result of changes in fair value
is recorded in the statement of profit and loss.
Disposals of financial assets
Financial assets are derecognized when the rights to receive cash flows related to them have expired or have been
transferred and the Group has substantially transferred the risks and rewards of ownership. Similarly, they are
disposed from the balance sheet when there are transfers of collection rights, whose certain risks are shared with the
factor, such as the risk of default, but exists a transfer of control to the factor, understood as the unilateral capacity
to sell those assets to a non-related third party without the necessity of enforcing additional restrictions to the sale.
Impairment
The Group assesses, on a prospective basis, the expected credit losses associated with its debt instruments carried at
amortized cost and at fair value through other comprehensive income The methodology applied for impairment
depends on whether there has been a significant increase in credit risk.
For trade receivables, the Group applies the simplified approach permitted by IFRS 9 which requires expected losses
to be recorded from the initial recognition of the receivables, so that the Group determines expected credit losses as
a probability-weighted estimate of such losses over the expected life of the financial instrument. |
| GRIFOLS, S.A. AND SUBSIDIARIES
Notes to the Condensed Consolidated Interim Financial Statements for the
twelve-month period ended 31 December 2023
(in thousand Euros)
(Free translation from the original in Spanish. In the event of discrepancy, the Spanish-language version prevails)
29
The practical solution used is the use of a provisioning matrix based on segmentation into homogeneous asset groups,
applying historical information on default rates for these groups and applying reasonable information on future
economic conditions.
Default rates are calculated based on current default experience over the past year, as it is a very dynamic market,
and are adjusted for differences between current and historical economic conditions and considering projected
information, which is reasonably available.
Financial liabilities
Financial liabilities assumed or incurred by the Group are classified in the following measurement categories:
a. Financial liabilities at amortized cost: are those debits and payables of the Group that have arisen from the
purchase of goods and services for trading operations, or those which, without having a commercial origin,
not being derivative instruments, arise from loan or credit operations received by the Group.
These liabilities are initially measured at the fair value of the consideration received, adjusted for directly
attributable transaction costs. Any difference between the amount received and its repayment value is
recognized in the consolidated statement of profit and loss during the repayment period of the debt, applying
the effective interest rate method.
b. Financial liabilities at fair value through profit or loss.
Liability derivative financial instruments are measured at fair value, following the same criteria as those
corresponding to financial assets at fair value through profit or loss described in the preceding section.
The Group derecognizes financial liabilities when the obligations that generated them are extinguished.
Assets and liabilities are presented separately in the balance sheet and are only presented at their net amount when
the Group has the enforceable right to offset the recognized amounts and, in addition, intends to settle the amounts
on a net basis or to realize the asset and settle the liability simultaneously.
Equity instruments
The Group holds financial assets, mainly equity instruments, which are measured at fair value. When Group
management has opted to present gains and losses in the fair value of equity investments in other comprehensive
income, after initial recognition, the equity instruments are measured at fair value, recognizing the gain or loss in
other comprehensive income. Amounts recognized in other comprehensive income are not reclassified to profit or
loss, but are reclassified to reserves when the instruments are derecognized. Dividends from such investments
continue to be recognized in profit or loss as other income when the Group's right to receive payments is established.
(i) Derivative financial instruments and hedging activities
Financial derivatives are recognized at fair value at the date of the contract and at each year-end. The method for
recognizing the gain or loss depends on whether the derivative is classified as a hedging instrument, and if so, the
nature of the hedged asset. |
| GRIFOLS, S.A. AND SUBSIDIARIES
Notes to the Condensed Consolidated Interim Financial Statements for the
twelve-month period ended 31 December 2023
(in thousand Euros)
(Free translation from the original in Spanish. In the event of discrepancy, the Spanish-language version prevails)
30
For accounting purposes, they are classified as follows:
(i) Derivatives qualifying for cash flow hedge accounting
Hedging effectiveness
Hedge effectiveness is determined at the inception of the hedging relationship, and through periodic prospective
effectiveness assessments to ensure that there is an economic relationship between the hedged item and the hedging
instrument.
In derivatives such as the euro/Dollar cross-currency swap, the Group uses the hypothetical derivative method to
assess effectiveness. This hypothetical derivative is constructed without the inclusion of credit risk and currency
spread. Under the hypothetical derivative method, the cumulative change in the fair value of the actual currency
swap, excluding the effect of the currency spread, will be compared to the cumulative change in the fair value of the
hypothetical swap. Therefore, the hypothetical derivative is constructed as a cross-currency swap with fixed euro
payment, fixed U.S. Dollar receipt without the inclusion of credit risk and foreign currency spread and with a fair
value of zero at the date of designation.
Recognition
At the inception of the hedging relationship, the Group documents the economic relationship between the hedging
instruments and the hedged items, including whether changes in cash flows of the hedging instruments are expected
to offset changes in cash flows of the hedged items. The Group documents its risk management objective and strategy
for undertaking its hedging transactions.
The effective portion of changes in the fair value of derivatives designated and classified as cash flow hedges is
recognized in equity under "Cash flow hedge reserve". In the case of cross-currency swaps, the currency spread of
the hedging relationship is excluded and treated as hedging costs in equity. The gain or loss corresponding to the
ineffective portion is recognized immediately in profit or loss for the year under the heading "Change in fair value
of financial instruments".
Amounts accumulated in the hedging reserve included in shareholders' equity are transferred to profit or loss when
the hedged item affects profit or loss or when ineffectiveness is identified.
The fair value of derivatives designated as hedges is detailed in note 30. Movements in the hedging reserve included
in shareholders' equity are shown in note 17 (c).
(ii) Derivatives that do not qualify for hedge accounting
When derivatives do not meet the criteria for hedge accounting, they are classified as "held for trading". Changes in
fair value are recognized immediately in the consolidated statement of profit and loss.
(j) Own equity instruments
The acquisition of treasury stock is recorded at acquisition cost, reducing equity until the time of disposal. Gains or
losses on the disposal of treasury stock are recorded under "Reserves" in the consolidated balance sheet. Transaction
costs related to own equity instruments, net of taxes, are recorded as a reduction of equity.
(k) Inventories
Inventories are stated at the lower of weighted average cost or net realizable value. Net realizable value is the
estimated selling price in the normal course of business, less the estimated costs to complete production and those
necessary to make the sale. For raw materials and other supplies it is the replacement cost. |
| GRIFOLS, S.A. AND SUBSIDIARIES
Notes to the Condensed Consolidated Interim Financial Statements for the
twelve-month period ended 31 December 2023
(in thousand Euros)
(Free translation from the original in Spanish. In the event of discrepancy, the Spanish-language version prevails)
31
The cost includes direct materials, direct labor and an appropriate proportion of indirect variable and fixed costs, the
latter being allocated on the basis of the normal working capacity of the means of production. The cost of plasma
stocks includes the amount delivered to donors, or the amount invoiced by the seller when purchased from third
parties, as well as the cost of products and devices used in the collection process, and rental and storage costs. The
costs of purchased inventories are determined after deducting discounts and rebates when it is probable that the
conditions determining their concession will be met. Indirect costs such as management and administrative
overheads are recognized as expenses in the period in which they are incurred.
Any previously recognized inventory impairment adjustment is reversed against income under "Cost of sales" when
the circumstances that caused the impairment no longer exist or when there is clear evidence of an increase in the
net realizable value as a result of a change in economic circumstances. The reversal of the write-down is limited to
the lower of cost and the new net realizable value of inventories.
(l) Cash and cash equivalents
Cash and cash equivalents include cash on hand, demand deposits with banks, other short-term highly liquid
investments with an original maturity of three months or less that are readily convertible to known amounts of cash
and which are subject to an insignificant risk of changes in value.
(m) Government grants
Government grants are recognized when there is reasonable assurance that the conditions attached to the grant will
be met and that the grant will be collected.
Non-refundable capital grants are recorded on the liability side of the consolidated balance sheet at the original
amount granted and are recognized in the consolidated statement of profit and loss as the related assets financed are
depreciated.
Grants received as compensation for expenses or losses already incurred or for the purpose of providing immediate
financial support not related to future expenses are credited to the consolidated statement of profit and loss.
Financial liabilities that incorporate implicit aid in the form of the application of below-market interest rates are
recognized initially at fair value. The difference between this value, adjusted where appropriate for the costs of
issuing the financial liability and the amount received, is recorded as a government grant based on the nature of the
grant.
(n) Employee benefits
(i) Defined contribution plans
The Group records the contributions to be made to defined contribution plans as they accrue. The amount of accrued
contributions is recorded under "Personnel expenses" in the consolidated statement of profit and loss in the year to
which the contribution relates.
(ii) Defined benefit plans
The liability recognized corresponds to the present value of the obligation at the consolidated balance sheet date less
the fair value of plan assets. The defined benefit obligation is calculated annually by independent actuaries using the
projected unit credit method. The present value of the obligation is determined by discounting the estimated future
cash flows at interest rates of bonds denominated in the currency in which the benefits will be paid and with
maturities similar to those of the related obligations. Actuarial gains and losses arising from changes in actuarial
assumptions or differences between assumptions and reality are recognized in equity under "Other comprehensive |
| GRIFOLS, S.A. AND SUBSIDIARIES
Notes to the Condensed Consolidated Interim Financial Statements for the
twelve-month period ended 31 December 2023
(in thousand Euros)
(Free translation from the original in Spanish. In the event of discrepancy, the Spanish-language version prevails)
32
income". Past service costs are recognized in the consolidated statement of profit and loss under "Personnel
expenses".
(iii) Termination benefits
Termination benefits are recognized on the earlier of the following dates: (a) when the Group can no longer withdraw
the offer or (b) when the Group recognizes costs of a restructuring within the scope of IAS 37 and this results in the
payment of termination benefits.
(iv) Short-term employee benefits
The Group recognizes the expected cost of short-term compensation in the form of paid leave whose rights accrue
as employees render the services that entitle them to receive it. If the leave is not accrued, the expense is recognized
as the leave is taken.
The Group recognizes the expected cost of profit sharing or employee incentive plans when there is a present legal
or constructive obligation as a result of past events and a reliable estimate can be made of the value of the obligation.
(v) Share-based payments
The Group has granted different remuneration plans based on equity instruments to certain members of the
management team who are rendering service to the company, which will be settled with equity instruments or cash,
depending on the plan.
The equity instruments granted become vested when the employees complete a certain period of service and meet
the objectives established in the incentive plan. Grifols recognizes the services received from its employees as such
services are rendered during the vesting period as a personnel expense in the consolidated income statement and a
corresponding increase in equity if the transaction is equity-settled or a corresponding liability if the transaction is
cash-settled, at an amount based on the value of the equity instruments.
In transactions with employees that are equity-settled, the amount recognized corresponds to the amount that will
be settled once the agreed conditions are met and will not be reviewed or revalued during the vesting period, as the
commitment is equity-settled. If an employee resigns from his or her position before the end of the vesting period,
he or she will only receive the agreed share-based incentive. The fair value of services received is estimated by
estimating the fair value of the shares granted at the grant date, net of estimated dividends to which the employee is
not entitled, during the performance period.
For plans that are settled in cash, the services received and the corresponding liability are recognized at the fair value
of the liability, referring to the date on which the requirements for recognition are met. Subsequently, and until
settlement, the corresponding liability is measured at its fair value at the closing date of each year, with any changes
in valuation occurring during the year being recognized in the consolidated income statement. The fair value is
determined by reference to the market value of the shares at the date of the estimate, net of estimated dividends to
which the employee is not entitled, during the performance period.
(o) Provisions
Provisions are recognized when the Group has a present legal or constructive obligation as a result of a past event,
it is probable that an outflow of resources embodying economic benefits will be required to settle the obligation and
a reliable estimate can be made of the amount of the obligation. Provisions are not recognized for future operating
losses.
The amount of the provision corresponds to the best estimate at the closing date of the disbursements required to
settle the present obligation, after taking into account the risks and uncertainties related to the provision and, when |
| GRIFOLS, S.A. AND SUBSIDIARIES
Notes to the Condensed Consolidated Interim Financial Statements for the
twelve-month period ended 31 December 2023
(in thousand Euros)
(Free translation from the original in Spanish. In the event of discrepancy, the Spanish-language version prevails)
33
significant, the financial effect of discounting, provided that the disbursements to be made in each period can be
reliably determined.
(p) Revenue recognition
Revenue from the sale of goods or services is recognized at an amount that reflects the consideration the Group
expects to be entitled to receive in exchange for transferring goods or services to a customer, at the time the customer
obtains control of the goods or services rendered, i.e. when the customer has the ability to direct the use of the goods
or services. The consideration committed in a contract with a customer may include fixed amounts, variable
amounts, or both. The amount of consideration may vary due to discounts, rebates, incentives, performance bonuses,
penalties or other similar items. Contingent consideration is only included in the transaction price when it is highly
probable that the amount of revenue recognized will not be subject to significant future reversals. Revenue is
presented net of value added tax and any other amounts or taxes, which in substance correspond to amounts received
on behalf of third parties.
(i) Sales of goods
Revenue from the sale of goods is recognized when the Group satisfies the performance obligation by transferring
the committed goods to the customer. An asset is transferred when the customer obtains control of that asset. In
assessing the satisfaction of the performance obligation, the Group considers the following indicators of the transfer
of control, which include, but are not limited to, the following:
• The Group has a present right to payment for the asset.
• The customer has the legal right to the asset
• The Group has transferred the physical possession of the asset
• Customer has the significant risks and rewards of asset ownership
• The customer has accepted the asset
The nature of the assets that the Group undertakes to transfer are mainly: sale of goods, sale of equipment, toll
contracts, maintenance and technical service contracts, training, licenses, royalties and know-how and engineering
contracts, among others.
In determining the transaction price, it is assumed that the goods and/or services are transferred in accordance with
the terms of the contract. The consideration committed to a customer may include fixed amounts, variable amounts,
or both. The price should be estimated taking into account the effect of variable consideration (as applicable) for
returns, chargebacks/volume discounts or other incentives, provided that the same is highly probable.
The Group participates in state Medicaid programs in the United States. Provision for Medicaid rebates is recorded
at the time the sale is recorded in an amount equal to the estimated Medicaid rebate claims attributable to such sale.
The Group determines the estimate of the accrual for Medicaid rebates primarily based on historical Medicaid rebate
experience, legal interpretations of applicable laws related to the Medicaid program and any new information
regarding changes in Medicaid program guidelines and regulations that could affect the amount of the rebates. The
Group considers pending Medicaid claims, Medicaid payments, and inventory levels in the distribution channel and
adjusts the provision periodically to reflect actual experience. Although rebate payments typically occur with a lag
of one to two quarters, adjustments for actual experience have not been material.
As is standard industry practice, certain customers have entered into contracts with the Group for purchases that are
eligible for a price discount based on a minimum purchase quantity, volume discounts or cash discounts. These
discounts are accounted for as a reduction in sales and accounts receivable in the same month in which the sales are
invoiced based on a combination of the customer's actual purchase data and historical experience when the
customer's actual purchase data is later known. |
| GRIFOLS, S.A. AND SUBSIDIARIES
Notes to the Condensed Consolidated Interim Financial Statements for the
twelve-month period ended 31 December 2023
(in thousand Euros)
(Free translation from the original in Spanish. In the event of discrepancy, the Spanish-language version prevails)
34
In the United States, the Group enters into agreements with certain customers to establish contractual prices for
products, which these entities purchase from the authorized wholesaler or distributor (collectively, "wholesalers")
of their choice. Accordingly, when these entities purchase the products from the wholesalers at the contractual price
which is lower than the price charged by the Group to the wholesaler, the Group provides the wholesaler with a
credit known as a chargeback. The Group accounts for the accrual of chargebacks at the time of sale. The allowance
account for chargebacks is based on the Group's estimate of the wholesaler's inventory levels and the expected direct
sale of the products by the wholesalers at the contract price based on past chargeback history and other factors. The
Group periodically monitors factors influencing the estimation for rebates and applies adjustments when it believes
that actual rebates may differ from the established allowance accounts. These adjustments occur over a relatively
short period of time. As these refunds are typically settled within 30 to 45 days of sale, adjustments for actual
amounts have not been material.
The amount at closing for the remaining discounts is settled in the following year within 90 to 180 days depending
on the type of provision.
(ii) Provision of services
Revenue from the rendering of services is recognized over time provided that the following criteria are met (i) the
client simultaneously receives and consumes the benefits provided by Grifols' activity as it is carried out, (ii) Grifols
produces or improves an asset that the client controls as the asset is produced and (iii) Grifols produces a specific
asset for the client, to which cannot give an alternative use, and has an enforceable right of collection of the activity
carried out so far. If the performance obligation is fulfilled over time, income is recognized as it is satisfied
considering the percentage of completion. If the performance obligation does not meet the above conditions, the
following indicators are evaluated to determine that control of the asset has been transferred to the client: (i) through
physical possession of the asset where Grifols has the right to demand payment for it and (ii) the client has accepted
the asset, the significant risks and rewards inherent in ownership of the asset and has legal title. If the performance
obligation is met on a specific date, the corresponding revenue is recognized on that date.
(q) Income tax
The income tax expense or tax credit for the year comprises both current tax and deferred tax.
Current tax is the amount payable on the taxable income for the current year based on the applicable tax rate for
each jurisdiction. It is calculated on the basis of the laws enacted or about to be enacted at the balance sheet date in
the countries where subsidiaries and associates operate and generate taxable income. The Group periodically
evaluates the positions taken in tax returns with respect to situations where the applicable tax regulations are subject
to interpretation and considers such uncertainty in uncertain tax treatments when determining the corresponding tax
gain or loss, tax bases, unused tax credits or tax rates.
Deferred taxes are recognized on temporary differences arising between the tax bases of assets and liabilities and
their carrying amounts in the condensed consolidated interim financial statements. It is determined using tax rates
(and laws) enacted or about to be enacted at the balance sheet date that are expected to apply when the related
deferred tax asset is realized or the deferred tax liability is settled.
Deferred tax liabilities and assets are recognized:
• Recognition of deferred tax liabilities:
The Group recognizes deferred tax liabilities in all cases except that:
o arise from the initial recognition of goodwill or an asset or liability in a transaction that is not a business
combination, on the date of the transaction it does not affect either the accounting result or the taxable |
| GRIFOLS, S.A. AND SUBSIDIARIES
Notes to the Condensed Consolidated Interim Financial Statements for the
twelve-month period ended 31 December 2023
(in thousand Euros)
(Free translation from the original in Spanish. In the event of discrepancy, the Spanish-language version prevails)
35
base and on the date of the transaction taxable and deductible temporary differences do not arise for
the same amount.
o correspond to differences related to investments in subsidiaries, associates and joint ventures over
which the Group has the ability to control the timing of their reversal and it is not probable that their
reversal will occur in the foreseeable future.
• Recognition of deferred tax assets:
The Group recognizes deferred tax assets whenever:
o it is probable that there will be sufficient future tax profits to offset them or when tax legislation
contemplates the possibility of future conversion of deferred tax assets into a claim payable against the
Public Administration. However, the assets that arise from the initial recognition of assets or liabilities
in a transaction that is not a business combination, on the date of the transaction do not affect either
the accounting result or the taxable base and on the date of the transaction do not taxable and deductible
temporary differences arise for the same amount, they are not recognized.
o correspond to temporary differences related to investments in subsidiaries, associates and joint
ventures to the extent that the temporary differences will reverse in the foreseeable future and positive
future tax profits are expected to be generated to offset the differences.
Deferred tax assets and liabilities are not recognized for temporary differences between the carrying amount and tax
base of investments in foreign operations when the company is able to control the date on which the temporary
differences will reverse and it is probable that the temporary differences will not reverse in the foreseeable future.
Likewise, deferred tax liabilities are not recognized if they arise from the initial recognition of goodwill. Lastly,
deferred tax assets are only recognized if it is probable that sufficient future taxable profit will be available against
which they can be utilized.
Deferred tax assets and liabilities are offset when there is a legally enforceable right to offset current tax assets and
liabilities and when the deferred tax balances relate to the same taxation authority. Current tax assets and liabilities
are offset when the entity has a legally enforceable right to offset and intends either to settle on a net basis or to
realize the asset and settle the liability simultaneously.
Current or deferred income tax is recognized in profit or loss, unless it arises from a transaction or economic event
that has been recognized in other comprehensive income or directly in equity. In such cases, the tax is also recognized
in other comprehensive income or directly in equity, respectively.
(r) Segment reporting
An operating segment is a component of the Group that engages in business activities from which it may earn
revenues and incur expenses, whose operating results are regularly reviewed by the Group's chief operating decision
maker in order to decide on the resources to be allocated to the segment, evaluate its performance and for which
discrete financial information is available.
(s) Environment
The Group carries out operations whose main purpose is to prevent, reduce or repair damage to the environment as
a result of its activities.
Items of property, plant and equipment acquired for the purpose of being used on a lasting basis in its activity and
whose main purpose is the minimization of environmental impact and the protection and improvement of the |

| GRIFOLS, S.A. AND SUBSIDIARIES
Notes to the Condensed Consolidated Interim Financial Statements for the
twelve-month period ended 31 December 2023
(in thousand Euros)
(Free translation from the original in Spanish. In the event of discrepancy, the Spanish-language version prevails)
36
environment, including the reduction or elimination of future pollution from the Group's operations, are recognized
as assets through the application of measurement, presentation and disclosure criteria consistent with those
mentioned in note 4(e).
(t) Non-current assets held for sale
The criteria for held for sale classification is regarded as met only when the Group determines the sale to be highly
probable, management is committed to a decision to sell and all actions required to complete the sale indicate that it
is unlikely that significant changes to the sale will be made or that the decision will be withdrawn. These assets are
measured at the lower of their carrying value and fair value less costs for its alienation. Once classified as held for
sale they are no longer depreciated or amortized.
In addition, the asset or disposal group is available for immediate sale in its present condition (subject only to terms
that are usual and customary for such transactions) and the sale is expected to be completed within one year from
the date of the classification. In case of having some delays caused by events or circumstances outside Grifols control
and there is sufficient evidence of this commitment to sell, the Group will present those assets as “Non-current assets
held for sale”.
The non-current assets held for sale are presented separately in the statement of financial position as “Non-current
assets and disposal groups held for sale” and “Liabilities associated with non-current assets and disposal groups held
for sale” for the liabilities, if exist.
Additionally, the Group considers as discontinued operations the components (cash-generating units) which
represent a separate major line of business or geographic area, that is significant and can be considered separately
from the rest, which are sold or disposed in an alternative way or meet the requirements to be presented as held for
sale. Likewise, it is considered as discontinued operations those entities acquired exclusively with the finality to be
resold. The result after taxes of these discontinued operations are presented in a unique line in the consolidated
statement of profit and loss, as “Result from discontinued operations after tax”.
(5) Segment Reporting
In accordance with IFRS 8 “Operating Segments”, financial information for operating segments is reported in the
accompanying Appendix II, which forms an integral part of this note to the condensed consolidated interim financial
statements.
Group companies are divided into four areas: companies from the industrial area, companies from the commercial
area, companies from the services area and companies from the research area. Within each of these areas, activities
are organized based on the nature of the products and services manufactured and marketed.
Assets, liabilities, income and expenses for segments include directly and reliably attributable items. Items which are
not attributed to segments by the Group are:
• Balance sheet: equity, cash and cash equivalents and loans and borrowings.
• Statement of profit and loss: finance result and income tax.
(a) Operating segments
The operating segments defined by the Steering Committee are as follows:
• Biopharma (formerly Bioscience): concentrates all activities related to products derived from human plasma for
therapeutic use. |

| GRIFOLS, S.A. AND SUBSIDIARIES
Notes to the Condensed Consolidated Interim Financial Statements for the
twelve-month period ended 31 December 2023
(in thousand Euros)
(Free translation from the original in Spanish. In the event of discrepancy, the Spanish-language version prevails)
37
• Diagnostic: including the marketing of diagnostic testing equipment, reagents and other equipment,
manufactured by Group or other companies.
• Bio Supplies: this groups together transactions related to biological products for non-therapeutic use. The part
relating to sales of plasma to third parties has been reclassified from Bio Supplies to Other.
• Others: includes the provision of manufacturing services to third parties, plasma sales to third parties and research
activities. It also includes pharmaceutical products manufactured by the Group and intended for hospital
pharmacies, as well as the marketing of products that complement the Group's own products.
Details of sales by groups of products for the twelve-month period ended 31 December 2023, 2022 and 2021 are
as follows:
31/12/2023 31/12/2022 31/12/2021 (*)
Haemoderivatives 5,558,301 5,005,382 3,814,983
Transfusional medicine 648,479 640,604 712,238
Other diagnostic 21,790 21,740 23,625
159,957 146,076 115,811
Others 203,450 250,165 266,461
6,591,977 6,063,967 4,933,118
* As a consequence of the review of transactions and balances allocations by segments made in the year 2022, the
comparative figures for the fiscal year 2021 was adjusted accordingly.
Thousands of Euros
Bio supplies
Total
Biopharma
Diagnostic
At 31 December 2023, 98.0% of the income from the sale of goods and services has been recognized at a certain
point-in-time (97.6% in 2022 and 97.4% in 2021).
As of 31 December 2023, 82.8% of revenue from the sale of goods and services was made to the end customer
(85.1% in 2022 and 81.3% in 2021), with the rest being sales to distributors.
The Group has concluded that hemoderivative products are sufficiently alike to be considered as a whole for the
following reasons:
• All these products are human plasma derivatives and are manufactured in a similar way.
• The customers and methods used to distribute these products are similar.
• All these products are subject to the same regulations regarding production and the same regulatory
environment.
(b) Geographical information
Geographical information is grouped into four areas:
• United States of America and Canada
• Spain
• Rest of the European Union
• Rest of the world
The definition of these four segments is mainly due to the geographical level that Group management sets to
manage its revenue as they respond to specific economic scenarios. The main framework of the Group is |
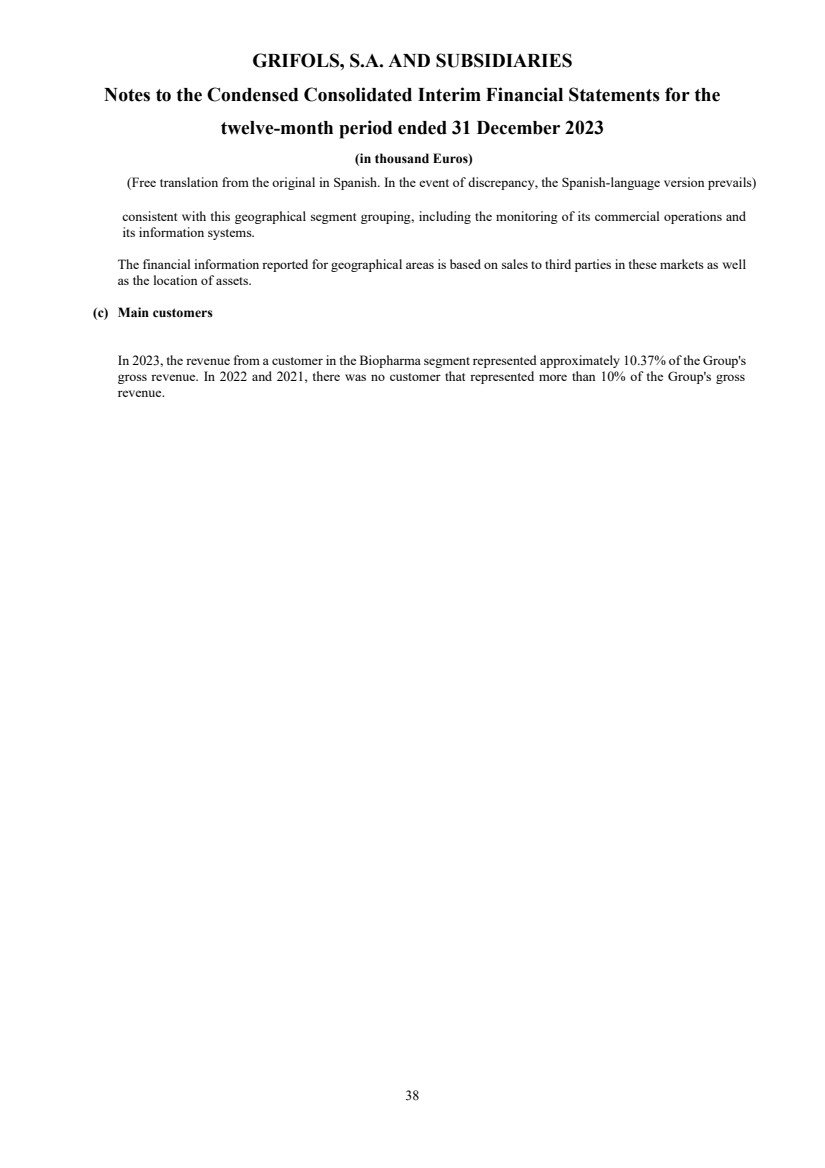
| GRIFOLS, S.A. AND SUBSIDIARIES
Notes to the Condensed Consolidated Interim Financial Statements for the
twelve-month period ended 31 December 2023
(in thousand Euros)
(Free translation from the original in Spanish. In the event of discrepancy, the Spanish-language version prevails)
38
consistent with this geographical segment grouping, including the monitoring of its commercial operations and
its information systems.
The financial information reported for geographical areas is based on sales to third parties in these markets as well
as the location of assets.
(c) Main customers
In 2023, the revenue from a customer in the Biopharma segment represented approximately 10.37% of the Group's
gross revenue. In 2022 and 2021, there was no customer that represented more than 10% of the Group's gross
revenue. |
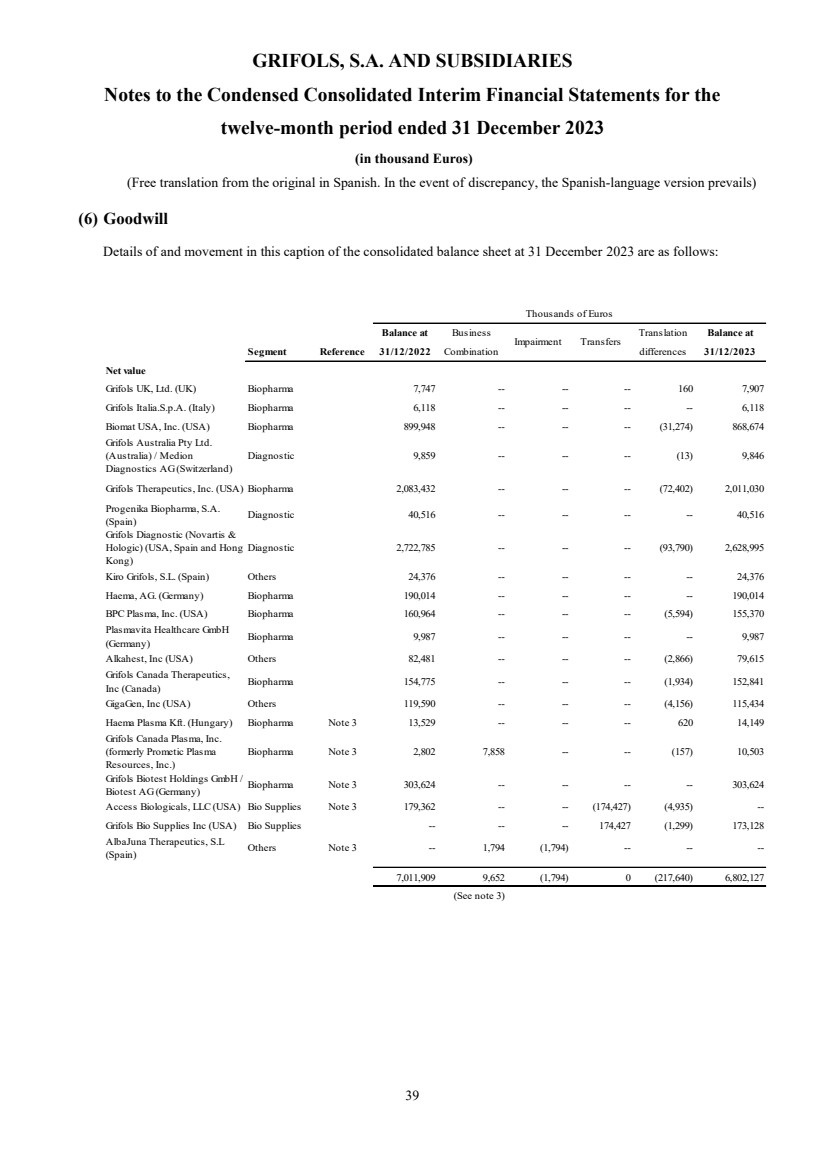
| GRIFOLS, S.A. AND SUBSIDIARIES
Notes to the Condensed Consolidated Interim Financial Statements for the
twelve-month period ended 31 December 2023
(in thousand Euros)
(Free translation from the original in Spanish. In the event of discrepancy, the Spanish-language version prevails)
39
(6) Goodwill
Details of and movement in this caption of the consolidated balance sheet at 31 December 2023 are as follows:
Balance at Business Translation Balance at
Segment Reference 31/12/2022 Combination differences 31/12/2023
Net value
Grifols UK, Ltd. (UK) Biopharma 7,747 -- -- -- 160 7,907
Grifols Italia.S.p.A. (Italy) Biopharma 6,118 -- -- -- -- 6,118
Biomat USA, Inc. (USA) Biopharma 899,948 -- -- -- (31,274) 868,674
Grifols Australia Pty Ltd.
(Australia) / Medion
Diagnostics AG (Switzerland)
Diagnostic 9,859 -- -- -- (13) 9,846
Grifols Therapeutics, Inc. (USA) Biopharma 2,083,432 -- -- -- (72,402) 2,011,030
Progenika Biopharma, S.A.
(Spain) Diagnostic 40,516 -- -- -- -- 40,516
Grifols Diagnostic (Novartis &
Hologic) (USA, Spain and Hong
Kong)
Diagnostic 2,722,785 -- -- -- (93,790) 2,628,995
Kiro Grifols, S.L. (Spain) Others 24,376 -- -- -- -- 24,376
Haema, AG. (Germany) Biopharma 190,014 -- -- -- -- 190,014
BPC Plasma, Inc. (USA) Biopharma 160,964 -- -- -- (5,594) 155,370
Plasmavita Healthcare GmbH
(Germany)
Biopharma 9,987 -- -- -- -- 9,987
Alkahest, Inc (USA) Others 82,481 -- -- -- (2,866) 79,615
Grifols Canada Therapeutics,
Inc (Canada) Biopharma 154,775 -- -- -- (1,934) 152,841
GigaGen, Inc (USA) Others 119,590 -- -- -- (4,156) 115,434
Haema Plasma Kft. (Hungary) Biopharma Note 3 13,529 -- -- -- 620 14,149
Grifols Canada Plasma, Inc.
(formerly Prometic Plasma
Resources, Inc.)
Biopharma Note 3 2,802 7,858 -- -- (157) 10,503
Grifols Biotest Holdings GmbH /
Biotest AG (Germany)
Biopharma Note 3 303,624 -- -- -- -- 303,624
Access Biologicals, LLC (USA) Bio Supplies Note 3 179,362 -- -- (174,427) (4,935) --
Grifols Bio Supplies Inc (USA) Bio Supplies -- -- -- 174,427 (1,299) 173,128
AlbaJuna Therapeutics, S.L
(Spain) Others Note 3 -- 1,794 (1,794) -- -- --
7,011,909 9,652 (1,794) 0 (217,640) 6,802,127
(See note 3)
Thousands of Euros
Impairment Transfers |
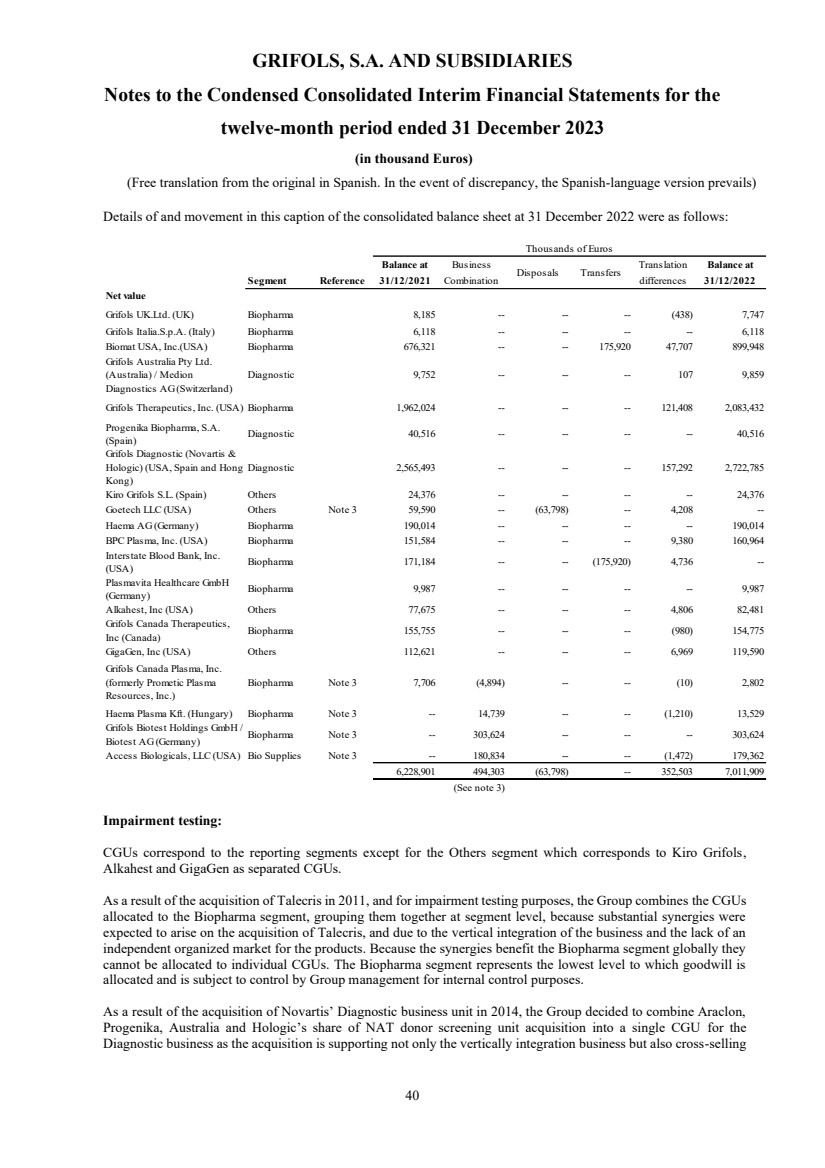
| GRIFOLS, S.A. AND SUBSIDIARIES
Notes to the Condensed Consolidated Interim Financial Statements for the
twelve-month period ended 31 December 2023
(in thousand Euros)
(Free translation from the original in Spanish. In the event of discrepancy, the Spanish-language version prevails)
40
Details of and movement in this caption of the consolidated balance sheet at 31 December 2022 were as follows:
Balance at Business Translation Balance at
Segment Reference 31/12/2021 Combination differences 31/12/2022
Net value
Grifols UK.Ltd. (UK) Biopharma 8,185 -- -- -- (438) 7,747
Grifols Italia.S.p.A. (Italy) Biopharma 6,118 -- -- -- -- 6,118
Biomat USA, Inc.(USA) Biopharma 676,321 -- -- 175,920 47,707 899,948
Grifols Australia Pty Ltd.
(Australia) / Medion
Diagnostics AG (Switzerland)
Diagnostic 9,752 -- -- -- 107 9,859
Grifols Therapeutics, Inc. (USA) Biopharma 1,962,024 -- -- -- 121,408 2,083,432
Progenika Biopharma, S.A.
(Spain) Diagnostic 40,516 -- -- -- -- 40,516
Grifols Diagnostic (Novartis &
Hologic) (USA, Spain and Hong
Kong)
Diagnostic 2,565,493 -- -- -- 157,292 2,722,785
Kiro Grifols S.L. (Spain) Others 24,376 -- -- -- -- 24,376
Goetech LLC (USA) Others Note 3 59,590 -- (63,798) -- 4,208 --
Haema AG (Germany) Biopharma 190,014 -- -- -- -- 190,014
BPC Plasma, Inc. (USA) Biopharma 151,584 -- -- -- 9,380 160,964
Interstate Blood Bank, Inc.
(USA) Biopharma 171,184 -- -- (175,920) 4,736 --
Plasmavita Healthcare GmbH
(Germany)
Biopharma 9,987 -- -- -- -- 9,987
Alkahest, Inc (USA) Others 77,675 -- -- -- 4,806 82,481
Grifols Canada Therapeutics,
Inc (Canada) Biopharma 155,755 -- -- -- (980) 154,775
GigaGen, Inc (USA) Others 112,621 -- -- -- 6,969 119,590
Grifols Canada Plasma, Inc.
(formerly Prometic Plasma
Resources, Inc.)
Biopharma Note 3 7,706 (4,894) -- -- (10) 2,802
Haema Plasma Kft. (Hungary) Biopharma Note 3 -- 14,739 -- -- (1,210) 13,529
Grifols Biotest Holdings GmbH /
Biotest AG (Germany) Biopharma Note 3 -- 303,624 -- -- -- 303,624
Access Biologicals, LLC (USA) Bio Supplies Note 3 -- 180,834 -- -- (1,472) 179,362
6,228,901 494,303 (63,798) -- 352,503 7,011,909
(See note 3)
Transfers
Thousands of Euros
Disposals
Impairment testing:
CGUs correspond to the reporting segments except for the Others segment which corresponds to Kiro Grifols,
Alkahest and GigaGen as separated CGUs.
As a result of the acquisition of Talecris in 2011, and for impairment testing purposes, the Group combines the CGUs
allocated to the Biopharma segment, grouping them together at segment level, because substantial synergies were
expected to arise on the acquisition of Talecris, and due to the vertical integration of the business and the lack of an
independent organized market for the products. Because the synergies benefit the Biopharma segment globally they
cannot be allocated to individual CGUs. The Biopharma segment represents the lowest level to which goodwill is
allocated and is subject to control by Group management for internal control purposes.
As a result of the acquisition of Novartis’ Diagnostic business unit in 2014, the Group decided to combine Araclon,
Progenika, Australia and Hologic’s share of NAT donor screening unit acquisition into a single CGU for the
Diagnostic business as the acquisition is supporting not only the vertically integration business but also cross-selling |

| GRIFOLS, S.A. AND SUBSIDIARIES
Notes to the Condensed Consolidated Interim Financial Statements for the
twelve-month period ended 31 December 2023
(in thousand Euros)
(Free translation from the original in Spanish. In the event of discrepancy, the Spanish-language version prevails)
41
opportunities. In addition, for management purposes, the Group’s management is focused on the business more than
geographical areas or individual companies.
The Hospital division is no longer a reportable segment since it does not meet any of the quantitative thresholds
described in IFRS 8 Operating Segments. The segment information included in the Hospital CGU in previous years
is currently grouped into an Others segment.
In addition, due to the acquisition of the remaining 51% stake in Access Biologicals, a new CGU for the Bio Supplies
business was identified (see note 3).
The CGUs established by Grifols management are:
• Biopharma
• Diagnostic
• Bio Supplies
• Kiro Grifols
• GigaGen
• Alkahest
Alkahest's goodwill was generated as a counterpart to the deferred tax liability corresponding to the intangible assets
recognized as a result of the allocation of the excess purchase price over the acquired net assets.
The recoverable amount of the Biopharma CGU and Bio Supplies CGU has been calculated based on its value in use
calculated as the present value of the five-year future cash flows discounted at a discount rate considering the related
inherent risk.
The recoverable amount of the Diagnostic CGU has been calculated based on its fair value less costs to sell calculated
as the present value of future cash flows approved by Management discounted at a discount rate considering the
inherent risk. Due to the reorganization to boost the business units, a long- term strategic plan was approved in order
to transform the Diagnostic business unit by investments which will lead to a beyond five-year growth. Consequently,
management has estimated future cash flows for the period 2024-2034.
The recoverable amount of the Kiro Grifols CGU has been calculated based on its fair value less costs to sell
calculated as the present value of the five-year cash flows discounted at a discount rate considering the related
inherent risk.
For the calculation of the recoverable amount, management has considered:
• Gross margin based on historical performance and actual situation
• Development prospects in the international market
• Current investments
• Investments which will imply a significant growth of the production capacity for those cases whose fair
value has been considered
Cash flows estimated as of the year in which stable growth in the CGU has been reached are extrapolated using the
estimated growth rates indicated below. Perpetual growth rates are consistent with the forecasts included in industry
reports.
The recoverable amount of the GigaGen CGU has been determined based on the fair value less costs to sell, calculated
as the present value of the future cash flows mainly of a research and development project that have been approved
by management, adjusted by the probability of success and discounted at a discount rate that includes their inherent
risk. Cash flows have been estimated taking into consideration a useful life of 20 years from the product launch and
their reduction as of the sixth year. |

| GRIFOLS, S.A. AND SUBSIDIARIES
Notes to the Condensed Consolidated Interim Financial Statements for the
twelve-month period ended 31 December 2023
(in thousand Euros)
(Free translation from the original in Spanish. In the event of discrepancy, the Spanish-language version prevails)
42
The key assumptions used in calculating impairment testing of the CGUs for 2023 have been as follows:
Additionally, the following key assumptions have been used for the GigaGen CGU impairment testing:
Likewise, for the impairment test of the Diagnostic CGU, the sales of Nucleic Acid Test (NAT), Blood Typing
Solution (BTS) and those of the Clinical Diagnostic have been considered as key assumptions.
The discount rate used reflects specific risks relating to the CGUs and the countries in which they operate. The main
assumptions used for determining the discount rate are as follows:
• Risk free rate: normalized government bonds at 10 years
• Market risk premium: premium based on market research
• Unlevered beta: average market beta
• Debt to equity ratio: average market ratio
The key assumptions used in calculating impairment testing of the CGUs for 2022 were as follows:
Perpetual Growth rate Pre-tax discount rate
Biopharma 1.9% 10.9%
Diagnostic 1.9% 9.7%
Bio Supplies 1.9% 10.9%
Kiro Grifols 1.5% 11.6%
GigaGen N/A 19.6%
Likewise, for the impairment test of the Diagnostic CGU, the sales of Blood Typing Solution (BTS) and those of the
Clinical Diagnostic were considered as key assumptions.
Additionally, the following key assumptions were used for the GigaGen CGU impairment testing:
Sink rate Success rate
GigaGen 5.0% 20.0%
Perpetual Growth rate Pre-tax discount rate
Biopharma 2.0% 11.3%
Diagnostic 2.0% 10.1%
Bio Supplies 2.0% 11.4%
Kiro Grifols 1.6% 12.0%
GigaGen N/A 19.8%
Sink rate Success rate
GigaGen 5.0% 20.0% |

| GRIFOLS, S.A. AND SUBSIDIARIES
Notes to the Condensed Consolidated Interim Financial Statements for the
twelve-month period ended 31 December 2023
(in thousand Euros)
(Free translation from the original in Spanish. In the event of discrepancy, the Spanish-language version prevails)
43
In 2023, and according to the current economic context, the reasonably possible changes considered for the CGUs
impairment testing are a variation in the discount rate, as well as in the estimated perpetual growth rate, with
independent movements of each other, as follows:
Additionally, for the impairment test of the Diagnostic CGU, the following sensitivity scenarios to variations in sales
of the NAT, BTS and CDx business lines have also been considered:
• NAT sales sensitivity scenario: a lower sales projection than initially projected has been estimated by
approximately 9% on average each year.
• BTS sales sensitivity scenario: a lower sales projection than initially projected has been estimated by
approximately 17% on average each year.
• CDx sales sensitivity scenario: a projection has been estimated so that CDx sales from 2030 onwards
represent on average approximately 66% of the initially estimated sales.
• Aggregate sensitivity scenario to NAT, BTS and CDx sales: a scenario has been estimated as a result of the
previous sensitivity scenarios.
In addition, the following reasonably possible change has been considered for the GigaGen CGU impairment testing:
The reasonably possible changes in key assumptions considered by management in the calculation of the recoverable
amount of the Biopharma, Bio Supplies, Kiro Grifols and GigaGen CGU’s would not cause the carrying amount to
exceed its recoverable amount.
The reasonably possible changes in key assumptions considered by management in the calculation of the Diagnostic
CGU recoverable amount would cause the carrying amount to exceed its recoverable amount as follows:
Detail of the assets by segment value is shown in Annex II.
In 2022, the reasonably possible changes considered for the CGUs impairment testing were a variation in the discount
rate, as well as in the estimated perpetual growth rate, with independent movements of each other, as follows:
Perpetual Growth rate Pre-tax discount rate
Biopharma +/- 50 bps +/- 50 bps
Diagnostic +/- 50 bps +/- 50 bps
Bio Supplies +/- 50 bps +/- 50 bps
Kiro Grifols +/- 50 bps +/- 50 bps
GigaGen N/A +/- 100 bps
Perpetual Growth rate Pre-tax discount rate
Biopharma +/- 50 bps +/- 50 bps
Diagnostic +/- 50 bps +/- 100 bps
Bio Supplies +/- 50 bps +/- 50 bps
Kiro Grifols +/- 50 bps +/- 50 bps
GigaGen N/A +/- 200 bps GigaGen
Sink rate
+/- 100 bps
% Asset Value
Aggregate sensitivity scenario to NAT, BTS and CDx sales -4% |
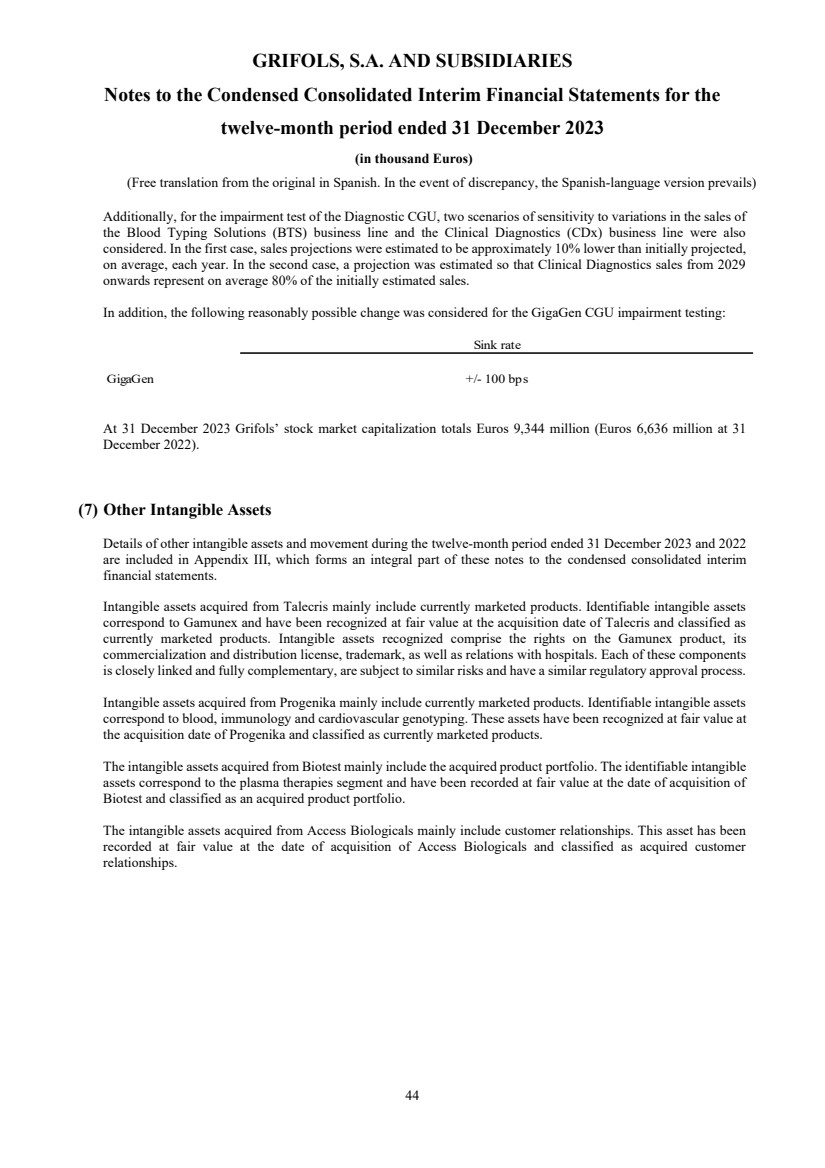
| GRIFOLS, S.A. AND SUBSIDIARIES
Notes to the Condensed Consolidated Interim Financial Statements for the
twelve-month period ended 31 December 2023
(in thousand Euros)
(Free translation from the original in Spanish. In the event of discrepancy, the Spanish-language version prevails)
44
Additionally, for the impairment test of the Diagnostic CGU, two scenarios of sensitivity to variations in the sales of
the Blood Typing Solutions (BTS) business line and the Clinical Diagnostics (CDx) business line were also
considered. In the first case, sales projections were estimated to be approximately 10% lower than initially projected,
on average, each year. In the second case, a projection was estimated so that Clinical Diagnostics sales from 2029
onwards represent on average 80% of the initially estimated sales.
In addition, the following reasonably possible change was considered for the GigaGen CGU impairment testing:
GigaGen
Sink rate
+/- 100 bps
At 31 December 2023 Grifols’ stock market capitalization totals Euros 9,344 million (Euros 6,636 million at 31
December 2022).
(7) Other Intangible Assets
Details of other intangible assets and movement during the twelve-month period ended 31 December 2023 and 2022
are included in Appendix III, which forms an integral part of these notes to the condensed consolidated interim
financial statements.
Intangible assets acquired from Talecris mainly include currently marketed products. Identifiable intangible assets
correspond to Gamunex and have been recognized at fair value at the acquisition date of Talecris and classified as
currently marketed products. Intangible assets recognized comprise the rights on the Gamunex product, its
commercialization and distribution license, trademark, as well as relations with hospitals. Each of these components
is closely linked and fully complementary, are subject to similar risks and have a similar regulatory approval process.
Intangible assets acquired from Progenika mainly include currently marketed products. Identifiable intangible assets
correspond to blood, immunology and cardiovascular genotyping. These assets have been recognized at fair value at
the acquisition date of Progenika and classified as currently marketed products.
The intangible assets acquired from Biotest mainly include the acquired product portfolio. The identifiable intangible
assets correspond to the plasma therapies segment and have been recorded at fair value at the date of acquisition of
Biotest and classified as an acquired product portfolio.
The intangible assets acquired from Access Biologicals mainly include customer relationships. This asset has been
recorded at fair value at the date of acquisition of Access Biologicals and classified as acquired customer
relationships. |
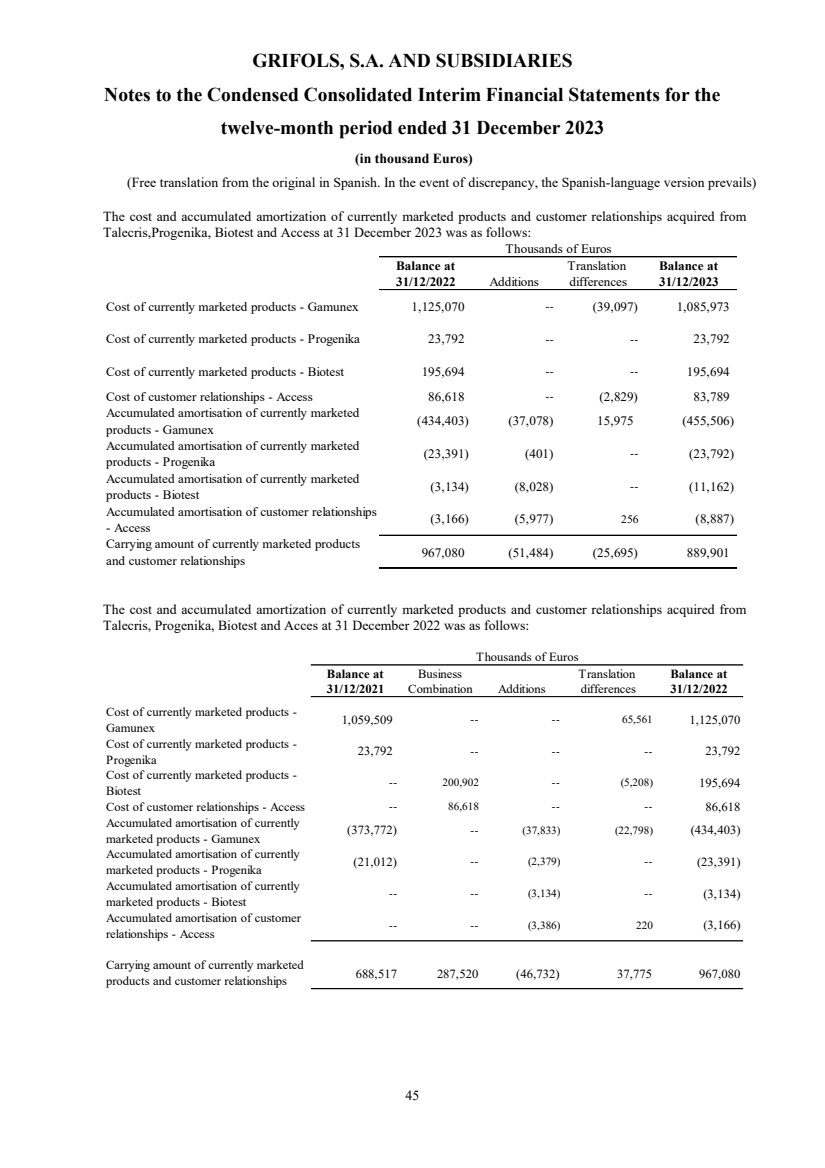
| GRIFOLS, S.A. AND SUBSIDIARIES
Notes to the Condensed Consolidated Interim Financial Statements for the
twelve-month period ended 31 December 2023
(in thousand Euros)
(Free translation from the original in Spanish. In the event of discrepancy, the Spanish-language version prevails)
45
The cost and accumulated amortization of currently marketed products and customer relationships acquired from
Talecris,Progenika, Biotest and Access at 31 December 2023 was as follows:
Balance at Translation Balance at
31/12/2022 Additions differences 31/12/2023
Cost of currently marketed products - Gamunex 1,125,070 -- (39,097) 1,085,973
Cost of currently marketed products - Progenika 23,792 -- -- 23,792
Cost of currently marketed products - Biotest 195,694 -- -- 195,694
Cost of customer relationships - Access 86,618 -- (2,829) 83,789
Accumulated amortisation of currently marketed
products - Gamunex (434,403) (37,078) 15,975 (455,506)
Accumulated amortisation of currently marketed
products - Progenika (23,391) (401) -- (23,792)
Accumulated amortisation of currently marketed
products - Biotest (3,134) (8,028) -- (11,162)
Accumulated amortisation of customer relationships
- Access (3,166) (5,977) 256 (8,887)
Carrying amount of currently marketed products
and customer relationships 967,080 (51,484) (25,695) 889,901
Thousands of Euros
The cost and accumulated amortization of currently marketed products and customer relationships acquired from
Talecris, Progenika, Biotest and Acces at 31 December 2022 was as follows:
Balance at Business Translation Balance at
31/12/2021 Combination Additions differences 31/12/2022
Cost of currently marketed products -
Gamunex 1,059,509 -- -- 65,561 1,125,070
Cost of currently marketed products -
Progenika 23,792 -- -- -- 23,792
Cost of currently marketed products -
Biotest
-- 200,902 -- (5,208) 195,694
Cost of customer relationships - Access -- 86,618 -- -- 86,618
Accumulated amortisation of currently
marketed products - Gamunex (373,772) -- (37,833) (22,798) (434,403)
Accumulated amortisation of currently
marketed products - Progenika (21,012) -- (2,379) -- (23,391)
Accumulated amortisation of currently
marketed products - Biotest
-- -- (3,134) -- (3,134)
Accumulated amortisation of customer
relationships - Access
-- -- (3,386) 220 (3,166)
Carrying amount of currently marketed
products and customer relationships 688,517 287,520 (46,732) 37,775 967,080
Thousands of Euros |
| GRIFOLS, S.A. AND SUBSIDIARIES
Notes to the Condensed Consolidated Interim Financial Statements for the
twelve-month period ended 31 December 2023
(in thousand Euros)
(Free translation from the original in Spanish. In the event of discrepancy, the Spanish-language version prevails)
46
The estimated useful life of the currently marketed products acquired from Talecris is considered limited, has been
estimated at 30 years on the basis of the expected life cycle of the product (Gamunex) and is amortized on a straight-line basis.
At 31 December 2023 the residual useful life of currently marketed products is 17 years and 5 months (18 years and
5 months at 31 December 2022).
The estimated useful life of the currently marketed products acquired from Progenika is considered limited, has been
estimated at 10 years on the basis of the expected life cycle of the product and is amortized on a straight-line basis.
In 2023 the currently marketed products reached the end of their useful life.
The estimated useful life of the product portfolio acquired from Biotest is considered limited and has been estimated
at 30 years, based on the expected life cycle of the products. The amortization method is linear.
The estimated useful life of the customer relationships acquired from Access Biologicals is considered limited and
has been estimated at 14 years, based on the rate of decline of the same. The amortization method is linear.
(a) Self – constructed intangible assets
At 31 December 2023 the Group has recognized Euros 50,043 thousand as self – constructed intangible assets
(Euros 37,214 thousand at 31 December 2022) in the consolidated profit and loss account.
(b) Purchase commitments
At 31 December 2023 the Group has no intangible asset purchase commitments (Euros 69 thousand at 31
December 2022).
(c) Other intangibles in progress
At 31 December 2023 the Group has an amount of Euros 1,366,893 thousand as development costs in progress
(Euros 1,330,213 thousand at 31 December 2022). This amount includes an amount of Euros 284,341 thousand
as of 31 December 2023 (Euros 294,578 thousand as of 31 December 2022) corresponding to the ongoing
research and development projects for products for neurodegenerative disorders, neuromuscular diseases, and
ophthalmological diseases acquired from Alkahest. Likewise, this amount also includes an amount of Euros
861,950 thousand as of 31 December 2023 (Euros 846,447 thousand as of 31 December 2022) corresponding to
the ongoing research and development projects in plasma therapies acquired from Biotest (Fibrinogen and
Trimodulin).
(d) Results on disposal of intangible assets
The total losses on disposals and sale of intangible assets amounts to Euros 283 thousand in 2023 (losses of
Euros 1,082 thousand in 2022).
(e) Impairment testing
Indefinite-lived intangible assets have been allocated to the corresponding cash-generating unit (CGU). These
assets have been tested for impairment together with goodwill (see note 6).
Impairment testing has been analyzed for each of the intangible assets in progress by calculating its recoverable
amount based on their fair value based on the discount of free cash flows adjusted by the probability of success
according to the clinical phase of the project. |
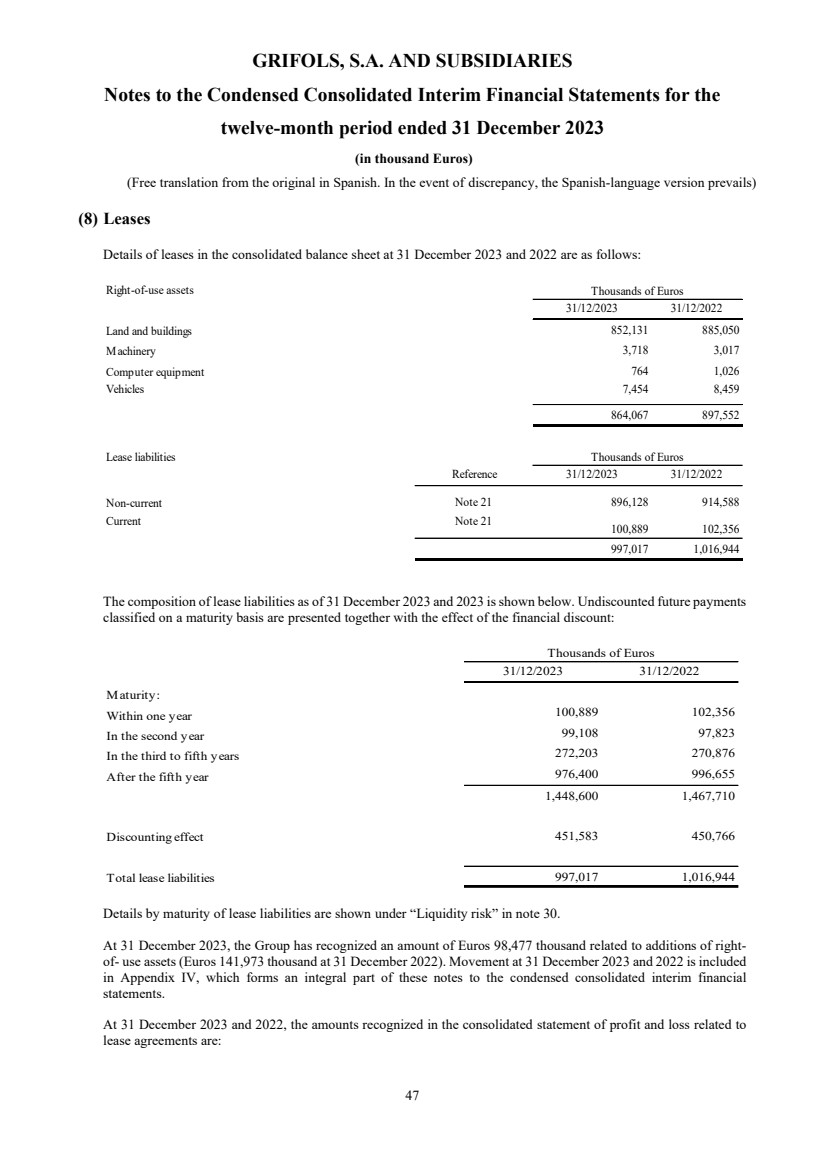
| GRIFOLS, S.A. AND SUBSIDIARIES
Notes to the Condensed Consolidated Interim Financial Statements for the
twelve-month period ended 31 December 2023
(in thousand Euros)
(Free translation from the original in Spanish. In the event of discrepancy, the Spanish-language version prevails)
47
(8) Leases
Details of leases in the consolidated balance sheet at 31 December 2023 and 2022 are as follows:
Right-of-use assets
31/12/2023 31/12/2022
Land and buildings 852,131 885,050
Machinery 3,718 3,017
Computer equipment 764 1,026
Vehicles 7,454 8,459
864,067 897,552
Lease liabilities
Reference 31/12/2023 31/12/2022
Non-current Note 21 896,128 914,588
Current Note 21 100,889 102,356
997,017 1,016,944
Thousands of Euros
Thousands of Euros
The composition of lease liabilities as of 31 December 2023 and 2023 is shown below. Undiscounted future payments
classified on a maturity basis are presented together with the effect of the financial discount:
31/12/2023 31/12/2022
Maturity:
Within one year 100,889 102,356
In the second year 99,108 97,823
In the third to fifth years 272,203 270,876
After the fifth year 976,400 996,655
1,448,600 1,467,710
Discounting effect 451,583 450,766
Total lease liabilities 997,017 1,016,944
Thousands of Euros
Details by maturity of lease liabilities are shown under “Liquidity risk” in note 30.
At 31 December 2023, the Group has recognized an amount of Euros 98,477 thousand related to additions of right-of- use assets (Euros 141,973 thousand at 31 December 2022). Movement at 31 December 2023 and 2022 is included
in Appendix IV, which forms an integral part of these notes to the condensed consolidated interim financial
statements.
At 31 December 2023 and 2022, the amounts recognized in the consolidated statement of profit and loss related to
lease agreements are: |
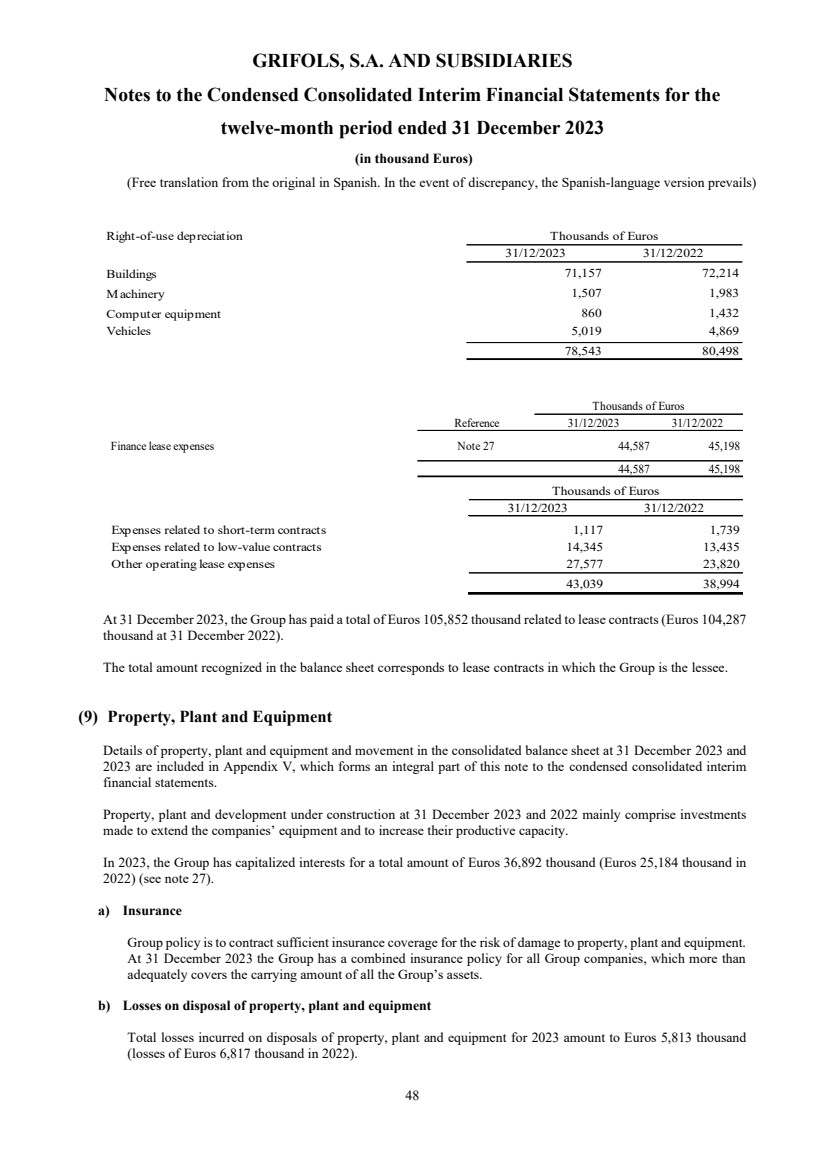
| GRIFOLS, S.A. AND SUBSIDIARIES
Notes to the Condensed Consolidated Interim Financial Statements for the
twelve-month period ended 31 December 2023
(in thousand Euros)
(Free translation from the original in Spanish. In the event of discrepancy, the Spanish-language version prevails)
48
Right-of-use depreciation
31/12/2023 31/12/2022
Buildings 71,157 72,214
Machinery 1,507 1,983
Computer equipment 860 1,432
Vehicles 5,019 4,869
78,543 80,498
Thousands of Euros
Reference 31/12/2023 31/12/2022
Finance lease expenses Note 27 44,587 45,198
44,587 45,198
Thousands of Euros
31/12/2023 31/12/2022
Expenses related to short-term contracts 1,117 1,739
Expenses related to low-value contracts 14,345 13,435
Other operating lease expenses 27,577 23,820
43,039 38,994
Thousands of Euros
At 31 December 2023, the Group has paid a total of Euros 105,852 thousand related to lease contracts (Euros 104,287
thousand at 31 December 2022).
The total amount recognized in the balance sheet corresponds to lease contracts in which the Group is the lessee.
(9) Property, Plant and Equipment
Details of property, plant and equipment and movement in the consolidated balance sheet at 31 December 2023 and
2023 are included in Appendix V, which forms an integral part of this note to the condensed consolidated interim
financial statements.
Property, plant and development under construction at 31 December 2023 and 2022 mainly comprise investments
made to extend the companies’ equipment and to increase their productive capacity.
In 2023, the Group has capitalized interests for a total amount of Euros 36,892 thousand (Euros 25,184 thousand in
2022) (see note 27).
a) Insurance
Group policy is to contract sufficient insurance coverage for the risk of damage to property, plant and equipment.
At 31 December 2023 the Group has a combined insurance policy for all Group companies, which more than
adequately covers the carrying amount of all the Group’s assets.
b) Losses on disposal of property, plant and equipment
Total losses incurred on disposals of property, plant and equipment for 2023 amount to Euros 5,813 thousand
(losses of Euros 6,817 thousand in 2022). |
| GRIFOLS, S.A. AND SUBSIDIARIES
Notes to the Condensed Consolidated Interim Financial Statements for the
twelve-month period ended 31 December 2023
(in thousand Euros)
(Free translation from the original in Spanish. In the event of discrepancy, the Spanish-language version prevails)
49
c) Self – constructed property, plant and equipment
At 31 December 2023 the Group has recognized Euros 82,615 thousand as self -constructed property, plant and
equipment (Euros 87,656 thousand at 31 December 2022) in the consolidated profit and loss account.
d) Purchase commitments
At 31 December 2023 the Group has property, plant and equipment purchase commitments amounting to Euros
36,487 thousand (Euros 41,680 thousand at 31 December 2022).
e) Fixed assets under construction
The fixed assets under construction as of 31 December 2023 amount to Euros 910,670 thousand(Euros 878,415
thousand in the 2022 financial year) and mainly correspond to the investments incurred in the expansion of the
facilities of the companies and their productive capacity in the United States, Canada, and Ireland (see note 29).
f) Impairment testing
During 2023, the Group disposed of property, plant and equipment as part of the reorganization of the USA donor
center network. In this regard, the impairment corresponding to these assets which belong to the Biopharma
segment have been written off for a total amount of Euros 5.3 million in the consolidated profit and loss for 2023.
As a result of the reorganization of the USA donor center network, an impairment for some property, plant and
equipment allocated to the relocated donor centers was recognized for a total amount of Euros 5.7 million as an
expense in the consolidated statement of profit and loss for 2022.
Tangible assets have been assigned to the corresponding cash-generating unit (CGU) and their impairment has
been analyzed jointly with the impairment of goodwill (see note 6).
g) Transfers
At 31 December 2022, transfers included the reclassification of Euros 5,159 thousand to "non-current assets held
for sale" related to agreement that the Group reached for the sale of the installations owned by Grifols Brasil,
Lda which became effective during 2023. |
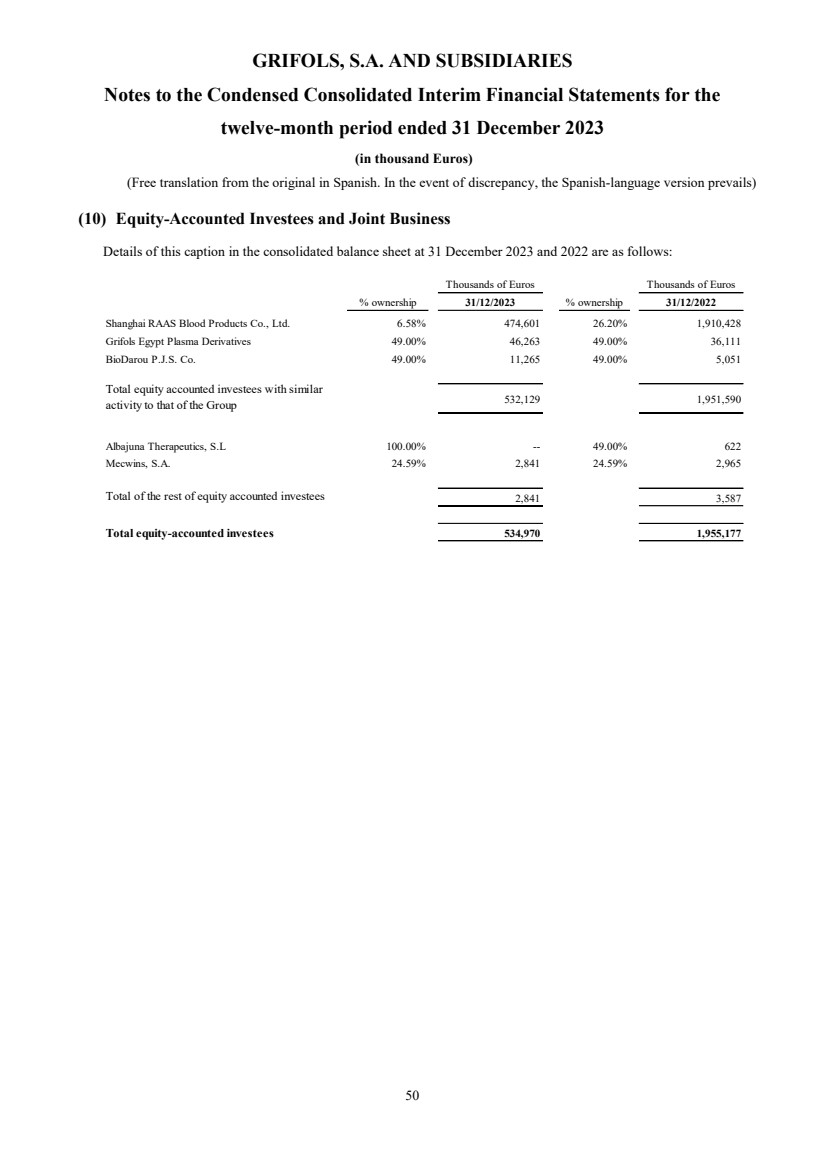
| GRIFOLS, S.A. AND SUBSIDIARIES
Notes to the Condensed Consolidated Interim Financial Statements for the
twelve-month period ended 31 December 2023
(in thousand Euros)
(Free translation from the original in Spanish. In the event of discrepancy, the Spanish-language version prevails)
50
(10) Equity-Accounted Investees and Joint Business
Details of this caption in the consolidated balance sheet at 31 December 2023 and 2022 are as follows:
Thousands of Euros Thousands of Euros
% ownership 31/12/2023 % ownership 31/12/2022
Shanghai RAAS Blood Products Co., Ltd. 6.58% 474,601 26.20% 1,910,428
Grifols Egypt Plasma Derivatives 49.00% 46,263 49.00% 36,111
BioDarou P.J.S. Co. 49.00% 11,265 49.00% 5,051
Total equity accounted investees with similar
activity to that of the Group 532,129 1,951,590
Albajuna Therapeutics, S.L 100.00% -- 49.00% 622
Mecwins, S.A. 24.59% 2,841 24.59% 2,965
Total of the rest of equity accounted investees 2,841 3,587
Total equity-accounted investees 534,970 1,955,177 |
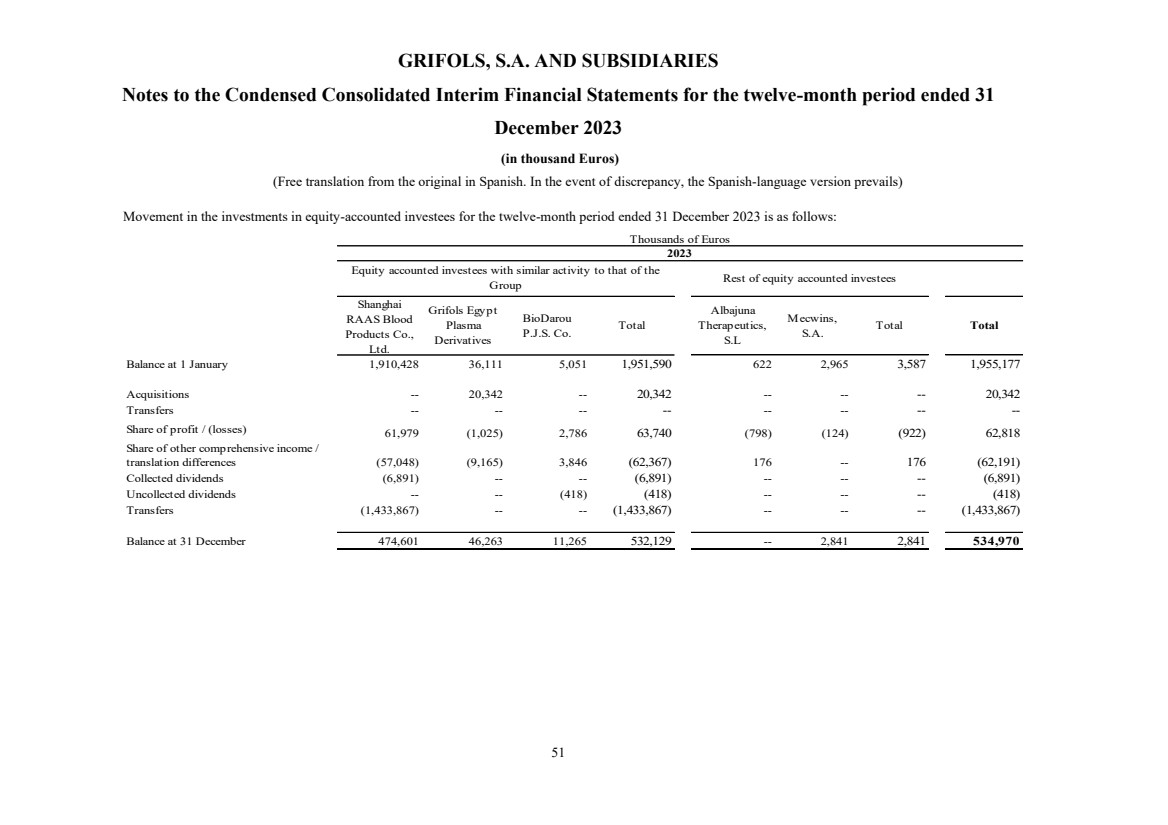
| GRIFOLS, S.A. AND SUBSIDIARIES
Notes to the Condensed Consolidated Interim Financial Statements for the twelve-month period ended 31
December 2023
(in thousand Euros)
(Free translation from the original in Spanish. In the event of discrepancy, the Spanish-language version prevails)
51
Movement in the investments in equity-accounted investees for the twelve-month period ended 31 December 2023 is as follows:
Shanghai
RAAS Blood
Products Co.,
Ltd.
Grifols Egypt
Plasma
Derivatives
BioDarou
P.J.S. Co. Total
Albajuna
Therapeutics,
S.L
Mecwins,
S.A. Total Total
Balance at 1 January 1,910,428 36,111 5,051 1,951,590 622 2,965 3,587 1,955,177
Acquisitions -- 20,342 -- 20,342 -- -- -- 20,342
Transfers -- -- -- -- -- -- -- --
Share of profit / (losses) 61,979 (1,025) 2,786 63,740 (798) (124) (922) 62,818
Share of other comprehensive income /
translation differences (57,048) (9,165) 3,846 (62,367) 176 -- 176 (62,191)
Collected dividends (6,891) -- -- (6,891) -- -- -- (6,891)
Uncollected dividends -- -- (418) (418) -- -- -- (418)
Transfers (1,433,867) -- -- (1,433,867) -- -- -- (1,433,867)
Balance at 31 December 474,601 46,263 11,265 532,129 -- 2,841 2,841 534,970
Thousands of Euros
2023
Equity accounted investees with similar activity to that of the
Group Rest of equity accounted investees |
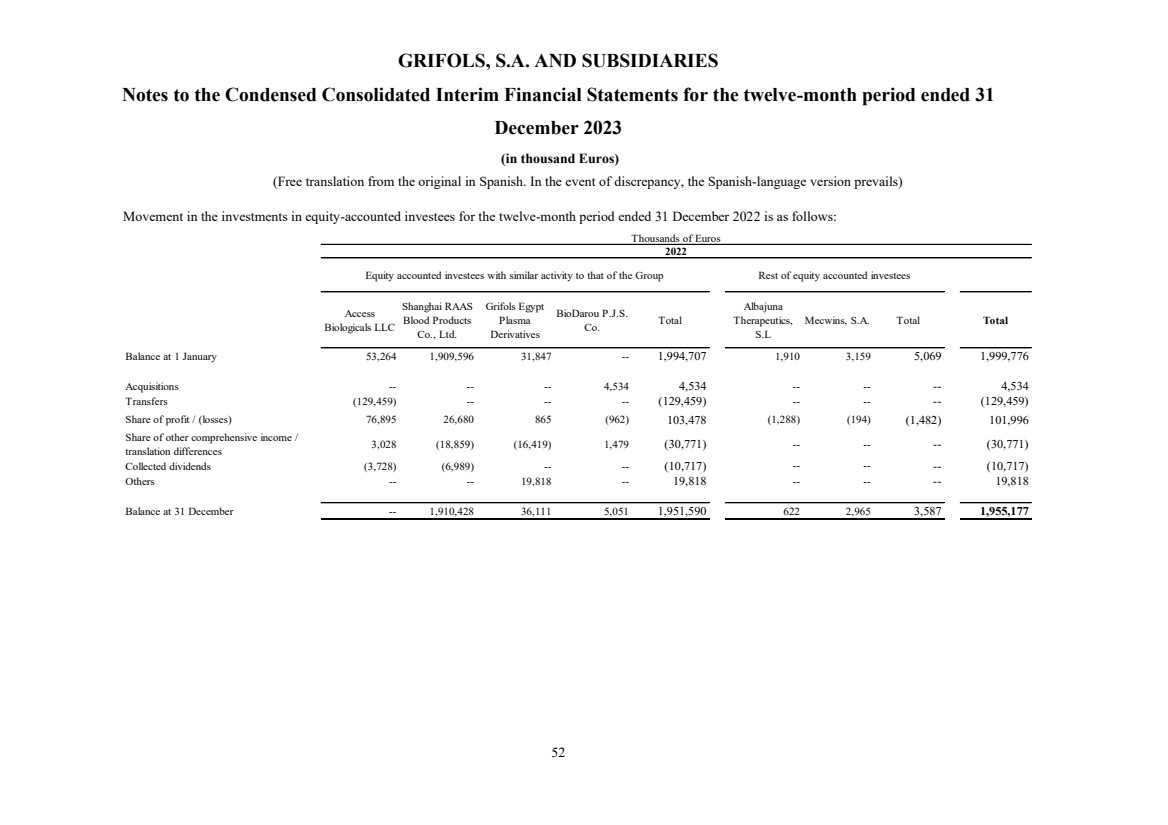
| GRIFOLS, S.A. AND SUBSIDIARIES
Notes to the Condensed Consolidated Interim Financial Statements for the twelve-month period ended 31
December 2023
(in thousand Euros)
(Free translation from the original in Spanish. In the event of discrepancy, the Spanish-language version prevails)
52
Movement in the investments in equity-accounted investees for the twelve-month period ended 31 December 2022 is as follows:
Access
Biologicals LLC
Shanghai RAAS
Blood Products
Co., Ltd.
Grifols Egypt
Plasma
Derivatives
BioDarou P.J.S.
Co. Total
Albajuna
Therapeutics,
S.L
Mecwins, S.A. Total Total
Balance at 1 January 53,264 1,909,596 31,847 -- 1,994,707 1,910 3,159 5,069 1,999,776
Acquisitions -- -- -- 4,534 4,534 -- -- -- 4,534
Transfers (129,459) -- -- -- (129,459) -- -- -- (129,459)
Share of profit / (losses) 76,895 26,680 865 (962) 103,478 (1,288) (194) (1,482) 101,996
Share of other comprehensive income /
translation differences 3,028 (18,859) (16,419) 1,479 (30,771) -- -- -- (30,771)
Collected dividends (3,728) (6,989) -- -- (10,717) -- -- -- (10,717)
Others -- -- 19,818 -- 19,818 -- -- -- 19,818
Balance at 31 December -- 1,910,428 36,111 5,051 1,951,590 622 2,965 3,587 1,955,177
Thousands of Euros
2022
Equity accounted investees with similar activity to that of the Group Rest of equity accounted investees |
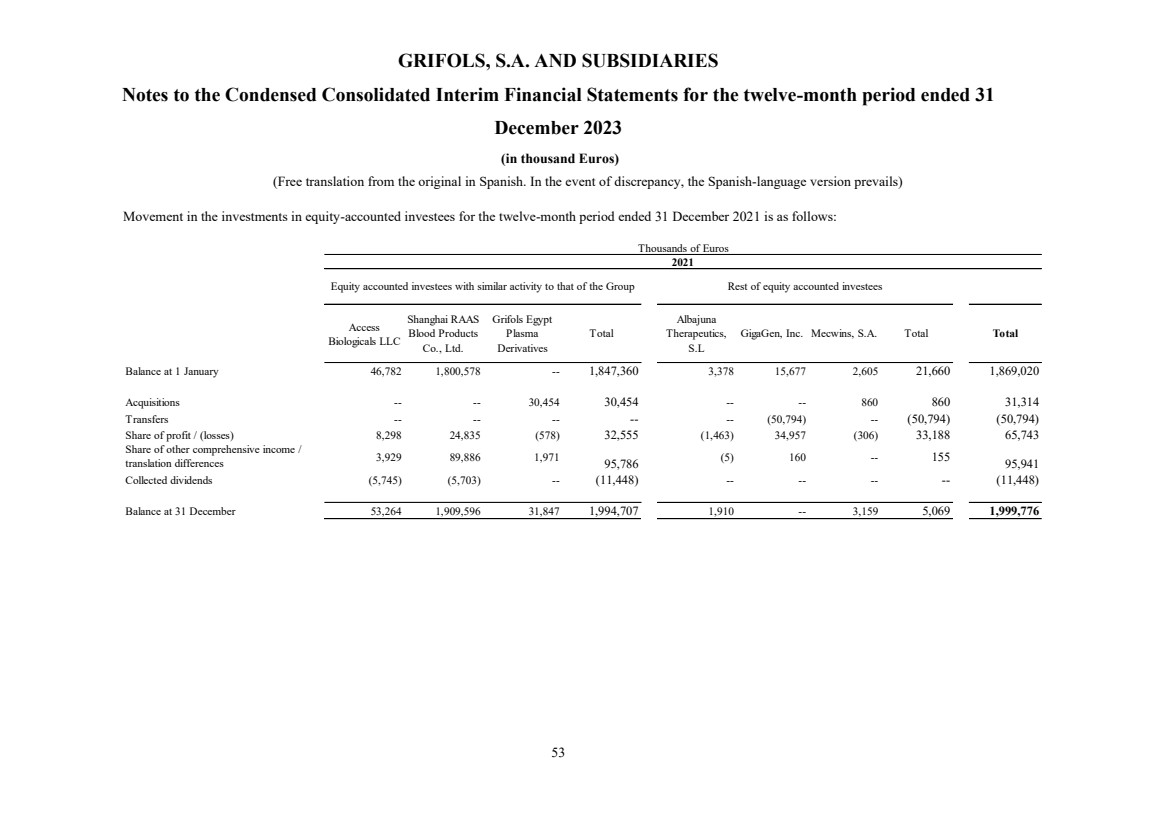
| GRIFOLS, S.A. AND SUBSIDIARIES
Notes to the Condensed Consolidated Interim Financial Statements for the twelve-month period ended 31
December 2023
(in thousand Euros)
(Free translation from the original in Spanish. In the event of discrepancy, the Spanish-language version prevails)
53
Movement in the investments in equity-accounted investees for the twelve-month period ended 31 December 2021 is as follows:
Access
Biologicals LLC
Shanghai RAAS
Blood Products
Co., Ltd.
Grifols Egypt
Plasma
Derivatives
Total
Albajuna
Therapeutics,
S.L
GigaGen, Inc. Mecwins, S.A. Total Total
Balance at 1 January 46,782 1,800,578 -- 1,847,360 3,378 15,677 2,605 21,660 1,869,020
Acquisitions -- -- 30,454 30,454 -- -- 860 860 31,314
Transfers -- -- -- -- -- (50,794) -- (50,794) (50,794)
Share of profit / (losses) 8,298 24,835 (578) 32,555 (1,463) 34,957 (306) 33,188 65,743
Share of other comprehensive income /
translation differences 3,929 89,886 1,971 95,786 (5) 160 -- 155 95,941
Collected dividends (5,745) (5,703) -- (11,448) -- -- -- -- (11,448)
Balance at 31 December 53,264 1,909,596 31,847 1,994,707 1,910 -- 3,159 5,069 1,999,776
Thousands of Euros
2021
Equity accounted investees with similar activity to that of the Group Rest of equity accounted investees |
| GRIFOLS, S.A. AND SUBSIDIARIES
Notes to the Condensed Consolidated Interim Financial Statements for the
twelve-month period ended 31 December 2023
(in thousand Euros)
(Free translation from the original in Spanish. In the event of discrepancy, the Spanish-language version prevails)
54
The main movements of the equity-accounted investees with similar activity to that of the Group are explained below:
Grifols Egypt for Plasma Derivatives (S.A.E.)
On 29 July 2021, a cooperation agreement was signed with the National Service Projects Organization (NSPO) to
help build a platform to bring self-sufficiency in plasma-derived medicines to Egypt. The Company made a first
contribution of US Dollars 36,750 thousand (equivalent to Euros 30,454 thousand at the date of integration), and in
exchange received GEPD shares representing 49% of its share capital, which amounts to US Dollars 300 million.
The Company has undertaken to make the contributions for the outstanding amount corresponding to its interest as
the capital requirements are approved. As a result, the Group made a further capital contribution of US Dollars 22
million during 2022, equivalent to 49% of the total capital contribution made (US Dollars 45 million). Additionally,
during 2023 the Group made another capital contribution of US Dollars 22 (Euros 20 million at the contribution date)
million, equivalent to 49% of the total capital increase made (US Dollar 67 million).
Shanghai RAAS Blood Products Co. Ltd.
In March 2019, Grifols entered into a share exchange agreement with Shanghai RAAS Blood Products Co. Ltd.
(hereinafter SRAAS), through which Grifols would deliver 90 shares of its US subsidiary Grifols Diagnostic
Solutions Inc. (hereinafter GDS) (representing 45% of the economic rights and 40% of the voting rights), and in
exchange would receive 1,766 million of SRAAS shares (representing 26.2% of the share capital).
After receiving all relevant authorizations, at 31 December 2019, Grifols delivered 90 shares of its subsidiary GDS
in exchange for a contractual right to receive equity instruments in an associate (equivalent to 1,766 million of
SRAAS shares), because at that date no shares of SRAAS were received. As a consequence, at 31 December 31 2019,
SRAAS was the minority shareholder owning 45% of GDS. Grifols recorded the aforementioned contractual right
for the fair value of the GDS shares delivered and subsequently, the right was measured based on its fair value through
profit or loss.
On 30 March 2020, the share exchange agreement was closed and Grifols received SRAAS shares corresponding to
26.2% of its share capital. Therefore, Grifols became the largest shareholder of SRAAS, while maintaining
operational, voting and economic control of GDS.
Consequently, the consolidated balance sheet at 31 December 2020, did not longer show any financial asset related
to the contractual right, but the interest in SRAAS was recorded as an investment in an associate company because
the Group exercises significant influence in accordance with the criteria established in IAS 28 – Investment in
Associates and Joint Ventures. SRAAS’ equity-accounted investment was recognized at the value of the shares at the
closing date of the transaction. The difference between the contractual right value recognized at 31 December 2019
and SRAAS quoted value at 30 March 2020 was Euros 56,526 thousand which was recognized as Change in fair
value of financial instruments in the consolidated statement of profit and loss.
The impact on the consolidated statement of profit and loss related to the equity method result was included in the
Operating Result under “Profit/(loss) of equity accounted investees with similar activity to that of the Group”, since
SRAAS is a company dedicated to the plasma product sector.
The transaction costs were recognized as part of the investment value and totaled Euros 34,088 thousand.
On 29 December 2023, Grifols announced a Strategic Alliance and Share Purchase Agreement with Haier Group
Corporation (Haier) for the sale of approximately a 20% equity stake in SRAAS in exchange for RMB 12,500 million,
which represents a price of RMB 9.405 per share.
According to the fair value implicit in the transaction with Haier, there is no impairment indication in SRAAS
investment as of December 31, 2023. At 31 December 2023 Shanghai RAAS Blood Products Co. Ltd. stock market
capitalization totals RMB 53,164 million (RMB 42,737 million at 31 December 2022). |
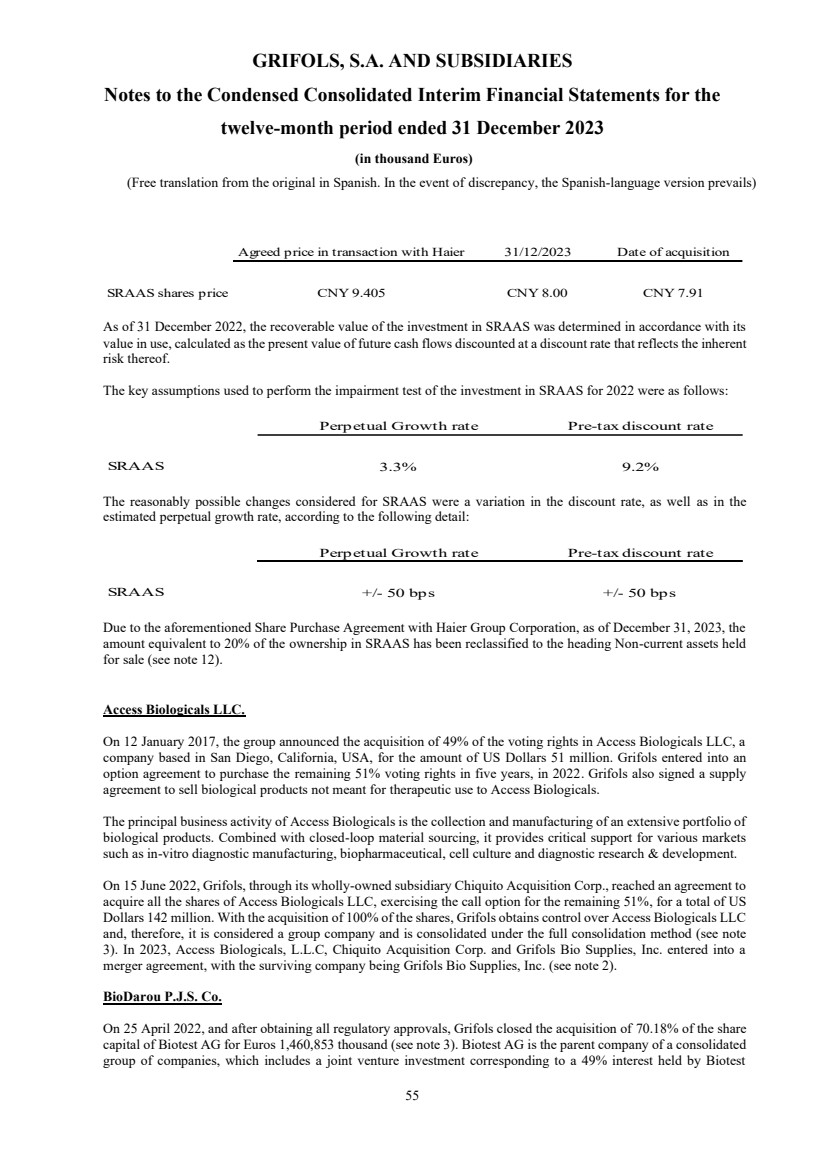
| GRIFOLS, S.A. AND SUBSIDIARIES
Notes to the Condensed Consolidated Interim Financial Statements for the
twelve-month period ended 31 December 2023
(in thousand Euros)
(Free translation from the original in Spanish. In the event of discrepancy, the Spanish-language version prevails)
55 Agreed price in transaction with Haier 31/12/2023 Date of acquisition
SRAAS shares price CNY 9.405 CNY 8.00 CNY 7.91
As of 31 December 2022, the recoverable value of the investment in SRAAS was determined in accordance with its
value in use, calculated as the present value of future cash flows discounted at a discount rate that reflects the inherent
risk thereof.
The key assumptions used to perform the impairment test of the investment in SRAAS for 2022 were as follows:
Perpetual Growth rate Pre-tax discount rate
SRAAS 3.3% 9.2%
The reasonably possible changes considered for SRAAS were a variation in the discount rate, as well as in the
estimated perpetual growth rate, according to the following detail:
Perpetual Growth rate Pre-tax discount rate
SRAAS +/- 50 bps +/- 50 bps
Due to the aforementioned Share Purchase Agreement with Haier Group Corporation, as of December 31, 2023, the
amount equivalent to 20% of the ownership in SRAAS has been reclassified to the heading Non-current assets held
for sale (see note 12).
Access Biologicals LLC.
On 12 January 2017, the group announced the acquisition of 49% of the voting rights in Access Biologicals LLC, a
company based in San Diego, California, USA, for the amount of US Dollars 51 million. Grifols entered into an
option agreement to purchase the remaining 51% voting rights in five years, in 2022. Grifols also signed a supply
agreement to sell biological products not meant for therapeutic use to Access Biologicals.
The principal business activity of Access Biologicals is the collection and manufacturing of an extensive portfolio of
biological products. Combined with closed-loop material sourcing, it provides critical support for various markets
such as in-vitro diagnostic manufacturing, biopharmaceutical, cell culture and diagnostic research & development.
On 15 June 2022, Grifols, through its wholly-owned subsidiary Chiquito Acquisition Corp., reached an agreement to
acquire all the shares of Access Biologicals LLC, exercising the call option for the remaining 51%, for a total of US
Dollars 142 million. With the acquisition of 100% of the shares, Grifols obtains control over Access Biologicals LLC
and, therefore, it is considered a group company and is consolidated under the full consolidation method (see note
3). In 2023, Access Biologicals, L.L.C, Chiquito Acquisition Corp. and Grifols Bio Supplies, Inc. entered into a
merger agreement, with the surviving company being Grifols Bio Supplies, Inc. (see note 2).
BioDarou P.J.S. Co.
On 25 April 2022, and after obtaining all regulatory approvals, Grifols closed the acquisition of 70.18% of the share
capital of Biotest AG for Euros 1,460,853 thousand (see note 3). Biotest AG is the parent company of a consolidated
group of companies, which includes a joint venture investment corresponding to a 49% interest held by Biotest |
| GRIFOLS, S.A. AND SUBSIDIARIES
Notes to the Condensed Consolidated Interim Financial Statements for the
twelve-month period ended 31 December 2023
(in thousand Euros)
(Free translation from the original in Spanish. In the event of discrepancy, the Spanish-language version prevails)
56
Pharma GmbH in BioDarou P.J.S. Co, whose registered office is in Tehran, Iran, and which is accounted for using
the equity method.
The company's goal is to collect plasma, process it into immunoglobulins, factors and human albumin through Biotest
AG and then sell the finished products in Iran.
The main movements for the rest of the equity-accounted investees are explained below:
Albajuna Therapeutics, S.L.
In 2016, Grifols made a capital investment of 3.75 million euros in exchange for 30% of the shares of Albajuna
Therapeutics, S.L. Since 2018, as a result of a planned investment in accordance with the Shareholders' Agreement
of January 2016, Grifols held a 49% stake in the company's capital. Albajuna Therapeutics, S.L. is a Spanish research
company founded in 2016 whose main activity is the development and manufacture of therapeutic antibodies against
HIV.
On 9 October, 2023, Grifols, through its 100% owned subsidiary Grifols Innovation and New Technologies Limited,
reached an agreement to acquire all the shares of Albajuna Therapeutics, S.L. for the remaining 51% for a total
amount of 1 euro. With the acquisition of 100% of the shares, Grifols obtained control over Albajuna Therapeutics,
S.L. and, therefore, it has become a group company and has been consolidated under the global consolidation method
(see note 3).
Medcom Advance, S.A.
In February 2019, the Group completed the acquisition of 45% of the shares in Medcom Advance, S.A. for an amount
of Euros 8,602 thousand. Medcom Advance, S.A. is a company dedicated to research and development with a view
to create proprietary patents using nanotechnology. The company was equity-accounted. At 31 December 2022 and
2023, this investment is fully impaired.
Mecwins, S.A.
On 22 October 2018 Grifols allocated Euros 2 million to the capital increase of Mecwins through Progenika
Biopharma, reaching 24.99% of the total capital.
Mecwins is a spin-off of the Institute of Micro and Nanotechnology of the Center for Scientific Research (CSIC),
specialized in the development of innovative nanotechnological analysis tools for the diagnosis and prognosis of
diseases.
Mecwins has developed ultrasensitive optical reading immunoassay technology from nanosensors for the detection
of protein biomarkers in blood. This technology has potential applications in fields such as oncology, cardiovascular
and infectious diseases.
The injection of capital, in which CRB Inverbio also participated with an additional Euros 2 million, will enable
Mecwins to start developing pre-commercial prototypes of this technology and for Grifols to position itself in the
field of nanotechnology applied to diagnosis.
In 2021, Mecwins, S.A. acquired own shares from Progenika Biopharma, S.A. to generate treasury stock. This
acquisition caused the percentage of ownership in Mecwins, S.A. to decrease to 24.59%.
GigaGen Inc. |
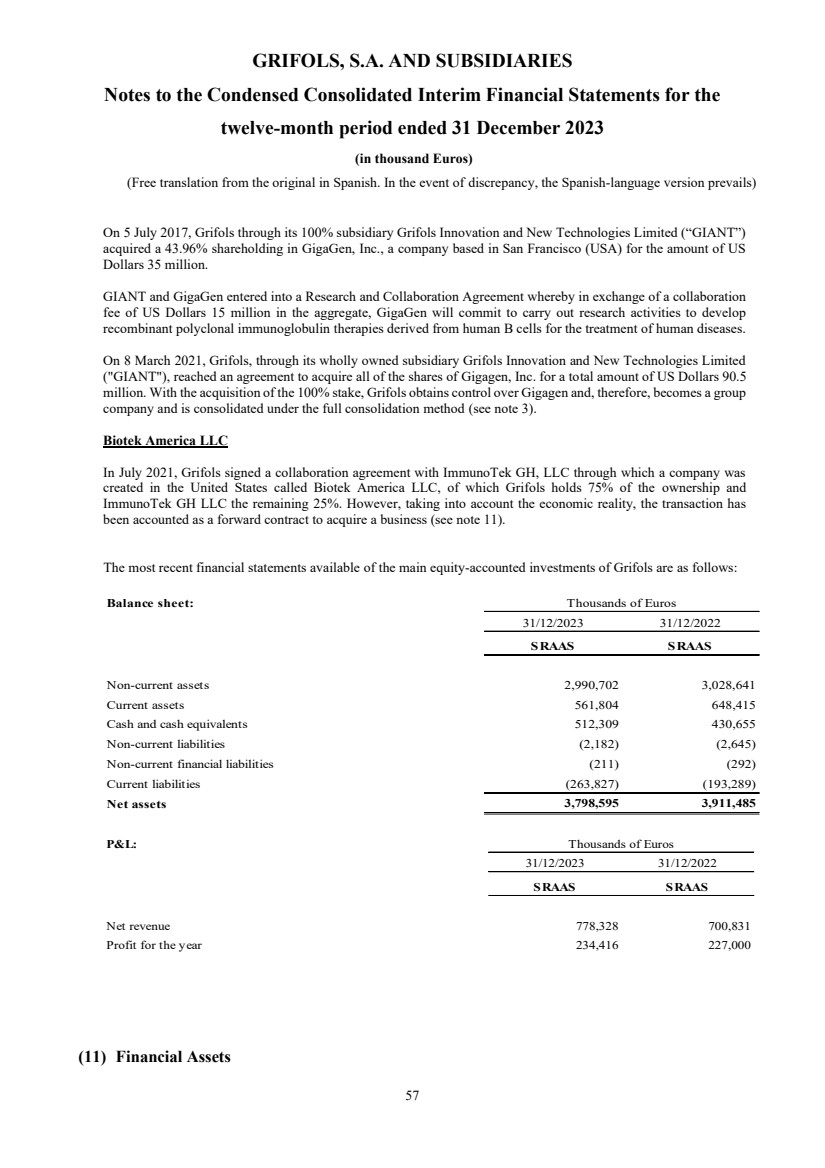
| GRIFOLS, S.A. AND SUBSIDIARIES
Notes to the Condensed Consolidated Interim Financial Statements for the
twelve-month period ended 31 December 2023
(in thousand Euros)
(Free translation from the original in Spanish. In the event of discrepancy, the Spanish-language version prevails)
57
On 5 July 2017, Grifols through its 100% subsidiary Grifols Innovation and New Technologies Limited (“GIANT”)
acquired a 43.96% shareholding in GigaGen, Inc., a company based in San Francisco (USA) for the amount of US
Dollars 35 million.
GIANT and GigaGen entered into a Research and Collaboration Agreement whereby in exchange of a collaboration
fee of US Dollars 15 million in the aggregate, GigaGen will commit to carry out research activities to develop
recombinant polyclonal immunoglobulin therapies derived from human B cells for the treatment of human diseases.
On 8 March 2021, Grifols, through its wholly owned subsidiary Grifols Innovation and New Technologies Limited
("GIANT"), reached an agreement to acquire all of the shares of Gigagen, Inc. for a total amount of US Dollars 90.5
million. With the acquisition of the 100% stake, Grifols obtains control over Gigagen and, therefore, becomes a group
company and is consolidated under the full consolidation method (see note 3).
Biotek America LLC
In July 2021, Grifols signed a collaboration agreement with ImmunoTek GH, LLC through which a company was
created in the United States called Biotek America LLC, of which Grifols holds 75% of the ownership and
ImmunoTek GH LLC the remaining 25%. However, taking into account the economic reality, the transaction has
been accounted as a forward contract to acquire a business (see note 11).
The most recent financial statements available of the main equity-accounted investments of Grifols are as follows:
Balance sheet:
31/12/2023 31/12/2022
SRAAS SRAAS
Non-current assets 2,990,702 3,028,641
Current assets 561,804 648,415
Cash and cash equivalents 512,309 430,655
Non-current liabilities (2,182) (2,645)
Non-current financial liabilities (211) (292)
Current liabilities (263,827) (193,289)
Net assets 3,798,595 3,911,485
Thousands of Euros P&L:
31/12/2023 31/12/2022
SRAAS SRAAS
Net revenue 778,328 700,831
Profit for the year 234,416 227,000
Thousands of Euros
(11) Financial Assets |
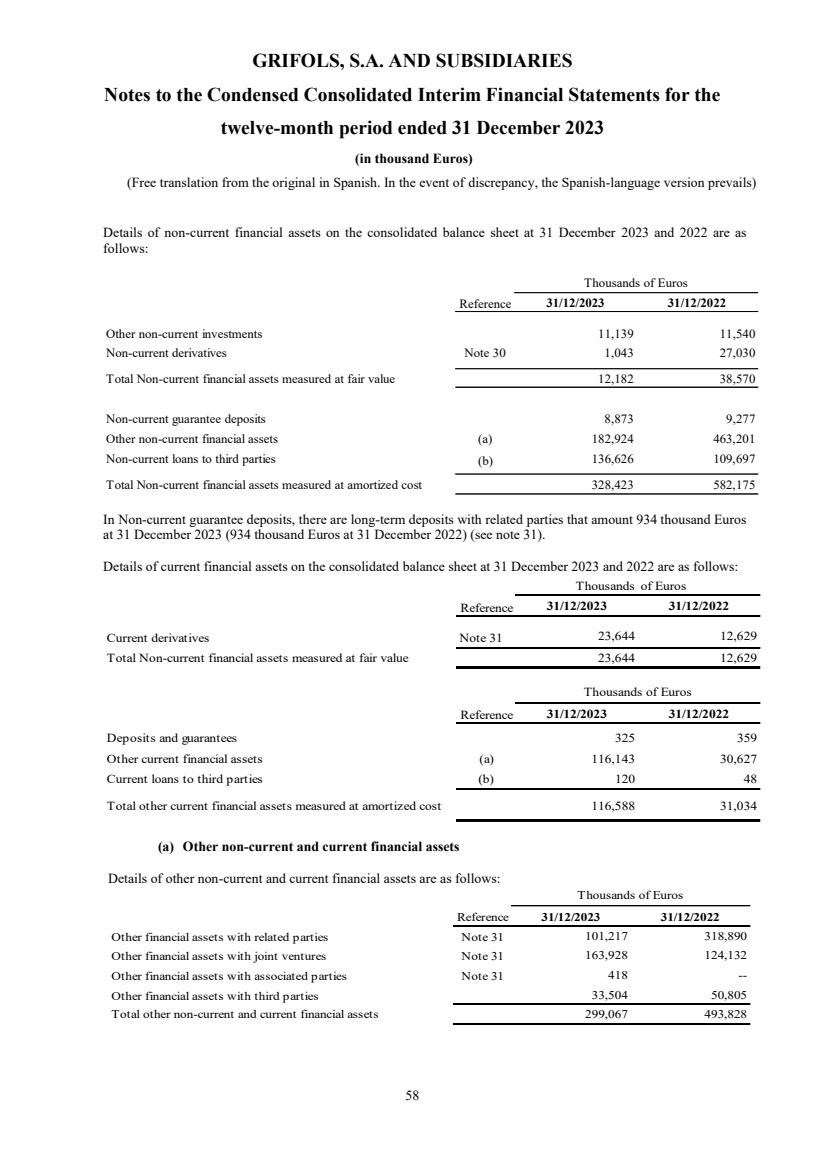
| GRIFOLS, S.A. AND SUBSIDIARIES
Notes to the Condensed Consolidated Interim Financial Statements for the
twelve-month period ended 31 December 2023
(in thousand Euros)
(Free translation from the original in Spanish. In the event of discrepancy, the Spanish-language version prevails)
58
Details of non-current financial assets on the consolidated balance sheet at 31 December 2023 and 2022 are as
follows:
Reference 31/12/2023 31/12/2022
Other non-current investments 11,139 11,540
Non-current derivatives Note 30 1,043 27,030
Total Non-current financial assets measured at fair value 12,182 38,570
Non-current guarantee deposits 8,873 9,277
Other non-current financial assets (a) 182,924 463,201
Non-current loans to third parties (b) 136,626 109,697
Total Non-current financial assets measured at amortized cost 328,423 582,175
Thousands of Euros
In Non-current guarantee deposits, there are long-term deposits with related parties that amount 934 thousand Euros
at 31 December 2023 (934 thousand Euros at 31 December 2022) (see note 31).
Details of current financial assets on the consolidated balance sheet at 31 December 2023 and 2022 are as follows:
Thousands of Euros
Reference 31/12/2023 31/12/2022
Current derivatives Note 31 23,644 12,629
Total Non-current financial assets measured at fair value 23,644 12,629
Reference 31/12/2023 31/12/2022
Deposits and guarantees 325 359
Other current financial assets (a) 116,143 30,627
Current loans to third parties (b) 120 48
Total other current financial assets measured at amortized cost 116,588 31,034
Thousands of Euros
(a) Other non-current and current financial assets
Details of other non-current and current financial assets are as follows:
Reference 31/12/2023 31/12/2022
Other financial assets with related parties Note 31 101,217 318,890
Other financial assets with joint ventures Note 31 163,928 124,132
Other financial assets with associated parties Note 31 418 --
Other financial assets with third parties 33,504 50,805
Total other non-current and current financial assets 299,067 493,828
Thousands of Euros |

| GRIFOLS, S.A. AND SUBSIDIARIES
Notes to the Condensed Consolidated Interim Financial Statements for the
twelve-month period ended 31 December 2023
(in thousand Euros)
(Free translation from the original in Spanish. In the event of discrepancy, the Spanish-language version prevails)
59
Other financial assets with related parties includes the open balance of the cash pooling that Haema AG and BPC
Plasma, Inc. have with Scranton Plasma B.V. (see note 31). Those balances have been reclassified from non-current
to curent based on their maturity. In 2023, the balance was significantly reduced because BPC Plasma Inc. distributed
a dividend without cash outflow compensating “other non-current financial assets”. The dividend corresponds to the
result of the previous 4 years for a value of Euros 266,406 thousand to its shareholder Scranton Plasma B.V. This
distribution had an impact against the group's non-controlling interests reserves (see note 19).
In July 2021, Grifols entered into a collaboration agreement with ImmunoTek GH, LLC (ImmunoTek). The
transaction was instrumented through the creation of a tax-transparent company in the United States, Biotek America
LLC ("ITK JV"), which created a series of shares for each center. Grifols holds 75% of each series of shares through
the company Grifols Bio North America and ImmunoTek holds the remaining 25%. During 2023, the Group and
Immunotek signed a modification to the initial agreement. This collaboration agreement has implied as of December
31, 2023 and 2022:
• ImmunoTek's construction, licensing and commissioning of a total of 21 plasma centers in the United
States. This agreement was subsequently expanded to a total of 28 centers;
• The sale to Grifols of each center approximately 3 years after its opening, for an approximate amount of
USD 635,955 thousand (Euros 577,232 thousand) for the 28 centers. The number of centers to be acquired
and their acquisition date will be: 7 centers in April 2024, 7 centers in July 2024, 8 centers in January 2025
and 6 centers in January 2026;
• Grifols made advances of up to USD 5,000 thousand per site to ImmunoTek (USD 140,000 million for the
28 sites), which will be deducted from the purchase price of the sites.
• All of the plasma collected by the ITK JV through its 28 centers is sold exclusively to Grifols in exchange
for an agreed price. Plasma purchases from the ITK JV in fiscal years 2023 and 2022 amounted to Euros
233,706 thousand and Euros 66.648 thousand, respectively.
• ImmunoTek has sole management of the centers in exchange for a management fee of Euros 10,630
thousand(Euros 5,836 thousand in 2022). Subsequently, as a result of a contractual amendment, the
management fees became fixed amounts.
• As manager, it may perform all acts it deems necessary under his sole and sole responsibility with limitation
to certain protective clauses included in the collaboration agreement. It can only be terminated with the
unanimous consent of the parties.
• In the event of liquidation of the ITK JV, once the creditors of the ITK JV or each of the series have been
paid, the remainder, if any, will be distributed to each of the partners in proportion to their equity interest
(Immunotek 25%; Grifols 75%).
• None of the series shall be liable for expenses incurred by or attributable to the other series. All items of
loss, gain, income and expense shall be allocated to ImmunoTek. However, all assets and liabilities
correspond to each of the series.
• Grifols, through its subsidiary Grifols Shared Services North America, LLC. acts as guarantor for five
plasma center lease agreements held by ImmunoTek that are not subject to this collaboration agreement up
to an amount of US Dollars 50 million. In addition, Grifols, S.A. acts as guarantor of the commitments
acquired for the purchase of the 28 plasma centers. |
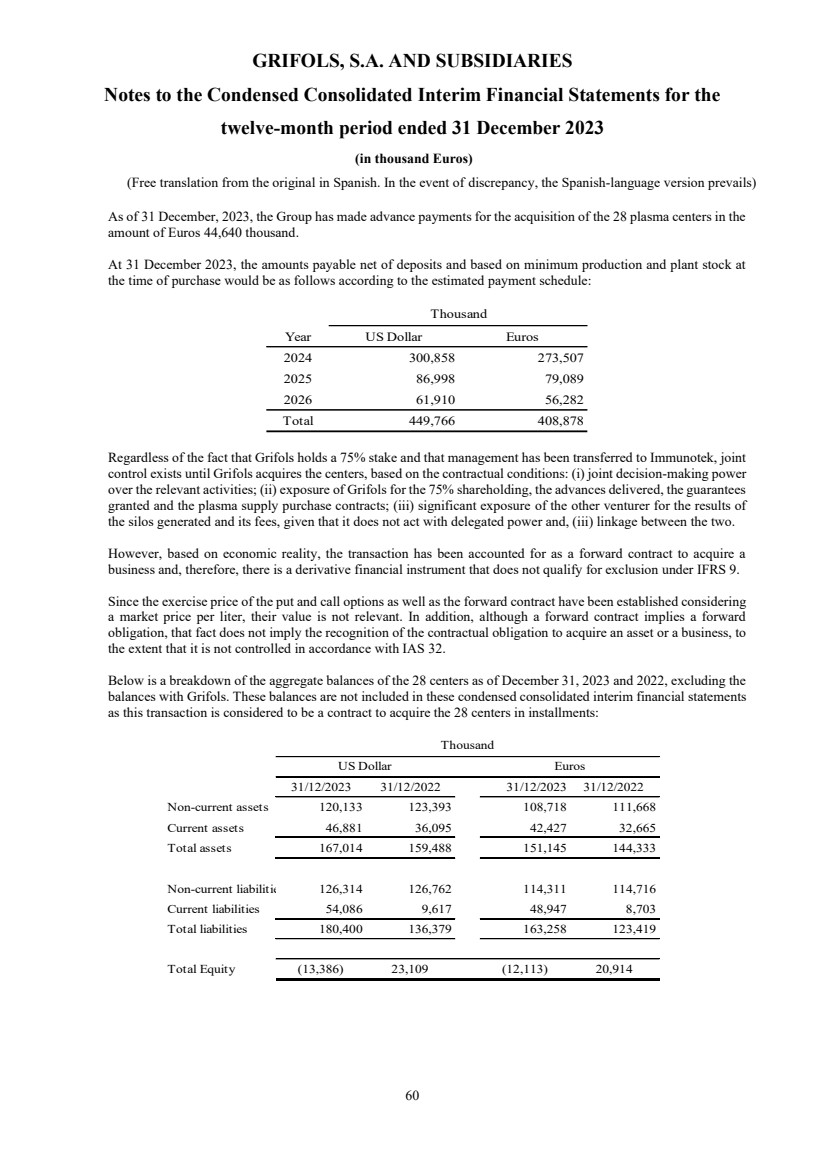
| GRIFOLS, S.A. AND SUBSIDIARIES
Notes to the Condensed Consolidated Interim Financial Statements for the
twelve-month period ended 31 December 2023
(in thousand Euros)
(Free translation from the original in Spanish. In the event of discrepancy, the Spanish-language version prevails)
60
As of 31 December, 2023, the Group has made advance payments for the acquisition of the 28 plasma centers in the
amount of Euros 44,640 thousand.
At 31 December 2023, the amounts payable net of deposits and based on minimum production and plant stock at
the time of purchase would be as follows according to the estimated payment schedule:
Year US Dollar Euros
2024 300,858 273,507
2025 86,998 79,089
2026 61,910 56,282
Total 449,766 408,878
Thousand
Regardless of the fact that Grifols holds a 75% stake and that management has been transferred to Immunotek, joint
control exists until Grifols acquires the centers, based on the contractual conditions: (i) joint decision-making power
over the relevant activities; (ii) exposure of Grifols for the 75% shareholding, the advances delivered, the guarantees
granted and the plasma supply purchase contracts; (iii) significant exposure of the other venturer for the results of
the silos generated and its fees, given that it does not act with delegated power and, (iii) linkage between the two.
However, based on economic reality, the transaction has been accounted for as a forward contract to acquire a
business and, therefore, there is a derivative financial instrument that does not qualify for exclusion under IFRS 9.
Since the exercise price of the put and call options as well as the forward contract have been established considering
a market price per liter, their value is not relevant. In addition, although a forward contract implies a forward
obligation, that fact does not imply the recognition of the contractual obligation to acquire an asset or a business, to
the extent that it is not controlled in accordance with IAS 32.
Below is a breakdown of the aggregate balances of the 28 centers as of December 31, 2023 and 2022, excluding the
balances with Grifols. These balances are not included in these condensed consolidated interim financial statements
as this transaction is considered to be a contract to acquire the 28 centers in installments:
31/12/2023 31/12/2022 31/12/2023 31/12/2022
Non-current assets 120,133 123,393 108,718 111,668
Current assets 46,881 36,095 42,427 32,665
Total assets 167,014 159,488 151,145 144,333
Non-current liabilities 126,314 126,762 114,311 114,716
Current liabilities 54,086 9,617 48,947 8,703
Total liabilities 180,400 136,379 163,258 123,419
Total Equity (13,386) 23,109 (12,113) 20,914
US Dollar Euros
Thousand |

| GRIFOLS, S.A. AND SUBSIDIARIES
Notes to the Condensed Consolidated Interim Financial Statements for the
twelve-month period ended 31 December 2023
(in thousand Euros)
(Free translation from the original in Spanish. In the event of discrepancy, the Spanish-language version prevails)
61
(b) Non-current and current loans
Details of non-current and current loans are as follows:
Reference 31/12/2023 31/12/2022
Loans to related parties Nota 31 115,209 96,537
Loans to third parties 21,537 13,208
Total current and non-current loans 136,746 109,745
Thousands of Euros
(12) Non-current assets held for sale
On 29 December 2023, Grifols reached an agreement with Haier Group Corporation ("Haier") for the sale of a 20%
equity interest in Shanghai RAAS (SRAAS) for RMB 12,500 million (approximately US Dollars 1,800 million),
while retaining a 6.58% interest in SRAAS.
The closing of the transaction is subject to the relevant regulatory approvals and confirmatory due diligence by the
buyer. Both parties estimate that the closing of the transaction will occur in June 2024, although it could be postponed
if any regulatory approvals are pending at that date.
As part of the agreement with Haier, the parties have agreed that Grifols will retain a director on the Board of
Directors of SRAAS. Grifols and SRAAS will amend the Exclusive Distribution Agreement with SRAAS to supply
increased quantities of human serum Albumin in the Chinese market, to extend its current term for an initial period
of 10 years (until 2034), with SRAAS having the option to extend this term for an additional 10 years. Grifols and
the purchaser undertake not to transfer any of their shares in SRAAS for a period of 3 years after the closing of the
transaction. Grifols commits to:
• achieve an aggregate EBITDA in Grifols Diagnostic Solutions of US Dollar 850 million for the period 2024-
2028 and in the event that such EBITDA is not met, Grifols will compensate SRAAS with 45% of the
remaining amount until that amount is reached (see note 29).
• distribute 50% of the distributable profit in GDS to GDS shareholders in the period 2024-2028
•
• Under the voting proxy agreement, the Group will cede the exercise of voting rights relating to the 6.58%
of shares in SRAAS that it retains to Haier for a period of 10 years from the payment of the transaction price
by Haier.
With this transaction, Grifols will mainatin its presence in China, will continue with its commercial agreements with
SRAAS, and at the same time, will fulfill its commitment to deleverage.
At 31 December, 2023, the amount equivalent to 20% of the stake in SRAAS, amounting to Euros 1,433,867
thousand, has been reclassified to "Non-current assets held for sale", given that Grifols has a firm commitment to sell
this stake and that its sale is considered highly probable in accordance with IFRS 5. This reclassification has had no
impact on the consolidated statement of profit or loss at 31 December 2023, because the sale price agreed less costs
is higher than the carrying amount. Likewise, the sale of this interest has not been considered as discontinued
operations because it does not represent a significant line of business or geographical area of operation separate from
the rest. This interest is included within the "Other" segment for consolidated financial reporting purposes. |
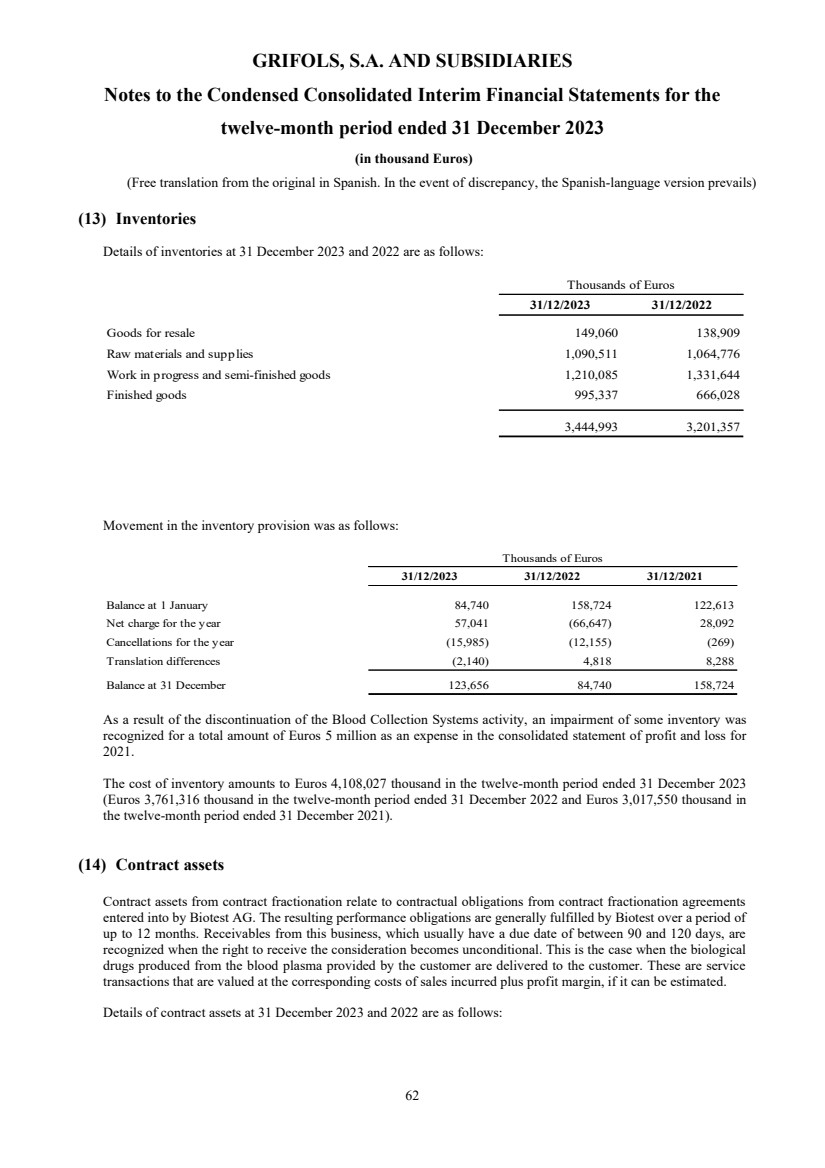
| GRIFOLS, S.A. AND SUBSIDIARIES
Notes to the Condensed Consolidated Interim Financial Statements for the
twelve-month period ended 31 December 2023
(in thousand Euros)
(Free translation from the original in Spanish. In the event of discrepancy, the Spanish-language version prevails)
62
(13) Inventories
Details of inventories at 31 December 2023 and 2022 are as follows:
31/12/2023 31/12/2022
Goods for resale 149,060 138,909
Raw materials and supplies 1,090,511 1,064,776
Work in progress and semi-finished goods 1,210,085 1,331,644
Finished goods 995,337 666,028
3,444,993 3,201,357
Thousands of Euros
Movement in the inventory provision was as follows:
31/12/2023 31/12/2022 31/12/2021
Balance at 1 January 84,740 158,724 122,613
Net charge for the year 57,041 (66,647) 28,092
Cancellations for the year (15,985) (12,155) (269)
Translation differences (2,140) 4,818 8,288
Balance at 31 December 123,656 84,740 158,724
Thousands of Euros
As a result of the discontinuation of the Blood Collection Systems activity, an impairment of some inventory was
recognized for a total amount of Euros 5 million as an expense in the consolidated statement of profit and loss for
2021.
The cost of inventory amounts to Euros 4,108,027 thousand in the twelve-month period ended 31 December 2023
(Euros 3,761,316 thousand in the twelve-month period ended 31 December 2022 and Euros 3,017,550 thousand in
the twelve-month period ended 31 December 2021).
(14) Contract assets
Contract assets from contract fractionation relate to contractual obligations from contract fractionation agreements
entered into by Biotest AG. The resulting performance obligations are generally fulfilled by Biotest over a period of
up to 12 months. Receivables from this business, which usually have a due date of between 90 and 120 days, are
recognized when the right to receive the consideration becomes unconditional. This is the case when the biological
drugs produced from the blood plasma provided by the customer are delivered to the customer. These are service
transactions that are valued at the corresponding costs of sales incurred plus profit margin, if it can be estimated.
Details of contract assets at 31 December 2023 and 2022 are as follows: |
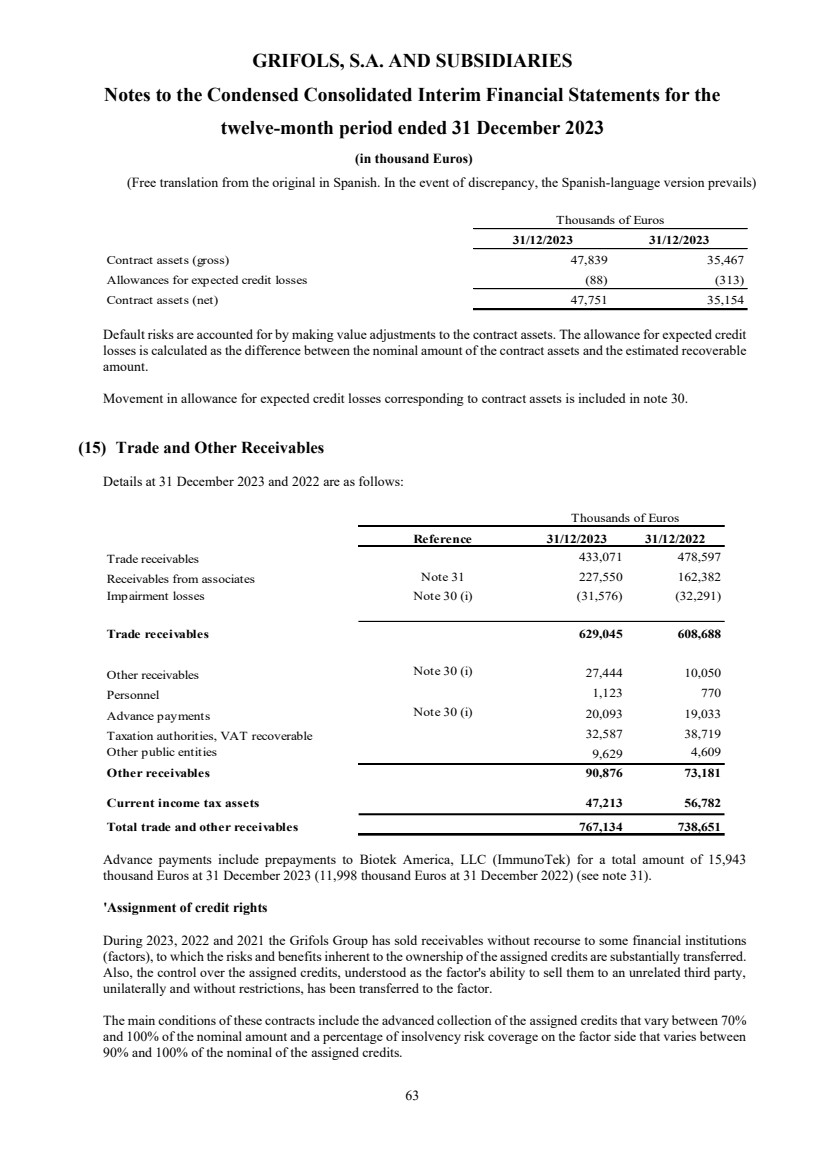
| GRIFOLS, S.A. AND SUBSIDIARIES
Notes to the Condensed Consolidated Interim Financial Statements for the
twelve-month period ended 31 December 2023
(in thousand Euros)
(Free translation from the original in Spanish. In the event of discrepancy, the Spanish-language version prevails)
63 31/12/2023 31/12/2023
Contract assets (gross) 47,839 35,467
Allowances for expected credit losses (88) (313)
Contract assets (net) 47,751 35,154
Thousands of Euros
Default risks are accounted for by making value adjustments to the contract assets. The allowance for expected credit
losses is calculated as the difference between the nominal amount of the contract assets and the estimated recoverable
amount.
Movement in allowance for expected credit losses corresponding to contract assets is included in note 30.
(15) Trade and Other Receivables
Details at 31 December 2023 and 2022 are as follows:
Reference 31/12/2023 31/12/2022
Trade receivables 433,071 478,597
Receivables from associates Note 31 227,550 162,382
Impairment losses Note 30 (i) (31,576) (32,291)
Trade receivables 629,045 608,688
Other receivables Note 30 (i) 27,444 10,050
Personnel 1,123 770
Advance payments Note 30 (i) 20,093 19,033
Taxation authorities, VAT recoverable 32,587 38,719
Other public entities 9,629 4,609
Other receivables 90,876 73,181
Current income tax assets 47,213 56,782
Total trade and other receivables 767,134 738,651
Thousands of Euros
Advance payments include prepayments to Biotek America, LLC (ImmunoTek) for a total amount of 15,943
thousand Euros at 31 December 2023 (11,998 thousand Euros at 31 December 2022) (see note 31).
'Assignment of credit rights
During 2023, 2022 and 2021 the Grifols Group has sold receivables without recourse to some financial institutions
(factors), to which the risks and benefits inherent to the ownership of the assigned credits are substantially transferred.
Also, the control over the assigned credits, understood as the factor's ability to sell them to an unrelated third party,
unilaterally and without restrictions, has been transferred to the factor.
The main conditions of these contracts include the advanced collection of the assigned credits that vary between 70%
and 100% of the nominal amount and a percentage of insolvency risk coverage on the factor side that varies between
90% and 100% of the nominal of the assigned credits. |
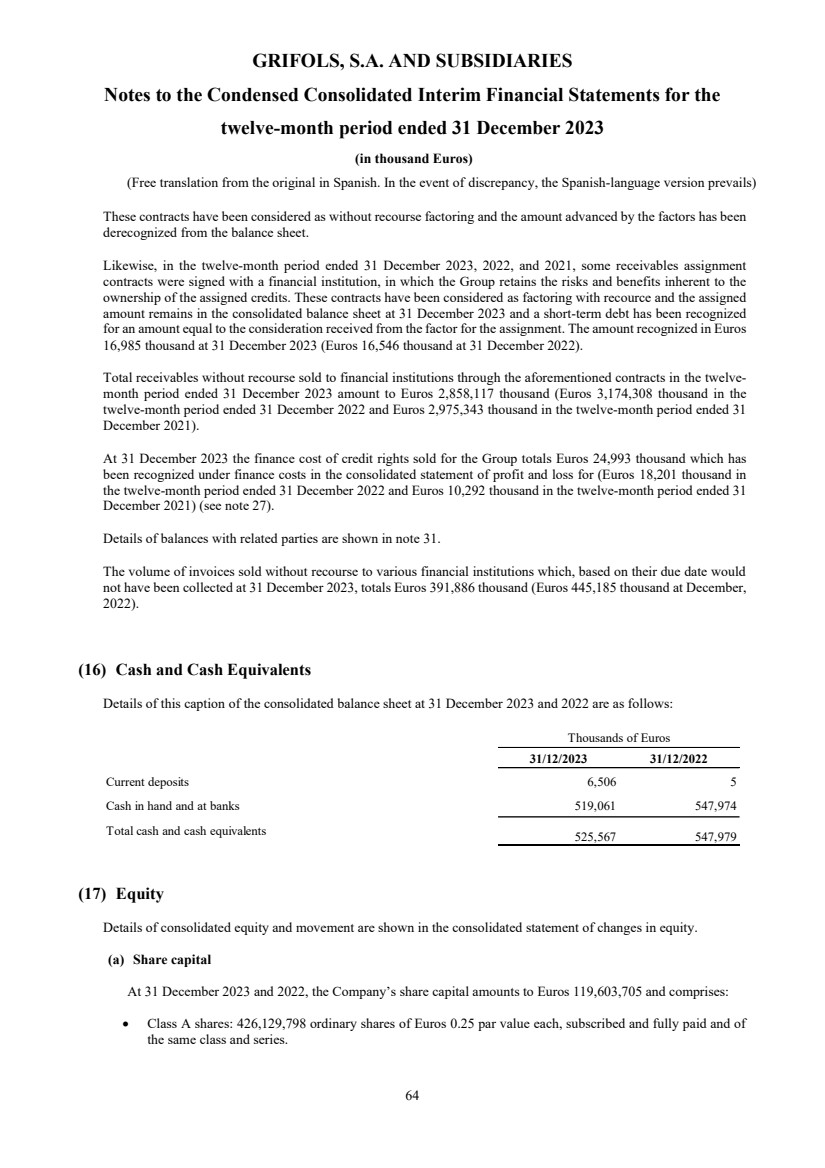
| GRIFOLS, S.A. AND SUBSIDIARIES
Notes to the Condensed Consolidated Interim Financial Statements for the
twelve-month period ended 31 December 2023
(in thousand Euros)
(Free translation from the original in Spanish. In the event of discrepancy, the Spanish-language version prevails)
64
These contracts have been considered as without recourse factoring and the amount advanced by the factors has been
derecognized from the balance sheet.
Likewise, in the twelve-month period ended 31 December 2023, 2022, and 2021, some receivables assignment
contracts were signed with a financial institution, in which the Group retains the risks and benefits inherent to the
ownership of the assigned credits. These contracts have been considered as factoring with recource and the assigned
amount remains in the consolidated balance sheet at 31 December 2023 and a short-term debt has been recognized
for an amount equal to the consideration received from the factor for the assignment. The amount recognized in Euros
16,985 thousand at 31 December 2023 (Euros 16,546 thousand at 31 December 2022).
Total receivables without recourse sold to financial institutions through the aforementioned contracts in the twelve-month period ended 31 December 2023 amount to Euros 2,858,117 thousand (Euros 3,174,308 thousand in the
twelve-month period ended 31 December 2022 and Euros 2,975,343 thousand in the twelve-month period ended 31
December 2021).
At 31 December 2023 the finance cost of credit rights sold for the Group totals Euros 24,993 thousand which has
been recognized under finance costs in the consolidated statement of profit and loss for (Euros 18,201 thousand in
the twelve-month period ended 31 December 2022 and Euros 10,292 thousand in the twelve-month period ended 31
December 2021) (see note 27).
Details of balances with related parties are shown in note 31.
The volume of invoices sold without recourse to various financial institutions which, based on their due date would
not have been collected at 31 December 2023, totals Euros 391,886 thousand (Euros 445,185 thousand at December,
2022).
(16) Cash and Cash Equivalents
Details of this caption of the consolidated balance sheet at 31 December 2023 and 2022 are as follows:
31/12/2023 31/12/2022
Current deposits 6,506 5
Cash in hand and at banks 519,061 547,974
Total cash and cash equivalents 525,567 547,979
Thousands of Euros
(17) Equity
Details of consolidated equity and movement are shown in the consolidated statement of changes in equity.
(a) Share capital
At 31 December 2023 and 2022, the Company’s share capital amounts to Euros 119,603,705 and comprises:
• Class A shares: 426,129,798 ordinary shares of Euros 0.25 par value each, subscribed and fully paid and of
the same class and series. |
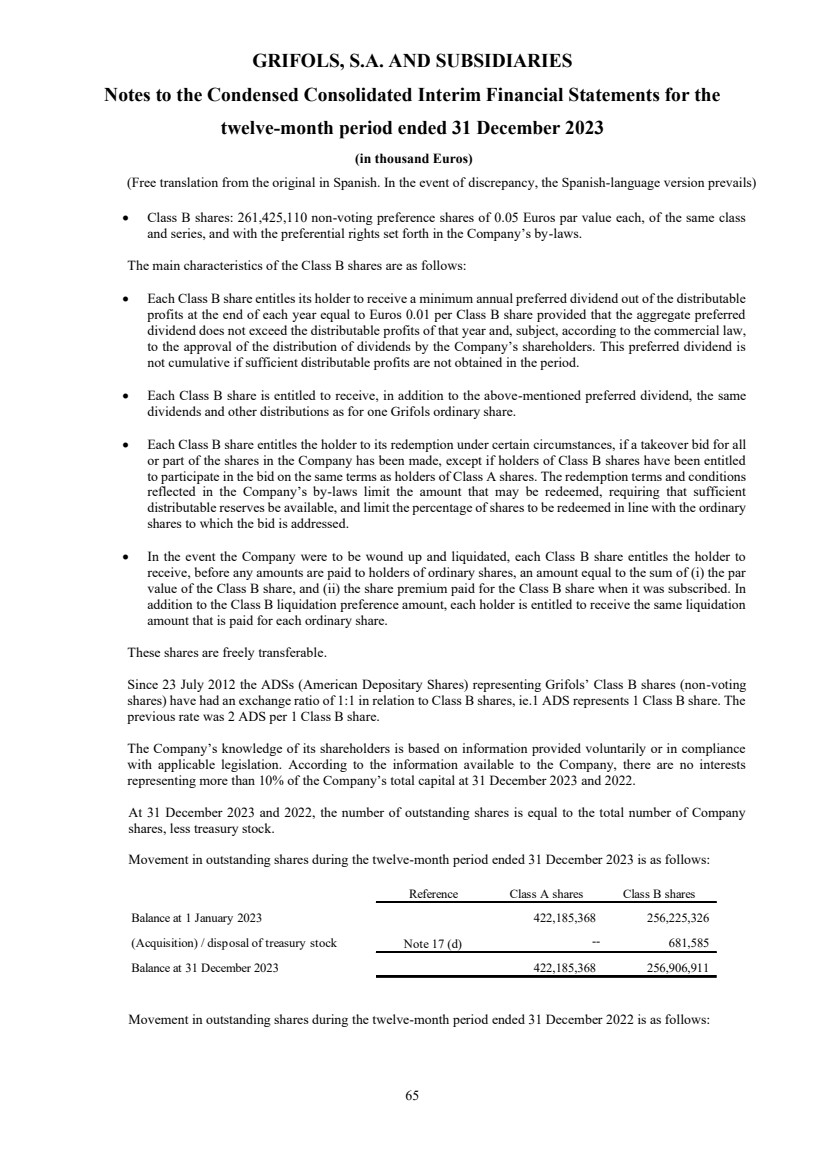
| GRIFOLS, S.A. AND SUBSIDIARIES
Notes to the Condensed Consolidated Interim Financial Statements for the
twelve-month period ended 31 December 2023
(in thousand Euros)
(Free translation from the original in Spanish. In the event of discrepancy, the Spanish-language version prevails)
65
• Class B shares: 261,425,110 non-voting preference shares of 0.05 Euros par value each, of the same class
and series, and with the preferential rights set forth in the Company’s by-laws.
The main characteristics of the Class B shares are as follows:
• Each Class B share entitles its holder to receive a minimum annual preferred dividend out of the distributable
profits at the end of each year equal to Euros 0.01 per Class B share provided that the aggregate preferred
dividend does not exceed the distributable profits of that year and, subject, according to the commercial law,
to the approval of the distribution of dividends by the Company’s shareholders. This preferred dividend is
not cumulative if sufficient distributable profits are not obtained in the period.
• Each Class B share is entitled to receive, in addition to the above-mentioned preferred dividend, the same
dividends and other distributions as for one Grifols ordinary share.
• Each Class B share entitles the holder to its redemption under certain circumstances, if a takeover bid for all
or part of the shares in the Company has been made, except if holders of Class B shares have been entitled
to participate in the bid on the same terms as holders of Class A shares. The redemption terms and conditions
reflected in the Company’s by-laws limit the amount that may be redeemed, requiring that sufficient
distributable reserves be available, and limit the percentage of shares to be redeemed in line with the ordinary
shares to which the bid is addressed.
• In the event the Company were to be wound up and liquidated, each Class B share entitles the holder to
receive, before any amounts are paid to holders of ordinary shares, an amount equal to the sum of (i) the par
value of the Class B share, and (ii) the share premium paid for the Class B share when it was subscribed. In
addition to the Class B liquidation preference amount, each holder is entitled to receive the same liquidation
amount that is paid for each ordinary share.
These shares are freely transferable.
Since 23 July 2012 the ADSs (American Depositary Shares) representing Grifols’ Class B shares (non-voting
shares) have had an exchange ratio of 1:1 in relation to Class B shares, ie.1 ADS represents 1 Class B share. The
previous rate was 2 ADS per 1 Class B share.
The Company’s knowledge of its shareholders is based on information provided voluntarily or in compliance
with applicable legislation. According to the information available to the Company, there are no interests
representing more than 10% of the Company’s total capital at 31 December 2023 and 2022.
At 31 December 2023 and 2022, the number of outstanding shares is equal to the total number of Company
shares, less treasury stock.
Movement in outstanding shares during the twelve-month period ended 31 December 2023 is as follows:
Movement in outstanding shares during the twelve-month period ended 31 December 2022 is as follows:
Reference Class A shares Class B shares
Balance at 1 January 2023 422,185,368 256,225,326
(Acquisition) / disposal of treasury stock Note 17 (d) -- 681,585
Balance at 31 December 2023 422,185,368 256,906,911 |

| GRIFOLS, S.A. AND SUBSIDIARIES
Notes to the Condensed Consolidated Interim Financial Statements for the
twelve-month period ended 31 December 2023
(in thousand Euros)
(Free translation from the original in Spanish. In the event of discrepancy, the Spanish-language version prevails)
66
(b) Share premium
Movement in the share premium is described in the consolidated statement of changes in equity, which forms an
integral part of this note to the condensed consolidated interim financial statements.
(c) Reserves
The drawdown of accumulated gains is subject to legislation applicable to each of the Group companies.
The movement in this caption of the consolidated balance sheet during the twelve-month periods ended at 31
December 2023, 2022 and 2021 is reflected in the consolidated statement of changes in equity, the most
significant movements being detailed below:
Legal reserve
Companies in Spain are obliged to transfer 10% of each year‘s profits to a legal reserve until this reserve reaches
an amount equal to 20% of share capital. This reserve is not distributable to shareholders and may only be used
to offset losses if no other reserves are available. Under certain conditions it may be used to increase share capital
provided that the balance left on the reserve is at least equal to 10% of the nominal value of the total share capital
after the increase.
At 31 December 2023 and 2022 the legal reserve of the Parent amounts to Euros 23,921 thousand which
corresponds to 20% of the share capital.
Distribution of the legal reserves of Spanish companies is subject to the same restrictions as those of the Company
and at 31 December 2023 the balance of the legal reserve of other Spanish companies amounts to Euros 1,711
thousand (Euros 2,066 thousand at 31 December 2022).
Other foreign Group companies have a legal reserve amounting to Euros 4,227 thousand at 31 December 2023
(Euros 4,137 thousand at 31 December 2022).
Unavailable reserve
At 31 December 2023, Euros 7,179 thousand equivalent to the carrying amount of development costs pending
amortization of certain Spanish companies (Euros 18,908 thousand at 31 December 2022) are, in accordance
with applicable legislation, a distribution limitation until these development costs have been amortized.
Hedging reserve
The hedging reserve includes the cash flow hedge reserve and the costs of hedging reserve, see note 4(i) for
details. The cash flow hedge reserve is used to recognise the effective portion of gains or losses on derivatives
that are designated and qualify as cash flow hedges, as described in note 30.
Reference Class A shares Class B shares
Balance at 1 January 2022 422,185,368 256,354,580
(Acquisition) / disposal of treasury stock Note 17 (d) -- (129,254)
Balance at 31 December 2022 422,185,368 256,225,326 |

| GRIFOLS, S.A. AND SUBSIDIARIES
Notes to the Condensed Consolidated Interim Financial Statements for the
twelve-month period ended 31 December 2023
(in thousand Euros)
(Free translation from the original in Spanish. In the event of discrepancy, the Spanish-language version prevails)
67
The group defers the changes in the forward element of forward contracts and the time value of option contracts
in the costs of hedging reserve.
(d) Treasury stock
The Parent held Class A and B treasury stock equivalent to 1.2% of its capital at 31 December 2023 (1.3% of its
capital in Class A and B treasury stock at 31 December 2022).
Treasury stock Class A
During the twelve-month periods ended at 31 December 2023 and 2022, there have been no movements in Class
A treasury shares, with a total of 3,944,430 shares and 89,959 thousand euros.
Treasury stock Class B
Movement in Class B treasury stock during the twelve-month period ended 31 December 2023 was as follows:
In March, May and October 2023, the Group delivered 681,585 treasury stocks (Class B shares) to eligible
employees as compensation under the Restricted Share Unit Retention Plan.
Movement in Class B treasury stock during the twelve-month period ended 31 December 2022 is as follows:
In March 2022, the Group delivered 370,746 treasury stocks (Class B shares) to eligible employees as
compensation under the Restricted Share Unit Retention Plan.
(e) Distribution of profit and dividends
The profits of Grifols, S.A. and subsidiaries will be distributed as agreed by respective shareholders at their
general meetings.
No. of Class B
shares Thousands of Euros
Balance at 1 January 2023 5,199,784 72,261
Disposal Class B shares (681,585) (9,472)
Balance at 31 December 2023 4,518,199 62,789
No. of Class B
shares Thousands of Euros
Balance at 1 January 2022 5,070,530 74,230
Disposal Class B shares (370,746) (5,428)
Acquisition Class B shares 500,000 3,459
Balance at 31 December 2022 5,199,784 72,261 |
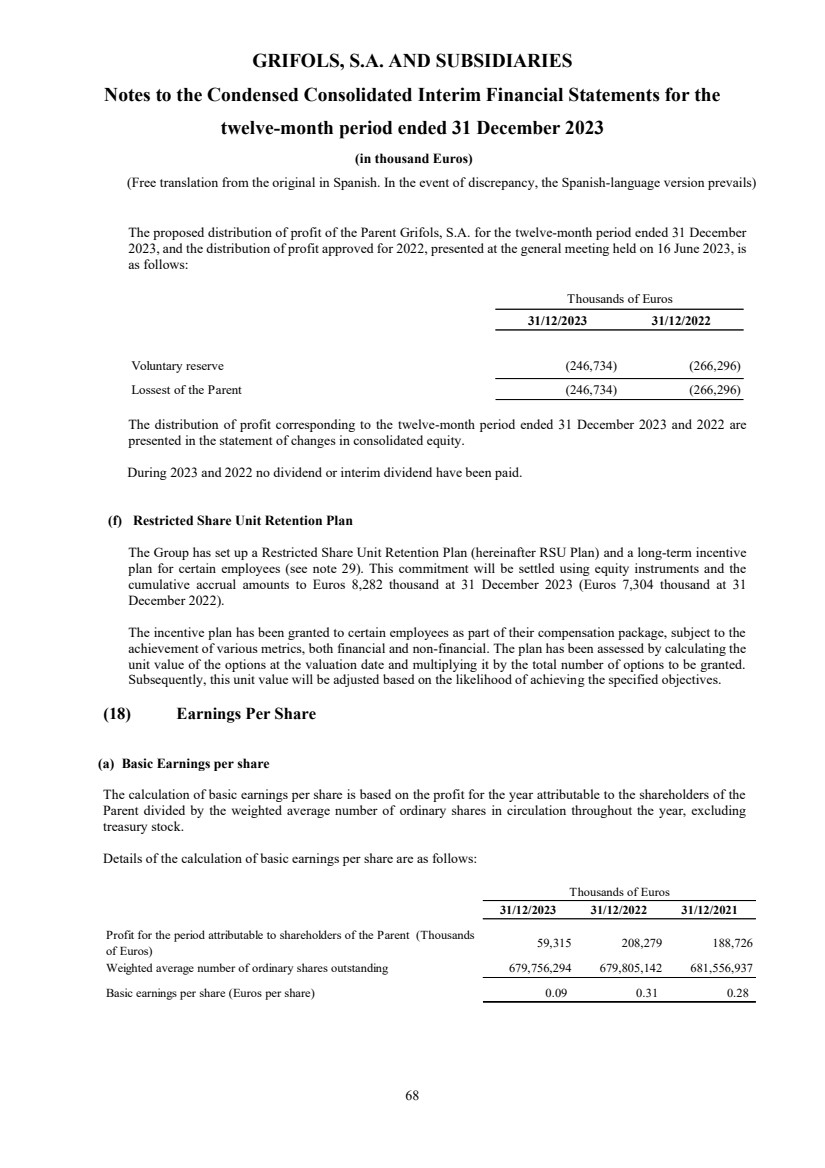
| GRIFOLS, S.A. AND SUBSIDIARIES
Notes to the Condensed Consolidated Interim Financial Statements for the
twelve-month period ended 31 December 2023
(in thousand Euros)
(Free translation from the original in Spanish. In the event of discrepancy, the Spanish-language version prevails)
68
The proposed distribution of profit of the Parent Grifols, S.A. for the twelve-month period ended 31 December
2023, and the distribution of profit approved for 2022, presented at the general meeting held on 16 June 2023, is
as follows:
31/12/2023 31/12/2022
Voluntary reserve (246,734) (266,296)
Lossest of the Parent (246,734) (266,296)
Thousands of Euros
The distribution of profit corresponding to the twelve-month period ended 31 December 2023 and 2022 are
presented in the statement of changes in consolidated equity.
During 2023 and 2022 no dividend or interim dividend have been paid.
(f) Restricted Share Unit Retention Plan
The Group has set up a Restricted Share Unit Retention Plan (hereinafter RSU Plan) and a long-term incentive
plan for certain employees (see note 29). This commitment will be settled using equity instruments and the
cumulative accrual amounts to Euros 8,282 thousand at 31 December 2023 (Euros 7,304 thousand at 31
December 2022).
The incentive plan has been granted to certain employees as part of their compensation package, subject to the
achievement of various metrics, both financial and non-financial. The plan has been assessed by calculating the
unit value of the options at the valuation date and multiplying it by the total number of options to be granted.
Subsequently, this unit value will be adjusted based on the likelihood of achieving the specified objectives.
(18) Earnings Per Share
(a) Basic Earnings per share
The calculation of basic earnings per share is based on the profit for the year attributable to the shareholders of the
Parent divided by the weighted average number of ordinary shares in circulation throughout the year, excluding
treasury stock.
Details of the calculation of basic earnings per share are as follows:
31/12/2023 31/12/2022 31/12/2021
Profit for the period attributable to shareholders of the Parent (Thousands
of Euros) 59,315 208,279 188,726
Weighted average number of ordinary shares outstanding 679,756,294 679,805,142 681,556,937
Basic earnings per share (Euros per share) 0.09 0.31 0.28
Thousands of Euros |

| GRIFOLS, S.A. AND SUBSIDIARIES
Notes to the Condensed Consolidated Interim Financial Statements for the
twelve-month period ended 31 December 2023
(in thousand Euros)
(Free translation from the original in Spanish. In the event of discrepancy, the Spanish-language version prevails)
69
The weighted average number of ordinary shares outstanding (basic) is as follows:
(b) Diluted Earnings per share
Diluted earnings per share are calculated by dividing profit for the year attributable to shareholders of the Parent by
the weighted average number of ordinary shares in circulation considering the diluting effects of potential ordinary
shares.
The RSU Plan granted by the Group and payable in shares, assumes the existence of dilutive potential shares. Diluted
earnings per share have been calculated as follows:
31/12/2023 31/12/2022 31/12/2021
Profit for the period attributable to shareholders of the Parent (Thousands
of Euros) 59,315 208,279 188,726
Weighted average number of ordinary shares outstanding (diluted) 677,101,992 679,292,729 681,404,922
Diluted earnings per share (Euros per share) 0.09 0.31 0.28
Thousands of Euros
The weighted average number of ordinary shares outstanding diluted has been calculated as follows:
31/12/2023 31/12/2022 31/12/2021
Issued shares outstanding at 1 January 679,469,076 679,598,330 685,601,126
Effect of shares issued 287,218 206,812 (4,044,189)
Weighted average number of ordinary shares outstanding
(basic) at 31 December 679,756,294 679,805,142 681,556,937
Number of shares
31/12/2023 31/12/2022 31/12/2021
Ordinary shares outstanding at 1 January 679,469,076 679,598,330 685,601,126
Shares committed under RSU plan (2,654,302) (512,413) (152,015)
Effect of treasury stock 287,218 206,812 (4,044,189)
Weighted average number of ordinary shares outstanding (diluted) at 31
December 677,101,992 679,292,729 681,404,922
Number of shares |

| GRIFOLS, S.A. AND SUBSIDIARIES
Notes to the Condensed Consolidated Interim Financial Statements for the
twelve-month period ended 31 December 2023
(in thousand Euros)
(Free translation from the original in Spanish. In the event of discrepancy, the Spanish-language version prevails)
70
(19) Non-Controlling Interests
Details of non-controlling interests and movement at 31 December 2023 are as follows:
Reference Balance at
31/12/2022 Additions
Business
combinations /
Perimeter
additions
Dividends Other
movements
Translation
differences
Balance at
31/12/2023
Grifols (Thailand) Pte Ltd 4,779 642 -- (28) -- (149) 5,244
Grifols Malaysia Sdn Bhd 3,663 850 -- -- -- (283) 4,230
Araclon Biotech, S.A. (593) (544) -- -- -- -- (1,137)
Kiro Grifols, S.L. (25) (301) 326 -- -- -- 0
Haema AG 228,684 24,936 -- -- -- -- 253,620
BPC Plasma, Inc 354,502 67,892 -- (266,406) 11 (8,342) 147,657
Grifols Diagnostics Solutions Inc. 1,353,674 39,670 -- -- 74 (46,095) 1,347,323
Plasmavita Healthcare 10,134 2,634 -- -- -- -- 12,768
Haema Plasma Kft 11,939 7,767 -- -- -- 638 20,344
G Pyrenees Research Cntr (6) (12) -- -- 40 -- 22
Albimmune SL (741) (1,021) -- -- -- -- (1,762)
Biotest AG Note 3 361,596 (21,161) 6,283 -- (64) 10,356 357,010
2,327,606 121,352 6,609 (266,434) 61 (43,875) 2,145,319
Thousands of Euros
During the twelve-month period ended 31 December 2023, BPC Plasma, Inc. distributed a dividend without cash
outflow compensating Other non-current financial assets. This dividend corresponds to the result of the previous 4
financial years, valued at Euros 266,406 thousand to its shareholder Scranton Plasma B.V. This distribution has had
an impact against the non-controlling interest group's reserves (see note 19).
Details of non-controlling interests and movement at 31 December 2022 are as follows:
Reference Balance at
31/12/2021 Additions
Business
combinations /
Perimeter
additions
Other
movements
Translation
differences
Balance at
31/12/2022
Grifols (Thailand) Pte Ltd 4,417 282 -- (23) 103 4,779
Grifols Malaysia Sdn Bhd 3,059 593 -- -- 11 3,663
Araclon Biotech, S.A. 240 (833) -- -- -- (593)
VCN Bioscience, S.L 97 -- -- (97) -- --
Kiro Grifols, S.L. 284 (312) -- 3 -- (25)
Haema AG 233,542 (4,858) -- -- -- 228,684
BPC Plasma, Inc 305,276 30,086 -- -- 19,140 354,502
Grifols Diagnostics Solutions Inc. 1,234,850 46,719 -- 111 71,994 1,353,674
Plasmavita Healthcare 11,724 (1,590) -- -- -- 10,134
Haema Plasma Kft -- (4,074) 17,080 -- (1,067) 11,939
G Pyrenees Research Cntr -- (7) 1 -- -- (6)
Albimmune SL -- (742) 1 -- -- (741)
Biotest AG Note 3 -- (2,397) 356,386 8 7,599 361,596
1,793,489 62,867 373,468 2 97,780 2,327,606
Thousands of Euros
On 25 April 2022, the Group acquired 70.18% of the shares in Biotest AG. Consequently, the information relating
to Biotest, AG corresponds to the period from 1 May to 31 December 2022. |
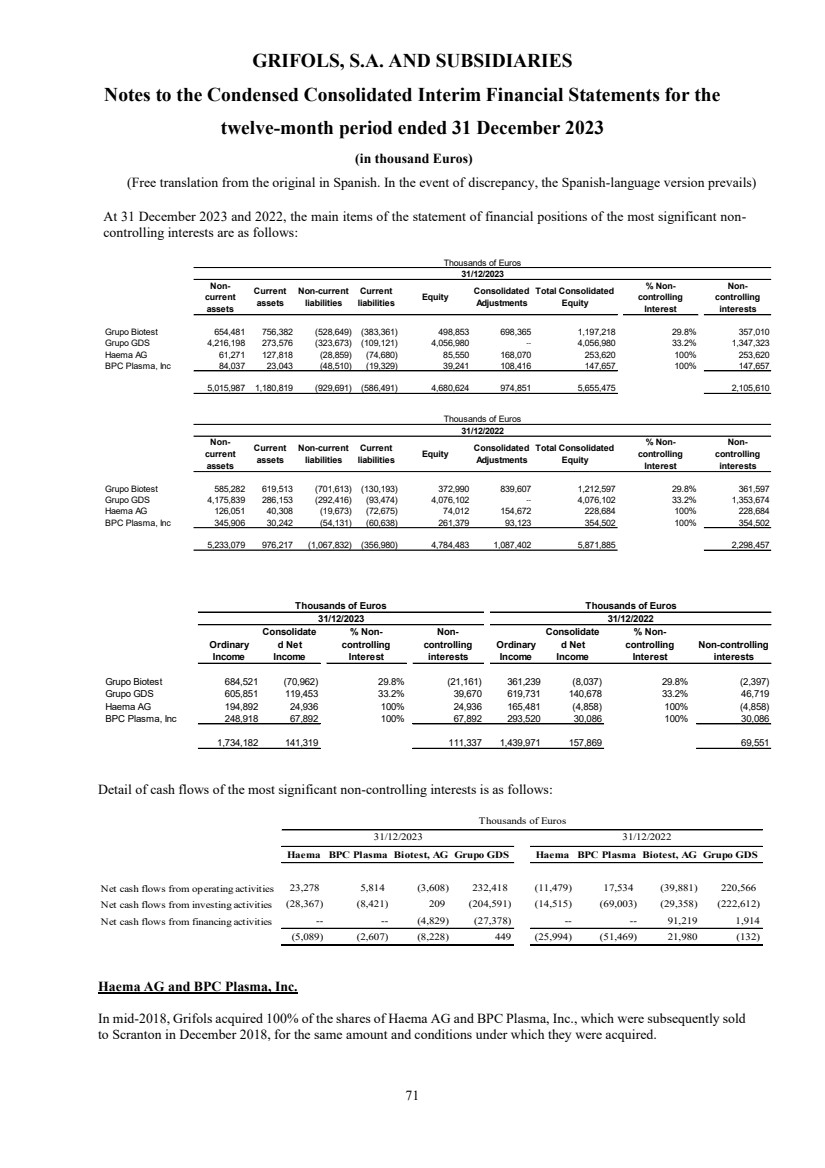
| GRIFOLS, S.A. AND SUBSIDIARIES
Notes to the Condensed Consolidated Interim Financial Statements for the
twelve-month period ended 31 December 2023
(in thousand Euros)
(Free translation from the original in Spanish. In the event of discrepancy, the Spanish-language version prevails)
71
At 31 December 2023 and 2022, the main items of the statement of financial positions of the most significant non-controlling interests are as follows:
Detail of cash flows of the most significant non-controlling interests is as follows:
Haema BPC Plasma Biotest, AG Grupo GDS Haema BPC Plasma Biotest, AG Grupo GDS
Net cash flows from operating activities 23,278 5,814 (3,608) 232,418 (11,479) 17,534 (39,881) 220,566
Net cash flows from investing activities (28,367) (8,421) 209 (204,591) (14,515) (69,003) (29,358) (222,612)
Net cash flows from financing activities -- -- (4,829) (27,378) -- -- 91,219 1,914
(5,089) (2,607) (8,228) 449 (25,994) (51,469) 21,980 (132)
31/12/2023 31/12/2022
Thousands of Euros
Haema AG and BPC Plasma, Inc.
In mid-2018, Grifols acquired 100% of the shares of Haema AG and BPC Plasma, Inc., which were subsequently sold
to Scranton in December 2018, for the same amount and conditions under which they were acquired.
Non-current
assets
Current
assets
Non-current
liabilities
Current
liabilities Equity Consolidated
Adjustments
Total Consolidated
Equity
% Non-controlling
Interest
Non-controlling
interests
Grupo Biotest 654,481 756,382 (528,649) (383,361) 498,853 698,365 1,197,218 29.8% 357,010
Grupo GDS 4,216,198 273,576 (323,673) (109,121) 4,056,980 -- 4,056,980 33.2% 1,347,323
Haema AG 61,271 127,818 (28,859) (74,680) 85,550 168,070 253,620 100% 253,620
BPC Plasma, Inc 84,037 23,043 (48,510) (19,329) 39,241 108,416 147,657 100% 147,657
5,015,987 1,180,819 (929,691) (586,491) 4,680,624 974,851 5,655,475 2,105,610
Thousands of Euros
31/12/2023
Non-current
assets
Current
assets
Non-current
liabilities
Current
liabilities Equity Consolidated
Adjustments
Total Consolidated
Equity
% Non-controlling
Interest
Non-controlling
interests
Grupo Biotest 585,282 619,513 (701,613) (130,193) 372,990 839,607 1,212,597 29.8% 361,597
Grupo GDS 4,175,839 286,153 (292,416) (93,474) 4,076,102 -- 4,076,102 33.2% 1,353,674
Haema AG 126,051 40,308 (19,673) (72,675) 74,012 154,672 228,684 100% 228,684
BPC Plasma, Inc 345,906 30,242 (54,131) (60,638) 261,379 93,123 354,502 100% 354,502
5,233,079 976,217 (1,067,832) (356,980) 4,784,483 1,087,402 5,871,885 2,298,457
Thousands of Euros
31/12/2022
Ordinary
Income
Consolidate
d Net
Income
% Non-controlling
Interest
Non-controlling
interests
Ordinary
Income
Consolidate
d Net
Income
% Non-controlling
Interest
Non-controlling
interests
Grupo Biotest 684,521 (70,962) 29.8% (21,161) 361,239 (8,037) 29.8% (2,397)
Grupo GDS 605,851 119,453 33.2% 39,670 619,731 140,678 33.2% 46,719
Haema AG 194,892 24,936 100% 24,936 165,481 (4,858) 100% (4,858)
BPC Plasma, Inc 248,918 67,892 100% 67,892 293,520 30,086 100% 30,086
1,734,182 141,319 111,337 1,439,971 157,869 69,551
Thousands of Euros Thousands of Euros
31/12/2023 31/12/2022 |
| GRIFOLS, S.A. AND SUBSIDIARIES
Notes to the Condensed Consolidated Interim Financial Statements for the
twelve-month period ended 31 December 2023
(in thousand Euros)
(Free translation from the original in Spanish. In the event of discrepancy, the Spanish-language version prevails)
72
The following indicators support the power that Grifols maintains over these companies, even after their sale to
Scranton and that, therefore, it retains control over Haema and BPC in accordance with IFRS 10:
- Grifols has an option to repurchase 100% of both companies exercisable at any time, which, in addition, has a
substantive character insofar as there are no restrictions on its exercise (even when the sales contract includes a nullity
clause of the option in the event of default by the buyer, Grifols will maintain the ability to exercise said purchase
option in the 90-day period that the buyer has to remedy a non-payment situation);
- There are no shareholder agreements that establish that relevant decisions are approved in a manner different
from by majority vote.
- Grifols has the financial capacity to exercise the purchase option;
- Although Grifols does not have voting rights, it maintains power in both companies, through its ability to exercise
the repurchase option which grants it potential voting rights;
- Furthermore, Grifols is the manager of both companies through the management contract in the plasma collection
business of the donation centers, which includes general management and joint approval of the business plan, granting
the intellectual property license and know-how.
- Additionally, there is a plasma supply agreement for 30 years where the plasma that these entities will produce
will be almost entirely to meet Grifols' needs. The sale price of the plasma is established based on the full cost of
production, plus a fixed margin. There is no exclusivity of sale. Both contracts have the same duration.
Therefore, although Scranton owns all of the voting rights, Grifols manages the businesses and acquires 100% of BPC
and Haema's production and in the event of any discrepancy between Scranton and Grifols, Grifols has the ability to
exercise the right of the purchase option at any time.
As a result of all of the above, Grifols has the power to direct the relevant activities of these companies, since it
manages them and jointly determines their business plan, having the unilateral right to repurchase 100% of both
companies. The fact that Grifols has a currently exercisable purchase option implies that it acts as principal in the
exercise of power (i) through the management contract and (ii) by not having delegated said power. Therefore, Grifols
maintains control in both companies and therefore consolidates them.
In relation to the purchase option and given that it is based on a variable number of shares and a variable acquisition
price, said instrument is a derivative financial instrument that must be valued at fair value with changes in the profit
and loss account.
Based on the contractual conditions, Grifols has estimated the price of the option as (i) the price for which the shares
have been sold to Scranton (US Dollars 538,000,000) plus (ii) the variation in working capital, which, given the
business model of both companies, will be mainly represented by undistributed profits. Insofar as the exercise price
has been established for a value similar to the fair value of BPC and Haema, the option does not have a significant
value. On the other hand, since the valuation of the option is based on non-observable market variables, it corresponds
to Level 3 of the fair value hierarchy. Considering the uncertainties underlying the valuation of the option as it deals
with non-observable variables, and the value of the same not being significant, said value has not been recognized as
of 31 December 2023 and 2022.
Likewise, both the shares of Haema AG and the shares of BPC Plasma Inc. are currently pledged as collateral for the
loan from Scranton Plasma BV with Bank of America. If a default occurs under the loan agreement, as long as the
financing banks have not executed the corresponding pledge, Grifols may exercise the purchase option. Grifols will
pay the bank in preference to Scranton Plasma BV until the amount of the debt at the time of acquisition is settled.
There is no time limitation in the loan agreement for Grifols to exercise the repurchase option. |
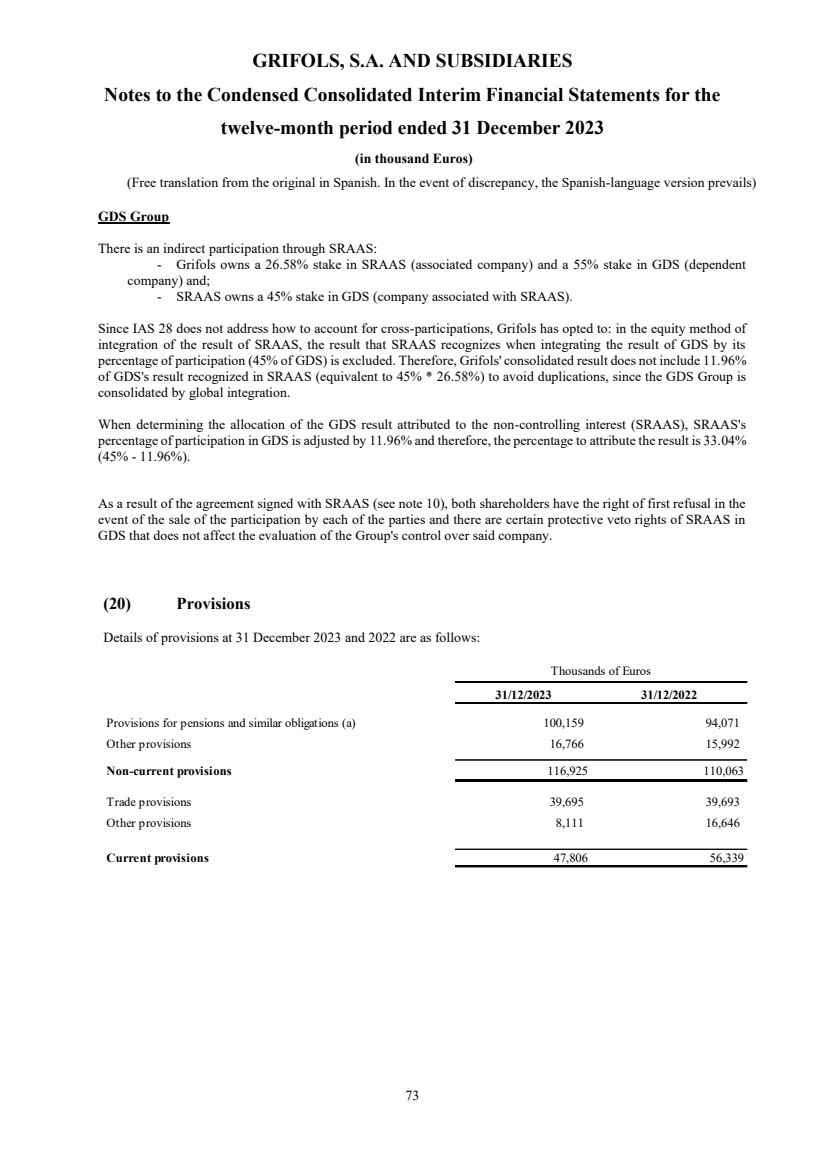
| GRIFOLS, S.A. AND SUBSIDIARIES
Notes to the Condensed Consolidated Interim Financial Statements for the
twelve-month period ended 31 December 2023
(in thousand Euros)
(Free translation from the original in Spanish. In the event of discrepancy, the Spanish-language version prevails)
73
GDS Group
There is an indirect participation through SRAAS:
- Grifols owns a 26.58% stake in SRAAS (associated company) and a 55% stake in GDS (dependent
company) and;
- SRAAS owns a 45% stake in GDS (company associated with SRAAS).
Since IAS 28 does not address how to account for cross-participations, Grifols has opted to: in the equity method of
integration of the result of SRAAS, the result that SRAAS recognizes when integrating the result of GDS by its
percentage of participation (45% of GDS) is excluded. Therefore, Grifols' consolidated result does not include 11.96%
of GDS's result recognized in SRAAS (equivalent to 45% * 26.58%) to avoid duplications, since the GDS Group is
consolidated by global integration.
When determining the allocation of the GDS result attributed to the non-controlling interest (SRAAS), SRAAS's
percentage of participation in GDS is adjusted by 11.96% and therefore, the percentage to attribute the result is 33.04%
(45% - 11.96%).
As a result of the agreement signed with SRAAS (see note 10), both shareholders have the right of first refusal in the
event of the sale of the participation by each of the parties and there are certain protective veto rights of SRAAS in
GDS that does not affect the evaluation of the Group's control over said company.
(20) Provisions
Details of provisions at 31 December 2023 and 2022 are as follows:
31/12/2023 31/12/2022
Provisions for pensions and similar obligations (a) 100,159 94,071
Other provisions 16,766 15,992
Non-current provisions 116,925 110,063
Trade provisions 39,695 39,693
Other provisions 8,111 16,646
Current provisions 47,806 56,339
Thousands of Euros |
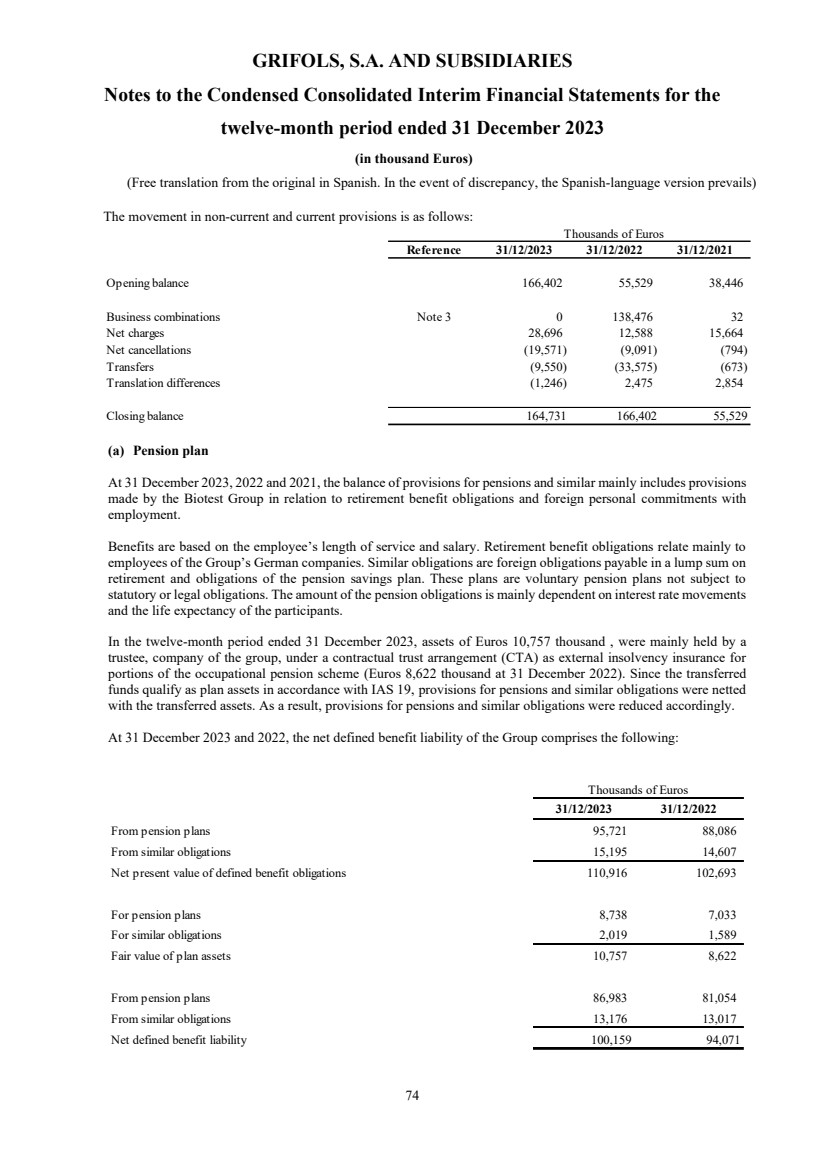
| GRIFOLS, S.A. AND SUBSIDIARIES
Notes to the Condensed Consolidated Interim Financial Statements for the
twelve-month period ended 31 December 2023
(in thousand Euros)
(Free translation from the original in Spanish. In the event of discrepancy, the Spanish-language version prevails)
74
The movement in non-current and current provisions is as follows:
(a) Pension plan
At 31 December 2023, 2022 and 2021, the balance of provisions for pensions and similar mainly includes provisions
made by the Biotest Group in relation to retirement benefit obligations and foreign personal commitments with
employment.
Benefits are based on the employee’s length of service and salary. Retirement benefit obligations relate mainly to
employees of the Group’s German companies. Similar obligations are foreign obligations payable in a lump sum on
retirement and obligations of the pension savings plan. These plans are voluntary pension plans not subject to
statutory or legal obligations. The amount of the pension obligations is mainly dependent on interest rate movements
and the life expectancy of the participants.
In the twelve-month period ended 31 December 2023, assets of Euros 10,757 thousand , were mainly held by a
trustee, company of the group, under a contractual trust arrangement (CTA) as external insolvency insurance for
portions of the occupational pension scheme (Euros 8,622 thousand at 31 December 2022). Since the transferred
funds qualify as plan assets in accordance with IAS 19, provisions for pensions and similar obligations were netted
with the transferred assets. As a result, provisions for pensions and similar obligations were reduced accordingly.
At 31 December 2023 and 2022, the net defined benefit liability of the Group comprises the following:
Reference 31/12/2023 31/12/2022 31/12/2021
Opening balance 166,402 55,529 38,446
Business combinations Note 3 0 138,476 32
Net charges 28,696 12,588 15,664
Net cancellations (19,571) (9,091) (794)
Transfers (9,550) (33,575) (673)
Translation differences (1,246) 2,475 2,854
Closing balance 164,731 166,402 55,529
Thousands of Euros
31/12/2023 31/12/2022
From pension plans 95,721 88,086
From similar obligations 15,195 14,607
Net present value of defined benefit obligations 110,916 102,693
For pension plans 8,738 7,033
For similar obligations 2,019 1,589
Fair value of plan assets 10,757 8,622
From pension plans 86,983 81,054
From similar obligations 13,176 13,017
Net defined benefit liability 100,159 94,071
Thousands of Euros |
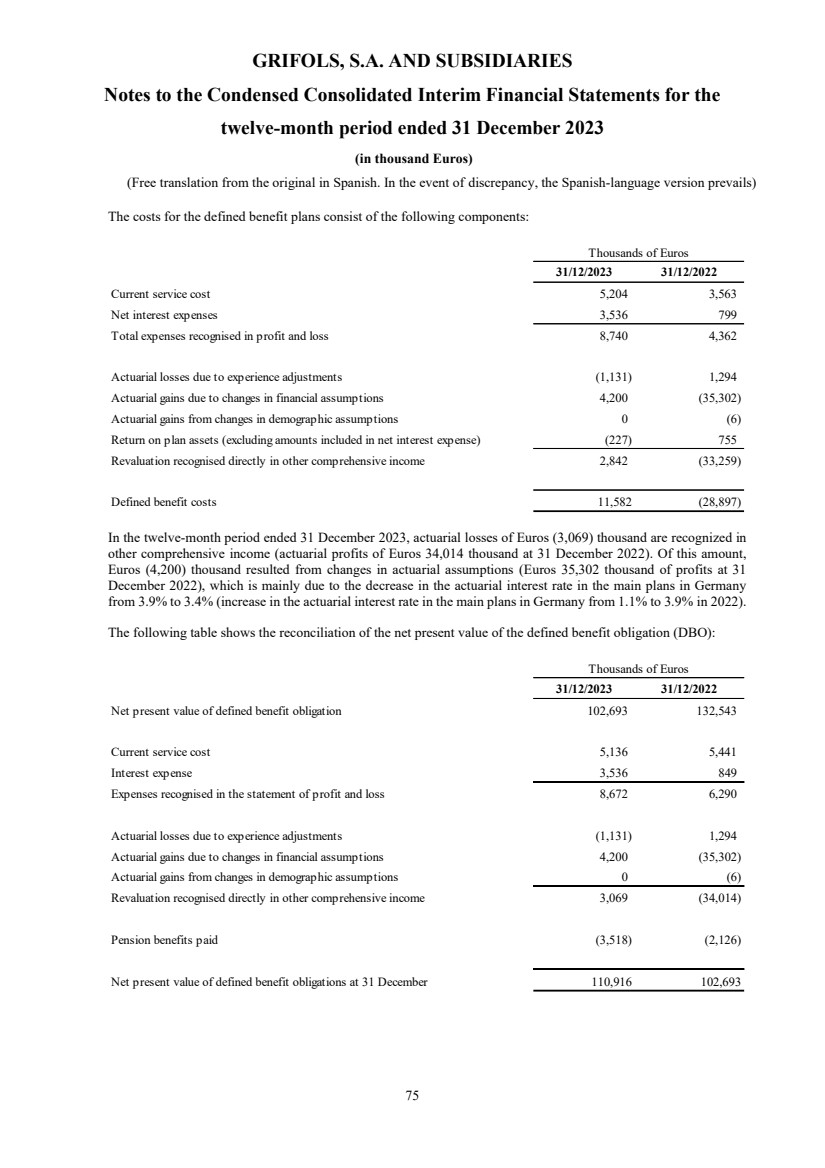
| GRIFOLS, S.A. AND SUBSIDIARIES
Notes to the Condensed Consolidated Interim Financial Statements for the
twelve-month period ended 31 December 2023
(in thousand Euros)
(Free translation from the original in Spanish. In the event of discrepancy, the Spanish-language version prevails)
75
The costs for the defined benefit plans consist of the following components:
In the twelve-month period ended 31 December 2023, actuarial losses of Euros (3,069) thousand are recognized in
other comprehensive income (actuarial profits of Euros 34,014 thousand at 31 December 2022). Of this amount,
Euros (4,200) thousand resulted from changes in actuarial assumptions (Euros 35,302 thousand of profits at 31
December 2022), which is mainly due to the decrease in the actuarial interest rate in the main plans in Germany
from 3.9% to 3.4% (increase in the actuarial interest rate in the main plans in Germany from 1.1% to 3.9% in 2022).
The following table shows the reconciliation of the net present value of the defined benefit obligation (DBO):
31/12/2023 31/12/2022
Current service cost 5,204 3,563
Net interest expenses 3,536 799
Total expenses recognised in profit and loss 8,740 4,362
Actuarial losses due to experience adjustments (1,131) 1,294
Actuarial gains due to changes in financial assumptions 4,200 (35,302)
Actuarial gains from changes in demographic assumptions 0 (6)
Return on plan assets (excluding amounts included in net interest expense) (227) 755
Revaluation recognised directly in other comprehensive income 2,842 (33,259)
Defined benefit costs 11,582 (28,897)
Thousands of Euros
31/12/2023 31/12/2022
Net present value of defined benefit obligation 102,693 132,543
Current service cost 5,136 5,441
Interest expense 3,536 849
Expenses recognised in the statement of profit and loss 8,672 6,290
Actuarial losses due to experience adjustments (1,131) 1,294
Actuarial gains due to changes in financial assumptions 4,200 (35,302)
Actuarial gains from changes in demographic assumptions 0 (6)
Revaluation recognised directly in other comprehensive income 3,069 (34,014)
Pension benefits paid (3,518) (2,126)
Net present value of defined benefit obligations at 31 December 110,916 102,693
Thousands of Euros |
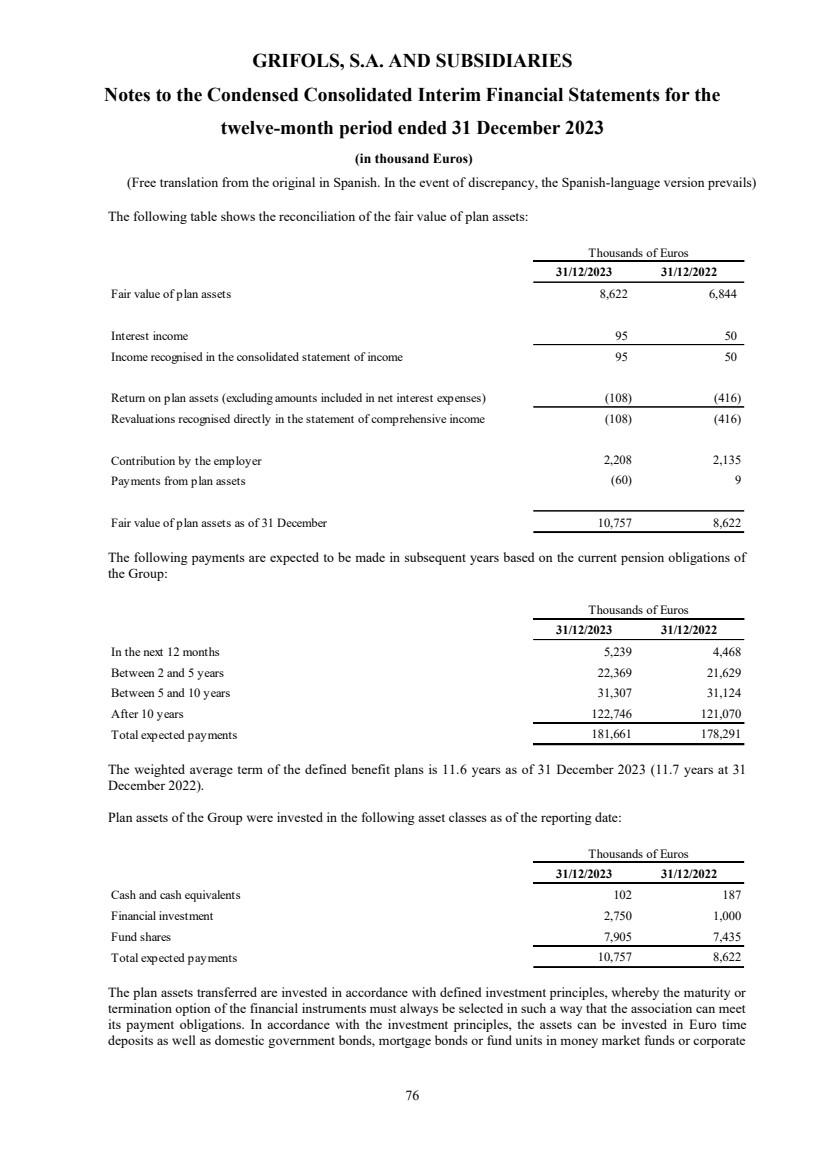
| GRIFOLS, S.A. AND SUBSIDIARIES
Notes to the Condensed Consolidated Interim Financial Statements for the
twelve-month period ended 31 December 2023
(in thousand Euros)
(Free translation from the original in Spanish. In the event of discrepancy, the Spanish-language version prevails)
76
The following table shows the reconciliation of the fair value of plan assets:
The following payments are expected to be made in subsequent years based on the current pension obligations of
the Group:
The weighted average term of the defined benefit plans is 11.6 years as of 31 December 2023 (11.7 years at 31
December 2022).
Plan assets of the Group were invested in the following asset classes as of the reporting date:
The plan assets transferred are invested in accordance with defined investment principles, whereby the maturity or
termination option of the financial instruments must always be selected in such a way that the association can meet
its payment obligations. In accordance with the investment principles, the assets can be invested in Euro time
deposits as well as domestic government bonds, mortgage bonds or fund units in money market funds or corporate
31/12/2023 31/12/2022
Fair value of plan assets 8,622 6,844
Interest income 95 50
Income recognised in the consolidated statement of income 95 50
Return on plan assets (excluding amounts included in net interest expenses) (108) (416)
Revaluations recognised directly in the statement of comprehensive income (108) (416)
Contribution by the employer 2,208 2,135
Payments from plan assets (60) 9
Fair value of plan assets as of 31 December 10,757 8,622
Thousands of Euros
31/12/2023 31/12/2022
In the next 12 months 5,239 4,468
Between 2 and 5 years 22,369 21,629
Between 5 and 10 years 31,307 31,124
After 10 years 122,746 121,070
Total expected payments 181,661 178,291
Thousands of Euros
31/12/2023 31/12/2022
Cash and cash equivalents 102 187
Financial investment 2,750 1,000
Fund shares 7,905 7,435
Total expected payments 10,757 8,622
Thousands of Euros |
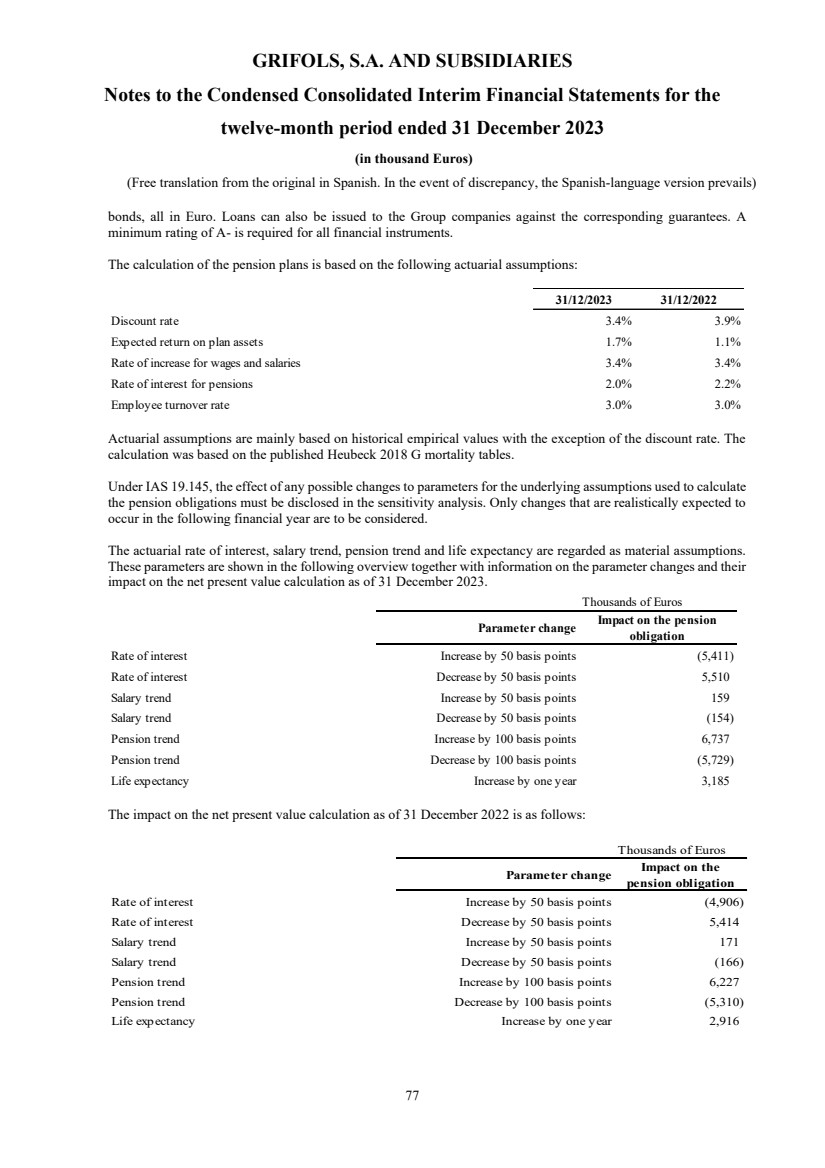
| GRIFOLS, S.A. AND SUBSIDIARIES
Notes to the Condensed Consolidated Interim Financial Statements for the
twelve-month period ended 31 December 2023
(in thousand Euros)
(Free translation from the original in Spanish. In the event of discrepancy, the Spanish-language version prevails)
77
bonds, all in Euro. Loans can also be issued to the Group companies against the corresponding guarantees. A
minimum rating of A- is required for all financial instruments.
The calculation of the pension plans is based on the following actuarial assumptions:
Actuarial assumptions are mainly based on historical empirical values with the exception of the discount rate. The
calculation was based on the published Heubeck 2018 G mortality tables.
Under IAS 19.145, the effect of any possible changes to parameters for the underlying assumptions used to calculate
the pension obligations must be disclosed in the sensitivity analysis. Only changes that are realistically expected to
occur in the following financial year are to be considered.
The actuarial rate of interest, salary trend, pension trend and life expectancy are regarded as material assumptions.
These parameters are shown in the following overview together with information on the parameter changes and their
impact on the net present value calculation as of 31 December 2023.
The impact on the net present value calculation as of 31 December 2022 is as follows:
Thousands of Euros
Parameter change
Impact on the
pension obligation
Rate of interest Increase by 50 basis points (4,906)
Rate of interest Decrease by 50 basis points 5,414
Salary trend Increase by 50 basis points 171
Salary trend Decrease by 50 basis points (166)
Pension trend Increase by 100 basis points 6,227
Pension trend Decrease by 100 basis points (5,310)
Life expectancy Increase by one year 2,916
31/12/2023 31/12/2022
Discount rate 3.4% 3.9%
Expected return on plan assets 1.7% 1.1%
Rate of increase for wages and salaries 3.4% 3.4%
Rate of interest for pensions 2.0% 2.2%
Employee turnover rate 3.0% 3.0%
Thousands of Euros
Parameter change
Impact on the pension
obligation
Rate of interest Increase by 50 basis points (5,411)
Rate of interest Decrease by 50 basis points 5,510
Salary trend Increase by 50 basis points 159
Salary trend Decrease by 50 basis points (154)
Pension trend Increase by 100 basis points 6,737
Pension trend Decrease by 100 basis points (5,729)
Life expectancy Increase by one year 3,185 |
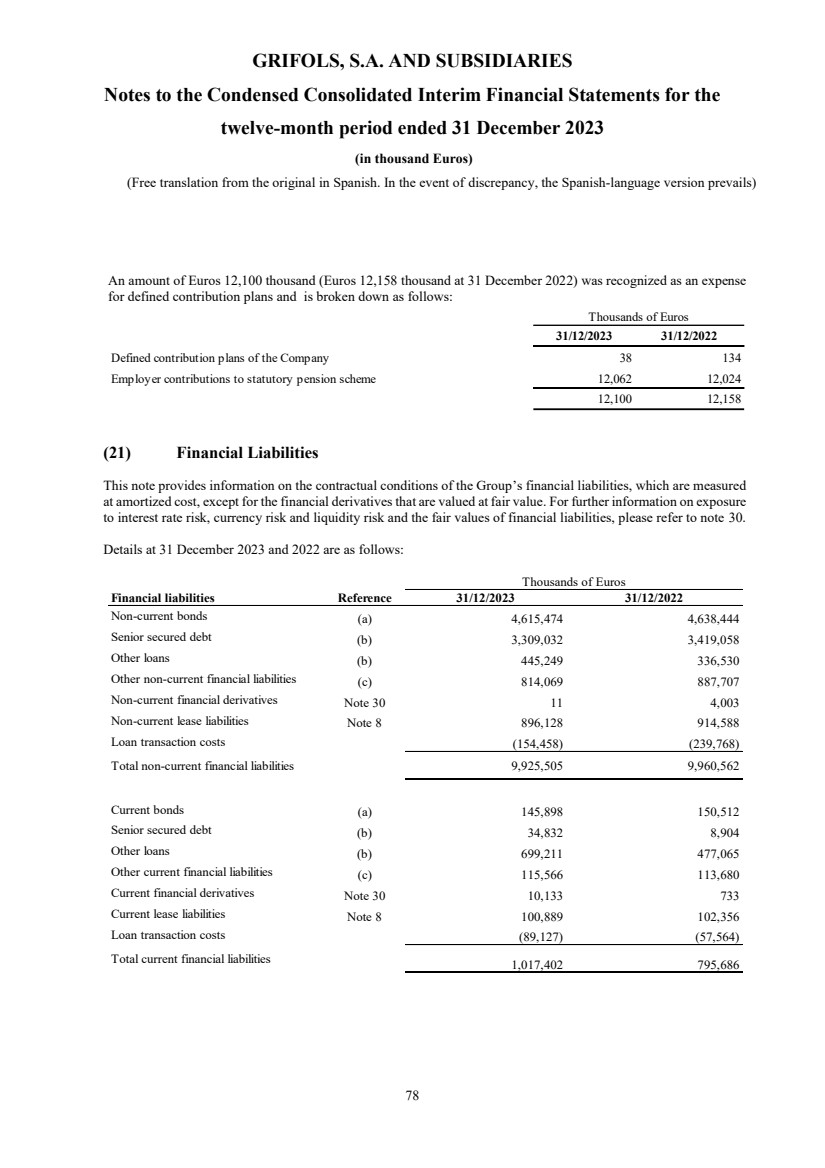
| GRIFOLS, S.A. AND SUBSIDIARIES
Notes to the Condensed Consolidated Interim Financial Statements for the
twelve-month period ended 31 December 2023
(in thousand Euros)
(Free translation from the original in Spanish. In the event of discrepancy, the Spanish-language version prevails)
78
An amount of Euros 12,100 thousand (Euros 12,158 thousand at 31 December 2022) was recognized as an expense
for defined contribution plans and is broken down as follows:
(21) Financial Liabilities
This note provides information on the contractual conditions of the Group’s financial liabilities, which are measured
at amortized cost, except for the financial derivatives that are valued at fair value. For further information on exposure
to interest rate risk, currency risk and liquidity risk and the fair values of financial liabilities, please refer to note 30.
Details at 31 December 2023 and 2022 are as follows:
Financial liabilities Reference 31/12/2023 31/12/2022
Non-current bonds (a) 4,615,474 4,638,444
Senior secured debt (b) 3,309,032 3,419,058
Other loans (b) 445,249 336,530
Other non-current financial liabilities (c) 814,069 887,707
Non-current financial derivatives Note 30 11 4,003
Non-current lease liabilities Note 8 896,128 914,588
Loan transaction costs (154,458) (239,768)
Total non-current financial liabilities 9,925,505 9,960,562
Current bonds (a) 145,898 150,512
Senior secured debt (b) 34,832 8,904
Other loans (b) 699,211 477,065
Other current financial liabilities (c) 115,566 113,680
Current financial derivatives Note 30 10,133 733
Current lease liabilities Note 8 100,889 102,356
Loan transaction costs (89,127) (57,564)
Total current financial liabilities 1,017,402 795,686
Thousands of Euros
31/12/2023 31/12/2022
Defined contribution plans of the Company 38 134
Employer contributions to statutory pension scheme 12,062 12,024
12,100 12,158
Thousands of Euros |
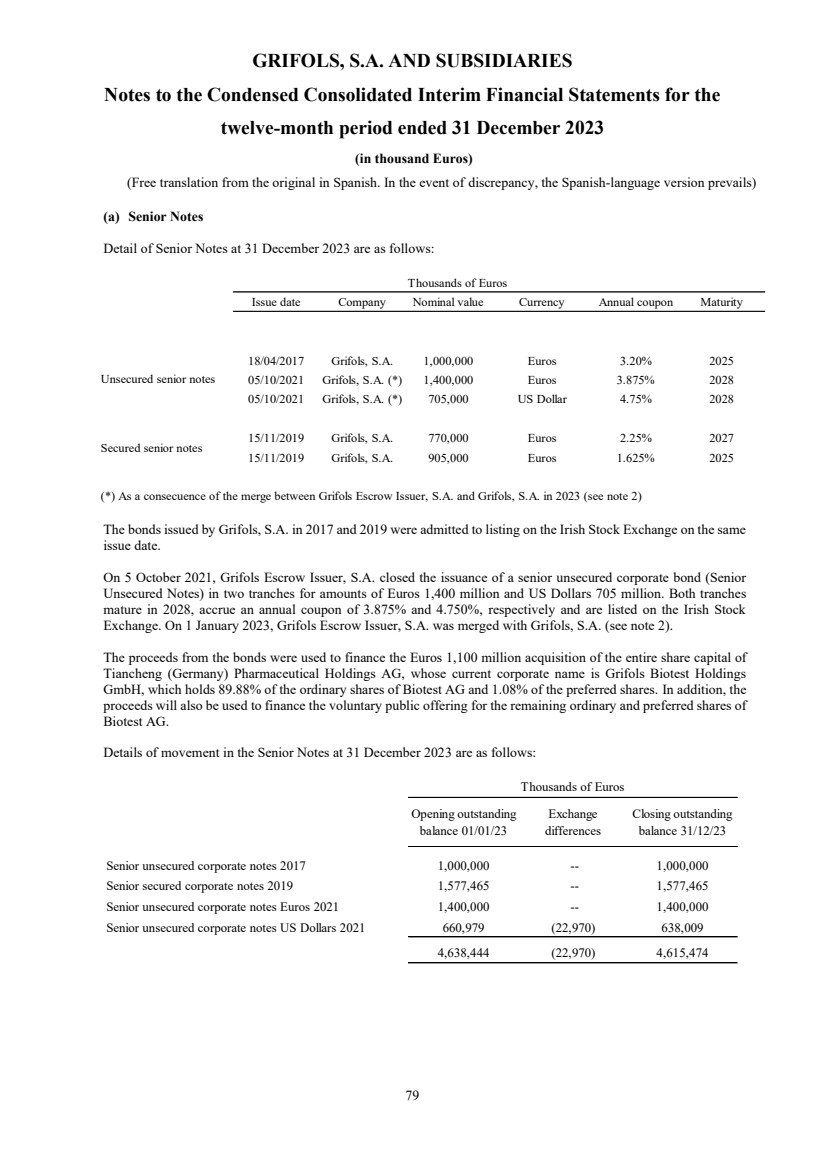
| GRIFOLS, S.A. AND SUBSIDIARIES
Notes to the Condensed Consolidated Interim Financial Statements for the
twelve-month period ended 31 December 2023
(in thousand Euros)
(Free translation from the original in Spanish. In the event of discrepancy, the Spanish-language version prevails)
79
(a) Senior Notes
Detail of Senior Notes at 31 December 2023 are as follows:
Thousands of Euros
Issue date Company Nominal value Currency Annual coupon Maturity
18/04/2017 Grifols, S.A. 1,000,000 Euros 3.20% 2025
05/10/2021 Grifols, S.A. (*) 1,400,000 Euros 3.875% 2028
05/10/2021 Grifols, S.A. (*) 705,000 US Dollar 4.75% 2028
15/11/2019 Grifols, S.A. 770,000 Euros 2.25% 2027
15/11/2019 Grifols, S.A. 905,000 Euros 1.625% 2025
(*) As a consecuence of the merge between Grifols Escrow Issuer, S.A. and Grifols, S.A. in 2023 (see note 2)
Unsecured senior notes
Secured senior notes
The bonds issued by Grifols, S.A. in 2017 and 2019 were admitted to listing on the Irish Stock Exchange on the same
issue date.
On 5 October 2021, Grifols Escrow Issuer, S.A. closed the issuance of a senior unsecured corporate bond (Senior
Unsecured Notes) in two tranches for amounts of Euros 1,400 million and US Dollars 705 million. Both tranches
mature in 2028, accrue an annual coupon of 3.875% and 4.750%, respectively and are listed on the Irish Stock
Exchange. On 1 January 2023, Grifols Escrow Issuer, S.A. was merged with Grifols, S.A. (see note 2).
The proceeds from the bonds were used to finance the Euros 1,100 million acquisition of the entire share capital of
Tiancheng (Germany) Pharmaceutical Holdings AG, whose current corporate name is Grifols Biotest Holdings
GmbH, which holds 89.88% of the ordinary shares of Biotest AG and 1.08% of the preferred shares. In addition, the
proceeds will also be used to finance the voluntary public offering for the remaining ordinary and preferred shares of
Biotest AG.
Details of movement in the Senior Notes at 31 December 2023 are as follows:
Opening outstanding
balance 01/01/23
Exchange
differences
Closing outstanding
balance 31/12/23
Senior unsecured corporate notes 2017 1,000,000 -- 1,000,000
Senior secured corporate notes 2019 1,577,465 -- 1,577,465
Senior unsecured corporate notes Euros 2021 1,400,000 -- 1,400,000
Senior unsecured corporate notes US Dollars 2021 660,979 (22,970) 638,009
4,638,444 (22,970) 4,615,474
Thousands of Euros |
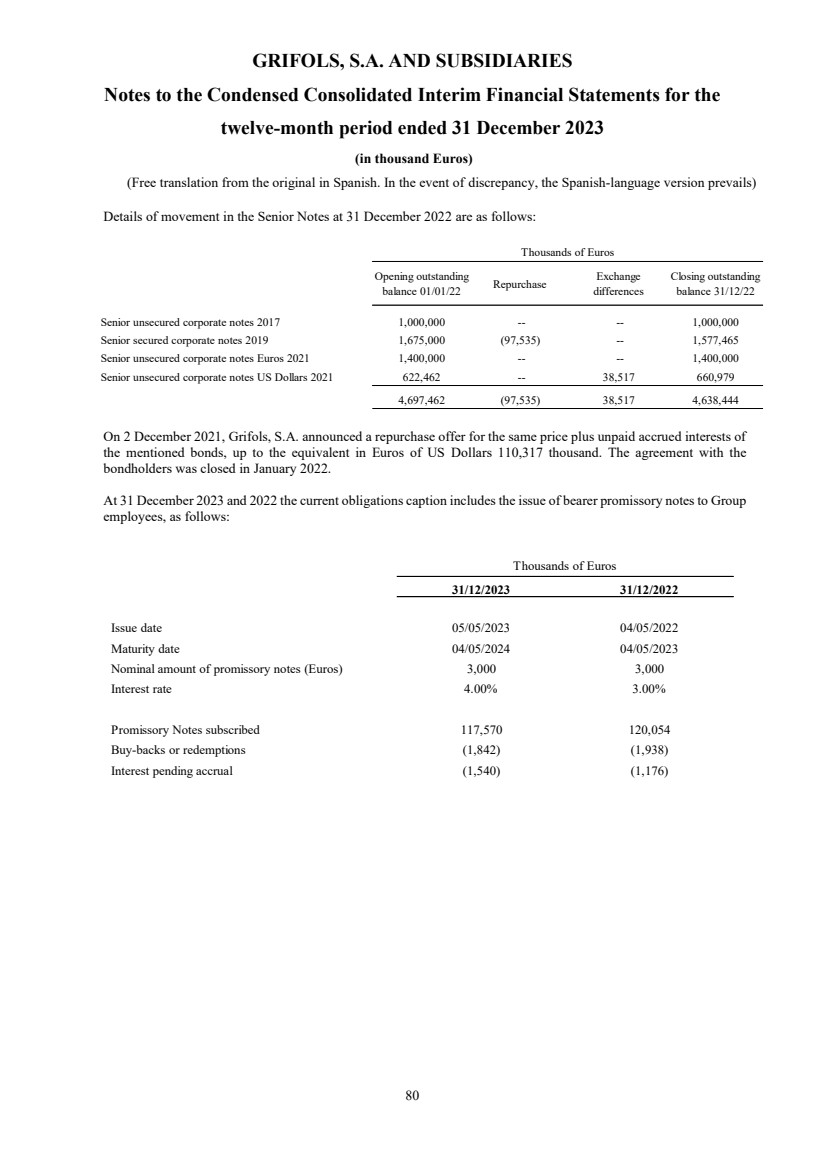
| GRIFOLS, S.A. AND SUBSIDIARIES
Notes to the Condensed Consolidated Interim Financial Statements for the
twelve-month period ended 31 December 2023
(in thousand Euros)
(Free translation from the original in Spanish. In the event of discrepancy, the Spanish-language version prevails)
80
Details of movement in the Senior Notes at 31 December 2022 are as follows:
Opening outstanding
balance 01/01/22 Repurchase Exchange
differences
Closing outstanding
balance 31/12/22
Senior unsecured corporate notes 2017 1,000,000 -- -- 1,000,000
Senior secured corporate notes 2019 1,675,000 (97,535) -- 1,577,465
Senior unsecured corporate notes Euros 2021 1,400,000 -- -- 1,400,000
Senior unsecured corporate notes US Dollars 2021 622,462 -- 38,517 660,979
4,697,462 (97,535) 38,517 4,638,444
Thousands of Euros
On 2 December 2021, Grifols, S.A. announced a repurchase offer for the same price plus unpaid accrued interests of
the mentioned bonds, up to the equivalent in Euros of US Dollars 110,317 thousand. The agreement with the
bondholders was closed in January 2022.
At 31 December 2023 and 2022 the current obligations caption includes the issue of bearer promissory notes to Group
employees, as follows:
31/12/2023 31/12/2022
Issue date 05/05/2023 04/05/2022
Maturity date 04/05/2024 04/05/2023
Nominal amount of promissory notes (Euros) 3,000 3,000
Interest rate 4.00% 3.00%
Promissory Notes subscribed 117,570 120,054
Buy-backs or redemptions (1,842) (1,938)
Interest pending accrual (1,540) (1,176)
Thousands of Euros |
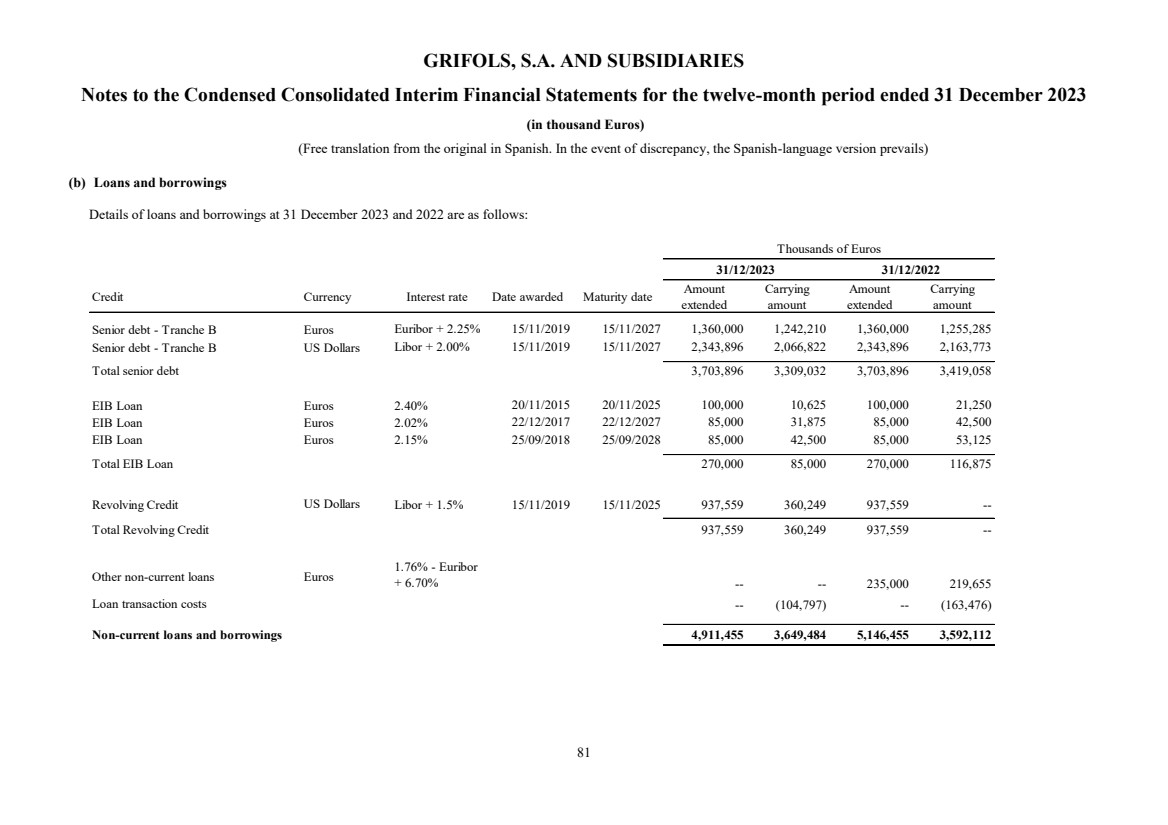
| GRIFOLS, S.A. AND SUBSIDIARIES
Notes to the Condensed Consolidated Interim Financial Statements for the twelve-month period ended 31 December 2023
(in thousand Euros)
(Free translation from the original in Spanish. In the event of discrepancy, the Spanish-language version prevails)
81
(b) Loans and borrowings
Details of loans and borrowings at 31 December 2023 and 2022 are as follows:
Credit Currency Interest rate Date awarded Maturity date Amount
extended
Carrying
amount
Amount
extended
Carrying
amount
Senior debt - Tranche B Euros Euribor + 2.25% 15/11/2019 15/11/2027 1,360,000 1,242,210 1,360,000 1,255,285
Senior debt - Tranche B US Dollars Libor + 2.00% 15/11/2019 15/11/2027 2,343,896 2,066,822 2,343,896 2,163,773
Total senior debt 3,703,896 3,309,032 3,703,896 3,419,058
EIB Loan Euros 2.40% 20/11/2015 20/11/2025 100,000 10,625 100,000 21,250
EIB Loan Euros 2.02% 22/12/2017 22/12/2027 85,000 31,875 85,000 42,500
EIB Loan Euros 2.15% 25/09/2018 25/09/2028 85,000 42,500 85,000 53,125
Total EIB Loan 270,000 85,000 270,000 116,875
Revolving Credit US Dollars Libor + 1.5% 15/11/2019 15/11/2025 937,559 360,249 937,559 -- >
Total Revolving Credit 937,559 360,249 937,559 --
Other non-current loans Euros
1.76% - Euribor
+ 6.70% -- -- 235,000 219,655
Loan transaction costs -- (104,797) -- (163,476)
Non-current loans and borrowings 4,911,455 3,649,484 5,146,455 3,592,112
Thousands of Euros
31/12/2023 31/12/2022 |

| GRIFOLS, S.A. AND SUBSIDIARIES
Notes to the Condensed Consolidated Interim Financial Statements for the twelve-month period ended 31 December 2023
(in thousand Euros)
(Free translation from the original in Spanish. In the event of discrepancy, the Spanish-language version prevails)
82
Credit Currency Interest rate Date awarded Maturity date
Amount
extended
Carrying
amount
Amount
extended
Carrying
amount
Senior debt - Tranche B Euros Euribor + 2.25% 15/11/2019 15/11/2027 (*) 13,076 (*) 3,269
Senior debt - Tranche B US Dollars Libor + 2.00% 15/11/2019 15/11/2027 (*) 21,756 (*) 5,635
Total senior debt -- 34,832 -- 8,904
EIB Loan Euros 2.40% 20/11/2015 20/11/2025 (*) 10,625 (*) 10,625
EIB Loan Euros 2.02% 22/12/2017 22/12/2027 (*) 10,625 (*) 10,625
EIB Loan Euros 2.15% 25/09/2018 25/09/2028 (*) 10,625 (*) 10,625
Total EIB Loan -- 31,875 -- 31,875
Other current loans 0.10% - Euribor + 6.70% 691,514 667,336 481,163 445,190
Loan transaction costs -- (59,735) -- (36,559)
Current loans and borrowings 691,514 674,308 481,163 449,410
(*) See amount granted under non-current debt
31/12/2023 31/12/2022
Thousands of Euros |
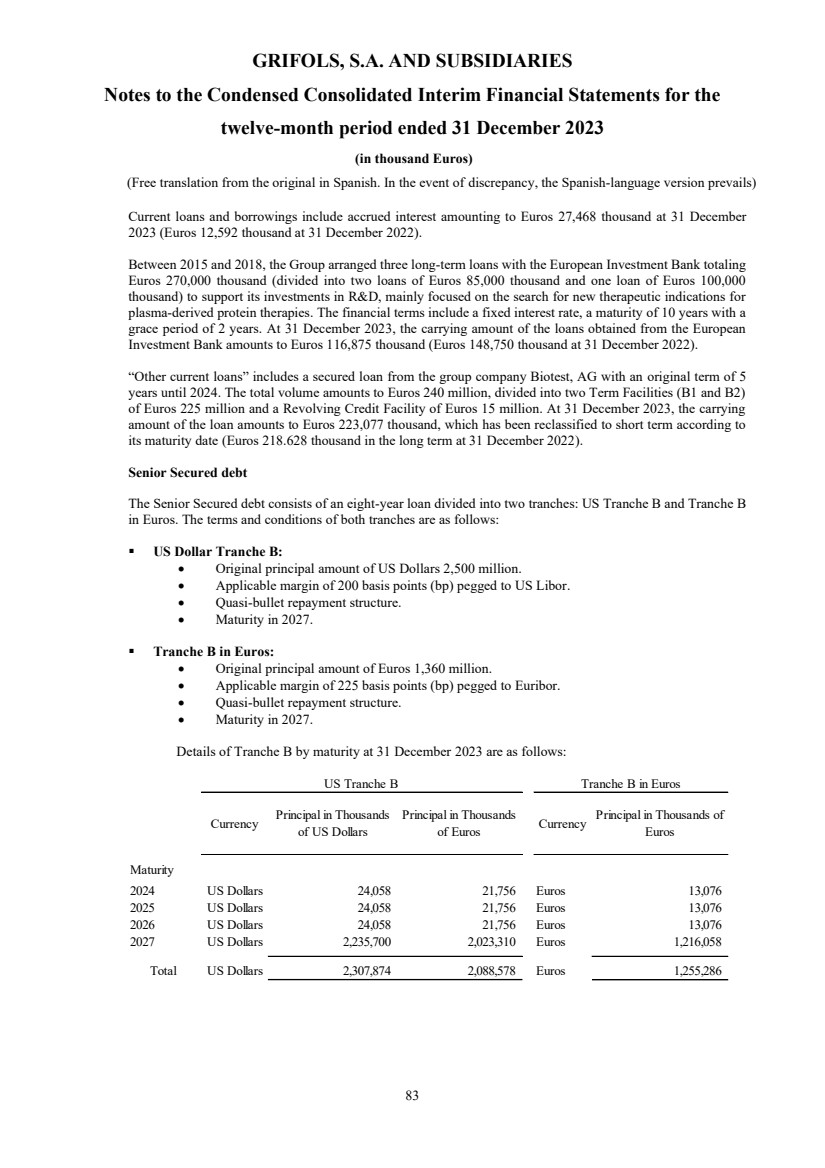
| GRIFOLS, S.A. AND SUBSIDIARIES
Notes to the Condensed Consolidated Interim Financial Statements for the
twelve-month period ended 31 December 2023
(in thousand Euros)
(Free translation from the original in Spanish. In the event of discrepancy, the Spanish-language version prevails)
83
Current loans and borrowings include accrued interest amounting to Euros 27,468 thousand at 31 December
2023 (Euros 12,592 thousand at 31 December 2022).
Between 2015 and 2018, the Group arranged three long-term loans with the European Investment Bank totaling
Euros 270,000 thousand (divided into two loans of Euros 85,000 thousand and one loan of Euros 100,000
thousand) to support its investments in R&D, mainly focused on the search for new therapeutic indications for
plasma-derived protein therapies. The financial terms include a fixed interest rate, a maturity of 10 years with a
grace period of 2 years. At 31 December 2023, the carrying amount of the loans obtained from the European
Investment Bank amounts to Euros 116,875 thousand (Euros 148,750 thousand at 31 December 2022).
“Other current loans” includes a secured loan from the group company Biotest, AG with an original term of 5
years until 2024. The total volume amounts to Euros 240 million, divided into two Term Facilities (B1 and B2)
of Euros 225 million and a Revolving Credit Facility of Euros 15 million. At 31 December 2023, the carrying
amount of the loan amounts to Euros 223,077 thousand, which has been reclassified to short term according to
its maturity date (Euros 218.628 thousand in the long term at 31 December 2022).
Senior Secured debt
The Senior Secured debt consists of an eight-year loan divided into two tranches: US Tranche B and Tranche B
in Euros. The terms and conditions of both tranches are as follows:
▪ US Dollar Tranche B:
• Original principal amount of US Dollars 2,500 million.
• Applicable margin of 200 basis points (bp) pegged to US Libor.
• Quasi-bullet repayment structure.
• Maturity in 2027.
▪ Tranche B in Euros:
• Original principal amount of Euros 1,360 million.
• Applicable margin of 225 basis points (bp) pegged to Euribor.
• Quasi-bullet repayment structure.
• Maturity in 2027.
Details of Tranche B by maturity at 31 December 2023 are as follows:
Currency Principal in Thousands
of US Dollars
Principal in Thousands
of Euros Currency Principal in Thousands of
Euros
Maturity
2024 US Dollars 24,058 21,756 Euros 13,076
2025 US Dollars 24,058 21,756 Euros 13,076
2026 US Dollars 24,058 21,756 Euros 13,076
2027 US Dollars 2,235,700 2,023,310 Euros 1,216,058
Total US Dollars 2,307,874 2,088,578 Euros 1,255,286
US Tranche B Tranche B in Euros |

| GRIFOLS, S.A. AND SUBSIDIARIES
Notes to the Condensed Consolidated Interim Financial Statements for the
twelve-month period ended 31 December 2023
(in thousand Euros)
(Free translation from the original in Spanish. In the event of discrepancy, the Spanish-language version prevails)
84
The borrowers of the total Senior secured debt are Grifols, S.A. and Grifols Worldwide Operations USA, Inc.
Revolving credit facility
On 7 May 2020, the Group concluded the upsize of the multi-currency revolving credit facility from US Dollars
500 million to US Dollars 1,000 million with maturity in 2025 and an applicable margin of 150 basis points (bp)
pegged to US Libor.
Movement in the Revolving Credit Facility is as follows:
31/12/2023 31/12/2022
Drawn opening balance 0 330,000
Drawdowns 1,501,207 591,537
Repayments (1,131,565) (916,958)
Translation differences (9,393) (4,579)
Drawn closing balance 360,249 0
Thousands of Euros
Guarantors
The Notes, the Senior Term Loans and the Revolving Loans are secured by Grifols, S.A. and certain significant
subsidiaries of Grifols, S.A., which together with Grifols, S.A., represent, in the aggregate, at least 60% of the
consolidated EBITDA of the Group.
The Notes are guaranteed on a senior secured basis by subsidiaries of Grifols, S.A. that are guarantors and co-borrower under the New Credit Facilities. The guarantors are Grifols Worldwide Operations Limited, Grifols
Biologicals Inc., Grifols Shared Services North America, Inc., Grifols Therapeutics, Inc., Instituto Grifols, S.A.,
Grifols Worldwide Operations USA, Inc., Grifols USA, Llc. and Grifols International, S.A.
(c) Other financial liabilities
Details of other financial liabilities at 31 December 2023 and 2022 are as follows:
Other financial liabilities Reference 31/12/2023 31/12/2022
Non-current debt with GIC (sovereign wealth fund in Singapore) (i) 759,554 833,664
Non-current preferential loans 5,966 4,943
Other non-current financial liabilities (ii) 48,549 49,100
Total other non-current financial liabilities 814,069 887,707
Current debt with GIC (sovereign wealth fund in Singapore) (i) 81,384 86,284
Current preferential loans 1,536 1,633
Other current financial liabilities (ii) 32,646 25,763
Total other current financial liabilities 115,566 113,680
Thousands of Euros |
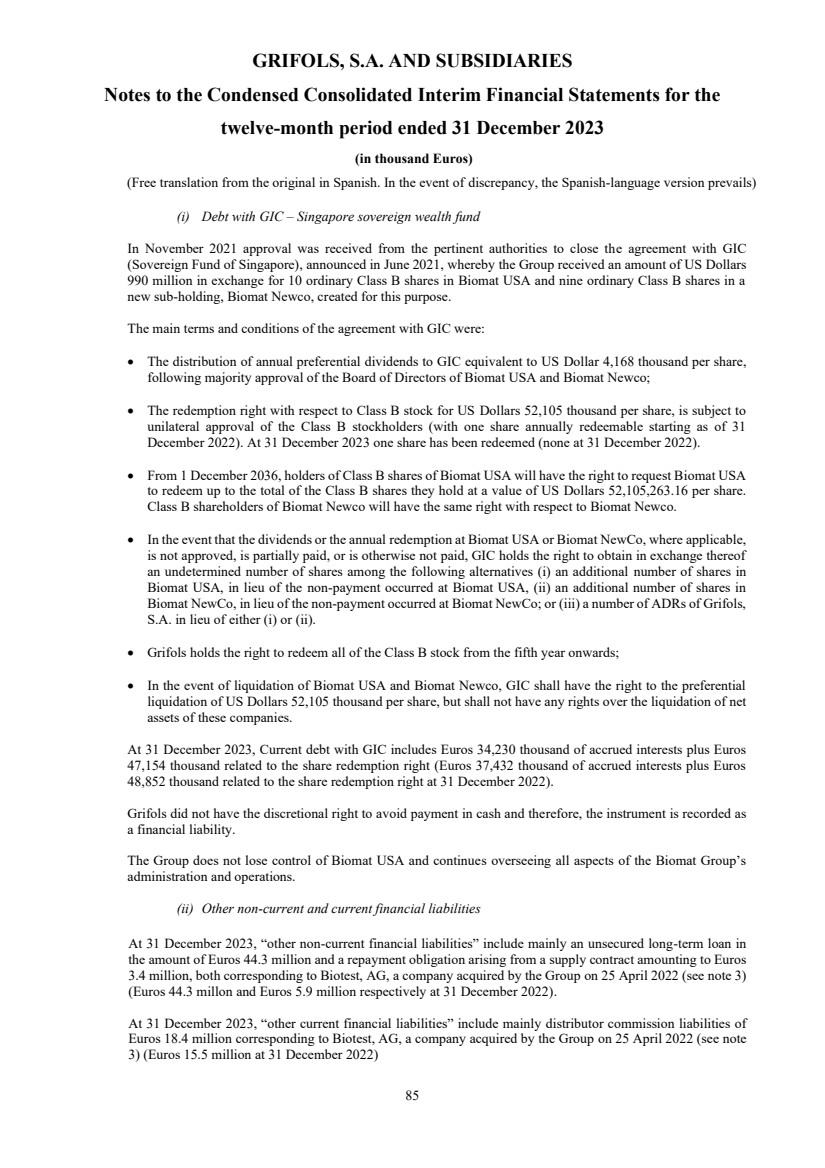
| GRIFOLS, S.A. AND SUBSIDIARIES
Notes to the Condensed Consolidated Interim Financial Statements for the
twelve-month period ended 31 December 2023
(in thousand Euros)
(Free translation from the original in Spanish. In the event of discrepancy, the Spanish-language version prevails)
85
(i) Debt with GIC – Singapore sovereign wealth fund
In November 2021 approval was received from the pertinent authorities to close the agreement with GIC
(Sovereign Fund of Singapore), announced in June 2021, whereby the Group received an amount of US Dollars
990 million in exchange for 10 ordinary Class B shares in Biomat USA and nine ordinary Class B shares in a
new sub-holding, Biomat Newco, created for this purpose.
The main terms and conditions of the agreement with GIC were:
• The distribution of annual preferential dividends to GIC equivalent to US Dollar 4,168 thousand per share,
following majority approval of the Board of Directors of Biomat USA and Biomat Newco;
• The redemption right with respect to Class B stock for US Dollars 52,105 thousand per share, is subject to
unilateral approval of the Class B stockholders (with one share annually redeemable starting as of 31
December 2022). At 31 December 2023 one share has been redeemed (none at 31 December 2022).
• From 1 December 2036, holders of Class B shares of Biomat USA will have the right to request Biomat USA
to redeem up to the total of the Class B shares they hold at a value of US Dollars 52,105,263.16 per share.
Class B shareholders of Biomat Newco will have the same right with respect to Biomat Newco.
• In the event that the dividends or the annual redemption at Biomat USA or Biomat NewCo, where applicable,
is not approved, is partially paid, or is otherwise not paid, GIC holds the right to obtain in exchange thereof
an undetermined number of shares among the following alternatives (i) an additional number of shares in
Biomat USA, in lieu of the non-payment occurred at Biomat USA, (ii) an additional number of shares in
Biomat NewCo, in lieu of the non-payment occurred at Biomat NewCo; or (iii) a number of ADRs of Grifols,
S.A. in lieu of either (i) or (ii).
• Grifols holds the right to redeem all of the Class B stock from the fifth year onwards;
• In the event of liquidation of Biomat USA and Biomat Newco, GIC shall have the right to the preferential
liquidation of US Dollars 52,105 thousand per share, but shall not have any rights over the liquidation of net
assets of these companies.
At 31 December 2023, Current debt with GIC includes Euros 34,230 thousand of accrued interests plus Euros
47,154 thousand related to the share redemption right (Euros 37,432 thousand of accrued interests plus Euros
48,852 thousand related to the share redemption right at 31 December 2022).
Grifols did not have the discretional right to avoid payment in cash and therefore, the instrument is recorded as
a financial liability.
The Group does not lose control of Biomat USA and continues overseeing all aspects of the Biomat Group’s
administration and operations.
(ii) Other non-current and current financial liabilities
At 31 December 2023, “other non-current financial liabilities” include mainly an unsecured long-term loan in
the amount of Euros 44.3 million and a repayment obligation arising from a supply contract amounting to Euros
3.4 million, both corresponding to Biotest, AG, a company acquired by the Group on 25 April 2022 (see note 3)
(Euros 44.3 millon and Euros 5.9 million respectively at 31 December 2022).
At 31 December 2023, “other current financial liabilities” include mainly distributor commission liabilities of
Euros 18.4 million corresponding to Biotest, AG, a company acquired by the Group on 25 April 2022 (see note
3) (Euros 15.5 million at 31 December 2022) |
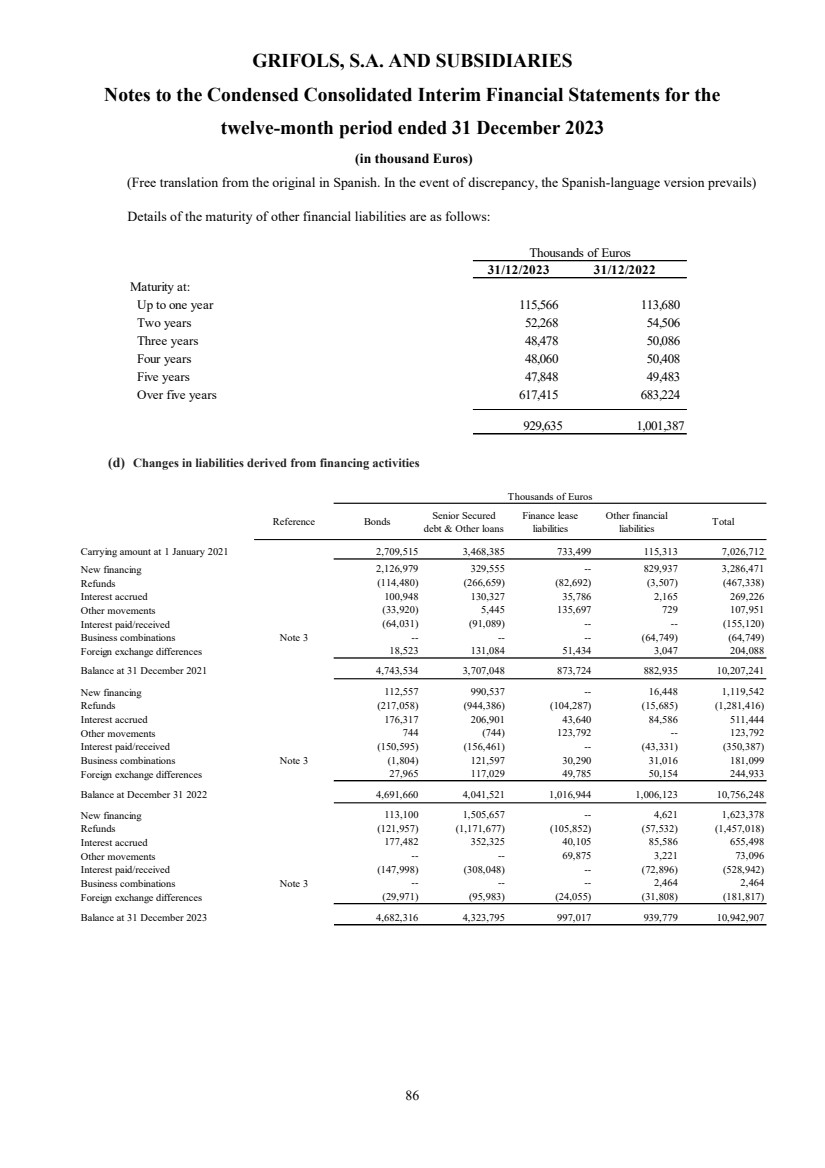
| GRIFOLS, S.A. AND SUBSIDIARIES
Notes to the Condensed Consolidated Interim Financial Statements for the
twelve-month period ended 31 December 2023
(in thousand Euros)
(Free translation from the original in Spanish. In the event of discrepancy, the Spanish-language version prevails)
86
Details of the maturity of other financial liabilities are as follows:
31/12/2023 31/12/2022
Maturity at:
Up to one year 115,566 113,680
Two years 52,268 54,506
Three years 48,478 50,086
Four years 48,060 50,408
Five years 47,848 49,483
Over five years 617,415 683,224
929,635 1,001,387
Thousands of Euros
(d) Changes in liabilities derived from financing activities
Reference Bonds Senior Secured
debt & Other loans
Finance lease
liabilities
Other financial
liabilities Total
Carrying amount at 1 January 2021 2,709,515 3,468,385 733,499 115,313 7,026,712
New financing 2,126,979 329,555 -- 829,937 3,286,471
Refunds (114,480) (266,659) (82,692) (3,507) (467,338)
Interest accrued 100,948 130,327 35,786 2,165 269,226
Other movements (33,920) 5,445 135,697 729 107,951
Interest paid/received (64,031) (91,089) -- -- (155,120)
Business combinations Note 3 -- -- -- (64,749) (64,749)
Foreign exchange differences 18,523 131,084 51,434 3,047 204,088
Balance at 31 December 2021 4,743,534 3,707,048 873,724 882,935 10,207,241
New financing 112,557 990,537 -- 16,448 1,119,542
Refunds (217,058) (944,386) (104,287) (15,685) (1,281,416)
Interest accrued 176,317 206,901 43,640 84,586 511,444
Other movements 744 (744) 123,792 -- 123,792
Interest paid/received (150,595) (156,461) -- (43,331) (350,387)
Business combinations Note 3 (1,804) 121,597 30,290 31,016 181,099
Foreign exchange differences 27,965 117,029 49,785 50,154 244,933
Balance at December 31 2022 4,691,660 4,041,521 1,016,944 1,006,123 10,756,248
New financing 113,100 1,505,657 -- 4,621 1,623,378
Refunds (121,957) (1,171,677) (105,852) (57,532) (1,457,018)
Interest accrued 177,482 352,325 40,105 85,586 655,498
Other movements -- -- 69,875 3,221 73,096
Interest paid/received (147,998) (308,048) -- (72,896) (528,942)
Business combinations Note 3 -- -- -- 2,464 2,464
Foreign exchange differences (29,971) (95,983) (24,055) (31,808) (181,817)
Balance at 31 December 2023 4,682,316 4,323,795 997,017 939,779 10,942,907
Thousands of Euros |
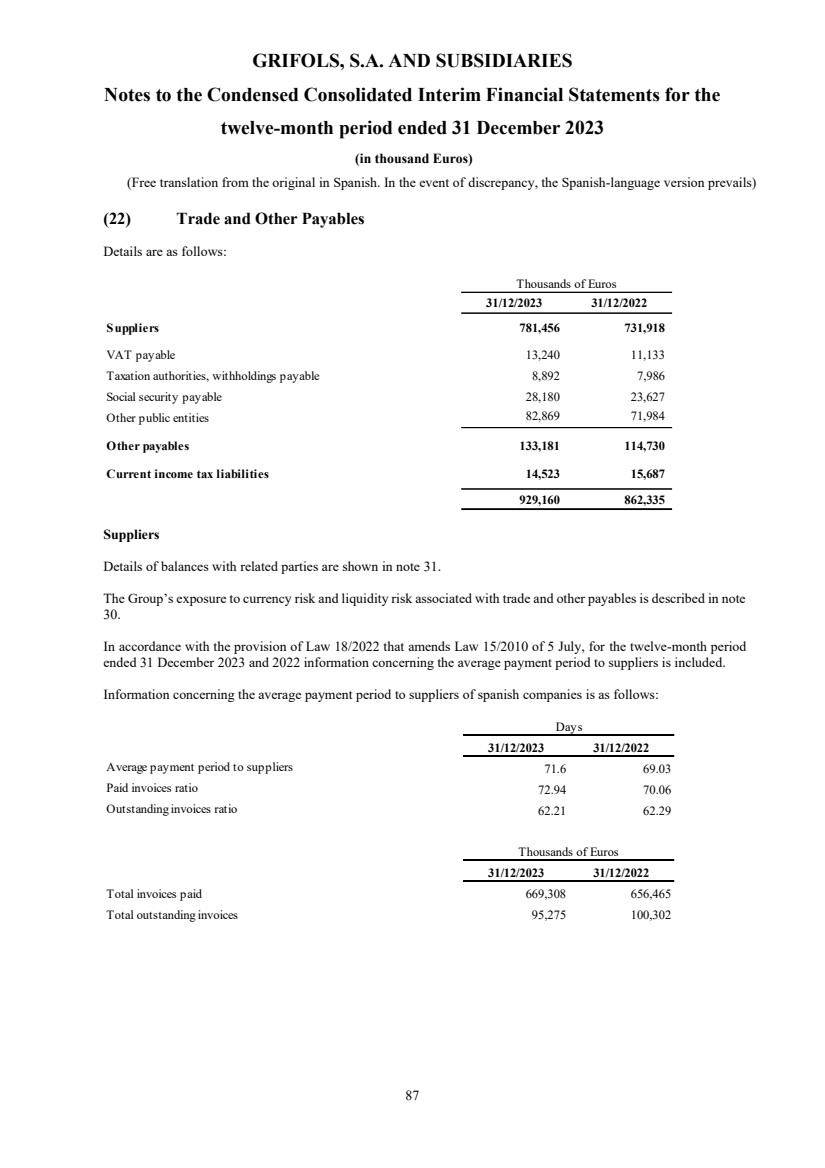
| GRIFOLS, S.A. AND SUBSIDIARIES
Notes to the Condensed Consolidated Interim Financial Statements for the
twelve-month period ended 31 December 2023
(in thousand Euros)
(Free translation from the original in Spanish. In the event of discrepancy, the Spanish-language version prevails)
87
(22) Trade and Other Payables
Details are as follows:
Suppliers
Details of balances with related parties are shown in note 31.
The Group’s exposure to currency risk and liquidity risk associated with trade and other payables is described in note
30.
In accordance with the provision of Law 18/2022 that amends Law 15/2010 of 5 July, for the twelve-month period
ended 31 December 2023 and 2022 information concerning the average payment period to suppliers is included.
Information concerning the average payment period to suppliers of spanish companies is as follows:
31/12/2023 31/12/2022
Suppliers 781,456 731,918
VAT payable 13,240 11,133
Taxation authorities, withholdings payable 8,892 7,986
Social security payable 28,180 23,627
Other public entities 82,869 71,984
Other payables 133,181 114,730
Current income tax liabilities 14,523 15,687
929,160 862,335
Thousands of Euros
31/12/2023 31/12/2022
Average payment period to suppliers 71.6 69.03
Paid invoices ratio 72.94 70.06
Outstanding invoices ratio 62.21 62.29
31/12/2023 31/12/2022
Total invoices paid 669,308 656,465
Total outstanding invoices 95,275 100,302
Days
Thousands of Euros |

| GRIFOLS, S.A. AND SUBSIDIARIES
Notes to the Condensed Consolidated Interim Financial Statements for the
twelve-month period ended 31 December 2023
(in thousand Euros)
(Free translation from the original in Spanish. In the event of discrepancy, the Spanish-language version prevails)
88
Information concerning invoices paid in a period of less than the maximum period established by the Law is as
follows:
31/12/2023 31/12/2022
Monetary volume paid in euros (thousands of Euros) 272,537 250,490
Percentage of total monetary payments to suppliers 40.72% 38.16%
Number of paid invoices 22,135 23,274
Percentage of the total number of invoices paid to suppliers 26.13% 25.98%
(23) Other Current Liabilities
Details at 31 December are as follows:
At 31 December 2022, and 31 December 2021, the advances received are contract liabilities relate to unperformed
performance obligations for which Grifols has received a consideration from the customer.
(24) Net Revenues
Net revenues are mainly generated from the sale of goods.
The distribution of net consolidated revenues for the twelve-month periods ended 31 December 2023, 2022 and 2021
by segment is as follows:
31/12/2023 31/12/2022 31/12/2021 (*)
Biopharma 5,558,301 5,005,382 3,814,983
Diagnostic 670,269 671,292 779,108
Bio supplies 159,957 146,076 115,811
Others 203,450 250,165 266,461
Intersegments -- (8,948) (43,245)
6,591,977 6,063,967 4,933,118
Thousands of Euros
* As a consequence of the review of transactions and balances allocations by segments made in the year 2022, the
comparative figures for the fiscal year 2021 have been adjusted accordingly.
31/12/2023 31/12/2022
Salaries payable 234,644 199,584
Other payables 6,329 4,069
Deferred income 10,323 27,642
Advances received 24,398 10,192
Other current liabilities 275,694 241,487
Thousands of Euros |
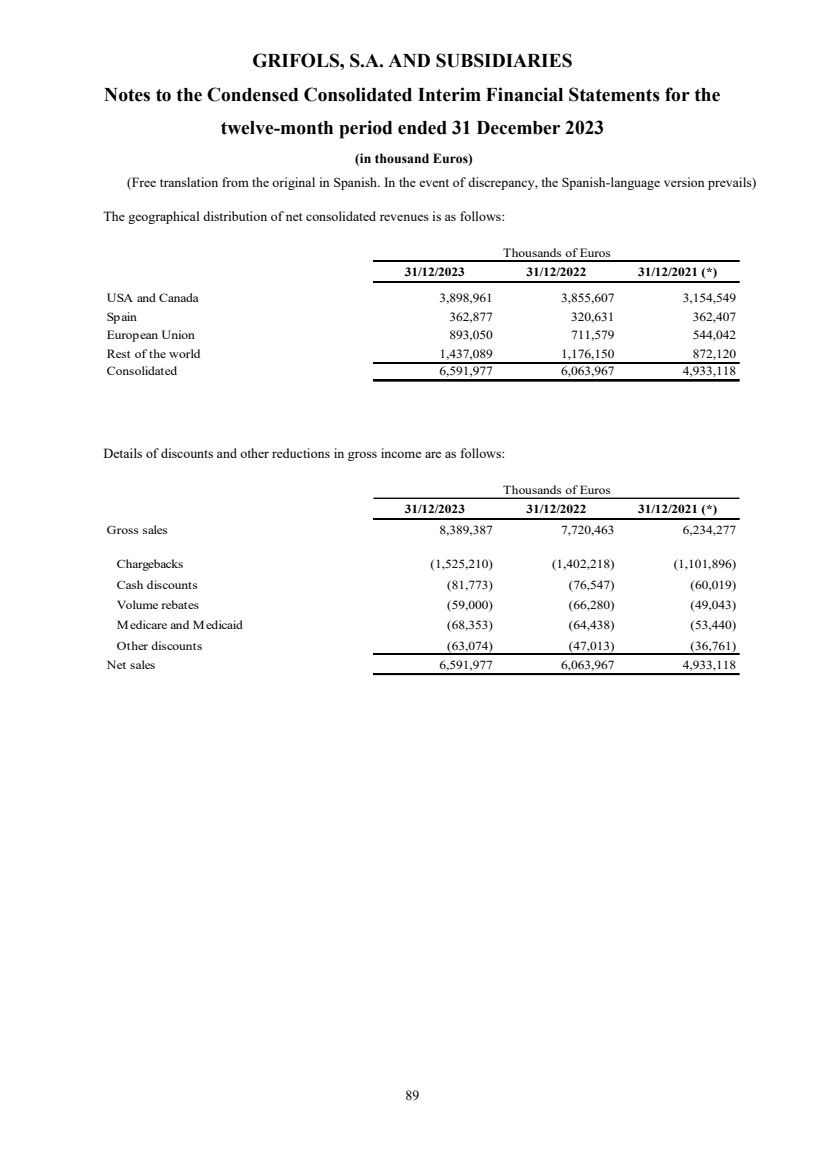
| GRIFOLS, S.A. AND SUBSIDIARIES
Notes to the Condensed Consolidated Interim Financial Statements for the
twelve-month period ended 31 December 2023
(in thousand Euros)
(Free translation from the original in Spanish. In the event of discrepancy, the Spanish-language version prevails)
89
The geographical distribution of net consolidated revenues is as follows:
31/12/2023 31/12/2022 31/12/2021 (*)
USA and Canada 3,898,961 3,855,607 3,154,549
Spain 362,877 320,631 362,407
European Union 893,050 711,579 544,042
Rest of the world 1,437,089 1,176,150 872,120
Consolidated 6,591,977 6,063,967 4,933,118
Thousands of Euros
Details of discounts and other reductions in gross income are as follows:
31/12/2023 31/12/2022 31/12/2021 (*)
Gross sales 8,389,387 7,720,463 6,234,277
Chargebacks (1,525,210) (1,402,218) (1,101,896)
Cash discounts (81,773) (76,547) (60,019)
Volume rebates (59,000) (66,280) (49,043)
Medicare and Medicaid (68,353) (64,438) (53,440)
Other discounts (63,074) (47,013) (36,761)
Net sales 6,591,977 6,063,967 4,933,118
Thousands of Euros |
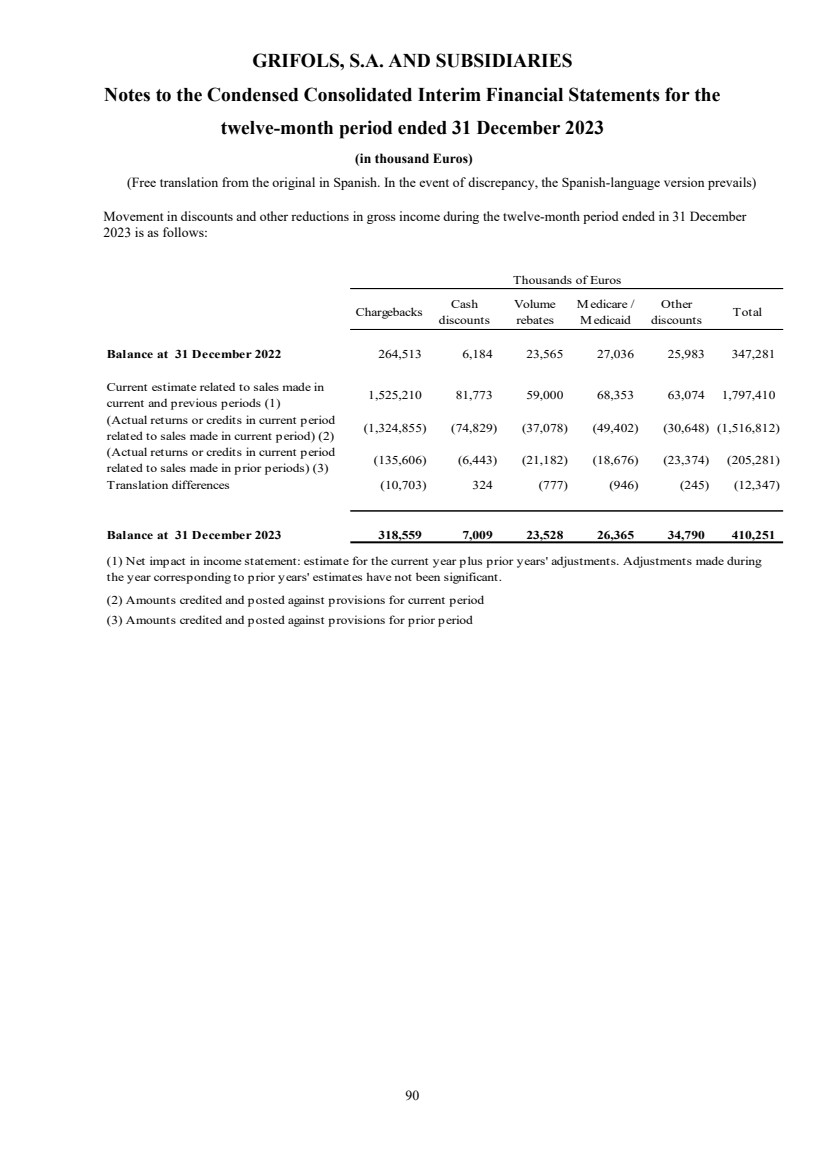
| GRIFOLS, S.A. AND SUBSIDIARIES
Notes to the Condensed Consolidated Interim Financial Statements for the
twelve-month period ended 31 December 2023
(in thousand Euros)
(Free translation from the original in Spanish. In the event of discrepancy, the Spanish-language version prevails)
90
Movement in discounts and other reductions in gross income during the twelve-month period ended in 31 December
2023 is as follows:
Chargebacks Cash
discounts
Volume
rebates
Medicare /
Medicaid
Other
discounts Total
Balance at 31 December 2022 264,513 6,184 23,565 27,036 25,983 347,281
Current estimate related to sales made in
current and previous periods (1) 1,525,210 81,773 59,000 68,353 63,074 1,797,410
(Actual returns or credits in current period
related to sales made in current period) (2) (1,324,855) (74,829) (37,078) (49,402) (30,648) (1,516,812)
(Actual returns or credits in current period
related to sales made in prior periods) (3) (135,606) (6,443) (21,182) (18,676) (23,374) (205,281)
Translation differences (10,703) 324 (777) (946) (245) (12,347)
Balance at 31 December 2023 318,559 7,009 23,528 26,365 34,790 410,251
(2) Amounts credited and posted against provisions for current period
(3) Amounts credited and posted against provisions for prior period
Thousands of Euros
(1) Net impact in income statement: estimate for the current year plus prior years' adjustments. Adjustments made during
the year corresponding to prior years' estimates have not been significant. |

| GRIFOLS, S.A. AND SUBSIDIARIES
Notes to the Condensed Consolidated Interim Financial Statements for the
twelve-month period ended 31 December 2023
(in thousand Euros)
(Free translation from the original in Spanish. In the event of discrepancy, the Spanish-language version prevails)
91
Movement in discounts and other reductions to gross income during the twelve-month period ended 31 December
2022 was as follows:
Chargebacks Cash
discounts
Volume
rebates
Medicare /
Medicaid
Other
discounts Total
Balance at 31 December 2021 159,846 5,701 21,246 25,614 10,585 222,992
Current estimate related to sales made in
current and previous periods (1) 1,402,218 76,547 66,280 64,438 47,013 1,656,496
(Actual returns or credits in current period
related to sales made in current period) (2) (1,196,670) (69,960) (43,494) (43,332) (28,818) (1,382,274)
(Actual returns or credits in current period
related to sales made in prior periods) (3) (109,726) (6,442) (21,501) (21,271) (2,935) (161,875)
Translation differences 8,845 338 1,034 1,587 138 11,942
Balance at 31 December 2022 264,513 6,184 23,565 27,036 25,983 347,281
Thousands of Euros
Movement in discounts and other reductions to gross income during the twelve-month period ended 31 December
2021 was as follows:
Chargebacks Cash
discounts
Volume
rebates
Medicare /
Medicaid
Other
discounts Total
Balance at 31 December 2020 190,869 6,795 29,670 28,451 11,763 267,548
Current estimate related to sales made in
current and previous periods (1) 1,101,896 60,019 49,043 53,440 36,761 1,301,159
(Actual returns or credits in current period
related to sales made in current period) (2) (1,080,304) (54,554) (29,617) (42,890) (27,036) (1,234,401)
(Actual returns or credits in current period
related to sales made in prior periods) (3) (65,681) (6,964) (29,304) (15,422) (11,057) (128,428)
Translation differences 13,066 405 1,454 2,035 154 17,114
Balance at 31 December 2021 159,846 5,701 21,246 25,614 10,585 222,992
Thousands of Euros |
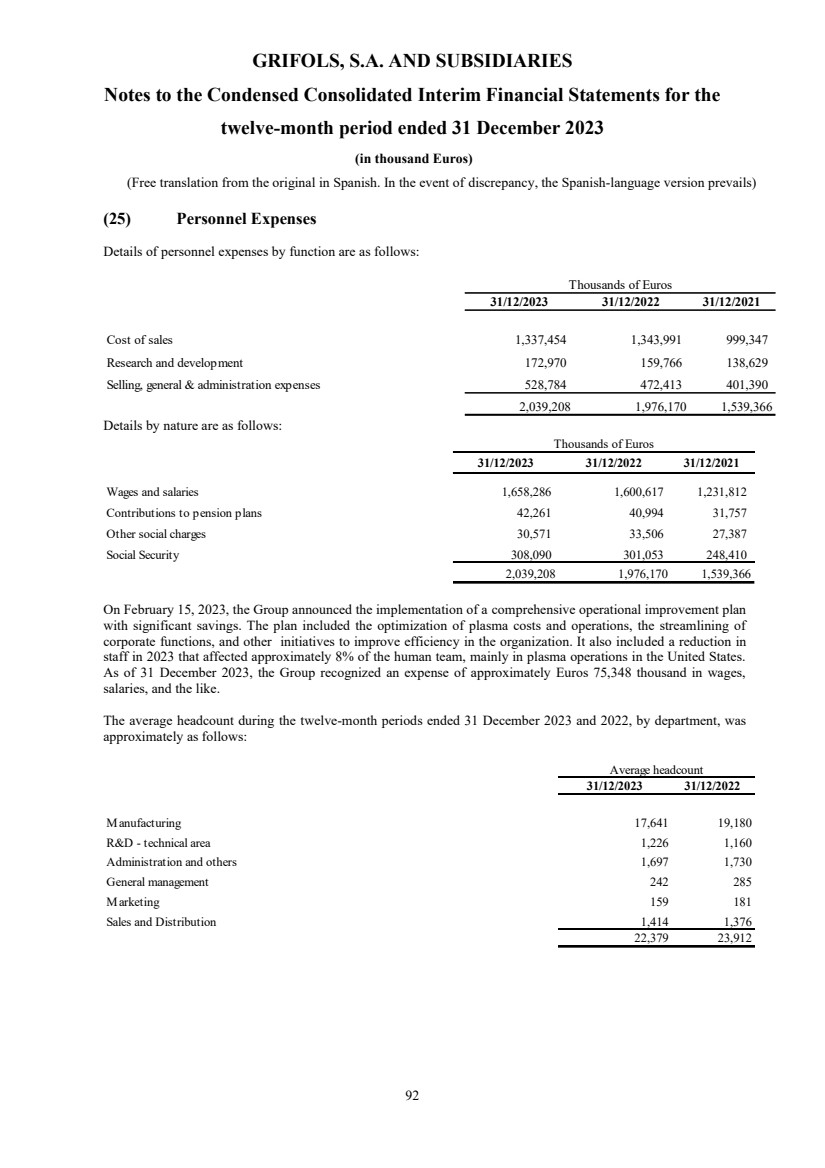
| GRIFOLS, S.A. AND SUBSIDIARIES
Notes to the Condensed Consolidated Interim Financial Statements for the
twelve-month period ended 31 December 2023
(in thousand Euros)
(Free translation from the original in Spanish. In the event of discrepancy, the Spanish-language version prevails)
92
(25) Personnel Expenses
Details of personnel expenses by function are as follows:
Details by nature are as follows:
On February 15, 2023, the Group announced the implementation of a comprehensive operational improvement plan
with significant savings. The plan included the optimization of plasma costs and operations, the streamlining of
corporate functions, and other initiatives to improve efficiency in the organization. It also included a reduction in
staff in 2023 that affected approximately 8% of the human team, mainly in plasma operations in the United States.
As of 31 December 2023, the Group recognized an expense of approximately Euros 75,348 thousand in wages,
salaries, and the like.
The average headcount during the twelve-month periods ended 31 December 2023 and 2022, by department, was
approximately as follows:
31/12/2023 31/12/2022 31/12/2021
Cost of sales 1,337,454 1,343,991 999,347
Research and development 172,970 159,766 138,629
Selling, general & administration expenses 528,784 472,413 401,390
2,039,208 1,976,170 1,539,366
Thousands of Euros
31/12/2023 31/12/2022 31/12/2021
Wages and salaries 1,658,286 1,600,617 1,231,812
Contributions to pension plans 42,261 40,994 31,757
Other social charges 30,571 33,506 27,387
Social Security 308,090 301,053 248,410
2,039,208 1,976,170 1,539,366
Thousands of Euros
31/12/2023 31/12/2022
Manufacturing 17,641 19,180
R&D - technical area 1,226 1,160
Administration and others 1,697 1,730
General management 242 285
Marketing 159 181
Sales and Distribution 1,414 1,376
22,379 23,912
Average headcount |
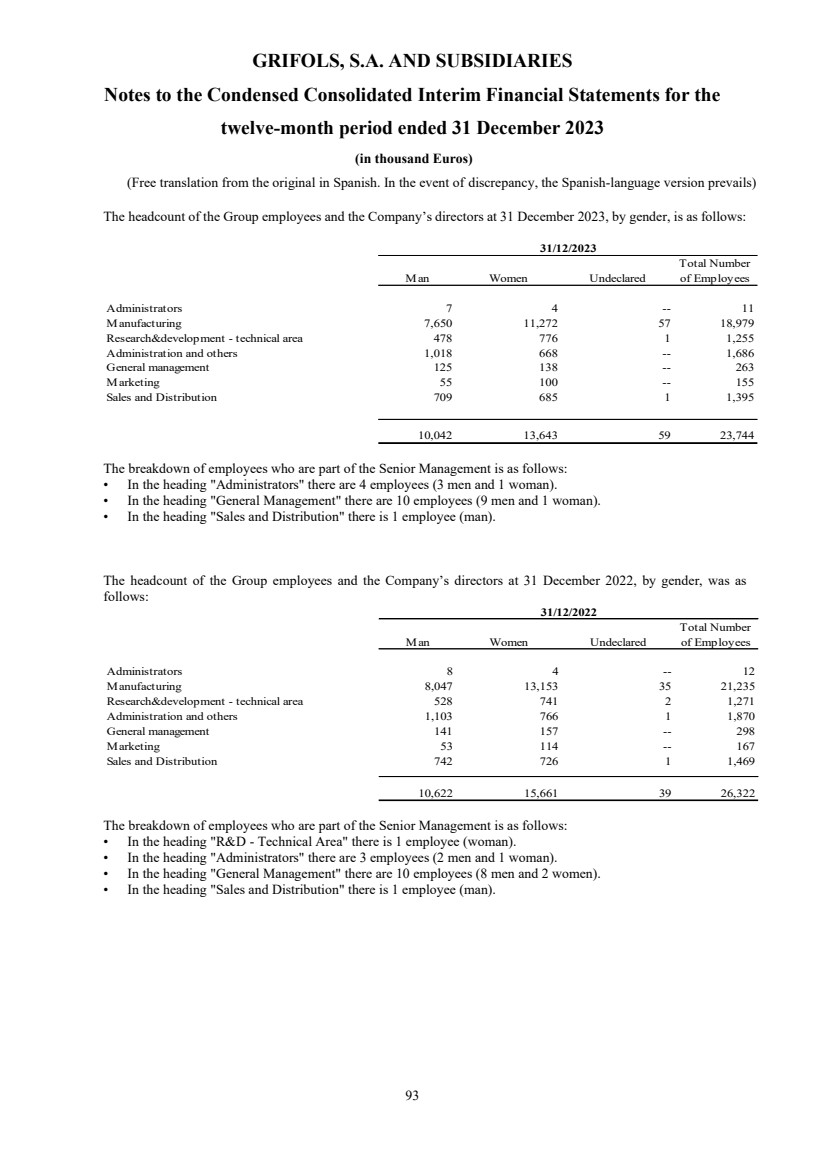
| GRIFOLS, S.A. AND SUBSIDIARIES
Notes to the Condensed Consolidated Interim Financial Statements for the
twelve-month period ended 31 December 2023
(in thousand Euros)
(Free translation from the original in Spanish. In the event of discrepancy, the Spanish-language version prevails)
93
The headcount of the Group employees and the Company’s directors at 31 December 2023, by gender, is as follows:
The breakdown of employees who are part of the Senior Management is as follows:
• In the heading "Administrators" there are 4 employees (3 men and 1 woman).
• In the heading "General Management" there are 10 employees (9 men and 1 woman).
• In the heading "Sales and Distribution" there is 1 employee (man).
The headcount of the Group employees and the Company’s directors at 31 December 2022, by gender, was as
follows:
Man Women Undeclared
Total Number
of Employees
Administrators 8 4 -- 12
Manufacturing 8,047 13,153 35 21,235
Research&development - technical area 528 741 2 1,271
Administration and others 1,103 766 1 1,870
General management 141 157 -- 298
Marketing 53 114 -- 167
Sales and Distribution 742 726 1 1,469
10,622 15,661 39 26,322
31/12/2022
The breakdown of employees who are part of the Senior Management is as follows:
• In the heading "R&D - Technical Area" there is 1 employee (woman).
• In the heading "Administrators" there are 3 employees (2 men and 1 woman).
• In the heading "General Management" there are 10 employees (8 men and 2 women).
• In the heading "Sales and Distribution" there is 1 employee (man).
Man Women Undeclared
Total Number
of Employees
Administrators 7 4 -- 11
Manufacturing 7,650 11,272 57 18,979
Research&development - technical area 478 776 1 1,255
Administration and others 1,018 668 -- 1,686
General management 125 138 -- 263
Marketing 55 100 -- 155
Sales and Distribution 709 685 1 1,395
10,042 13,643 59 23,744
31/12/2023 |

| GRIFOLS, S.A. AND SUBSIDIARIES
Notes to the Condensed Consolidated Interim Financial Statements for the
twelve-month period ended 31 December 2023
(in thousand Euros)
(Free translation from the original in Spanish. In the event of discrepancy, the Spanish-language version prevails)
94
(26) Expenses by Nature
(a) Amortization and depreciation
Expenses for the amortization and depreciation of intangible assets, right of use assets and property, plant and
equipment, incurred during the twelve-month periods ended 31 December 2023, 2022 and 2021 classified by
functions are as follows:
(b) Other operating income and expenses
Other operating income and expenses incurred during the twelve-month periods ended 31 December 2023, 2022
and 2021 by function are as follows:
Thousands of Euros
31/12/2023 31/12/2022 31/12/2021
Cost of sales 270,048 275,512 211,676
Research and development 64,731 44,295 55,311
Selling, general & administration expenses 107,139 88,057 92,780
441,918 407,864 359,767
Thousands of Euros
31/12/2023 31/12/2022 31/12/2021
Cost of sales 585,096 682,636 535,058
Research and development 168,358 164,229 165,884
Selling, general & administration expenses 792,728 579,067 532,056
1,546,182 1,425,932 1,232,998 |

| GRIFOLS, S.A. AND SUBSIDIARIES
Notes to the Condensed Consolidated Interim Financial Statements for the
twelve-month period ended 31 December 2023
(in thousand Euros)
(Free translation from the original in Spanish. In the event of discrepancy, the Spanish-language version prevails)
95
Details by nature are as follows:
On February 15, 2023, the Group announced the implementation of a comprehensive operational improvement
plan with significant savings. The plan included the optimization of plasma costs and operations, the streamlining
of corporate functions, and other initiatives to improve efficiency in the organization. As of 31 December 2023,
the Group recognized an expense of approximately Euros 79,090 thousand mainly in professional services.
Thousands of Euros
Reference 31/12/2023 31/12/2022 31/12/2021
Changes in trade provisions 3,567 8,743 4,844
Professional services 415,062 305,215 258,371
Commissions 44,946 40,397 28,671
Supplies and auxiliary materials 205,640 251,120 197,893
Operating leases Note 8 43,039 38,994 32,945
Freight 186,794 190,692 148,797
Repair and maintenance expenses 231,432 218,971 150,308
Advertising 78,851 90,652 71,280
Insurance 49,551 46,090 38,724
Royalties 21,766 13,646 48,446
Travel expenses 44,911 49,356 30,334
External services 90,987 83,296 74,858
R&D Expenses 98,947 94,903 106,873
Gains on disposal of assets (3,042) (22,236) --
Other 33,731 16,093 40,654
Other operating income&expenses 1,546,182 1,425,932 1,232,998 |

| GRIFOLS, S.A. AND SUBSIDIARIES
Notes to the Condensed Consolidated Interim Financial Statements for the
twelve-month period ended 31 December 2023
(in thousand Euros)
(Free translation from the original in Spanish. In the event of discrepancy, the Spanish-language version prevails)
96
(27) Finance Result
Details are as follows:
Reference 31/12/2023 31/12/2023 31/12/2023
Finance income 62,326 33,859 11,551
Finance costs from Senior Unsecured Notes (177,482) (181,149) (104,944)
Finance costs from senior debt Note 21 (b) (257,350) (161,466) (111,719)
Finance costs from other financial liabilities (73,533) (81,914) --
Capitalized interest Note 9 36,892 25,184 18,636
Finance lease expenses (44,587) (45,198) (35,786)
Other finance costs Note 8 (80,804) (33,780) (33,889)
Finance costs (596,864) (478,323) (267,702)
Finance costs from sale of receivables Note 15 (24,993) (18,201) (10,292)
Change in fair value of financial instruments 1,459 11,999 246
Exchange differences (16,386) 7,725 (11,602)
Finance result (574,458) (442,941) (277,799)
Thousands of Euros
The finance costs from other financial liabilities heading for 2023 includes finance costs related to the interest on the
funds received by GIC amounting 73,533 thousand (Euros 81,914 thousand at 31 December 2022) (see note 21 (c)).
During the twelve-month period ended 31 December 2023 the Group has capitalized interest at a rate of between
6.03% and 6.79% based on the financing received (between 4.43% and 5.44% during 2022).
(28) Taxation
Grifols, S.A. is authorized to file consolidated tax returns in Spain with Grifols Movaco, S.A., Laboratorios Grifols,
S.A., Instituto Grifols, S.A., Biomat, S.A., Grifols Viajes, S.A., Grifols International, S.A., Grifols Engineering, S.A.,
Gripdan Invest, S.L., Araclon Biotech, Aigües Minerals de Vilajuiga, S.A. and VCN Biosciences, S.L. Grifols, S.A.,
in its capacity as Parent, is responsible for the filing and settlement of the consolidated tax return. Under prevailing
tax law, Spanish companies pay 25% tax, which may be reduced by certain deductions.
The North American company Grifols Shared Services North America, Inc. is also authorized to file consolidated
tax returns in the USA with Grifols Biologicals Inc., Grifols USA, LLC., Biomat USA, Inc., Grifols Therapeutics
Inc., Talecris Plasma Resources, Inc, Interstate Blood Bank, Inc. and Goetech, LLC.. The profits of the companies
domiciled in the USA, determined in accordance with prevailing tax legislation, are subject to tax of approximately
22% of taxable income, which may be reduced by certain deductions.
Grifols assesses the effect of uncertain tax treatments and recognizes the effect of the uncertainty on taxable earnings.
At 31 of December 2023 and 2022, the potential obligations deriving from tax claims are properly covered. There
are no lawsuits or uncertain tax treatments that are individually material.
In 2021, the OECD released the Model Rules for Pillar 2 to address tax challenges arising from the digitization of
the economy. This international tax system reform focuses on the geographic allocation of profits for tax purposes
and is designed to ensure that multinational enterprises are subject to a minimum effective tax rate of 15%. |
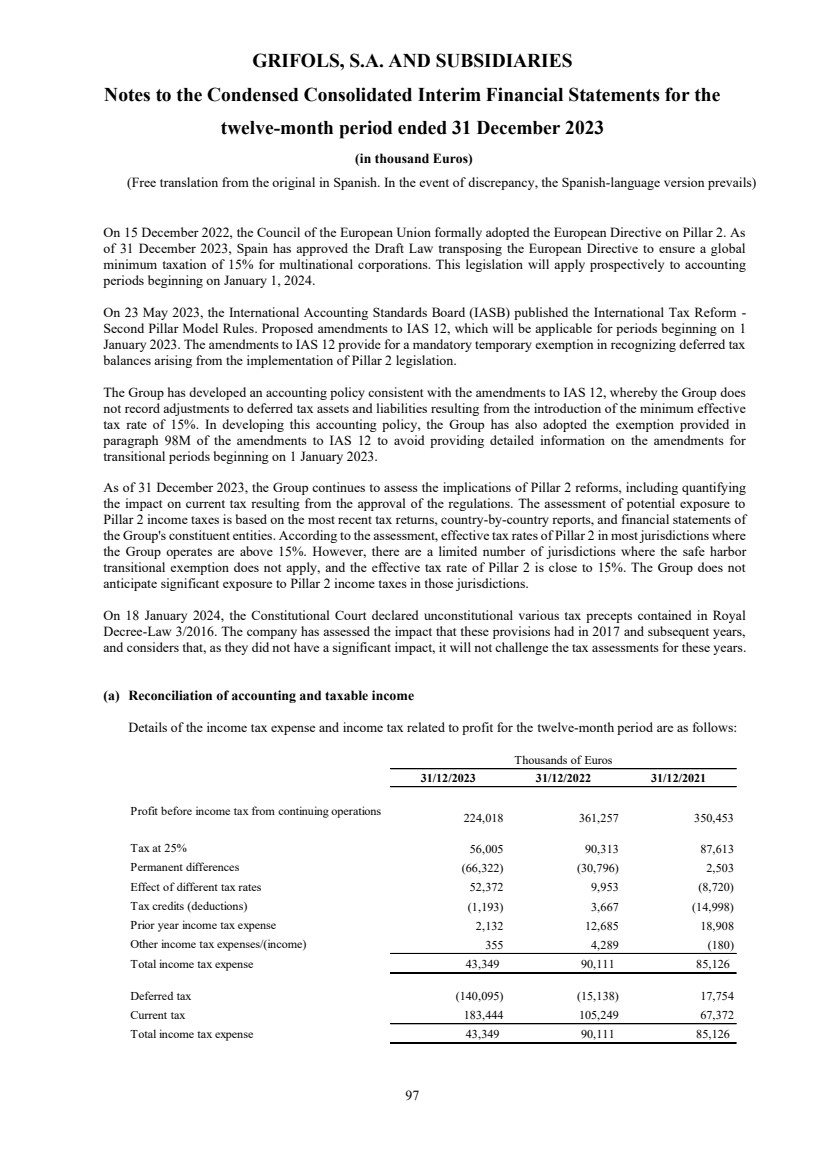
| GRIFOLS, S.A. AND SUBSIDIARIES
Notes to the Condensed Consolidated Interim Financial Statements for the
twelve-month period ended 31 December 2023
(in thousand Euros)
(Free translation from the original in Spanish. In the event of discrepancy, the Spanish-language version prevails)
97
On 15 December 2022, the Council of the European Union formally adopted the European Directive on Pillar 2. As
of 31 December 2023, Spain has approved the Draft Law transposing the European Directive to ensure a global
minimum taxation of 15% for multinational corporations. This legislation will apply prospectively to accounting
periods beginning on January 1, 2024.
On 23 May 2023, the International Accounting Standards Board (IASB) published the International Tax Reform -
Second Pillar Model Rules. Proposed amendments to IAS 12, which will be applicable for periods beginning on 1
January 2023. The amendments to IAS 12 provide for a mandatory temporary exemption in recognizing deferred tax
balances arising from the implementation of Pillar 2 legislation.
The Group has developed an accounting policy consistent with the amendments to IAS 12, whereby the Group does
not record adjustments to deferred tax assets and liabilities resulting from the introduction of the minimum effective
tax rate of 15%. In developing this accounting policy, the Group has also adopted the exemption provided in
paragraph 98M of the amendments to IAS 12 to avoid providing detailed information on the amendments for
transitional periods beginning on 1 January 2023.
As of 31 December 2023, the Group continues to assess the implications of Pillar 2 reforms, including quantifying
the impact on current tax resulting from the approval of the regulations. The assessment of potential exposure to
Pillar 2 income taxes is based on the most recent tax returns, country-by-country reports, and financial statements of
the Group's constituent entities. According to the assessment, effective tax rates of Pillar 2 in most jurisdictions where
the Group operates are above 15%. However, there are a limited number of jurisdictions where the safe harbor
transitional exemption does not apply, and the effective tax rate of Pillar 2 is close to 15%. The Group does not
anticipate significant exposure to Pillar 2 income taxes in those jurisdictions.
On 18 January 2024, the Constitutional Court declared unconstitutional various tax precepts contained in Royal
Decree-Law 3/2016. The company has assessed the impact that these provisions had in 2017 and subsequent years,
and considers that, as they did not have a significant impact, it will not challenge the tax assessments for these years.
(a) Reconciliation of accounting and taxable income
Details of the income tax expense and income tax related to profit for the twelve-month period are as follows:
31/12/2023 31/12/2022 31/12/2021
Profit before income tax from continuing operations 224,018 361,257 350,453
Tax at 25% 56,005 90,313 87,613
Permanent differences (66,322) (30,796) 2,503
Effect of different tax rates 52,372 9,953 (8,720)
Tax credits (deductions) (1,193) 3,667 (14,998)
Prior year income tax expense 2,132 12,685 18,908
Other income tax expenses/(income) 355 4,289 (180)
Total income tax expense 43,349 90,111 85,126
Deferred tax (140,095) (15,138) 17,754
Current tax 183,444 105,249 67,372
Total income tax expense 43,349 90,111 85,126
Thousands of Euros |

| GRIFOLS, S.A. AND SUBSIDIARIES
Notes to the Condensed Consolidated Interim Financial Statements for the
twelve-month period ended 31 December 2023
(in thousand Euros)
(Free translation from the original in Spanish. In the event of discrepancy, the Spanish-language version prevails)
98
The effect of the different tax rates is basically due to a change of country mix in profits
(b) Deferred tax assets and liabilities
Details of deferred tax assets and liabilities are as follows:
31/12/2023 31/12/2022 31/12/2021
Assets
Provisions 29,663 20,511 8,387
Inventories 68,209 67,557 47,908
Tax credits (deductions) 76,603 33,921 26,425
Tax loss carryforwards 27,804 58,159 51,750
Fixed assets, amortisation and depreciation 61,479 -- --
Other 49,701 6,197 19,993
Subtotal, assets 313,459 186,345 154,463
Goodwill (2,727) (3,063) (2,106)
Fixed assets, amortisation and depreciation (4,155) (16) 3,151
Intangible assets -- (1,349) (3,001)
Other (6,734) (6,994) --
Subtotal, net liabilities (13,616) (11,422) (1,956)
Deferred assets, net 299,843 174,923 152,507
Liabilities
Goodwill (376,520) (337,948) (272,596)
Intangible assets (658,099) (669,316) (288,819)
Fixed assets (85,082) (92,811) (86,899)
Debt cancellation costs (41,894) (50,666) (61,543)
Others (53,503) -- --
Subtotal, liabilities (1,215,098) (1,150,741) (709,857)
Tax loss carryforwards 10,459 2,993 2,160
Tax credits (deductions) 68,104 14,578 --
Inventories 1,848 652 5,532
Provisions 105,656 70,206 37,671
Other 40,402 27,489 30,510
Subtotal, net assets 226,469 115,918 75,873
Net deferred Liabilities (988,629) (1,034,823) (633,984)
Thousands of Euros
Tax effect |

| GRIFOLS, S.A. AND SUBSIDIARIES
Notes to the Condensed Consolidated Interim Financial Statements for the
twelve-month period ended 31 December 2023
(in thousand Euros)
(Free translation from the original in Spanish. In the event of discrepancy, the Spanish-language version prevails)
99
Movement in deferred tax assets and liabilities is as follows:
Deferred tax assets and liabilities 31/12/2023 31/12/2022 31/12/2021
Balance at 1 January (859,900) (481,477) (406,892)
Movements during the year 140,095 15,138 (17,754)
Business combination (note 3) 239 (361,051) (16,400)
Translation differences 30,780 (32,510) (40,431)
Balance at 31 December (688,786) (859,900) (481,477)
Thousands of Euros
The Spanish companies have opted to apply accelerated depreciation to certain additions to property, plant and
equipment, which has resulted in the corresponding deferred tax liability.
The remaining assets and liabilities recognized in the twelve-month periods ended 31 December 2023, 2022 and
2021 were recognized in the statement of profit and loss.
Estimated net deferred tax assets to be reversed in a period of less than 12 months amount to Euros 232,859
thousand at 31 December 2023 (Euros 112,274 thousand at 31 December 2022).
The majority of the tax deductions pending application from Spanish companies related mainly to research and
development, mature in 18 years. Likewise, the Group estimates that practically the entire amount will be applied
in five years.
Tax loss carryforwards pending to be offset derived from the US companies are available for 20 years from their
date of origin whilst tax losses carryforwards pending to be offset from Spanish companies registered in the
Basque Country are available for 15 years and there is no maturity date for other remaining Spanish companies.
The Group estimates that of the total amount of tax credits for tax losses recognized in the balance sheet at 31
December 2023 for an amount of Euros 76,603 thousand, approximately Euros 40,178 thousand will be
recovered in a period of less than 5 years.
The Group has not recognized as deferred tax assets the tax effect of the unused tax loss carryforwards of Group
companies, which amount to Euros 103,303 thousand (Euros 121,486 thousand at 31 December 2022).
The amount of unrecognized deferred tax liabilities associated with investments in subsidiaries amounted to
Euros 76,348 thousand as of 31 December 2023 (Euros 78,947 thousand as of 31 December 2022).
The commitments from Spanish companies from the reversal of deferred tax related to provisions of investments
in subsidiaries are not significant.
(c) Years open to inspection
Under prevailing legislation, taxes cannot be considered to be definitively settled until the returns filed have been
inspected by the taxation authorities, or the prescription period has elapsed.
The main tax audits currently open in the Group are as follows:
• Certain companies of the Group domiciled in Spain were subject to an inspection by the Spanish State Tax
Administration Agency in relation to Corporate Income Tax for the years 2014, 2015 and 2016 and Value
Added Tax for the years 2015 and 2016.
As a result of said procedure, the State Tax Administration Agency issued assessments containing the results
of the inspection, where it is indicated that the treatment of certain transactions and computations mainly
related to Transfer Pricing should be adjusted, taking into consideration different interpretations related to |
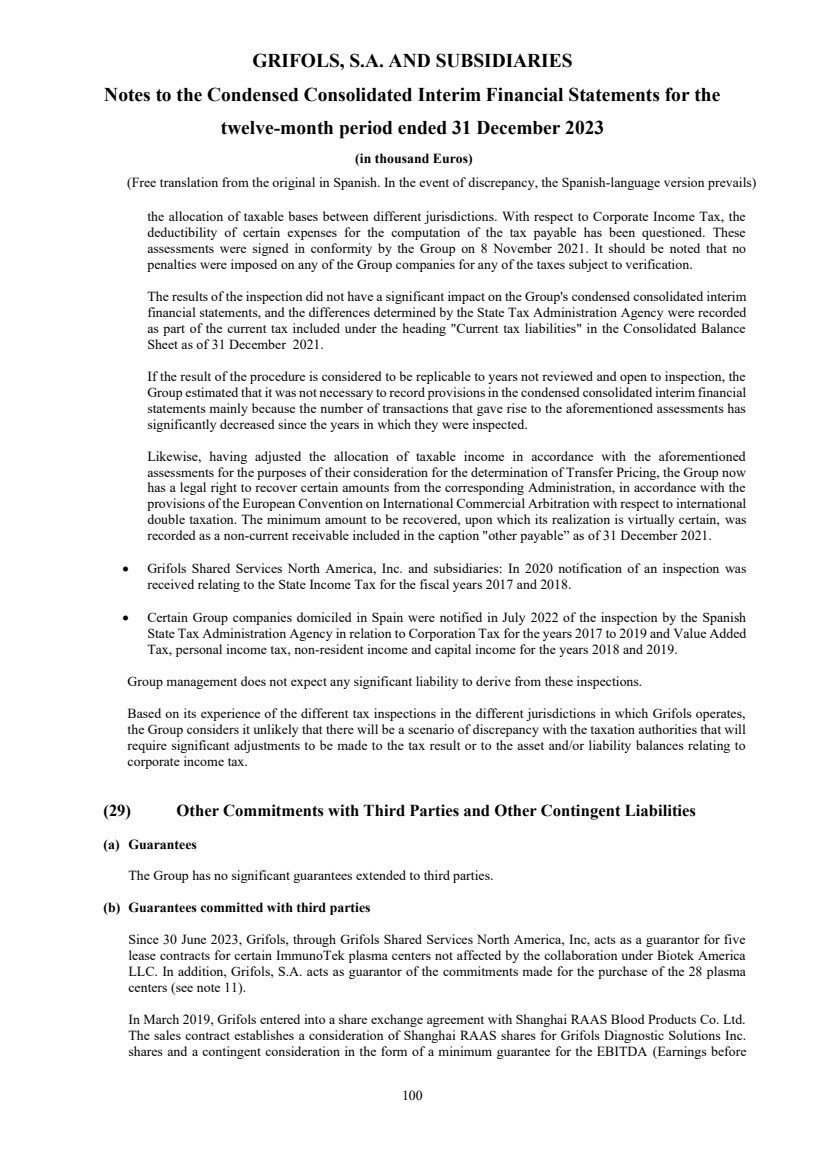
| GRIFOLS, S.A. AND SUBSIDIARIES
Notes to the Condensed Consolidated Interim Financial Statements for the
twelve-month period ended 31 December 2023
(in thousand Euros)
(Free translation from the original in Spanish. In the event of discrepancy, the Spanish-language version prevails)
100
the allocation of taxable bases between different jurisdictions. With respect to Corporate Income Tax, the
deductibility of certain expenses for the computation of the tax payable has been questioned. These
assessments were signed in conformity by the Group on 8 November 2021. It should be noted that no
penalties were imposed on any of the Group companies for any of the taxes subject to verification.
The results of the inspection did not have a significant impact on the Group's condensed consolidated interim
financial statements, and the differences determined by the State Tax Administration Agency were recorded
as part of the current tax included under the heading "Current tax liabilities" in the Consolidated Balance
Sheet as of 31 December 2021.
If the result of the procedure is considered to be replicable to years not reviewed and open to inspection, the
Group estimated that it was not necessary to record provisions in the condensed consolidated interim financial
statements mainly because the number of transactions that gave rise to the aforementioned assessments has
significantly decreased since the years in which they were inspected.
Likewise, having adjusted the allocation of taxable income in accordance with the aforementioned
assessments for the purposes of their consideration for the determination of Transfer Pricing, the Group now
has a legal right to recover certain amounts from the corresponding Administration, in accordance with the
provisions of the European Convention on International Commercial Arbitration with respect to international
double taxation. The minimum amount to be recovered, upon which its realization is virtually certain, was
recorded as a non-current receivable included in the caption "other payable” as of 31 December 2021.
• Grifols Shared Services North America, Inc. and subsidiaries: In 2020 notification of an inspection was
received relating to the State Income Tax for the fiscal years 2017 and 2018.
• Certain Group companies domiciled in Spain were notified in July 2022 of the inspection by the Spanish
State Tax Administration Agency in relation to Corporation Tax for the years 2017 to 2019 and Value Added
Tax, personal income tax, non-resident income and capital income for the years 2018 and 2019.
Group management does not expect any significant liability to derive from these inspections.
Based on its experience of the different tax inspections in the different jurisdictions in which Grifols operates,
the Group considers it unlikely that there will be a scenario of discrepancy with the taxation authorities that will
require significant adjustments to be made to the tax result or to the asset and/or liability balances relating to
corporate income tax.
(29) Other Commitments with Third Parties and Other Contingent Liabilities
(a) Guarantees
The Group has no significant guarantees extended to third parties.
(b) Guarantees committed with third parties
Since 30 June 2023, Grifols, through Grifols Shared Services North America, Inc, acts as a guarantor for five
lease contracts for certain ImmunoTek plasma centers not affected by the collaboration under Biotek America
LLC. In addition, Grifols, S.A. acts as guarantor of the commitments made for the purchase of the 28 plasma
centers (see note 11).
In March 2019, Grifols entered into a share exchange agreement with Shanghai RAAS Blood Products Co. Ltd.
The sales contract establishes a consideration of Shanghai RAAS shares for Grifols Diagnostic Solutions Inc.
shares and a contingent consideration in the form of a minimum guarantee for the EBITDA (Earnings before |
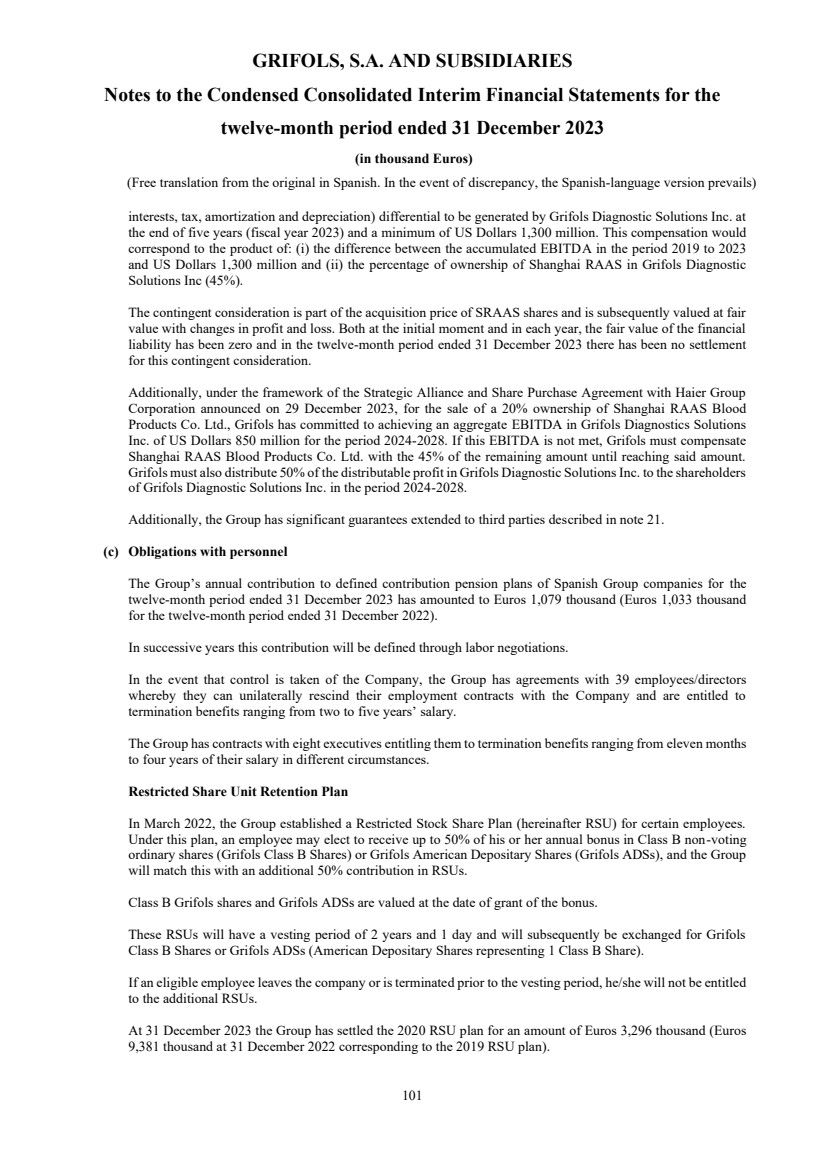
| GRIFOLS, S.A. AND SUBSIDIARIES
Notes to the Condensed Consolidated Interim Financial Statements for the
twelve-month period ended 31 December 2023
(in thousand Euros)
(Free translation from the original in Spanish. In the event of discrepancy, the Spanish-language version prevails)
101
interests, tax, amortization and depreciation) differential to be generated by Grifols Diagnostic Solutions Inc. at
the end of five years (fiscal year 2023) and a minimum of US Dollars 1,300 million. This compensation would
correspond to the product of: (i) the difference between the accumulated EBITDA in the period 2019 to 2023
and US Dollars 1,300 million and (ii) the percentage of ownership of Shanghai RAAS in Grifols Diagnostic
Solutions Inc (45%).
The contingent consideration is part of the acquisition price of SRAAS shares and is subsequently valued at fair
value with changes in profit and loss. Both at the initial moment and in each year, the fair value of the financial
liability has been zero and in the twelve-month period ended 31 December 2023 there has been no settlement
for this contingent consideration.
Additionally, under the framework of the Strategic Alliance and Share Purchase Agreement with Haier Group
Corporation announced on 29 December 2023, for the sale of a 20% ownership of Shanghai RAAS Blood
Products Co. Ltd., Grifols has committed to achieving an aggregate EBITDA in Grifols Diagnostics Solutions
Inc. of US Dollars 850 million for the period 2024-2028. If this EBITDA is not met, Grifols must compensate
Shanghai RAAS Blood Products Co. Ltd. with the 45% of the remaining amount until reaching said amount.
Grifols must also distribute 50% of the distributable profit in Grifols Diagnostic Solutions Inc. to the shareholders
of Grifols Diagnostic Solutions Inc. in the period 2024-2028.
Additionally, the Group has significant guarantees extended to third parties described in note 21.
(c) Obligations with personnel
The Group’s annual contribution to defined contribution pension plans of Spanish Group companies for the
twelve-month period ended 31 December 2023 has amounted to Euros 1,079 thousand (Euros 1,033 thousand
for the twelve-month period ended 31 December 2022).
In successive years this contribution will be defined through labor negotiations.
In the event that control is taken of the Company, the Group has agreements with 39 employees/directors
whereby they can unilaterally rescind their employment contracts with the Company and are entitled to
termination benefits ranging from two to five years’ salary.
The Group has contracts with eight executives entitling them to termination benefits ranging from eleven months
to four years of their salary in different circumstances.
Restricted Share Unit Retention Plan
In March 2022, the Group established a Restricted Stock Share Plan (hereinafter RSU) for certain employees.
Under this plan, an employee may elect to receive up to 50% of his or her annual bonus in Class B non-voting
ordinary shares (Grifols Class B Shares) or Grifols American Depositary Shares (Grifols ADSs), and the Group
will match this with an additional 50% contribution in RSUs.
Class B Grifols shares and Grifols ADSs are valued at the date of grant of the bonus.
These RSUs will have a vesting period of 2 years and 1 day and will subsequently be exchanged for Grifols
Class B Shares or Grifols ADSs (American Depositary Shares representing 1 Class B Share).
If an eligible employee leaves the company or is terminated prior to the vesting period, he/she will not be entitled
to the additional RSUs.
At 31 December 2023 the Group has settled the 2020 RSU plan for an amount of Euros 3,296 thousand (Euros
9,381 thousand at 31 December 2022 corresponding to the 2019 RSU plan). |
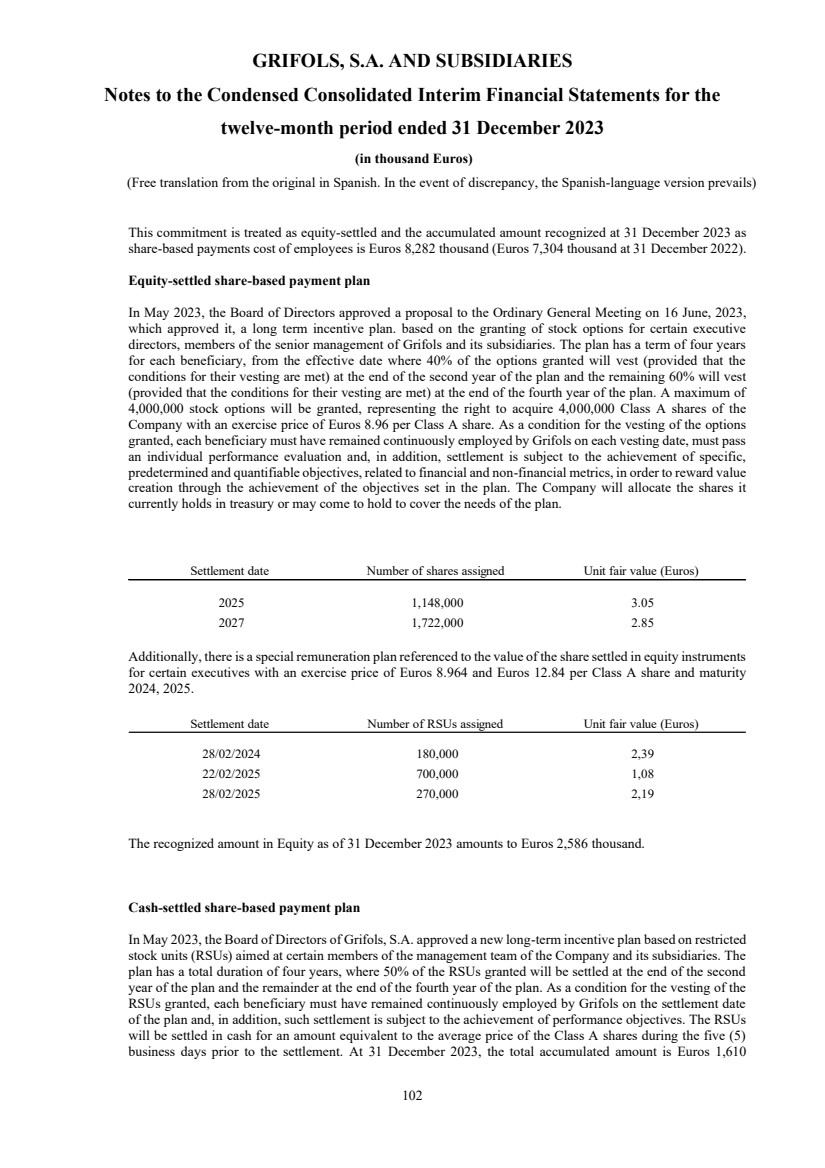
| GRIFOLS, S.A. AND SUBSIDIARIES
Notes to the Condensed Consolidated Interim Financial Statements for the
twelve-month period ended 31 December 2023
(in thousand Euros)
(Free translation from the original in Spanish. In the event of discrepancy, the Spanish-language version prevails)
102
This commitment is treated as equity-settled and the accumulated amount recognized at 31 December 2023 as
share-based payments cost of employees is Euros 8,282 thousand (Euros 7,304 thousand at 31 December 2022).
Equity-settled share-based payment plan
In May 2023, the Board of Directors approved a proposal to the Ordinary General Meeting on 16 June, 2023,
which approved it, a long term incentive plan. based on the granting of stock options for certain executive
directors, members of the senior management of Grifols and its subsidiaries. The plan has a term of four years
for each beneficiary, from the effective date where 40% of the options granted will vest (provided that the
conditions for their vesting are met) at the end of the second year of the plan and the remaining 60% will vest
(provided that the conditions for their vesting are met) at the end of the fourth year of the plan. A maximum of
4,000,000 stock options will be granted, representing the right to acquire 4,000,000 Class A shares of the
Company with an exercise price of Euros 8.96 per Class A share. As a condition for the vesting of the options
granted, each beneficiary must have remained continuously employed by Grifols on each vesting date, must pass
an individual performance evaluation and, in addition, settlement is subject to the achievement of specific,
predetermined and quantifiable objectives, related to financial and non-financial metrics, in order to reward value
creation through the achievement of the objectives set in the plan. The Company will allocate the shares it
currently holds in treasury or may come to hold to cover the needs of the plan.
Settlement date Number of shares assigned Unit fair value (Euros)
2025 1,148,000 3.05
2027 1,722,000 2.85
Additionally, there is a special remuneration plan referenced to the value of the share settled in equity instruments
for certain executives with an exercise price of Euros 8.964 and Euros 12.84 per Class A share and maturity
2024, 2025.
Settlement date Number of RSUs assigned Unit fair value (Euros)
28/02/2024 180,000 2,39
22/02/2025 700,000 1,08
28/02/2025 270,000 2,19
The recognized amount in Equity as of 31 December 2023 amounts to Euros 2,586 thousand.
Cash-settled share-based payment plan
In May 2023, the Board of Directors of Grifols, S.A. approved a new long-term incentive plan based on restricted
stock units (RSUs) aimed at certain members of the management team of the Company and its subsidiaries. The
plan has a total duration of four years, where 50% of the RSUs granted will be settled at the end of the second
year of the plan and the remainder at the end of the fourth year of the plan. As a condition for the vesting of the
RSUs granted, each beneficiary must have remained continuously employed by Grifols on the settlement date
of the plan and, in addition, such settlement is subject to the achievement of performance objectives. The RSUs
will be settled in cash for an amount equivalent to the average price of the Class A shares during the five (5)
business days prior to the settlement. At 31 December 2023, the total accumulated amount is Euros 1,610 |
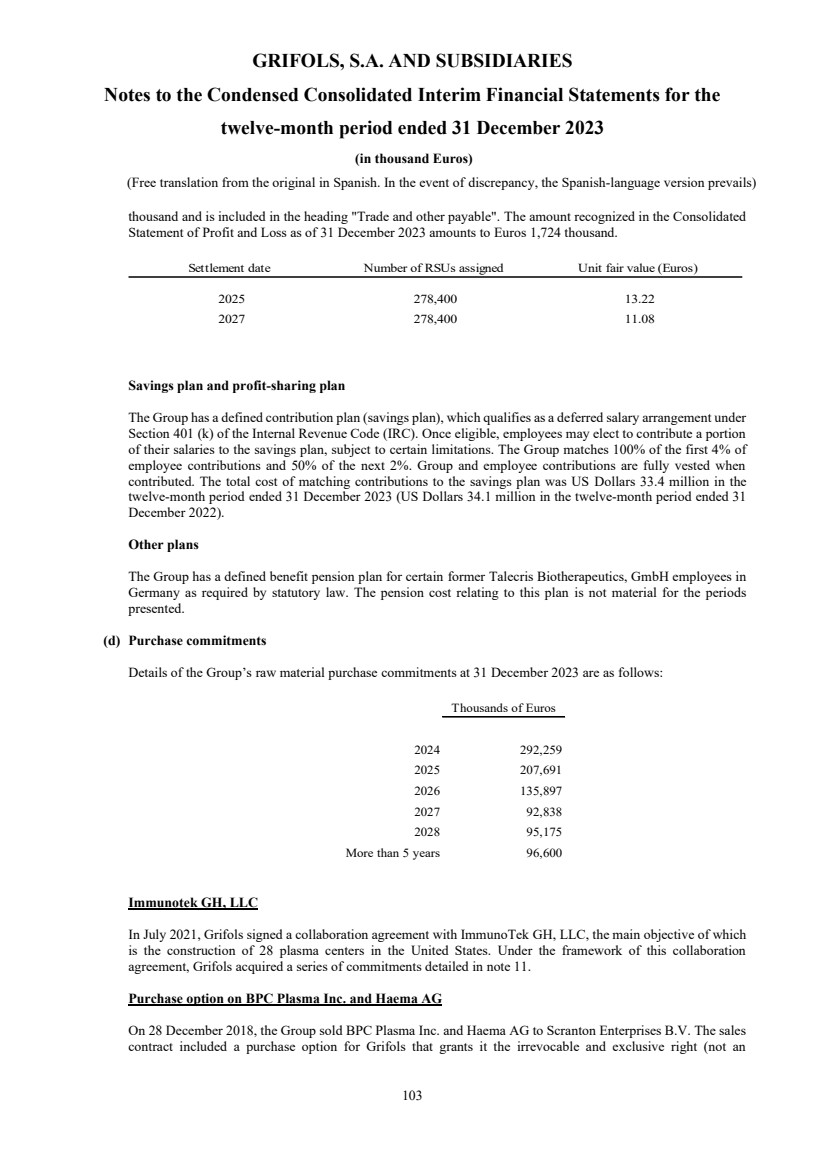
| GRIFOLS, S.A. AND SUBSIDIARIES
Notes to the Condensed Consolidated Interim Financial Statements for the
twelve-month period ended 31 December 2023
(in thousand Euros)
(Free translation from the original in Spanish. In the event of discrepancy, the Spanish-language version prevails)
103
thousand and is included in the heading "Trade and other payable". The amount recognized in the Consolidated
Statement of Profit and Loss as of 31 December 2023 amounts to Euros 1,724 thousand.
Settlement date Number of RSUs assigned Unit fair value (Euros)
2025 278,400 13.22
2027 278,400 11.08
Savings plan and profit-sharing plan
The Group has a defined contribution plan (savings plan), which qualifies as a deferred salary arrangement under
Section 401 (k) of the Internal Revenue Code (IRC). Once eligible, employees may elect to contribute a portion
of their salaries to the savings plan, subject to certain limitations. The Group matches 100% of the first 4% of
employee contributions and 50% of the next 2%. Group and employee contributions are fully vested when
contributed. The total cost of matching contributions to the savings plan was US Dollars 33.4 million in the
twelve-month period ended 31 December 2023 (US Dollars 34.1 million in the twelve-month period ended 31
December 2022).
Other plans
The Group has a defined benefit pension plan for certain former Talecris Biotherapeutics, GmbH employees in
Germany as required by statutory law. The pension cost relating to this plan is not material for the periods
presented.
(d) Purchase commitments
Details of the Group’s raw material purchase commitments at 31 December 2023 are as follows:
Thousands of Euros
2024 292,259
2025 207,691
2026 135,897
2027 92,838
2028 95,175
More than 5 years 96,600
Immunotek GH, LLC
In July 2021, Grifols signed a collaboration agreement with ImmunoTek GH, LLC, the main objective of which
is the construction of 28 plasma centers in the United States. Under the framework of this collaboration
agreement, Grifols acquired a series of commitments detailed in note 11.
Purchase option on BPC Plasma Inc. and Haema AG
On 28 December 2018, the Group sold BPC Plasma Inc. and Haema AG to Scranton Enterprises B.V. The sales
contract included a purchase option for Grifols that grants it the irrevocable and exclusive right (not an |

| GRIFOLS, S.A. AND SUBSIDIARIES
Notes to the Condensed Consolidated Interim Financial Statements for the
twelve-month period ended 31 December 2023
(in thousand Euros)
(Free translation from the original in Spanish. In the event of discrepancy, the Spanish-language version prevails)
104
obligation) to acquire the shares sold to Scranton Enterprises B.V. (both at the same time) at any time from the
effective date of sale.
The exercise price of the option will be equal to the greater of: (i) the same price at which the shares were sold
to Scranton, adding the expenses related to the transaction and the increase in net working capital from the time
of exercise of the option and the time at which the sale occurred, and (ii) the amount necessary to cancel the debt
contracted by Scranton with the financing entity of the transaction for an amount of US Dollars 360 million, plus
accrued interest, as well as any other amount necessary to cancel said debt.
National Service Projects Organization (NSPO)
On July 29, 2021, Grifols signed an agreement with the Egyptian company National Service Projects
Organization (“NSPO”) through which Grifols and NSPO has incorporated a new entity in Egypt for the
construction and operation of 20 plasma collection centers, a fractionation plant, and a protein purification and
dosing plant. Grifols and NSPO hold 49% and 51% respectively in the new entity. The agreement includes a call
option and a put option for both shareholders which allows them to acquire or sell their entire stake to the
counterparty. These options can be exercised once the 10-year period from the creation of the company has
elapsed. As the options are based on a variable number of shares and a variable amount, there is a derivative
financial instrument that shall be measured at fair value through profit or loss. Given that the option price has
been set at a value similar to the fair value of the new entity, the options do not have a significant value. As of
31 December 2023, no amount has been recognized for these options as they are not significant.
Canadian Blood Services
In September 2022, Grifols signed a collaboration agreement with Canadian Blood Services (CBS) to supply
them with 2.4 million grains of Immunoglobulin exclusively through a network of Canadian plasma centers that
should be fully developed and operational by July 2026. To achieve this goal, Grifols will need to collect 600.000
liters of Canadian plasma annually from Grifols-owned plasma centers in Canada. For this reason, Grifols has
made the following commitments for the acquisition of plasma and self-built centers in Canada:
2024 2025 2026 2027
13,372,075 20,897,588 30,172,027 18,939,896
Euros
(e) Judicial procedures and arbitration
Details of legal proceedings in which the Company or Group companies are involved are as follows:
• ABBOTT LABORATORIES v. GRIFOLS DIAGNOSTIC SOLUTIONS INC., GRIFOLS WORLDWIDE
OPERATIONS LIMITED AND NOVARTIS VACCINES AND DIAGNOSTICS, INC.
Served: 8 October 2019
US District Court, Northern District of Illinois
Patent Infringement, Civil Action No. 1:19-cv-6587
Abbott Laboratories (“Abbott”), GDS, GWWO and Novartis Vaccines and Diagnostics, Inc. are in dispute over
unpaid royalties payable by Abbott to GDS and Ortho-Clinical Diagnostics (“Ortho”) under an HIV License and
Option agreement dated 16 August 2019 (the “HIV License”). |
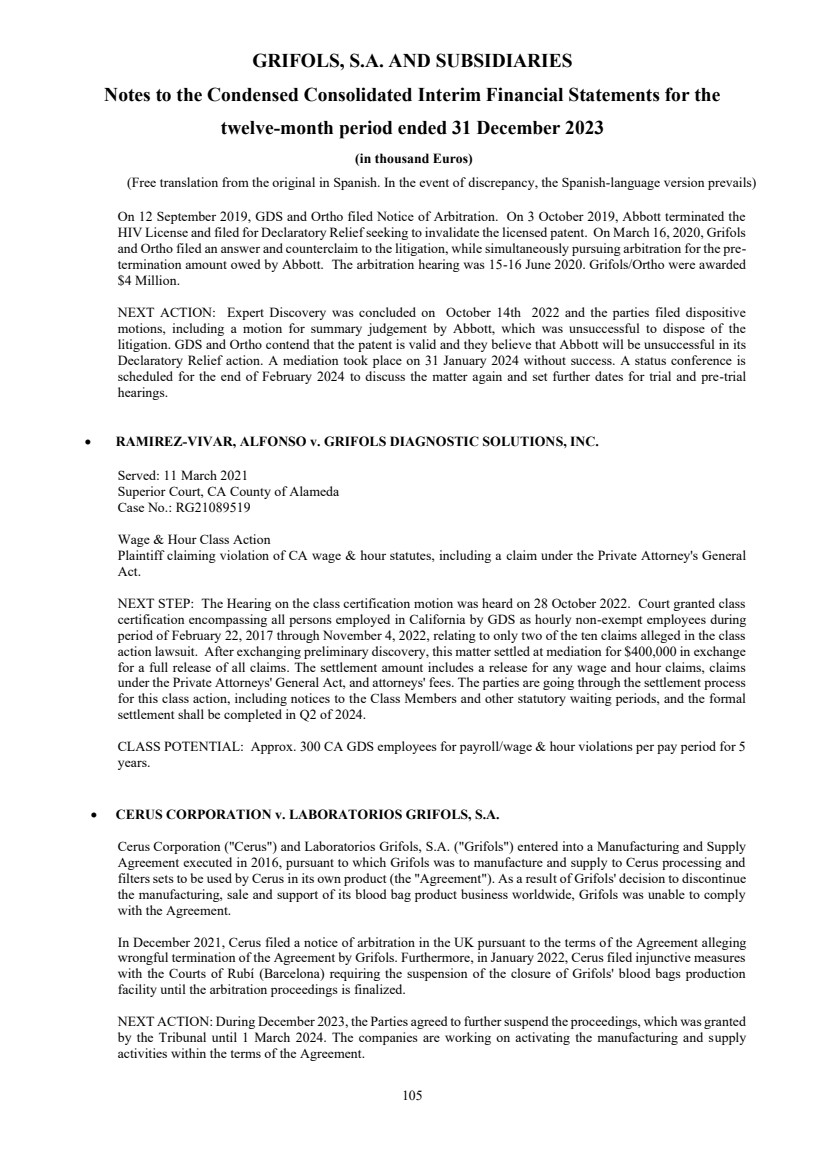
| GRIFOLS, S.A. AND SUBSIDIARIES
Notes to the Condensed Consolidated Interim Financial Statements for the
twelve-month period ended 31 December 2023
(in thousand Euros)
(Free translation from the original in Spanish. In the event of discrepancy, the Spanish-language version prevails)
105
On 12 September 2019, GDS and Ortho filed Notice of Arbitration. On 3 October 2019, Abbott terminated the
HIV License and filed for Declaratory Relief seeking to invalidate the licensed patent. On March 16, 2020, Grifols
and Ortho filed an answer and counterclaim to the litigation, while simultaneously pursuing arbitration for the pre-termination amount owed by Abbott. The arbitration hearing was 15-16 June 2020. Grifols/Ortho were awarded
$4 Million.
NEXT ACTION: Expert Discovery was concluded on October 14th 2022 and the parties filed dispositive
motions, including a motion for summary judgement by Abbott, which was unsuccessful to dispose of the
litigation. GDS and Ortho contend that the patent is valid and they believe that Abbott will be unsuccessful in its
Declaratory Relief action. A mediation took place on 31 January 2024 without success. A status conference is
scheduled for the end of February 2024 to discuss the matter again and set further dates for trial and pre-trial
hearings.
• RAMIREZ-VIVAR, ALFONSO v. GRIFOLS DIAGNOSTIC SOLUTIONS, INC.
Served: 11 March 2021
Superior Court, CA County of Alameda
Case No.: RG21089519
Wage & Hour Class Action
Plaintiff claiming violation of CA wage & hour statutes, including a claim under the Private Attorney's General
Act.
NEXT STEP: The Hearing on the class certification motion was heard on 28 October 2022. Court granted class
certification encompassing all persons employed in California by GDS as hourly non-exempt employees during
period of February 22, 2017 through November 4, 2022, relating to only two of the ten claims alleged in the class
action lawsuit. After exchanging preliminary discovery, this matter settled at mediation for $400,000 in exchange
for a full release of all claims. The settlement amount includes a release for any wage and hour claims, claims
under the Private Attorneys' General Act, and attorneys' fees. The parties are going through the settlement process
for this class action, including notices to the Class Members and other statutory waiting periods, and the formal
settlement shall be completed in Q2 of 2024.
CLASS POTENTIAL: Approx. 300 CA GDS employees for payroll/wage & hour violations per pay period for 5
years.
• CERUS CORPORATION v. LABORATORIOS GRIFOLS, S.A.
Cerus Corporation ("Cerus") and Laboratorios Grifols, S.A. ("Grifols") entered into a Manufacturing and Supply
Agreement executed in 2016, pursuant to which Grifols was to manufacture and supply to Cerus processing and
filters sets to be used by Cerus in its own product (the "Agreement"). As a result of Grifols' decision to discontinue
the manufacturing, sale and support of its blood bag product business worldwide, Grifols was unable to comply
with the Agreement.
In December 2021, Cerus filed a notice of arbitration in the UK pursuant to the terms of the Agreement alleging
wrongful termination of the Agreement by Grifols. Furthermore, in January 2022, Cerus filed injunctive measures
with the Courts of Rubí (Barcelona) requiring the suspension of the closure of Grifols' blood bags production
facility until the arbitration proceedings is finalized.
NEXT ACTION: During December 2023, the Parties agreed to further suspend the proceedings, which was granted
by the Tribunal until 1 March 2024. The companies are working on activating the manufacturing and supply
activities within the terms of the Agreement. |

| GRIFOLS, S.A. AND SUBSIDIARIES
Notes to the Condensed Consolidated Interim Financial Statements for the
twelve-month period ended 31 December 2023
(in thousand Euros)
(Free translation from the original in Spanish. In the event of discrepancy, the Spanish-language version prevails)
106
• THE STATE CO. FOR MARKETING DRUGS AND MEDICAL APPLIANCES IN IRAQ (KIMADIA) v.
LABORATORIOS GRIFOLS, S.A.
The State Co. for Marketing Drugs and Medical Appliances in Iraq ("KIMADIA") awarded a tender for the supply
of blood bags to Laboratorios Grifols, S.A. ("Grifols"). Grifols, through Hali/Tiba (its agent in Iraq), informed
KIMADIA on Grifols' inability to supply the blood bags pursuant to the tender awarded, due to its decision to
discontinue the manufacturing, sale and support of its blood bag product business.
The tender documents set forth a list of penalties and compensations in case the awardee is unable to supply the
products to KIMADIA. Further, Hali/Tiba also claims Grifols a compensation for the services performed in
relation to the tender.
NEXT ACTION: Grifols has received verbal information that KIMADIA has been able to sourced alternative
product for an agreeable pricing and that discussions among Hali/Tiba and KIMADIA had not continue on the
topic of possible sanctions. However, given the absence of any written confirmation on the latter, Grifols prefers
to let some time go by to assure that the possible claim will not occur.
(30) Financial Instruments
(a) Classification
Below is a breakdown of the financial instruments by nature, category and fair value. The Group does not provide
details of the fair value of certain financial instruments as their carrying amount is very similar to their fair value
because of its short term. |
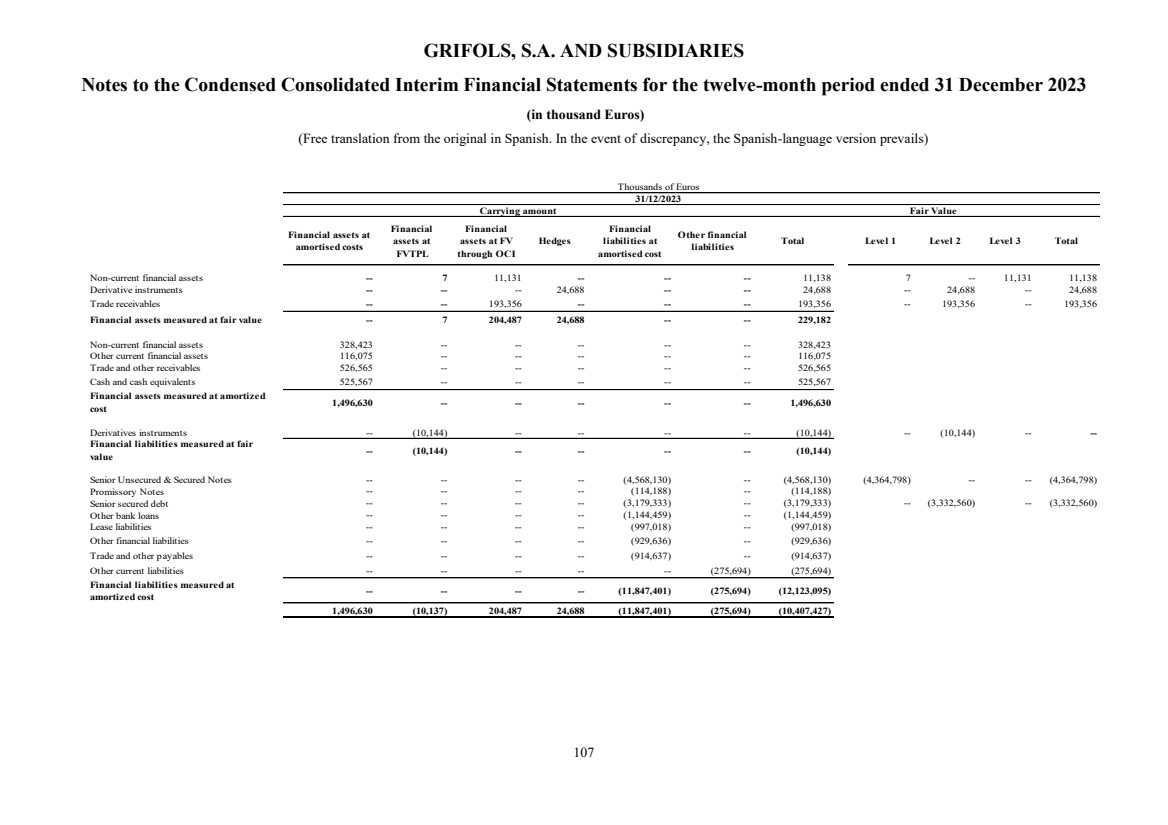
| GRIFOLS, S.A. AND SUBSIDIARIES
Notes to the Condensed Consolidated Interim Financial Statements for the twelve-month period ended 31 December 2023
(in thousand Euros)
(Free translation from the original in Spanish. In the event of discrepancy, the Spanish-language version prevails)
107
Financial assets at
amortised costs
Financial
assets at
FVTPL
Financial
assets at FV
through OCI
Hedges
Financial
liabilities at
amortised cost
Other financial
liabilities Total Level 1 Level 2 Level 3 Total
Non-current financial assets -- 7 11,131 -- -- -- 11,138 7 -- 11,131 11,138
Derivative instruments -- -- -- 24,688 -- -- 24,688 -- 24,688 -- 24,688
Trade receivables -- -- 193,356 -- -- -- 193,356 -- 193,356 -- 193,356
Financial assets measured at fair value -- 7 204,487 24,688 -- -- 229,182
Non-current financial assets 328,423 -- -- -- -- -- 328,423
Other current financial assets 116,075 -- -- -- -- -- 116,075
Trade and other receivables 526,565 -- -- -- -- -- 526,565
Cash and cash equivalents 525,567 -- -- -- -- -- 525,567
Financial assets measured at amortized
cost
1,496,630 -- -- -- -- -- 1,496,630
Derivatives instruments -- (10,144) -- -- -- -- (10,144) -- (10,144) -- --
Financial liabilities measured at fair
value
-- (10,144) -- -- -- -- (10,144)
Senior Unsecured & Secured Notes -- -- -- -- (4,568,130) -- (4,568,130) (4,364,798) -- -- (4,364,798)
Promissory Notes -- -- -- -- (114,188) -- (114,188)
Senior secured debt -- -- -- -- (3,179,333) -- (3,179,333) -- (3,332,560) -- (3,332,560)
Other bank loans -- -- -- -- (1,144,459) -- (1,144,459)
Lease liabilities -- -- -- -- (997,018) -- (997,018)
Other financial liabilities -- -- -- -- (929,636) -- (929,636)
Trade and other payables -- -- -- -- (914,637) -- (914,637)
Other current liabilities -- -- -- -- -- (275,694) (275,694)
Financial liabilities measured at
amortized cost -- -- -- -- (11,847,401) (275,694) (12,123,095)
1,496,630 (10,137) 204,487 24,688 (11,847,401) (275,694) (10,407,427)
Thousands of Euros
31/12/2023
Carrying amount Fair Value |
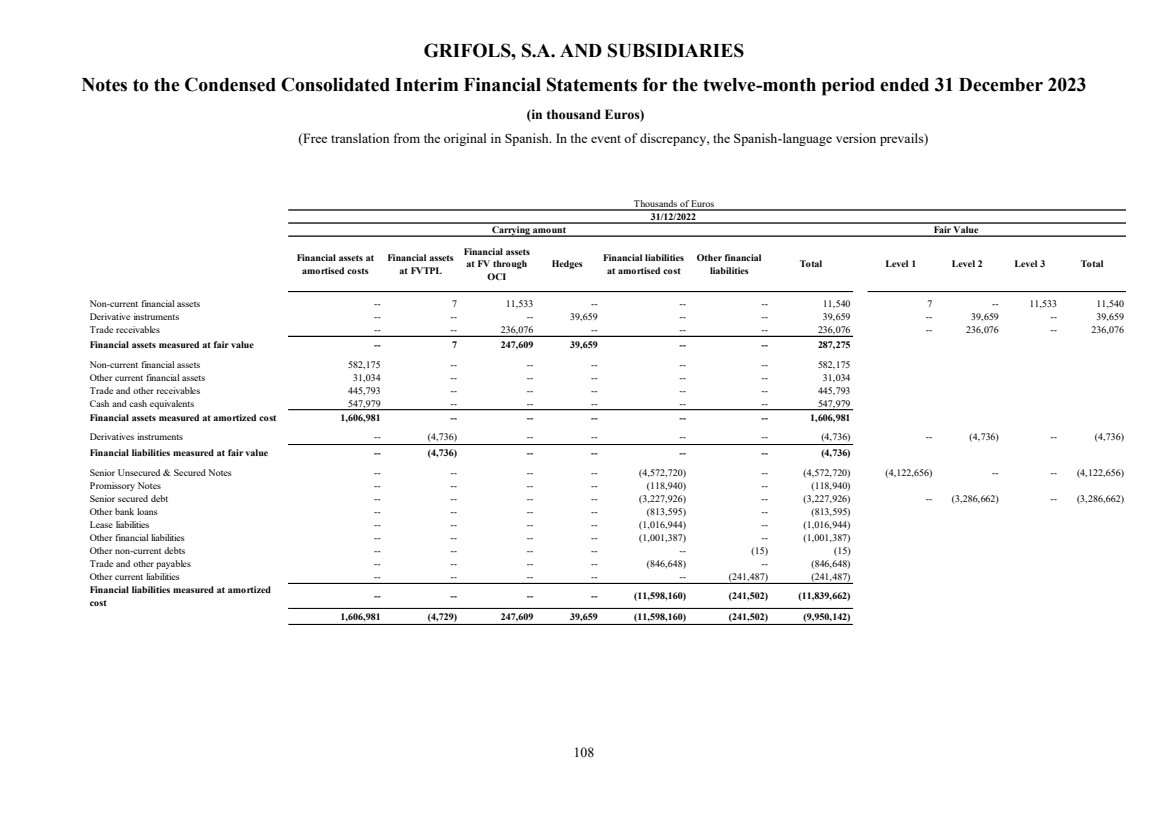
| GRIFOLS, S.A. AND SUBSIDIARIES
Notes to the Condensed Consolidated Interim Financial Statements for the twelve-month period ended 31 December 2023
(in thousand Euros)
(Free translation from the original in Spanish. In the event of discrepancy, the Spanish-language version prevails)
108
Financial assets at
amortised costs
Financial assets
at FVTPL
Financial assets
at FV through
OCI
Hedges Financial liabilities
at amortised cost
Other financial
liabilities Total Level 1 Level 2 Level 3 Total
Non-current financial assets -- 7 11,533 -- -- -- 11,540 7 -- 11,533 11,540
Derivative instruments -- -- -- 39,659 -- -- 39,659 -- 39,659 -- 39,659
Trade receivables -- -- 236,076 -- -- -- 236,076 -- 236,076 -- 236,076
Financial assets measured at fair value -- 7 247,609 39,659 -- -- 287,275
Non-current financial assets 582,175 -- -- -- -- -- 582,175
Other current financial assets 31,034 -- -- -- -- -- 31,034
Trade and other receivables 445,793 -- -- -- -- -- 445,793
Cash and cash equivalents 547,979 -- -- -- -- -- 547,979
Financial assets measured at amortized cost 1,606,981 -- -- -- -- -- 1,606,981
Derivatives instruments -- (4,736) -- -- -- -- (4,736) -- (4,736) -- (4,736)
Financial liabilities measured at fair value -- (4,736) -- -- -- -- (4,736)
Senior Unsecured & Secured Notes -- -- -- -- (4,572,720) -- (4,572,720) (4,122,656) -- -- (4,122,656)
Promissory Notes -- -- -- -- (118,940) -- (118,940)
Senior secured debt -- -- -- -- (3,227,926) -- (3,227,926) -- (3,286,662) -- (3,286,662)
Other bank loans -- -- -- -- (813,595) -- (813,595)
Lease liabilities -- -- -- -- (1,016,944) -- (1,016,944)
Other financial liabilities -- -- -- -- (1,001,387) -- (1,001,387)
Other non-current debts -- -- -- -- -- (15) (15)
Trade and other payables -- -- -- -- (846,648) -- (846,648)
Other current liabilities -- -- -- -- -- (241,487) (241,487)
Financial liabilities measured at amortized
cost
-- -- -- -- (11,598,160) (241,502) (11,839,662)
1,606,981 (4,729) 247,609 39,659 (11,598,160) (241,502) (9,950,142)
Thousands of Euros
31/12/2022
Carrying amount Fair Value |
| GRIFOLS, S.A. AND SUBSIDIARIES
Notes to the Condensed Consolidated Interim Financial Statements for the
twelve-month period ended 31 December 2023
(Free translation from the original in Spanish. In the event of discrepancy, the Spanish-language version prevails)
109
(b) Measurement of fair value
In order to determine the fair value of financial assets or liabilities, the Group uses the following hierarchy
based on the relevance of the variables used:
• Level 1: estimations based on quoted prices of the instrument.
• Level 2: estimations based on significant observable variables coming directly from the market.
• Level 3: estimations based on valuation techniques other than observable variables in the market,
mainly discounted cash flows.
(c) Financial risk management
This item provides information on the Group’s exposure to risk associated with the use of financial
instruments, the Group’s objectives and procedures to measure and mitigate this risk, and the Group’s capital
management strategy.
The Group is exposed to the following risks:
• Credit risk
• Liquidity risk
• Market risk: includes interest rate risk, currency risk and other price risks.
The Group’s risk management policies are established to identify and analyze the risks faced by the Group,
define appropriate risk limits and controls and to control risks and comply with limits. Risk management
policies and procedures are reviewed regularly so that they reflect changes in market conditions and the
Group's activities. The Group’s management procedures and rules are designed to create a strict and
constructive control environment in which all employees understand their duties and obligations.
The Group’s Audit Committee supervises how management controls compliance with the Group’s risk
management procedures and policies and reviews whether the risk management policy is suitable considering
the risks to which the Group is exposed. This committee is assisted by Internal Audit which acts as supervisor.
Internal Audit performs regular and ad hoc reviews of the risk management controls and procedures and
reports its findings to the Audit Committee.
(i) Credit risk
Credit risk is the risk to which the Group is exposed in the event that a customer or counterparty to a financial
instrument fails to discharge a contractual obligation, and mainly results from trade receivables and the
Group’s investments in financial assets.
Trade receivables
The main risk is that of late payments, which is mitigated through the possibility of claiming interest as
foreseen by prevailing legislation. No significant bad debt or late payment issues have been detected for sales
to private entities.
The Group recognizes impairment based on its best estimate of the expected losses on trade and other
receivables. The main impairment losses recognized are due to specific losses relating to individually
identified risks. At the twelve-month period end, these impairment losses are immaterial. |

| GRIFOLS, S.A. AND SUBSIDIARIES
Notes to the Condensed Consolidated Interim Financial Statements for the
twelve-month period ended 31 December 2023
(Free translation from the original in Spanish. In the event of discrepancy, the Spanish-language version prevails)
110
Concentration of credit risk
For trade receivables the Group uses the simplified approach, estimating lifetime expected credit losses, while
for all other financial assets the Group uses the general approach for calculating expected credit losses. In
both cases, due to the customers' credit rating, as well as the internal classification systems currently in place
for new customers and considering that collection periods are mostly under 30 days, there is no significant
impact for the Group.
Exposure to credit risk
The carrying amount of financial assets represents the maximum exposure to credit risk. At 31 December
2023 and 2022 the maximum level of exposure to credit risk is as follows:
Carrying amount Reference 31/12/2023 31/12/2022
Non-current financial assets Note 11 340,605 620,745
Other current financial assets Note 11 140,232 43,663
Contractual assets Note 14 47,751 35,154
Trade receivables Note 15 629,045 608,688
Other receivables Note 15 47,537 29,083
Cash and cash equivalents Note 16 525,567 547,979
1,730,737 1,885,312
Thousands of Euros
The maximum level of exposure to risk associated with receivables and contractual assets at 31 December
2023 and 2022, by geographical area, is as follows.
Carrying amount 31/12/2023 31/12/2022
Spain 67,786 53,145
EU countries 90,168 69,003
United States of America 91,235 139,721
Other European countries 14,399 16,030
Other regions 460,745 395,026
724,333 672,925
Thousands of Euros |
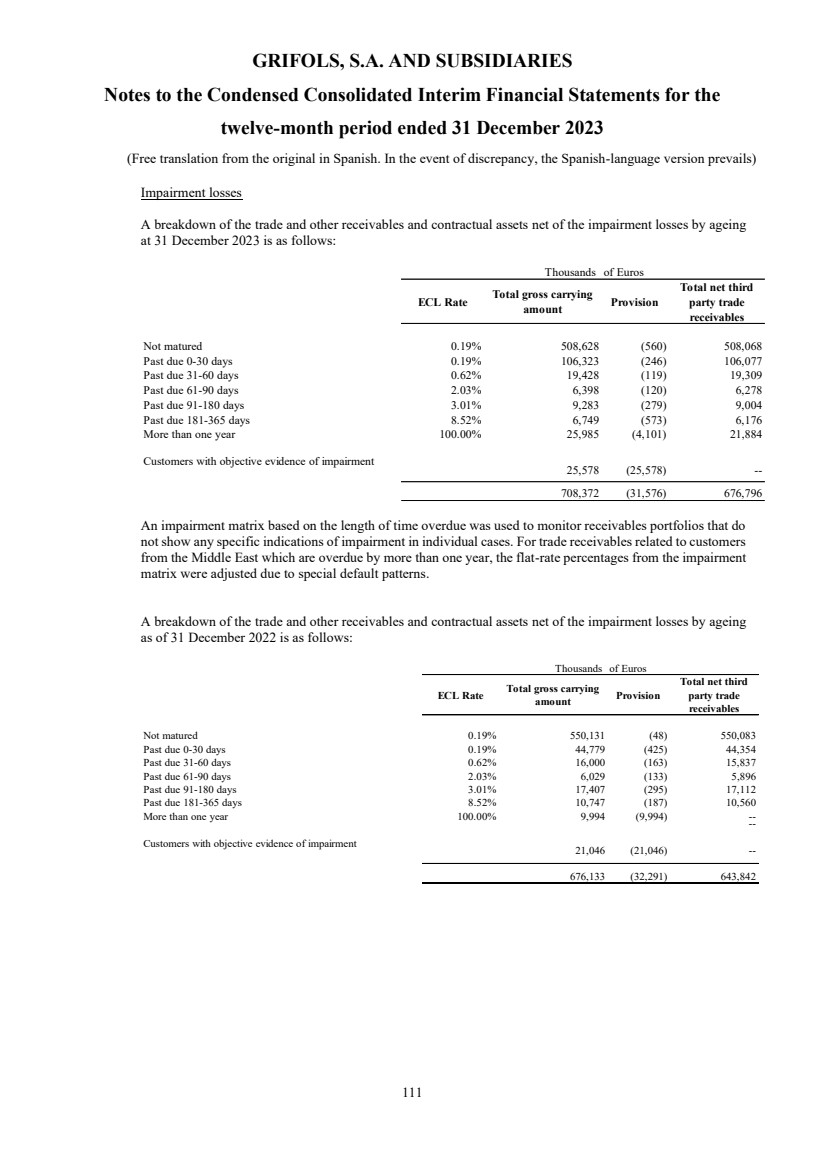
| GRIFOLS, S.A. AND SUBSIDIARIES
Notes to the Condensed Consolidated Interim Financial Statements for the
twelve-month period ended 31 December 2023
(Free translation from the original in Spanish. In the event of discrepancy, the Spanish-language version prevails)
111
Impairment losses
A breakdown of the trade and other receivables and contractual assets net of the impairment losses by ageing
at 31 December 2023 is as follows:
Thousands of Euros
ECL Rate Total gross carrying
amount Provision
Total net third
party trade
receivables
Not matured 0.19% 508,628 (560) 508,068
Past due 0-30 days 0.19% 106,323 (246) 106,077
Past due 31-60 days 0.62% 19,428 (119) 19,309
Past due 61-90 days 2.03% 6,398 (120) 6,278
Past due 91-180 days 3.01% 9,283 (279) 9,004
Past due 181-365 days 8.52% 6,749 (573) 6,176
More than one year 100.00% 25,985 (4,101) 21,884
Customers with objective evidence of impairment
25,578 (25,578) --
708,372 (31,576) 676,796
An impairment matrix based on the length of time overdue was used to monitor receivables portfolios that do
not show any specific indications of impairment in individual cases. For trade receivables related to customers
from the Middle East which are overdue by more than one year, the flat-rate percentages from the impairment
matrix were adjusted due to special default patterns.
A breakdown of the trade and other receivables and contractual assets net of the impairment losses by ageing
as of 31 December 2022 is as follows:
Thousands of Euros
ECL Rate Total gross carrying
amount Provision
Total net third
party trade
receivables
Not matured 0.19% 550,131 (48) 550,083
Past due 0-30 days 0.19% 44,779 (425) 44,354
Past due 31-60 days 0.62% 16,000 (163) 15,837
Past due 61-90 days 2.03% 6,029 (133) 5,896
Past due 91-180 days 3.01% 17,407 (295) 17,112
Past due 181-365 days 8.52% 10,747 (187) 10,560
More than one year 100.00% 9,994 (9,994) --
--
Customers with objective evidence of impairment 21,046 (21,046) --
676,133 (32,291) 643,842
|
| GRIFOLS, S.A. AND SUBSIDIARIES
Notes to the Condensed Consolidated Interim Financial Statements for the
twelve-month period ended 31 December 2023
(Free translation from the original in Spanish. In the event of discrepancy, the Spanish-language version prevails)
112
Movement in the bad debt provision was as follows:
31/12/2023 31/12/2022 31/12/2021
Opening balance 32,291 24,009 22,985
Net charges for the year 7,322 14,074 6,471
Net cancellations for the year (7,237) (6,949) (6,269)
Transfers 47 53 --
Translation differences (847) 1,104 822
Closing balance 31,576 32,291 24,009
Thousands of Euros
The Group does not have significant credit risk, with both treasury placements and the contracting of
derivatives being carried out with highly solvent financial institutions.
(ii) Liquidity risk
Liquidity risk is the risk that the Group cannot meet its financial obligations as they fall due. The Group’s
approach to managing liquidity is to ensure where possible, that it always has sufficient liquidity to settle its
obligations at the maturity date, both in normal conditions and in times of tension, to avoid incurring
unacceptable losses or tarnishing the Group’s reputation.
The Group manages liquidity risk on a prudent basis, based on availability of cash and sufficient committed
unused long-term credit facilities, enabling the Group to implement its business plans and carry out operations
using stable and secure sources of financing.
At 31 December 2023 the Group has total cash and cash equivalents of Euros 525,567 thousand (Euros 547,979
thousand at 31 December 2022). The Group also has approximately Euros 615,328 thousand in unused credit
facilities (Euros 987,340 thousand at 31 December 2022), including Euros 544,729 thousand on the revolving
credit facility (Euros 937,559 thousand at 31 December 2022). The Credit Agreement establishes a limitation
on the disposition of the "revolving line" that has not been exceeded as of December 31, 2022 and 2023.
The Group is able to provide sufficient liquidity to fund its current obligations based on cash flows from
operations combined with cash balances and availability of unused credit lines, and it is committed to
maintaining elevated and adequate levels of liquidity through internally generated cash flows, and a decrease
in dividend payments in the medium term. Additionally, currently the Group does not generate significant
cash in any country that might have restrictions on the repatriation of funds.
As in previous years, the Group continues with its quarterly program for optimization of working capital,
which is mainly based on contracts to sell receivables without recourse.
The main contractual obligations existing at the end of the fiscal year comprise mainly long-term financial
debt obligations with capital repayments and interest payments (see note 21).
The Group's treasury budget plans to pay all its commitments in the next 12 months. Additionally, the cash
received from the divestment in Shanghai RAAS (see Notes 10 and 12) and the improvement in operating
cash flow will be used to continue reducing the level of indebtedness initiated in previous years. On the other
hand, the Group has various additional financing alternatives such as negotiating with debt holders, accessing
the debt market or possible divestments in non-strategic assets, to optimize the debt structure and its financial
cost. |
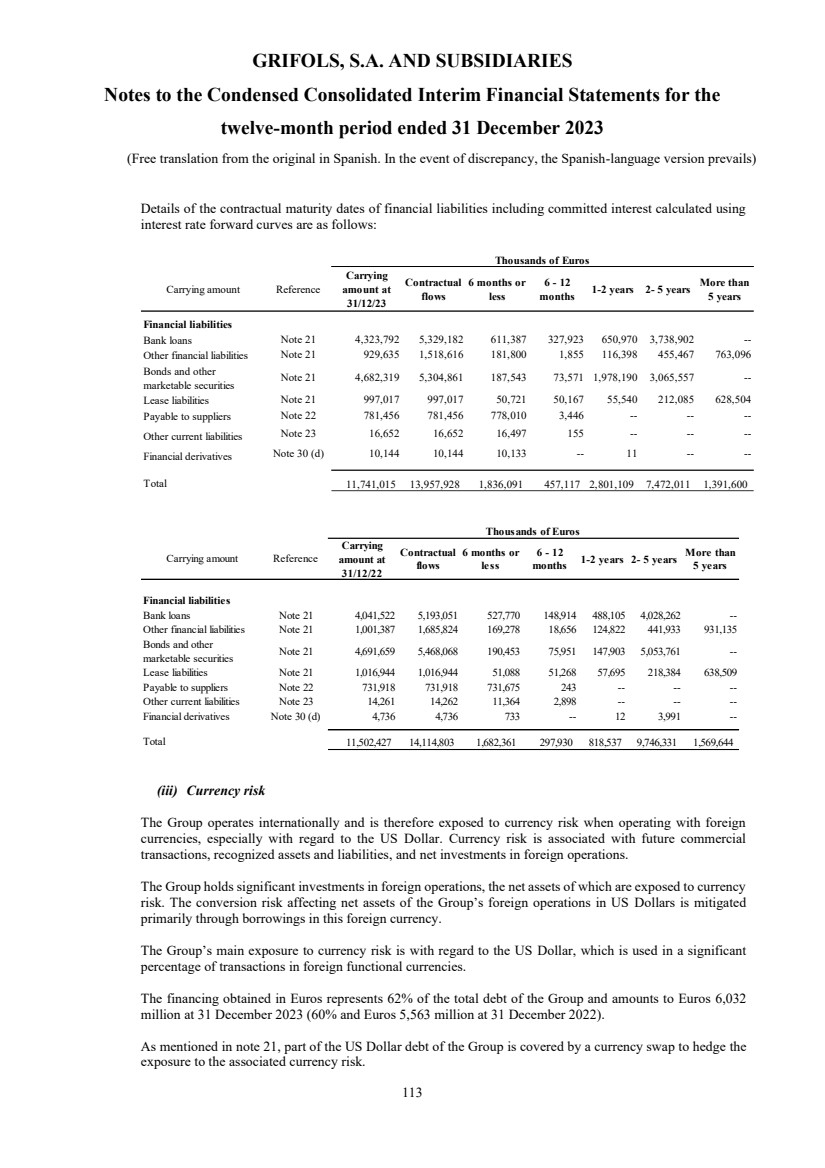
| GRIFOLS, S.A. AND SUBSIDIARIES
Notes to the Condensed Consolidated Interim Financial Statements for the
twelve-month period ended 31 December 2023
(Free translation from the original in Spanish. In the event of discrepancy, the Spanish-language version prevails)
113
Details of the contractual maturity dates of financial liabilities including committed interest calculated using
interest rate forward curves are as follows:
Carrying amount Reference
Carrying
amount at
31/12/23
Contractual
flows
6 months or
less
6 - 12
months
1-2 years 2- 5 years More than
5 years
Financial liabilities
Bank loans Note 21 4,323,792 5,329,182 611,387 327,923 650,970 3,738,902 --
Other financial liabilities Note 21 929,635 1,518,616 181,800 1,855 116,398 455,467 763,096
Bonds and other
marketable securities
Note 21 4,682,319 5,304,861 187,543 73,571 1,978,190 3,065,557 --
Lease liabilities Note 21 997,017 997,017 50,721 50,167 55,540 212,085 628,504
Payable to suppliers Note 22 781,456 781,456 778,010 3,446 -- -- --
Other current liabilities Note 23 16,652 16,652 16,497 155 -- -- --
Financial derivatives Note 30 (d) 10,144 10,144 10,133 -- 11 -- --
Total 11,741,015 13,957,928 1,836,091 457,117 2,801,109 7,472,011 1,391,600
Thousands of Euros
Carrying amount Reference
Carrying
amount at
31/12/22
Contractual
flows
6 months or
less
6 - 12
months 1-2 years 2- 5 years More than
5 years
Financial liabilities
Bank loans Note 21 4,041,522 5,193,051 527,770 148,914 488,105 4,028,262 --
Other financial liabilities Note 21 1,001,387 1,685,824 169,278 18,656 124,822 441,933 931,135
Bonds and other
marketable securities Note 21 4,691,659 5,468,068 190,453 75,951 147,903 5,053,761 --
Lease liabilities Note 21 1,016,944 1,016,944 51,088 51,268 57,695 218,384 638,509
Payable to suppliers Note 22 731,918 731,918 731,675 243 -- -- --
Other current liabilities Note 23 14,261 14,262 11,364 2,898 -- -- --
Financial derivatives Note 30 (d) 4,736 4,736 733 -- 12 3,991 --
Total 11,502,427 14,114,803 1,682,361 297,930 818,537 9,746,331 1,569,644
Thousands of Euros
(iii) Currency risk
The Group operates internationally and is therefore exposed to currency risk when operating with foreign
currencies, especially with regard to the US Dollar. Currency risk is associated with future commercial
transactions, recognized assets and liabilities, and net investments in foreign operations.
The Group holds significant investments in foreign operations, the net assets of which are exposed to currency
risk. The conversion risk affecting net assets of the Group’s foreign operations in US Dollars is mitigated
primarily through borrowings in this foreign currency.
The Group’s main exposure to currency risk is with regard to the US Dollar, which is used in a significant
percentage of transactions in foreign functional currencies.
The financing obtained in Euros represents 62% of the total debt of the Group and amounts to Euros 6,032
million at 31 December 2023 (60% and Euros 5,563 million at 31 December 2022).
As mentioned in note 21, part of the US Dollar debt of the Group is covered by a currency swap to hedge the
exposure to the associated currency risk. |
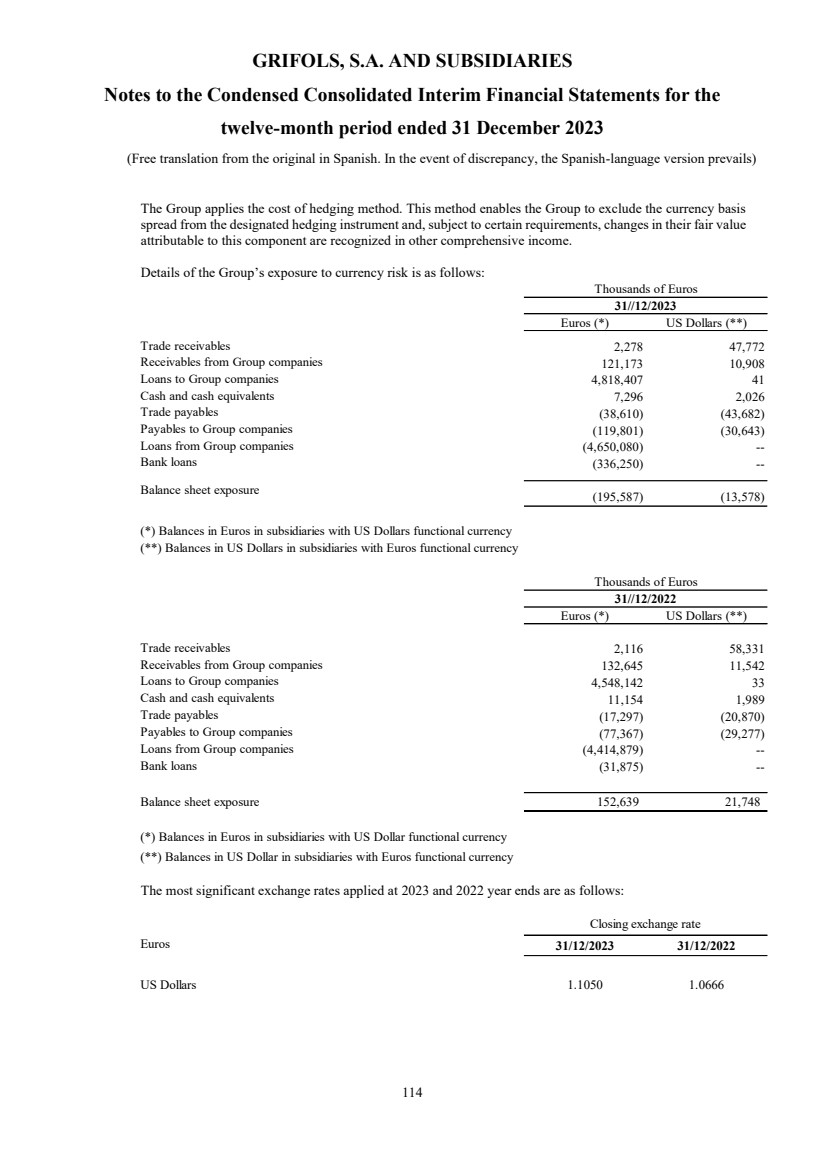
| GRIFOLS, S.A. AND SUBSIDIARIES
Notes to the Condensed Consolidated Interim Financial Statements for the
twelve-month period ended 31 December 2023
(Free translation from the original in Spanish. In the event of discrepancy, the Spanish-language version prevails)
114
The Group applies the cost of hedging method. This method enables the Group to exclude the currency basis
spread from the designated hedging instrument and, subject to certain requirements, changes in their fair value
attributable to this component are recognized in other comprehensive income.
Details of the Group’s exposure to currency risk is as follows:
Euros (*) US Dollars (**)
Trade receivables 2,278 47,772
Receivables from Group companies 121,173 10,908
Loans to Group companies 4,818,407 41
Cash and cash equivalents 7,296 2,026
Trade payables (38,610) (43,682)
Payables to Group companies (119,801) (30,643)
Loans from Group companies (4,650,080) --
Bank loans (336,250) --
Balance sheet exposure (195,587) (13,578)
(*) Balances in Euros in subsidiaries with US Dollars functional currency
(**) Balances in US Dollars in subsidiaries with Euros functional currency
Thousands of Euros
31//12/2023
Euros (*) US Dollars (**)
Trade receivables 2,116 58,331
Receivables from Group companies 132,645 11,542
Loans to Group companies 4,548,142 33
Cash and cash equivalents 11,154 1,989
Trade payables (17,297) (20,870)
Payables to Group companies (77,367) (29,277)
Loans from Group companies (4,414,879) --
Bank loans (31,875) --
Balance sheet exposure 152,639 21,748
(*) Balances in Euros in subsidiaries with US Dollar functional currency
(**) Balances in US Dollar in subsidiaries with Euros functional currency
Thousands of Euros
31//12/2022
The most significant exchange rates applied at 2023 and 2022 year ends are as follows:
Euros 31/12/2023 31/12/2022
US Dollars 1.1050 1.0666
Closing exchange rate |
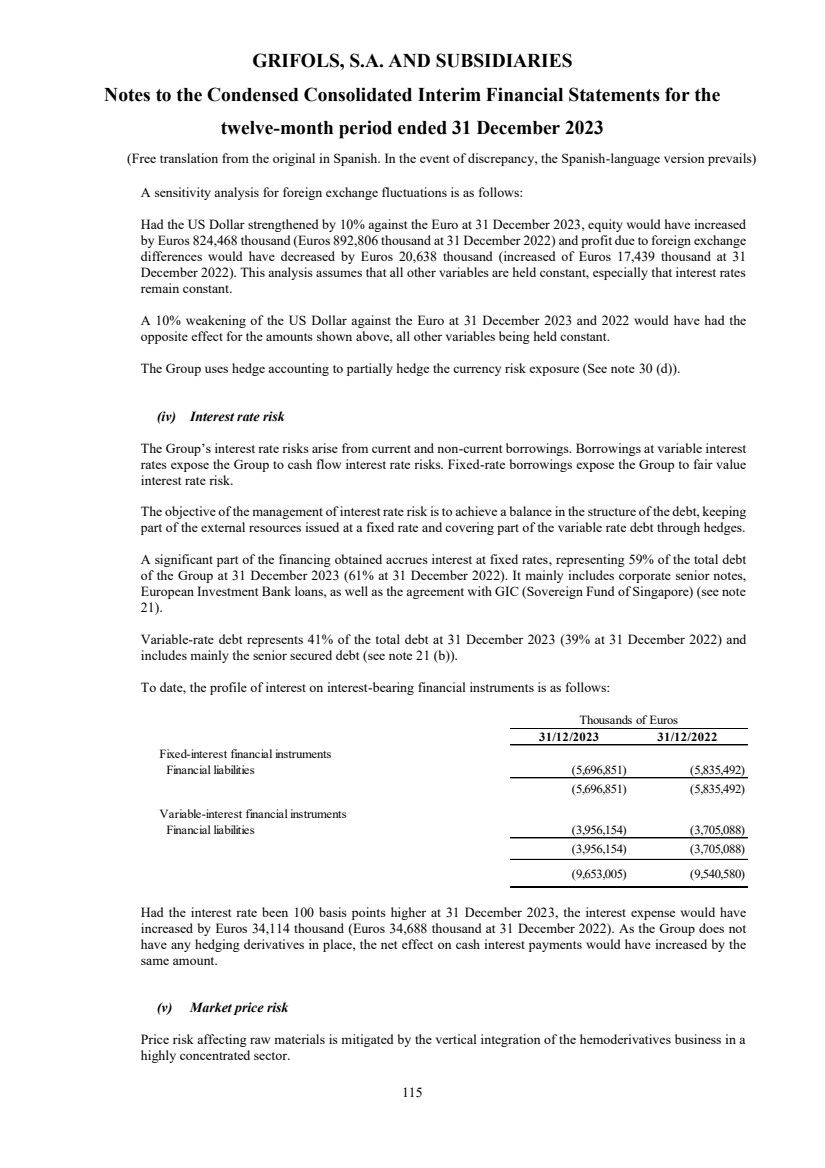
| GRIFOLS, S.A. AND SUBSIDIARIES
Notes to the Condensed Consolidated Interim Financial Statements for the
twelve-month period ended 31 December 2023
(Free translation from the original in Spanish. In the event of discrepancy, the Spanish-language version prevails)
115
A sensitivity analysis for foreign exchange fluctuations is as follows:
Had the US Dollar strengthened by 10% against the Euro at 31 December 2023, equity would have increased
by Euros 824,468 thousand (Euros 892,806 thousand at 31 December 2022) and profit due to foreign exchange
differences would have decreased by Euros 20,638 thousand (increased of Euros 17,439 thousand at 31
December 2022). This analysis assumes that all other variables are held constant, especially that interest rates
remain constant.
A 10% weakening of the US Dollar against the Euro at 31 December 2023 and 2022 would have had the
opposite effect for the amounts shown above, all other variables being held constant.
The Group uses hedge accounting to partially hedge the currency risk exposure (See note 30 (d)).
(iv) Interest rate risk
The Group’s interest rate risks arise from current and non-current borrowings. Borrowings at variable interest
rates expose the Group to cash flow interest rate risks. Fixed-rate borrowings expose the Group to fair value
interest rate risk.
The objective of the management of interest rate risk is to achieve a balance in the structure of the debt, keeping
part of the external resources issued at a fixed rate and covering part of the variable rate debt through hedges.
A significant part of the financing obtained accrues interest at fixed rates, representing 59% of the total debt
of the Group at 31 December 2023 (61% at 31 December 2022). It mainly includes corporate senior notes,
European Investment Bank loans, as well as the agreement with GIC (Sovereign Fund of Singapore) (see note
21).
Variable-rate debt represents 41% of the total debt at 31 December 2023 (39% at 31 December 2022) and
includes mainly the senior secured debt (see note 21 (b)).
To date, the profile of interest on interest-bearing financial instruments is as follows:
31/12/2023 31/12/2022
Fixed-interest financial instruments
Financial liabilities (5,696,851) (5,835,492)
(5,696,851) (5,835,492)
Variable-interest financial instruments
Financial liabilities (3,956,154) (3,705,088)
(3,956,154) (3,705,088)
(9,653,005) (9,540,580)
Thousands of Euros
Had the interest rate been 100 basis points higher at 31 December 2023, the interest expense would have
increased by Euros 34,114 thousand (Euros 34,688 thousand at 31 December 2022). As the Group does not
have any hedging derivatives in place, the net effect on cash interest payments would have increased by the
same amount.
(v) Market price risk
Price risk affecting raw materials is mitigated by the vertical integration of the hemoderivatives business in a
highly concentrated sector. |

| GRIFOLS, S.A. AND SUBSIDIARIES
Notes to the Condensed Consolidated Interim Financial Statements for the
twelve-month period ended 31 December 2023
(Free translation from the original in Spanish. In the event of discrepancy, the Spanish-language version prevails)
116
(d) Financial derivatives
At 31 December 2023 and 2022 the Group has recognized the following derivatives:
Financial derivatives Currency
Notional
amount at
31/12/2023
Notional
amount at
31/12/2022
Value at
31/12/23
Value at
31/12/22 Maturity
Cross currency interest rate swap US Dollar 500,000,000 500,000,000 20,538 35,296 15/10/2024
Cross currency interest rate swap US Dollar 205,000,000 205,000,000 (140) 3,216 15/10/2024
Foreign exchange rate forward Swiss Franc 10,000,000 5,500,000 378 71 05/02/2024
Foreign exchange rate forward Canadian dollar 32,666,667 4,416,667 450 165 2024
Foreign exchange rate forward Pound Sterling -- 27,100,000 -- 805 2023
Foreign exchange rate forward Czech crown 160,000,000 -- 191 -- 12/02/2024
Foreign exchange rate forward Mexican Peso 90,000,000 -- 193 -- 12/02/2024
Foreign exchange rate forward Turkish lira 87,834,511 -- 44 -- 31/01/2024
Foreign exchange rate forward US Dollar 7,700,000 23,720,000 92 104 2023
Foreign exchange rate forward Euro 40,000,000 160,000,000 1,412 2 2024
Energy PPA Euro / KwH -- -- 1,529 -- 31/12/2032
Total assets (note 11) 24,687 39,659
Cross currency interest rate swap US Dollar 205,000,000 205,000,000 (7,712) (3,990) 15/10/2024
Foreign exchange rate forward Canadian dollar 42,560,102 8,000,001 (2,081) (146) 05/01/2024
Foreign exchange rate forward US Dollar 2,000,000 60,000,000 (2) (600) 30/01/2023
Foreign exchange rate forward Czech crown 160,000,000 -- (13) -- 12/02/2024
Foreign exchange rate forward Pound Sterling 8,500,000 -- (122) -- 12/02/2024
Foreign exchange rate forward Japanese Yen 700,000,000 -- (214) -- 07/02/2024
Total liabilities (note 20) (10,144) (4,736)
Thousands of Euros
(i) Hedging derivative financial instruments
On 5 October 2021, the Group subscribed three cross currency interest-rate swaps with an aggregate value of US
Dollars 500 million to hedge part of the Euro equivalent value of the US Dollar unsecured notes issued in October
2021. It is a fixed-to-fixed USD/EUR cross currency swap with the following characteristics:
- The Group receives a loan of Euros 431.6 million at a nominal interest rate of 3.78%.
- The Group grants a US Dollars 500 million loan at a nominal interest rate of 4.75%.
On 28 June 2022, the Group subscribed one cross currency interest-rate swap of US Dollars 205 million to hedge
the remaining part of the Euro equivalent value of the US Dollar unsecured notes issued in October 2021. It is a
fixed-to-fixed USD/EUR cross currency swap with the following characteristics:
- The Group receives a Euros 194 million loan at a nominal interest rate of 3.1046%. |

| GRIFOLS, S.A. AND SUBSIDIARIES
Notes to the Condensed Consolidated Interim Financial Statements for the
twelve-month period ended 31 December 2023
(Free translation from the original in Spanish. In the event of discrepancy, the Spanish-language version prevails)
117
- The Group grants a US Dollars 205 million loan at a nominal interest rate of 4.75%.
The derivative complies with the criteria required for hedge accounting. See further details in notes 4 (i).
(ii) Derivative financial instruments at fair value through profit and loss
The Group has subscribed various foreign exchange forwards to partially hedge the foreign currency value of
intercompany loan. Since the Group chooses not to apply hedge accounting criteria, gains or losses resulting
from changes in the fair value of derivatives are taken directly to “Change in fair value of financial
instruments” in the consolidated statement of profit and loss. At 31 December 2023, the Group has recognized
a net finance cost of Euros 876 thousand (Euros 4,586 thousand of net finance cost at 31 December 2022).
(iii) Electricity derivative
At the beginning of 2023, the Company contracted a hedge on the variation of the price of electricity. This contract
has served in its entirety to cover the purchase price of electricity against potential market price increases. The
energy price hedging derivatives meet the requirements to apply hedge accounting, so the variations in the value of
this financial instrument are recorded (by the net amount of taxes) in equity.
The movement in derivative financial instruments is as follows:
31/12/2023 31/12/2022
Opening balance 34,923 4,431
Business combination -- (1,255)
Changes in fair value recognized in equity 1,914 (4,757)
Transfer to profit or loss 5,775 12,552
Transfer to profit or loss - translation differences (23,037) 32,954
Tax effect (84) 6,170
Collections / Payments (4,948) (15,172)
Closing balance 14,543 34,923
Thousands of Euros
(e) Capital management
The directors’ policy is to maintain a solid capital base in order to ensure investor, creditor and market
confidence and sustain future business development. The board of directors defines and proposes the level of
dividends paid to shareholders.
The capital structure is periodically reviewed through the preparation of strategic plans focused mainly on a
sequential improvement of EBITDA (Earnings before interest, tax, amortization and depreciation), generation
of operating cash and discipline in the allocation of capital; with the objective and commitment to reduce the
leverage ratio.
In accordance with the senior secured debt contract, the Group is subject to compliance with some covenants.
At 31 December 2023 and 2022, the Group complies with the covenants in the contract.
The credit rating of the Group is as follows: |

| GRIFOLS, S.A. AND SUBSIDIARIES
Notes to the Condensed Consolidated Interim Financial Statements for the
twelve-month period ended 31 December 2023
(Free translation from the original in Spanish. In the event of discrepancy, the Spanish-language version prevails)
118
January 2024 September 2023 March 2023 September 2022
Moody's Investors Corporate rating B2 B1
Senior secured debt Ba3 Ba3
Senior Unsecured debt Caa1 B3
Perspective Negative Negative
Standard & Poor's Corporate rating B+ B+
Senior secured debt BB- BB-Senior Unsecured debt B- B-Perspective Stable Stable
Fitch Ratings Corporate rating BB- BB-Senior secured debt BB+ BB+
Senior Unsecured debt B+ B+
Perspective Stable Stable
The Parent held Class A and B treasury stock equivalent to 1.23% of its capital at 31 December 2023 (1.33%
at 31 December 2022).
(31) Balances and Transactions with Related Parties
(a) Group balances with related parties
Details of balances with related parties at 31 December 2023 are as follows:
Carrying amount Reference Associates Joint ventures Key management personeel Other related parties Board of directors
Receivables 15 227,550 -- -- 5,609 --
Other financial assets 10 - 11 418 163,928 -- 101,217 --
Advanced payments 15 -- 15,943 -- -- --
Loans 11 -- -- -- 115,209 --
Guarantee deposits 11 -- -- -- 934 --
Total debtors 227,968 179,871 -- 222,969 --
Trade payables -- (2,306) -- -- --
Debts -- -- (4,117) (11,384) (3,924)
Total creditors -- (2,306) (4,117) (11,384) (3,924)
Total 227,968 177,565 (4,117) 211,585 (3,924)
Thousands of Euros |

| GRIFOLS, S.A. AND SUBSIDIARIES
Notes to the Condensed Consolidated Interim Financial Statements for the
twelve-month period ended 31 December 2023
(Free translation from the original in Spanish. In the event of discrepancy, the Spanish-language version prevails)
119
Details of balances with related parties at 31 December 2022, restated to be comparative with details of balances
with related parties for 2023, are as follows:
Carrying amount Reference Associates Joint ventures Key management personeel Other related parties Board of directors
Receivables 15 162,382 -- -- -- --
Current contract assets 15 3,880 -- -- -- --
Other financial assets 10 - 11 -- 124,132 -- 318,890 --
Advanced payments 15 -- 11,998 -- -- --
Loans 11 -- -- -- 96,537 --
Guarantee deposits 11 -- -- -- 934 --
Total debtors 166,262 136,130 -- 416,361 --
Trade payables (91) (22,961) -- -- --
Debts -- -- (2,781) (13,312) (3,852)
Total creditors (91) (22,961) (2,781) (13,312) (3,852)
Total 166,171 113,169 (2,781) 403,049 (3,852)
Thousands of Euros
The heading "Receivables" corresponding to associates includes outstanding balances from sales to associated
companies, mainly corresponding to Anhui Tonrol Pharmaceutical Co. (company of the Shanghai RAAS Blood
Products, Co. Ltd. Group) (Euros 205,537 thousand in 2023, Euros 153,120 thousand in 2022 and Euros 123,250
thousand in 2021). As of 31 December 2023, the balance of "Receivables" corresponding to other related parties
corresponds entirely to an amount pending collection from Mr. Víctor Grifols Roura. This balance has been settled
in January 2024.
The heading "Loans" mainly includes a loan signed by Scranton Plasma, BV. with the group on 28 December 2018
for an initial amount of US Dollars 95,000 thousand (Euros 86,969 thousand) (see note 11) related to the payment of
the sale of the shares of BPC Plasma, Inc. and Haema, AG (see note 2). As of 31 December 2023, the heading
includes an additional amount of Euros 15 million arranged during this twelve-month period under the same
conditions as the initial loan (see note 31 (b)).
The heading “Other financial assets” corresponding to joint ventures includes advanced payments corresponding to
the collaboration agreement with Biotek America, LLC (see note 11). Additionally, the balance corresponding to
other related parties corresponds to a cash-pooling financing agreement that BPC Plasma, Inc and Haema, AG have
with Scranton Plasma, BV with maturity in 2024 (see note 11).
The heading of "debts" includes an amount of Euros 16,696 thousand at 31 December 2023 (Euros 15,051 thousand
at 31 December 2022) corresponding to the balance of bearer promissory notes issued by the group company Instituto
Grifols, S.A. These promissory notes are due on 4 May 2024, and 2023, respectively, with a nominal value of Euros
3,000 each, and an annual nominal interest of 4% (3% in 2021). |
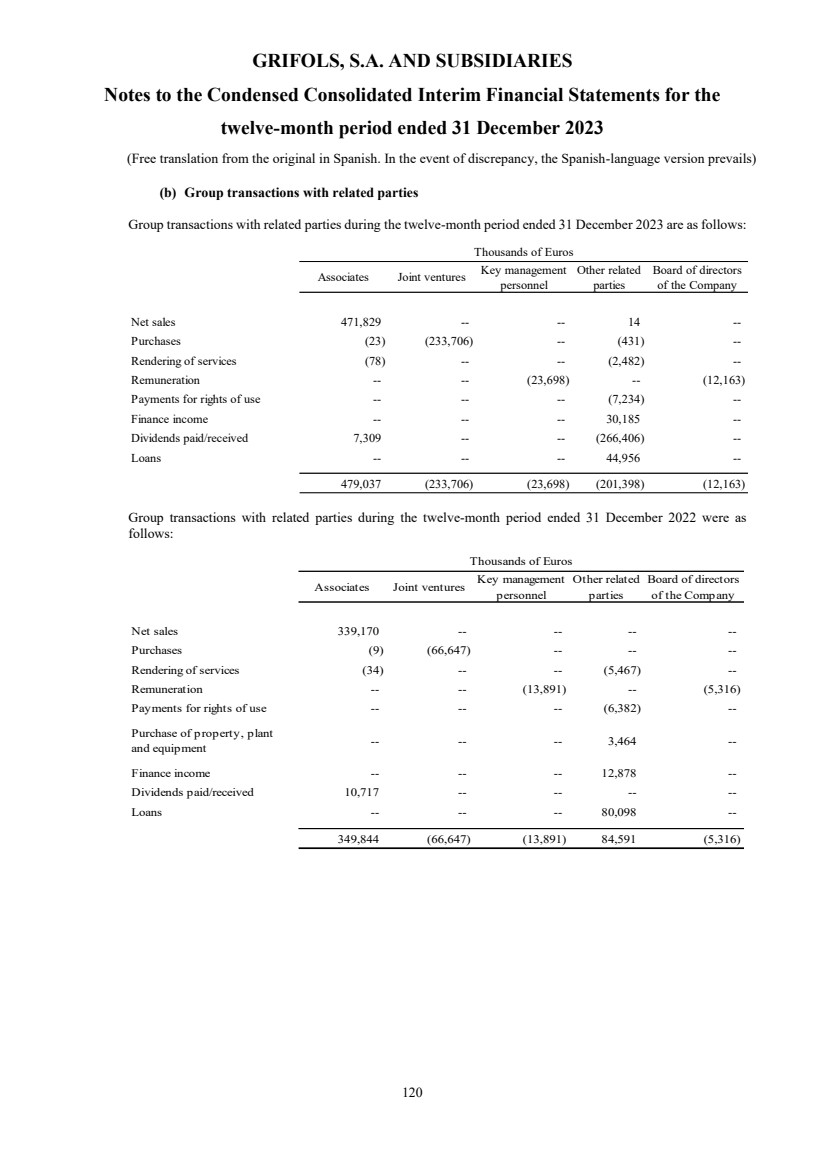
| GRIFOLS, S.A. AND SUBSIDIARIES
Notes to the Condensed Consolidated Interim Financial Statements for the
twelve-month period ended 31 December 2023
(Free translation from the original in Spanish. In the event of discrepancy, the Spanish-language version prevails)
120
(b) Group transactions with related parties
Group transactions with related parties during the twelve-month period ended 31 December 2023 are as follows:
Associates Joint ventures Key management
personnel
Other related
parties
Board of directors
of the Company
Net sales 471,829 -- -- 14 --
Purchases (23) (233,706) -- (431) --
Rendering of services (78) -- -- (2,482) --
Remuneration -- -- (23,698) -- (12,163)
Payments for rights of use -- -- -- (7,234) --
Finance income -- -- -- 30,185 --
Dividends paid/received 7,309 -- -- (266,406) --
Loans -- -- -- 44,956 --
479,037 (233,706) (23,698) (201,398) (12,163)
Thousands of Euros
Group transactions with related parties during the twelve-month period ended 31 December 2022 were as
follows:
Associates Joint ventures Key management
personnel
Other related
parties
Board of directors
of the Company
Net sales 339,170 -- -- -- --
Purchases (9) (66,647) -- -- --
Rendering of services (34) -- -- (5,467) --
Remuneration -- -- (13,891) -- (5,316)
Payments for rights of use -- -- -- (6,382) --
Purchase of property, plant
and equipment -- -- -- 3,464 --
Finance income -- -- -- 12,878 --
Dividends paid/received 10,717 -- -- -- --
Loans -- -- -- 80,098 --
349,844 (66,647) (13,891) 84,591 (5,316)
Thousands of Euros |
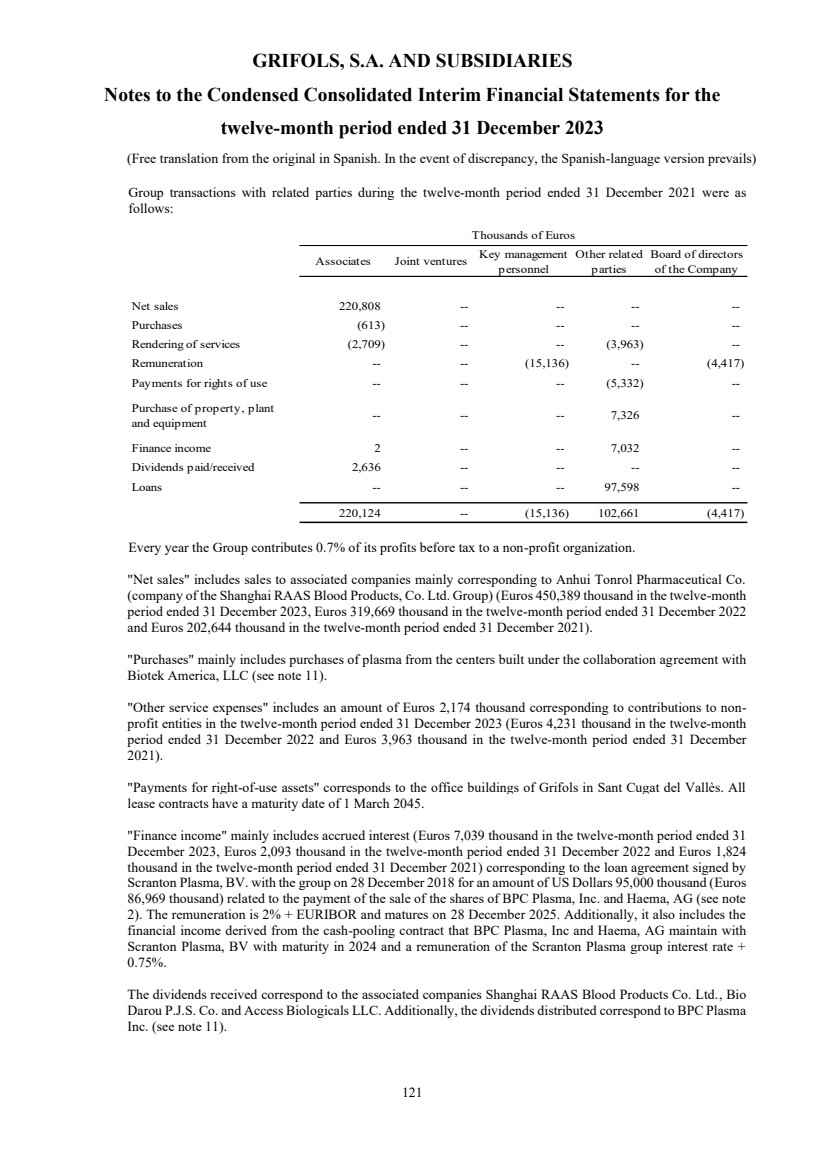
| GRIFOLS, S.A. AND SUBSIDIARIES
Notes to the Condensed Consolidated Interim Financial Statements for the
twelve-month period ended 31 December 2023
(Free translation from the original in Spanish. In the event of discrepancy, the Spanish-language version prevails)
121
Group transactions with related parties during the twelve-month period ended 31 December 2021 were as
follows:
Associates Joint ventures Key management
personnel
Other related
parties
Board of directors
of the Company
Net sales 220,808 -- -- -- --
Purchases (613) -- -- -- --
Rendering of services (2,709) -- -- (3,963) --
Remuneration -- -- (15,136) -- (4,417)
Payments for rights of use -- -- -- (5,332) --
Purchase of property, plant
and equipment -- -- -- 7,326 --
Finance income 2 -- -- 7,032 --
Dividends paid/received 2,636 -- -- -- --
Loans -- -- -- 97,598 --
220,124 -- (15,136) 102,661 (4,417)
Thousands of Euros
Every year the Group contributes 0.7% of its profits before tax to a non-profit organization.
"Net sales" includes sales to associated companies mainly corresponding to Anhui Tonrol Pharmaceutical Co.
(company of the Shanghai RAAS Blood Products, Co. Ltd. Group) (Euros 450,389 thousand in the twelve-month
period ended 31 December 2023, Euros 319,669 thousand in the twelve-month period ended 31 December 2022
and Euros 202,644 thousand in the twelve-month period ended 31 December 2021).
"Purchases" mainly includes purchases of plasma from the centers built under the collaboration agreement with
Biotek America, LLC (see note 11).
"Other service expenses" includes an amount of Euros 2,174 thousand corresponding to contributions to non-profit entities in the twelve-month period ended 31 December 2023 (Euros 4,231 thousand in the twelve-month
period ended 31 December 2022 and Euros 3,963 thousand in the twelve-month period ended 31 December
2021).
"Payments for right-of-use assets" corresponds to the office buildings of Grifols in Sant Cugat del Vallès. All
lease contracts have a maturity date of 1 March 2045.
"Finance income" mainly includes accrued interest (Euros 7,039 thousand in the twelve-month period ended 31
December 2023, Euros 2,093 thousand in the twelve-month period ended 31 December 2022 and Euros 1,824
thousand in the twelve-month period ended 31 December 2021) corresponding to the loan agreement signed by
Scranton Plasma, BV. with the group on 28 December 2018 for an amount of US Dollars 95,000 thousand (Euros
86,969 thousand) related to the payment of the sale of the shares of BPC Plasma, Inc. and Haema, AG (see note
2). The remuneration is 2% + EURIBOR and matures on 28 December 2025. Additionally, it also includes the
financial income derived from the cash-pooling contract that BPC Plasma, Inc and Haema, AG maintain with
Scranton Plasma, BV with maturity in 2024 and a remuneration of the Scranton Plasma group interest rate +
0.75%.
The dividends received correspond to the associated companies Shanghai RAAS Blood Products Co. Ltd., Bio
Darou P.J.S. Co. and Access Biologicals LLC. Additionally, the dividends distributed correspond to BPC Plasma
Inc. (see note 11). |
| GRIFOLS, S.A. AND SUBSIDIARIES
Notes to the Condensed Consolidated Interim Financial Statements for the
twelve-month period ended 31 December 2023
(Free translation from the original in Spanish. In the event of discrepancy, the Spanish-language version prevails)
122
"Loans" mainly includes the net amounts disbursed under the cash-pooling financing agreement that BPC
Plasma, Inc and Haema, AG have with Scranton Plasma, BV mentioned above.
Directors representing shareholders´ interests have received remuneration of Euros 965 thousand in the twelve-month period ended 31 December 2023 (Euros 965 thousand in the twelve-month period ended 31 December
2022).
The Group has not extended any advances or loans to the members of the board of directors or key management
personnel nor has it assumed any guarantee commitments on their behalf. It has also not assumed any pension
or life insurance obligations on behalf of former or current members of the board of directors or key management
personnel. In addition, certain Company directors and key management personnel have termination benefit
commitments (see note 29).
(c) Conflicts of interest concerning the directors
The Company’s directors and their related parties have not entered into any conflict of interest that should have
been reported in accordance with article 229 of the revised Spanish Companies Act.
(32) Environmental Information and Climate Change
The Group carries out operations whose main purpose is to prevent, reduce or minimize the potential impact of
its activities on the environment.
Grifols' environmental management is based on the concept of circular economy. Priority is given to the efficient
use of material resources, water and energy, and waste generation is reduced, taking into account the different
stages of the life cycle of products and services. This strategy integrates the transition towards a low-carbon
economy which minimizes the impact on climate change.
Grifols has a climate risk map through which it has analyzed the resilience of its strategy based on a climate
scenario of a potential maximum rise of 2ºC, following the recommendations of the TCFD. The result of this
analysis has enabled Grifols to assess the financial impact of the most significant risks:
• Reduction in the availability of water resources: Grifols has facilities in areas where, under the simulated
scenario, there could be a reduction in the availability of water resources, causing supply problems with
impacts that include an increase in the price of water and production restrictions at industrial facilities. This
risk can translate into increased costs associated with obtaining own water resources (well water), cleaning
and proper maintenance or use of water-dependent infrastructures and industrial processes.
The possible financial impact has taken into account the possibility of production stoppage and the increase
in the price per m3 of water in areas with a negative price elasticity of demand. The financial impact is
estimated to result in an non-relevant increase in expenditure.
The results of the exposure analysis indicate that the plants that may be most exposed to this risk are those
located in Barcelona and Los Angeles (USA). For each, Grifols' management of the risk varies. In Los
Angeles, Grifols would have the capacity to transfer production to other plants in the group, while in
Barcelona, the company has several connections to the mains water supply and also has well water
extraction. Moreover, as in Los Angeles, a possible temporary stoppage of production (5 to 20 days) could
be made up for by transferring production to other plants. The costs of transporting the plasma and other
intermediate pastes, 50% to the Clayton plant and 50% to the Barcelona plant, would not be relevant.
• New legal requirements regarding the reduction of GHG emissions: Grifols is committed to reducing
its direct carbon emissions (Scope 1 and 2) by 2050. Additionally, Grifols has committed to establishing |
| GRIFOLS, S.A. AND SUBSIDIARIES
Notes to the Condensed Consolidated Interim Financial Statements for the
twelve-month period ended 31 December 2023
(Free translation from the original in Spanish. In the event of discrepancy, the Spanish-language version prevails)
123
science-based decarbonization targets (SBTs) with a 2030 horizon in accordance with the methodology
proposed by the Science Based Targets Initiative (SBTi). Until then, new requirements could be established
to reduce GHG emissions that would require greater investments for the reduction of emissions through the
installation of renewable generation technologies or changes in electricity supplies for electricity from
renewable sources, among others.
In the event of not being able to make such investments, Grifols expects to invest further in carbon credits
to offset its carbon footprint. The projected potential financial impact to 2040 from carbon footprint
reduction under current targets, would have to be assumed by the Group.
The Environmental Program includes the reduction of emissions through the use of renewable electricity
through PPAs (Power Purchasing Agreements), the construction of renewable energy generation plants in
Spain and Germany and the implementation of energy efficiency measures (among others).
Grifols will update this program starting in 2026 to include more ambitious reduction targets if necessary.
Exposure to this risk is expected to decrease as Grifols meets the established targets.
• Variation in the availability of plasma resources: According to the sixth IPCC report, anthropogenic
climate change would contribute to extreme precipitation, which could become more frequent in most
regions due to global warming.
The regions most vulnerable to these types of events which could have an impact on Grifols are the states
of Texas and North Carolina, USA. The potential impact of restrictions on access to factories - with a
temporary shutdown of production - and laboratories could be offset by transferring plasma to other
facilities. However, plasma donation centers could suffer alterations in the plasma collection processes, as
a consequence of the difficulties that donors could have in accessing them.
The financial impact of reduced plasma collection in the donation centers most exposed to extreme weather
events is estimated not to be relevant considering the global centre network.
The results of the exposure analysis indicate that plasma centers may be the most exposed to this risk.
However, the fact that they are widely spread over several regions allows dilution of any potential impact.
The analysis was conducted taking into account the centers most exposed to an increase in the severity of
weather events such as hurricanes and tropical storms. In the worst-case scenario of centre closures,
production would not be substantially affected, so the impact would be limited to the temporary
unavailability of plasma in the directly affected centers, resulting in reduced availability of plasma drugs.
• Transition to low-emission technologies: In the geographical areas in which Grifols operates, meeting the
2030 decarbonization targets is based on the principles of technological neutrality and cost-efficiency,
requiring high investments in innovation and infrastructure. Of particular note are the major investments
associated with the installation of air conditioning, boiler and renewable energy generation technologies
aimed at reducing Grifols' emissions and increasing energy efficiency. The technologies present in the
production plants which contribute most to the carbon footprint are boilers, which use fossil fuels in their
operation, and their potential impact is their replacement with low-emission options.
With the aim of replacing the most polluting technologies, Grifols regularly analyses the technological
options available on the market, with a special focus on technologies that increase its climate resilience.
Currently, there is no consensus on a single technology that can generate the heat needed on an industrial
scale without using fossil fuels. Grifols is aware that renewable hydrogen could be a valuable energy vector
for end uses, being an alternative for obtaining good yields at a reasonable cost. At present, the use of
renewable hydrogen is in its infancy, although Grifols is monitoring its development in order to study its
viability in the near future. |

| GRIFOLS, S.A. AND SUBSIDIARIES
Notes to the Condensed Consolidated Interim Financial Statements for the
twelve-month period ended 31 December 2023
(Free translation from the original in Spanish. In the event of discrepancy, the Spanish-language version prevails)
124
In the simulated scenario, Grifols recognizes that in order to manage this risk in its entirety, the replacement
of boilers must be carried out progressively and will depend on the progress and availability of these
technologies on the market. It also takes into account heat generation processes using electrical technologies
such as thermocompression.
The investment in environmental assets during the twelve-month period ended 31 December 2023 is Euros 5,774
thousand (Euros 8,372 thousand in the twelve-month period ended 31 December 2022 and Euros 7,363 thousand
in the twelve-month period ended 31 December 2021), mainly intended to optimize water consumption,
improvements in wastewater treatment, eco-efficiency projects in the use of energy and the replacement of
refrigerant gases with others with a lower environmental impact.
The expenses incurred by the Group for the protection and improvement of the environment in the twelve-month
period ended 31 December 2023 amounted to approximately Euros 29,628 thousand (Euros 25,787, thousand in
the twelve-month period ended 31 December 2022 and Euros 20,642 thousand in the twelve-month period ended
31 December 2021).
With the procedures currently in place, the Group considers that environmental risks are adequately controlled.
The Group's strategy is aligned with the objectives of the Paris Agreement and has been considered in the
evaluation of the useful lives of assets and in the impairment analysis of non-financial assets. The Group does
not anticipate impairment of assets before the established amortization periods.
The Group has not received any environmental subsidies during the twelve-month periods ended 31 December
2023, 2022 and 2021.
(33) Other Information
Audit fees:
KPMG Auditores, S.L. has invoiced the following fees for professional services during the twelve-month periods
ended 31 December 2023 and 2022:
31/12/2023 31/12/2022
Audit services 1,832 1,778
Other assurance services 571 560
2,403 2,338
Thousands of Euros
Amounts included in the table above, include the total amount of fees related to services incurred during the
twelve-month periods ended 31 December 2023 and 2022 without considering the invoice date.
Other assurance services include limited reviews of the interim financial statements, the audit of the financial
statements under PCAOB, as well as conducting audits under AICPA.
Other entities affiliated to KPMG International have invoiced the Group for the following fees for professional
services during the twelve-month periods ended 31 December 2023 and 2022: |

| GRIFOLS, S.A. AND SUBSIDIARIES
Notes to the Condensed Consolidated Interim Financial Statements for the
twelve-month period ended 31 December 2023
(Free translation from the original in Spanish. In the event of discrepancy, the Spanish-language version prevails)
125 31/12/2023 31/12/2022
Audit services 3,779 4,115
Other assurance services 1,380 1,013
Tax advisory services 4 3
Other services 127 206
5,290 5,337
Thousands of Euros
Additionally, other audit firms have invoiced the Group for the following fees for professional services during
the twelve-month periods ended 31 December 2023 and 2022:
31/12/2023 31/12/2022
Audit services 229 84
229 84
Thousands of Euros
(34) Subsequent events
On 9 January 2024, a short seller investor issued a report based on speculation and false information regarding Grifols’
accounting and financial information. Although the company’s fundamentals remain sound and unchanged and all
financial information was duly reported in the audited financial statements, this action had a significant impact on Grifols’
share price and corporate reputation.
The company is currently working to restore the confidence of markets, shareholders and other stakeholders in three key
areas:
- Communication and collaboration with the Spanish regulator (CNMV).
- Transparent communication with all our stakeholders: sharing our clear response to the published report
through live conference calls and multiple official communications on the company’s website and on the
CNMV portal. All press releases are publicly available on Grifols’ website
- Clear and transparent communication with our teams and employee representatives, including major unions.
- Reinforced communication with investors, official communications, direct phone calls, video calls and e-mails.
- The company filed a complaint in the United States District Court for the Southern District of New York
against Daniel Yu, Gotham City Research LLC, General Industrial Partners LLP, Cyrus de Weck, and their
affiliates to claim for the financial and reputational damages caused to Grifols and their stakeholders as a
result of the defendants’ actions.
- The company established a dedicated working group comprising senior managers from the legal,
communications, finance, investor relations and management teams, together with external advisors with
expertise in communications. |
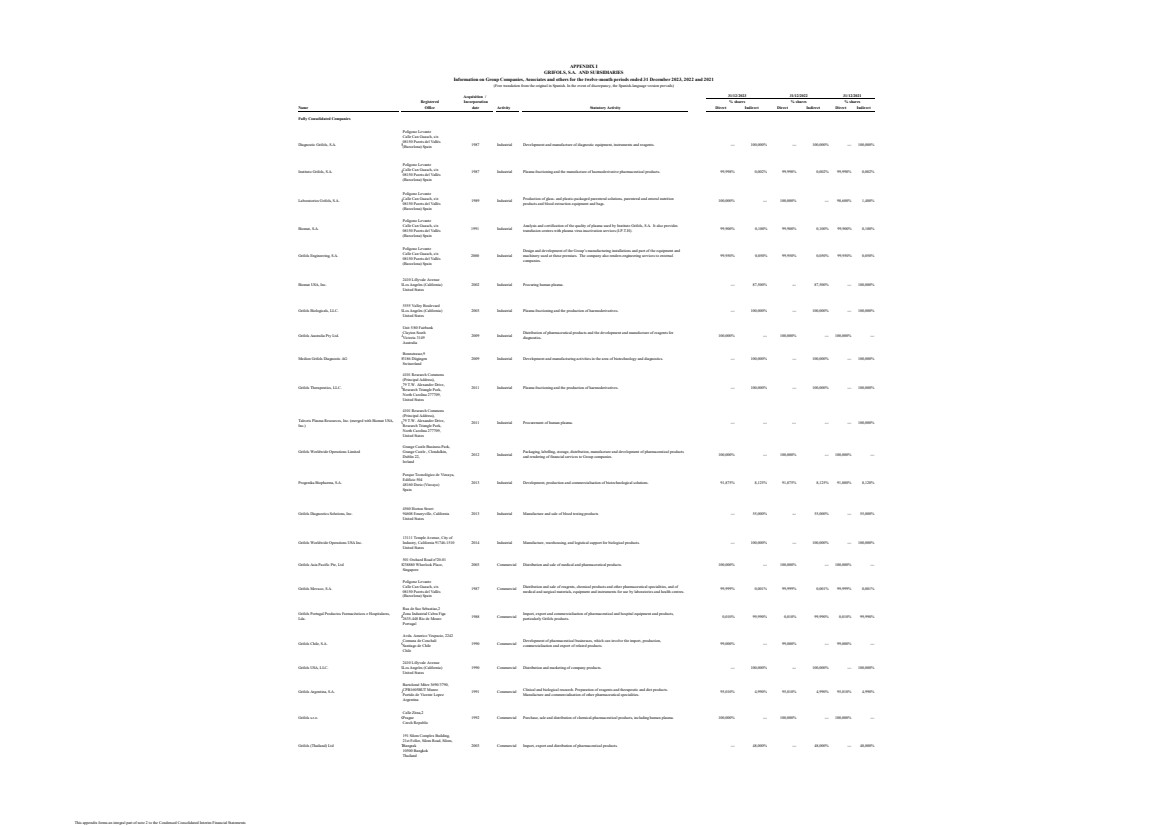
| Acquisition /
Registered Incorporation
Name Office date Activity Statutory Activity Direct Indirect Direct Indirect Direct Indirect
Diagnostic Grifols, S.A. S 1987 Industrial Development and manufacture of diagnostic equipment, instruments and reagents. --- 100,000% --- 100,000% --- 100,000%
Instituto Grifols, S.A. S
Polígono Levante
Calle Can Guasch, s/n
08150 Parets del Vallès
(Barcelona) Spain
1987 Industrial Plasma fractioning and the manufacture of haemoderivative pharmaceutical products. 99,998% 0,002% 99,998% 0,002% 99,998% 0,002%
Laboratorios Grifols, S.A. S
Polígono Levante
Calle Can Guasch, s/n
08150 Parets del Vallès
(Barcelona) Spain
1989 Industrial Production of glass- and plastic-packaged parenteral solutions, parenteral and enteral nutrition products and blood extraction equipment and bags. 100,000% --- 100,000% --- 98,600% 1,400%
Biomat, S.A.
Polígono Levante
Calle Can Guasch, s/n
08150 Parets del Vallès
(Barcelona) Spain
1991 Industrial Analysis and certification of the quality of plasma used by Instituto Grifols, S.A. It also provides transfusion centres with plasma virus inactivation services (I.P.T.H). 99,900% 0,100% 99,900% 0,100% 99,900% 0,100%
Grifols Engineering, S.A.
Polígono Levante
Calle Can Guasch, s/n
08150 Parets del Vallès
(Barcelona) Spain
2000 Industrial
Design and development of the Group’s manufacturing installations and part of the equipment and
machinery used at these premises. The company also renders engineering services to external
companies.
99,950% 0,050% 99,950% 0,050% 99,950% 0,050%
Biomat USA, Inc. U
2410 Lillyvale Avenue
Los Angeles (California)
United States
2002 Industrial Procuring human plasma. --- 87,500% --- 87,500% --- 100,000%
Grifols Biologicals, LLC. U
5555 Valley Boulevard
Los Angeles (California)
United States
2003 Industrial Plasma fractioning and the production of haemoderivatives. --- 100,000% --- 100,000% --- 100,000%
Grifols Australia Pty Ltd. A
Unit 5/80 Fairbank
Clayton South
Victoria 3149
Australia
2009 Industrial Distribution of pharmaceutical products and the development and manufacture of reagents for diagnostics. 100,000% --- 100,000% --- 100,000% ---
Medion Grifols Diagnostic AG S
Bonnstrasse,9
3186 Dügingen
Switzerland
2009 Industrial Development and manufacturing activities in the area of biotechnology and diagnostics. --- 100,000% --- 100,000% --- 100,000%
Grifols Therapeutics, LLC. U
4101 Research Commons
(Principal Address),
79 T.W. Alexander Drive,
Research Triangle Park,
North Carolina 277709,
United States
2011 Industrial Plasma fractioning and the production of haemoderivatives. --- 100,000% --- 100,000% --- 100,000%
Talecris Plasma Resources, Inc. (merged with Biomat USA,
Inc.) U
4101 Research Commons
(Principal Address),
79 T.W. Alexander Drive,
Research Triangle Park,
North Carolina 277709,
United States
2011 Industrial Procurement of human plasma. --- --- --- --- --- 100,000%
Grifols Worldwide Operations Limited
Grange Castle Business Park,
Grange Castle , Clondalkin,
Dublin 22,
Ireland
2012 Industrial Packaging, labelling, storage, distribution, manufacture and development of pharmaceutical products and rendering of financial services to Group companies. 100,000% --- 100,000% --- 100,000% ---
Progenika Biopharma, S.A.
Parque Tecnológico de Vizcaya,
Edificio 504
48160 Derio (Vizcaya)
Spain
2013 Industrial Development, production and commercialisation of biotechnological solutions. 91,875% 8,125% 91,875% 8,125% 91,880% 8,120%
Grifols Diagnostics Solutions, Inc.
4560 Horton Street
94608 Emeryville, California
United States
2013 Industrial Manufacture and sale of blood testing products --- 55,000% --- 55,000% --- 55,000%
Grifols Worldwide Operations USA Inc.
13111 Temple Avenue, City of
Industry, California 91746-1510
United States
2014 Industrial Manufacture, warehousing, and logistical support for biological products. --- 100,000% --- 100,000% --- 100,000%
Grifols Asia Pacific Pte, Ltd S
501 Orchard Road nº20-01
238880 Wheelock Place,
Singapore
2003 Commercial Distribution and sale of medical and pharmaceutical products. 100,000% --- 100,000% --- 100,000% ---
Grifols Movaco, S.A.
Polígono Levante
Calle Can Guasch, s/n
08150 Parets del Vallès
(Barcelona) Spain
1987 Commercial Distribution and sale of reagents, chemical products and other pharmaceutical specialities, and of medical and surgical materials, equipment and instruments for use by laboratories and health centres. 99,999% 0,001% 99,999% 0,001% 99,999% 0,001%
Grifols Portugal Productos Farmacéuticos e Hospitalares,
Lda. P
Rua de Sao Sebastiao,2
Zona Industrial Cabra Figa
2635-448 Rio de Mouro
Portugal
1988 Commercial Import, export and commercialisation of pharmaceutical and hospital equipment and products, particularly Grifols products. 0,010% 99,990% 0,010% 99,990% 0,010% 99,990%
Grifols Chile, S.A. C
Avda. Americo Vespucio, 2242
Comuna de Conchali
Santiago de Chile
Chile
1990 Commercial Development of pharmaceutical businesses, which can involve the import, production, commercialisation and export of related products. 99,000% --- 99,000% --- 99,000% ---
Grifols USA, LLC. U
2410 Lillyvale Avenue
Los Angeles (California)
United States
1990 Commercial Distribution and marketing of company products. --- 100,000% --- 100,000% --- 100,000%
Grifols Argentina, S.A. A
Bartolomé Mitre 3690/3790,
CPB1605BUT Munro
Partido de Vicente Lopez
Argentina
1991 Commercial Clinical and biological research. Preparation of reagents and therapeutic and diet products. Manufacture and commercialisation of other pharmaceutical specialities. 95,010% 4,990% 95,010% 4,990% 95,010% 4,990%
Grifols s.r.o. C
Calle Zitna,2
Prague
Czech Republic
1992 Commercial Purchase, sale and distribution of chemical-pharmaceutical products, including human plasma. 100,000% --- 100,000% --- 100,000% ---
Grifols (Thailand) Ltd T
191 Silom Complex Building,
21st Follor, Silom Road, Silom,
Bangrak
10500 Bangkok
Thailand
2003 Commercial Import, export and distribution of pharmaceutical products. --- 48,000% --- 48,000% --- 48,000%
APPENDIX I
GRIFOLS, S.A. AND SUBSIDIARIES
Information on Group Companies, Associates and others for the twelve-month periods ended 31 December 2023, 2022 and 2021
(Free translation from the original in Spanish. In the event of discrepancy, the Spanish-language version prevails)
Polígono Levante
Calle Can Guasch, s/n
08150 Parets del Vallès
(Barcelona) Spain
Fully Consolidated Companies
31/12/2021
% shares
31/12/2022
% shares
31/12/2023
% shares
This appendix forms an integral part of note 2 to the Condensed Consolidated Interim Financial Statements |
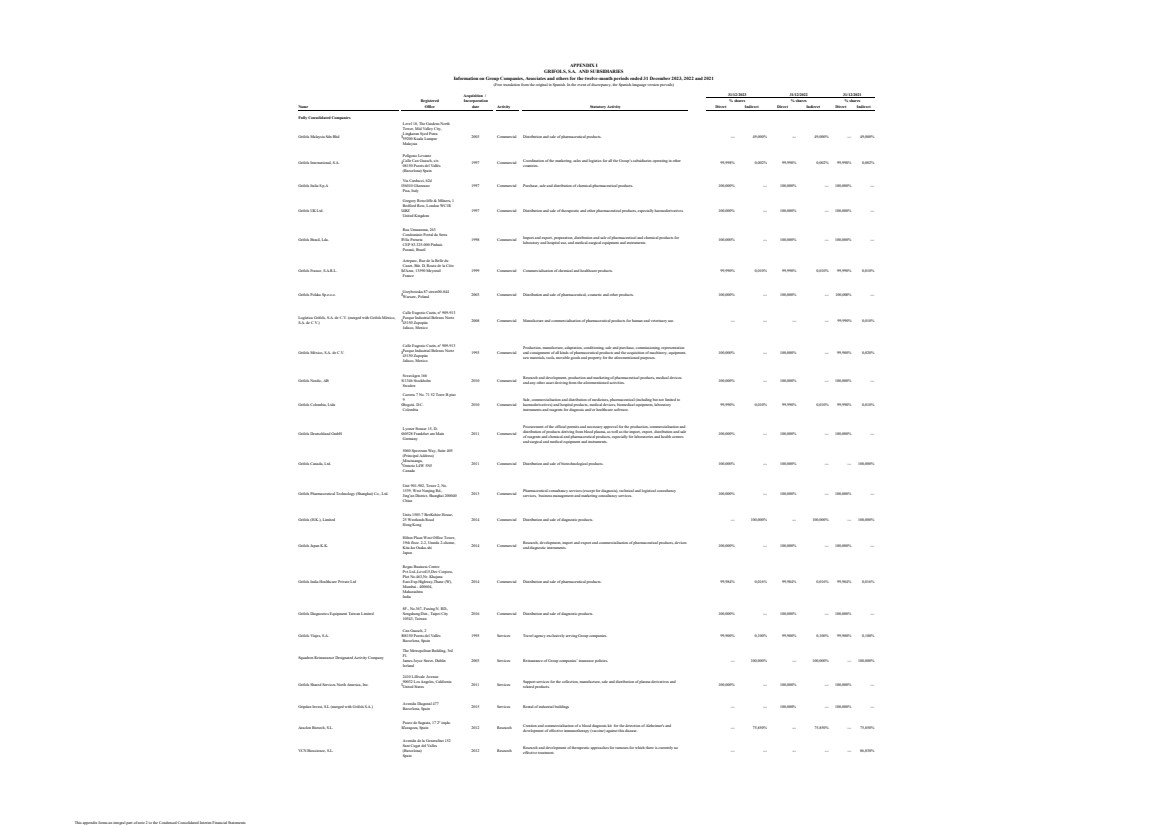
| Acquisition /
Registered Incorporation
Name Office date Activity Statutory Activity Direct Indirect Direct Indirect Direct Indirect
APPENDIX I
GRIFOLS, S.A. AND SUBSIDIARIES
Information on Group Companies, Associates and others for the twelve-month periods ended 31 December 2023, 2022 and 2021
(Free translation from the original in Spanish. In the event of discrepancy, the Spanish-language version prevails)
Fully Consolidated Companies
31/12/2021
% shares
31/12/2022
% shares
31/12/2023
% shares
Grifols Malaysia Sdn Bhd M
Level 18, The Gardens North
Tower, Mid Valley City,
Lingkaran Syed Putra
59200 Kuala Lumpur
Malaysia
2003 Commercial Distribution and sale of pharmaceutical products. --- 49,000% --- 49,000% --- 49,000%
Grifols International, S.A. S
Polígono Levante
Calle Can Guasch, s/n
08150 Parets del Vallès
(Barcelona) Spain
1997 Commercial Coordination of the marketing, sales and logistics for all the Group’s subsidiaries operating in other countries. 99,998% 0,002% 99,998% 0,002% 99,998% 0,002%
Grifols Italia S.p.A I
Via Carducci, 62d
56010 Ghezzano
Pisa, Italy
1997 Commercial Purchase, sale and distribution of chemical-pharmaceutical products. 100,000% --- 100,000% --- 100,000% ---
Grifols UK Ltd. U
Gregory Rowcliffe & Milners, 1
Bedford Row, London WC1R
4BZ
United Kingdom
1997 Commercial Distribution and sale of therapeutic and other pharmaceutical products, especially haemoderivatives. 100,000% --- 100,000% --- 100,000% ---
Grifols Brasil, Lda. B
Rua Umuarama, 263
Condominio Portal da Serra
Vila Perneta
CEP 83.325-000 Pinhais
Paraná, Brazil
1998 Commercial Import and export, preparation, distribution and sale of pharmaceutical and chemical products for laboratory and hospital use, and medical-surgical equipment and instruments. 100,000% --- 100,000% --- 100,000% ---
Grifols France, S.A.R.L. F
Arteparc, Rue de la Belle du
Canet, Bât. D, Route de la Côte
d'Azur, 13590 Meyreuil
France
1999 Commercial Commercialisation of chemical and healthcare products. 99,990% 0,010% 99,990% 0,010% 99,990% 0,010%
Grifols Polska Sp.z.o.o. PGrzybowska 87 street00-844 Warsaw, Poland 2003 Commercial Distribution and sale of pharmaceutical, cosmetic and other products. 100,000% --- 100,000% --- 100,000% ---
Logística Grifols, S.A. de C.V. (merged with Grifols México,
S.A. de C.V.) M
Calle Eugenio Cuzin, nº 909-913
Parque Industrial Belenes Norte
45150 Zapopán
Jalisco, Mexico
2008 Commercial Manufacture and commercialisation of pharmaceutical products for human and veterinary use. --- --- --- --- 99,990% 0,010%
Grifols México, S.A. de C.V. M
Calle Eugenio Cuzin, nº 909-913
Parque Industrial Belenes Norte
45150 Zapopán
Jalisco, Mexico
1993 Commercial
Production, manufacture, adaptation, conditioning, sale and purchase, commissioning, representation
and consignment of all kinds of pharmaceutical products and the acquisition of machinery, equipment,
raw materials, tools, movable goods and property for the aforementioned purposes.
100,000% --- 100,000% --- 99,980% 0,020%
Grifols Nordic, AB S
Sveavägen 166
11346 Stockholm
Sweden
2010 Commercial Research and development, production and marketing of pharmaceutical products, medical devices and any other asset deriving from the aforementioned activities. 100,000% --- 100,000% --- 100,000% ---
Grifols Colombia, Ltda C
Carrera 7 No. 71 52 Torre B piso
9
Bogotá. D.C.
Colombia
2010 Commercial
Sale, commercialisation and distribution of medicines, pharmaceutical (including but not limited to
haemoderivatives) and hospital products, medical devices, biomedical equipment, laboratory
instruments and reagents for diagnosis and/or healthcare software.
99,990% 0,010% 99,990% 0,010% 99,990% 0,010%
Grifols Deutschland GmbH G
Lyoner Strasse 15, D-60528 Frankfurt am Main
Germany
2011 Commercial
Procurement of the official permits and necessary approval for the production, commercialisation and
distribution of products deriving from blood plasma, as well as the import, export, distribution and sale
of reagents and chemical and pharmaceutical products, especially for laboratories and health centres
and surgical and medical equipment and instruments.
100,000% --- 100,000% --- 100,000% ---
Grifols Canada, Ltd. C
5060 Spectrum Way, Suite 405
(Principal Address)
Mississauga,
Ontario L4W 5N5
Canada
2011 Commercial Distribution and sale of biotechnological products. 100,000% --- 100,000% --- --- 100,000%
Grifols Pharmaceutical Technology (Shanghai) Co., Ltd.
Unit 901-902, Tower 2, No.
1539, West Nanjing Rd.,
Jing’an District, Shanghai 200040
China
2013 Commercial Pharmaceutical consultancy services (except for diagnosis), technical and logistical consultancy services, business management and marketing consultancy services. 100,000% --- 100,000% --- 100,000% ---
Grifols (H.K.), Limited
Units 1505-7 BerKshire House,
25 Westlands Road
Hong Kong
2014 Commercial Distribution and sale of diagnostic products. --- 100,000% --- 100,000% --- 100,000%
Grifols Japan K.K.
Hilton Plaza West Office Tower,
19th floor. 2-2, Umeda 2-chome,
Kita-ku Osaka-shi
Japan
2014 Commercial Research, development, import and export and commercialisation of pharmaceutical products, devices and diagnostic instruments. 100,000% --- 100,000% --- 100,000% ---
Grifols India Healthcare Private Ltd
Regus Business Centre
Pvt.Ltd.,Level15,Dev Corpora,
Plot No.463,Nr. Khajana
East.Exp.Highway,Thane (W),
Mumbai - 400604,
Maharashtra
India
2014 Commercial Distribution and sale of pharmaceutical products. 99,984% 0,016% 99,984% 0,016% 99,984% 0,016%
Grifols Diagnostics Equipment Taiwan Limited
8F., No.367, Fuxing N. RD.,
Songshang Dist., Taipei City
10543, Taiwan
2016 Commercial Distribution and sale of diagnostic products. 100,000% --- 100,000% --- 100,000% ---
Grifols Viajes, S.A. S
Can Guasch, 2
08150 Parets del Vallès
Barcelona, Spain
1995 Services Travel agency exclusively serving Group companies. 99,900% 0,100% 99,900% 0,100% 99,900% 0,100%
Squadron Reinsurance Designated Activity Company
The Metropolitan Building, 3rd
Fl.
James Joyce Street, Dublin
Ireland
2003 Services Reinsurance of Group companies’ insurance policies. --- 100,000% --- 100,000% --- 100,000%
Grifols Shared Services North America, Inc. U
2410 Lillivale Avenue
90032 Los Angeles, California
United States 2011 Services Support services for the collection, manufacture, sale and distribution of plasma derivatives and related products. 100,000% --- 100,000% --- 100,000% ---
Gripdan Invest, S.L (merged with Grifols S.A.) Avenida Diagonal 477 Barcelona, Spain 2015 Services Rental of industrial buildings --- --- 100,000% --- 100,000% ---
Araclon Biotech, S.L. S
Paseo de Sagasta, 17 2º izqda.
Zaragoza, Spain 2012 Research Creation and commercialisation of a blood diagnosis kit for the detection of Alzheimer's and development of effective immunotherapy (vaccine) against this disease. --- 75,850% --- 75,850% --- 75,850%
VCN Bioscience, S.L.
Avenida de la Generalitat 152
Sant Cugat del Valles
(Barcelona)
Spain
2012 Research Research and development of therapeutic approaches for tumours for which there is currently no effective treatment. --- --- --- --- --- 86,830%
This appendix forms an integral part of note 2 to the Condensed Consolidated Interim Financial Statements |

| Acquisition /
Registered Incorporation
Name Office date Activity Statutory Activity Direct Indirect Direct Indirect Direct Indirect
APPENDIX I
GRIFOLS, S.A. AND SUBSIDIARIES
Information on Group Companies, Associates and others for the twelve-month periods ended 31 December 2023, 2022 and 2021
(Free translation from the original in Spanish. In the event of discrepancy, the Spanish-language version prevails)
Fully Consolidated Companies
31/12/2021
% shares
31/12/2022
% shares
31/12/2023
% shares
Grifols Innovation and New Technologies Limited
Grange Castle Business Park,
Grange Castle , Clondalkin,
Dublin 22,
Ireland
2016 Research Biotechnology research and development --- 100,000% --- 100,000% --- 100,000%
Kiro Grifols S.L SPolígono Bainuetxe, 5, 2º planta, Aretxabaleta, Guipúzcoa
Spain
2014 Research Development of machines and equipment to automate and control key points of hospital processes, and hospital pharmacy processes. 100,000% --- 90,000% --- 90,000% ---
Chiquito Acquisition Corp. (merged with Grifols Bio Supplis Inc.)
2711 Centerville Road Suite 400,
Wilmington, Delaware, New
Castle County, United States
2017 Corporate Engage in any lawful act or activity for which a corporation may be organized under the General Corporation Law of the State of Delaware, as amended from time to time (the "DGCL"). --- --- --- 100,000% --- 100,000%
Aigües Minerals de Vilajuiga, S.A. CCarrer Sant Sebastià, 2, 17493 Vilajuïga, Girona, Spain 2017 # Industrial Collection and use of mineral-medicinal waters and obtaining of all necessary administrative concessions for the optimum and widest use of these. 99,990% 0,010% 99,990% 0,010% 99,990% 0,010%
Goetech LLC (D/B/A Medkeeper)
7600 Grandview Avenue, Suite 2
10, Arvada, CO 80002, United
States
2018 Industrial Development and distribution of web and mobile-based platforms for hospital pharmacies --- --- --- 100,000% --- 100,000%
Grifols Bio Supplies Inc. (before Interstate Blood Bank, Inc.)
5700 Pleasantville Road
Memphis, Tennessee
United States
2016 Industrial Procurement of human plasma. --- 100,000% --- 100,000% --- 100,000%
Haema, AG LandsteinerstraBe 1, 04103 Leipzig - Germany 2018 Industrial Procurement of human plasma. --- --- --- --- --- ---
BPC Plasma, Inc (formerly Biotest Pharma Corp) 901 Yamato Rd., Suite 101, Boca Raton FL 33431 - United States 2018 Industrial Procurement of human plasma. --- --- --- --- --- ---
Haema Plasma Kft. Bajcsy-Zsilinszky út 12., 1051 Budapest (Hungría) 2021 Industrial Procurement of human plasma. --- --- --- --- --- ---
Alkahest, Inc.
3500 South DuPont Hwy,
Dover, County of Kent
United States
2015 Research Development of novel plasma-based products for the treatment of cognitive decline in aging and disorders of the central nervous system (CNS). --- 100,000% --- 100,000% --- 100,000%
Plasmavita Healthcare GmbH Colmarer Strasse 22, 60528 Frankfurt am Main - Germany 2018 Industrial Procurement of human plasma. --- 50,000% --- 50,000% --- 50,000%
Plasmavita Healthcare II GmbH Garnisongasse 4/12, 1090 Vienna, Austria 2019 Industrial Procurement of human plasma. --- 50,000% --- 50,000% --- 50,000%
Grifols Canada Therapeutics Inc. (formerly Green Cross
Biotherapeutics; Inc)
2911 Avenue Marie Curie,
Arrondissement de Saint-Laurent, Quebec
Canada
2020 Industrial Conducting business in Pharmceuticals and Medicines Industry 0,020% 99,980% 0,020% 99,980% 100,000% ---
Grifols Laboratory Solutions, Inc
Corporation Trust Center, 1209,
Orange Street, Wilmington, New
Castle Country, Delaware, 19801
United States
2020 Services Engage in any lawful act or activity for which corporations may be organized under the General Corporation Law of Delaware --- 100,000% --- 100,000% --- 100,000%
Grifols Korea Co., Ltd.
302 Teheran-ro, Gangnam-gu,
Seoul (Yeoksam-dong)
Korea
2020 Commercial Import, export of diagnostic in vitro products and solutions. 100,000% --- 100,000% --- 100,000% ---
Grifols Middle East & Africa LLC
Office No. 534, 5th floor,
NamaaBuilding No.155, Ramses
Extension Street, Al Hay Al
Sades, Nasr City, Cairo
Egypt
2021 Services Providing consultation (except for those stipulated in Article 27 of the Capital Market Law and its executive regulations) and carry out those commercial activities that are permitted by the law. 99,990% 0,010% 99,990% 0,010% 99,990% 0,010%
GigaGen Inc.
407 Cabot Road
South San Francisco, CA 94080,
United States
2017 Industrial Engage in any lawful act or activity for which corporations may be organized under General Corporation Law. --- 100,000% --- 100,000% --- 100,000%
Grifols Pyrenees Research Center, S.L.
C/ Prat de la Creu, 68-76, Planta
3ª, Edifici Administratiu del
Comú d'Andorra la Vella
Andorra
2021 Industrial Constitution, development and management of operations of a research and development center in all areas of immnology, dedicated to find possible solutions for therapeutic applications. --- 80,000% --- 80,000% --- 80,000%
Grifols Bio North America LLC
251 Little Falls Drive,
Wilmington, New Castle County,
19808, Delaware
United States
2021 Industrial Engage in any lawful business permitted by the Act or the laws of any jurisdiction in which the Company may do business. --- 100,000% --- 100,000% --- 100,000%
Biomat Holdings LLC
F
A
L
A
2410 Grifols Way, Los Angeles,
California, 90032, United States. 2023 Services Administration and financing services to Immunotek donor centers. --- 100,000% --- --- --- ---
Biomat Holdco, LLC.
251 Little Falls Drive,
Wilmington, New Castle County,
Delaware, 19808
United States
2021 Services Engage in any lawful act or activity for which corporations may be organized under General Corporation Law of Delaware. --- 100,000% --- 100,000% --- 100,000%
Biomat Newco, Corp.
251 Little Falls Drive,
Wilmington, New Castle County,
Delaware, 19808
United States
2021 Services Engage in any lawful act or activity for which corporations may be organized under General Corporation Law of Delaware. --- 88,600% --- 87,100% --- 100,000%
Grifols Escrow Issuer, S.A. (merged with Grifols, S.A.)
Parque Empresarial Can Sant
Joan, Avda de la Generalitat, 152-
156, Sant Cugat del Vallès,
08174, Barcelona
Spain
2021 Services Administration, management and control services for companies and businesses, as well as investment in property, as well as providing advisory services of any investee entities or group companies. --- --- 100,000% --- 100,000% ---
Grifols Canada Plasma, Inc. (formerly Prometic Plasma
Resources, Inc.)
531 Boul. Des Prairies, Building
15
Laval, Quebec H7V 1B7
Canada
2021 Industrial Procurement of human plasma. --- 100,000% --- 100,000% 100,000% ---
Grifols Canada Plasma – Ontario Inc. (formerly Canada Inc.) 2911 av. Marie-Curie, Montreal, Quebec, H4S0B7, Canada 2023 Services Administration, operating management and control services of plasma recollecting centers, directly or indirectly, through its affiliates. --- 100,000% --- --- --- ---
Access Biologicals, LLC (merged with Grifols Bio Supplies,
Inc.)
955, Park Center Drive, Vista,
CA 92801, United States 2017 Industrial
Manufacture of biological products such as specific serum and plasma reagents that are used by
biotechnological and biopharmaceutical companies for in-vitro diagnosis, cell culture and research and
development in the field of diagnostics.
--- --- --- 100,000% --- 49,000%
Access Biologicals IC-DISC, Inc. (merged with Grifols Bio
Supplies, Inc.)
995 Park Center Dr, Vista, CA
92081, United States 2017 Industrial
Manufacture of biological products, including specific sera and plasma-derived reagents, which are
used by biotechnology and biopharmaceutical companies for in-vitro diagnostics, cell culture, and
research and development in the diagnostic field.
--- --- --- 100,000% --- 49,000%
This appendix forms an integral part of note 2 to the Condensed Consolidated Interim Financial Statements |
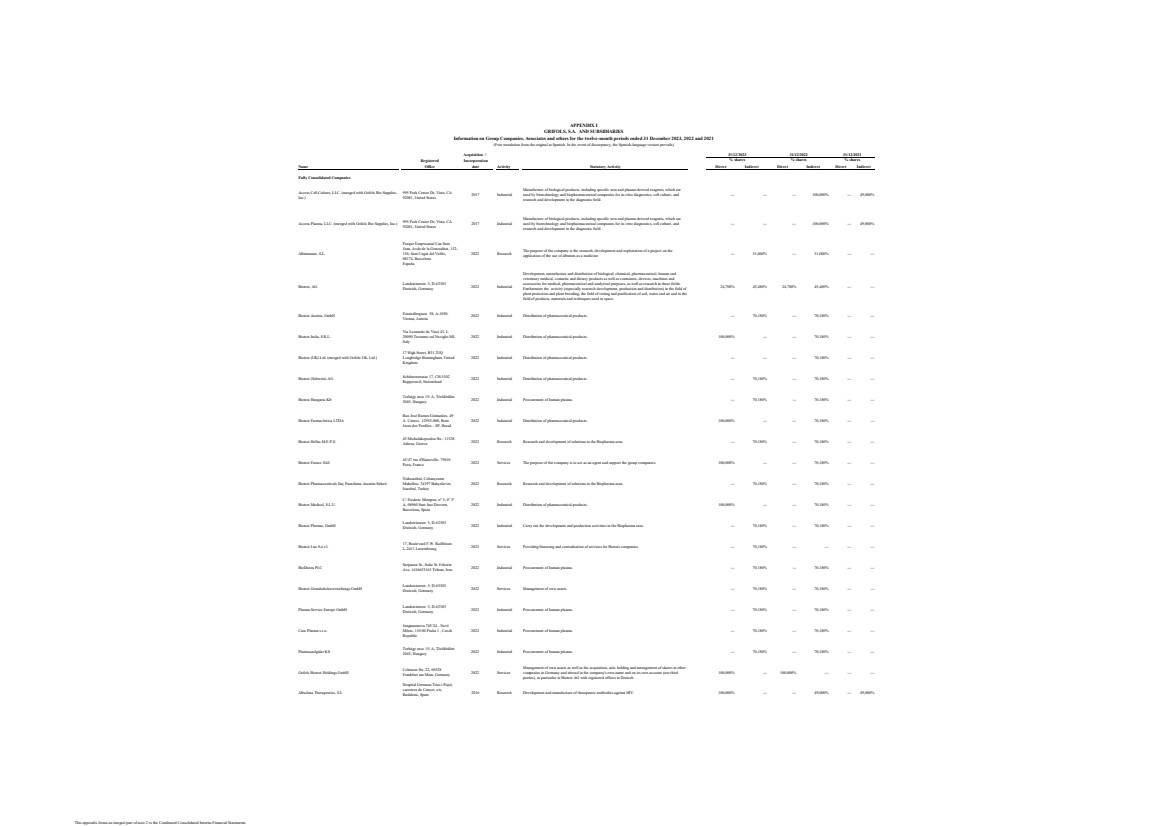
| Acquisition /
Registered Incorporation
Name Office date Activity Statutory Activity Direct Indirect Direct Indirect Direct Indirect
APPENDIX I
GRIFOLS, S.A. AND SUBSIDIARIES
Information on Group Companies, Associates and others for the twelve-month periods ended 31 December 2023, 2022 and 2021
(Free translation from the original in Spanish. In the event of discrepancy, the Spanish-language version prevails)
Fully Consolidated Companies
31/12/2021
% shares
31/12/2022
% shares
31/12/2023
% shares
Access Cell Culture, LLC. (merged with Grifols Bio Supplies,
Inc.)
995 Park Center Dr, Vista, CA
92081, United States 2017 Industrial
Manufacture of biological products, including specific sera and plasma-derived reagents, which are
used by biotechnology and biopharmaceutical companies for in-vitro diagnostics, cell culture, and
research and development in the diagnostic field.
--- --- --- 100,000% --- 49,000%
Access Plasma, LLC. (merged with Grifols Bio Supplies, Inc.) 995 Park Center Dr, Vista, CA 92081, United States 2017 Industrial Manufacture of biological products, including specific sera and plasma-derived reagents, which are used by biotechnology and biopharmaceutical companies for in-vitro diagnostics, cell culture, and research and development in the diagnostic field. --- --- --- 100,000% --- 49,000%
Albimmune, S.L.
Parque Empresarial Can Sant
Joan, Avda de la Generalitat, 152-
156, Sant Cugat del Vallès,
08174, Barcelona
España
2022 Research The purpose of the company is the research, development and exploitation of a project on the application of the use of albumin as a medicine --- 51,000% --- 51,000% --- ---
Biotest, AG Landsteinerstr. 5, D-63303 Dreieich, Germany 2022 Industrial
Development, manufacture and distribution of biological, chemical, pharmaceutical, human and
veterinary medical, cosmetic and dietary products as well as containers, devices, machines and
accessories for medical, pharmaceutical and analytical purposes, as well as research in these fields.
Furthermore the activity (especially research development, production and distribution) in the field of
plant protection and plant breeding, the field of testing and purification of soil, water and air and in the
field of products, materials and techniques used in space.
24,700% 45,480% 24,700% 45,480% --- ---
Biotest Austria, GmbH Einsiedlergasse 58, A-1050, Vienna, Austria 2022 Industrial Distribution of pharmaceutical products. --- 70,180% --- 70,180% --- ---
Biotest Italia, S.R.L.
Via Leonardo da Vinci 43, I-20090 Trezzano sul Naviglio MI,
Italy
2022 Industrial Distribution of pharmaceutical products. 100,000% --- --- 70,180% --- ---
Biotest (UK) Ltd. (merged with Grifols UK, Ltd.)
17 High Street, B31 2UQ
Longbridge Birmingham, United
Kingdom
2022 Industrial Distribution of pharmaceutical products. --- --- --- 70,180% --- ---
Biotest (Schweiz) AG Schützenstrasse 17, CH-5102 Rupperswil, Switzerland 2022 Industrial Distribution of pharmaceutical products. --- 70,180% --- 70,180% --- ---
Biotest Hungaria Kft Torbágy utca 15/ A, Törökbálint 2045, Hungary 2022 Industrial Procurement of human plasma. --- 70,180% --- 70,180% --- ---
Biotest Farmacêutica LTDA
Rua José Ramos Guimarães, 49
A Centro, 12955-000, Bom
Jesus dos Perdões – SP, Brasil
2022 Industrial Distribution of pharmaceutical products. 100,000% --- --- 70,180% --- ---
Biotest Hellas M.E.P.E. 45 Michalakopoulou Str., 11528 Athens, Greece 2022 Research Research and development of solutions in the Biopharma area. --- 70,180% --- 70,180% --- ---
Biotest France SAS 45/47 rue d'Hauteville, 75010 Paris, France 2022 Services The purpose of the company is to act as an agent and support the group companies. 100,000% --- --- 70,180% --- ---
Biotest Pharmaceuticals Ilaç Pazarlama Anonim Sirketi
Nishstanbul, Cobançesme
Mahallesi, 34197 Bahçeliever,
Istanbul, Turkey
2022 Research Research and development of solutions in the Biopharma area. --- 70,180% --- 70,180% --- ---
Biotest Medical, S.L.U.
C/ Frederic Mompou, nº 5, 6º 3ª
A, 08960 Sant Just Desvern,
Barcelona, Spain
2022 Industrial Distribution of pharmaceutical products. 100,000% --- --- 70,180% --- ---
Biotest Pharma, GmbH Landsteinerstr. 5, D-63303 Dreieich, Germany 2022 Industrial Carry out the development and production activities in the Biopharma area. --- 70,180% --- 70,180% --- ---
Biotest Lux S.à.r.l. 17, Boulevard F.W. Raiffeisen L-2411 Luxembourg 2023 Services Providing financing and centralisation of services for Biotest companies. --- 70,180% --- --- --- ---
BioDarou PLC Sarparast St., Italia St. Felestin Ave, 1416653163 Tehran, Iran 2022 Industrial Procurement of human plasma. --- 70,180% --- 70,180% --- ---
Biotest Grundstücksverwaltungs GmbH Landsteinerstr. 5, D-63303 Dreieich, Germany 2022 Services Management of own assets. --- 70,180% --- 70,180% --- ---
Plasma Service Europe GmbH Landsteinerstr. 5, D-63303 Dreieich, Germany 2022 Industrial Procurement of human plasma. --- 70,180% --- 70,180% --- ---
Cara Plasma s.r.o.
Jungmannova 745/24 - Nové
Město, 110 00 Praha 1 , Czech
Republic
2022 Industrial Procurement of human plasma. --- 70,180% --- 70,180% --- ---
Plazmaszolgálat Kft Torbágy utca 15/ A, Törökbálint 2045, Hungary 2022 Industrial Procurement of human plasma. --- 70,180% --- 70,180% --- ---
Grifols Biotest Holdings GmbH Colmarer Str. 22, 60528 Frankfurt am Main, Germany 2022 Services Management of own assets as well as the acquisition, sale, holding and management of shares in other companies in Germany and abroad in the company's own name and on its own account (not third parties), in particular in Biotest AG with registered offices in Dreiech. 100,000% --- 100,000% --- --- ---
AlbaJuna Therapeutics, S.L
Hospital Germans Trias i Pujol,
carretera de Canyet, s/n,
Badalona, Spain 2016 Research Development and manufacture of therapeutic antibodies against HIV. 100,000% --- --- 49,000% --- 49,000%
This appendix forms an integral part of note 2 to the Condensed Consolidated Interim Financial Statements |
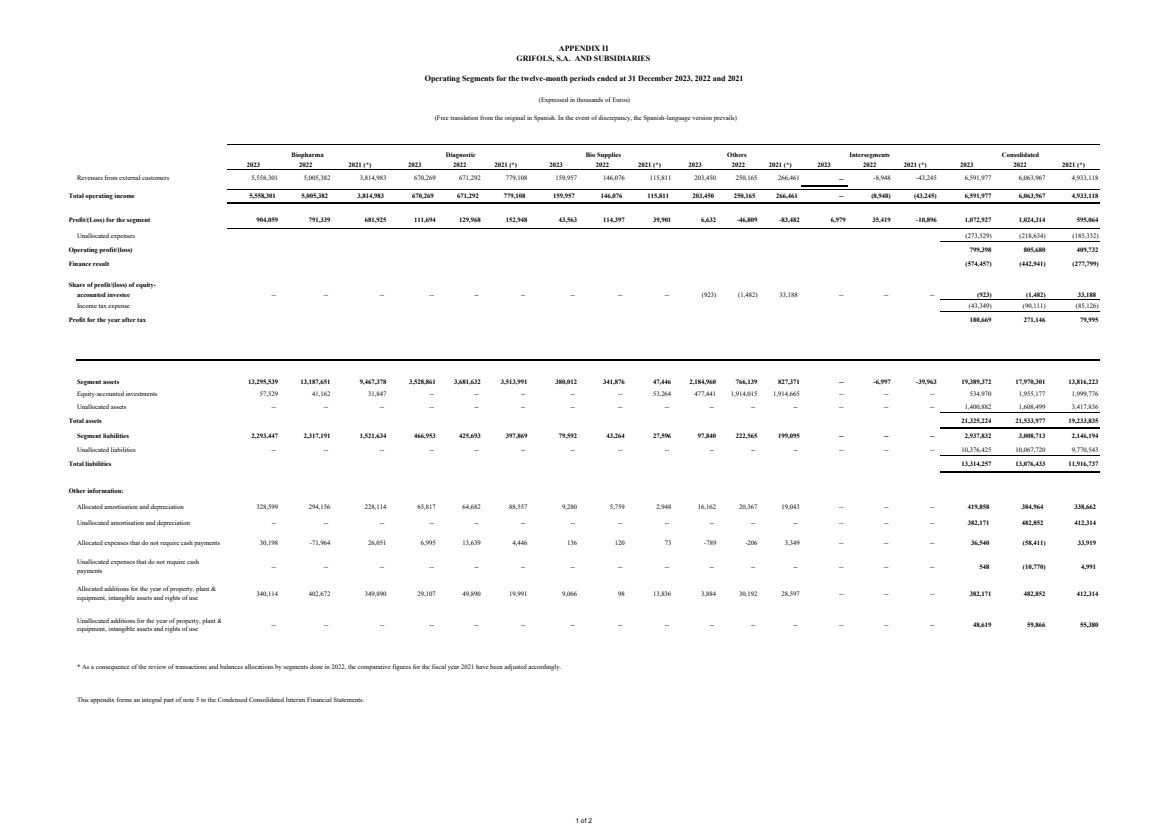
| 2023 2022 2021 (*) 2023 2022 2021 (*) 2023 2022 2021 (*) 2023 2022 2021 (*) 2023 2022 2021 (*) 2023 2022 2021 (*)
Revenues from external customers 5,558,301 5,005,382 3,814,983 670,269 671,292 779,108 159,957 146,076 115,811 203,450 250,165 266,461 -- -8,948 -43,245 6,591,977 6,063,967 4,933,118
Total operating income 5,558,301 5,005,382 3,814,983 670,269 671,292 779,108 159,957 146,076 115,811 203,450 250,165 266,461 -- (8,948) (43,245) 6,591,977 6,063,967 4,933,118
Profit/(Loss) for the segment 904,059 791,339 681,925 111,694 129,968 152,948 43,563 114,397 39,901 6,632 -46,809 -83,482 6,979 35,419 -10,896 1,072,927 1,024,314 595,064
Unallocated expenses (218,634) (273,529) (185,332)
Operating profit/(loss) 799,398 805,680 409,732
Finance result (442,941) (574,457) (277,799)
Share of profit/(loss) of equity-accounted investee -- -- -- -- -- -- -- -- -- (923) (1,482) 33,188 -- -- -- (1,482) (923) 33,188
Income tax expense (90,111) (43,349) (85,126)
Profit for the year after tax 180,669 271,146 79,995
Segment assets 13,295,539 13,187,651 9,467,378 3,528,861 3,681,632 3,513,991 380,012 341,876 47,446 2,184,960 766,139 827,371 -- -6,997 -39,963 19,389,372 17,970,301 13,816,223
Equity-accounted investments 57,529 41,162 31,847 -- -- -- -- -- 53,264 477,441 1,914,015 1,914,665 -- -- -- 534,970 1,955,177 1,999,776
Unallocated assets -- -- -- -- -- -- -- -- -- -- -- -- -- -- -- 1,400,882 1,608,499 3,417,836
Total assets 21,325,224 21,533,977 19,233,835
Segment liabilities 2,293,447 2,317,191 1,521,634 466,953 425,693 397,869 79,592 43,264 27,596 97,840 222,565 199,095 -- -- -- 2,937,832 3,008,713 2,146,194
Unallocated liabilities -- -- -- -- -- -- -- -- -- -- -- -- -- -- -- 10,376,425 10,067,720 9,770,543
Total liabilities 13,314,257 13,076,433 11,916,737
Other information:
Allocated amortisation and depreciation 328,599 294,156 228,114 65,817 64,682 88,557 9,280 5,759 2,948 16,162 20,367 19,043 -- -- -- 384,964 419,858 338,662
Unallocated amortisation and depreciation -- -- -- -- -- -- -- -- -- -- -- -- -- -- -- 482,852 382,171 412,314
Allocated expenses that do not require cash payments 30,198 -71,964 26,051 6,995 13,639 4,446 136 120 73 -789 -206 3,349 -- -- -- (58,411) 36,540 33,919
Unallocated expenses that do not require cash
payments
-- -- -- -- -- -- -- -- -- -- -- -- -- -- -- (10,770) 548 4,991
Allocated additions for the year of property, plant &
equipment, intangible assets and rights of use 340,114 402,672 349,890 29,107 49,890 19,991 9,066 98 13,836 3,884 30,192 28,597 -- -- -- 382,171 482,852 412,314
Unallocated additions for the year of property, plant &
equipment, intangible assets and rights of use -- -- -- -- -- -- -- -- -- -- -- -- -- -- -- 48,619 59,866 55,380
* As a consequence of the review of transactions and balances allocations by segments done in 2022, the comparative figures for the fiscal year 2021 have been adjusted accordingly.
This appendix forms an integral part of note 5 to the Condensed Consolidated Interim Financial Statements.
Consolidated
APPENDIX II
GRIFOLS, S.A. AND SUBSIDIARIES
Operating Segments for the twelve-month periods ended at 31 December 2023, 2022 and 2021
(Expressed in thousands of Euros)
(Free translation from the original in Spanish. In the event of discrepancy, the Spanish-language version prevails)
Biopharma Diagnostic Bio Supplies Others Intersegments
1 of 2 |
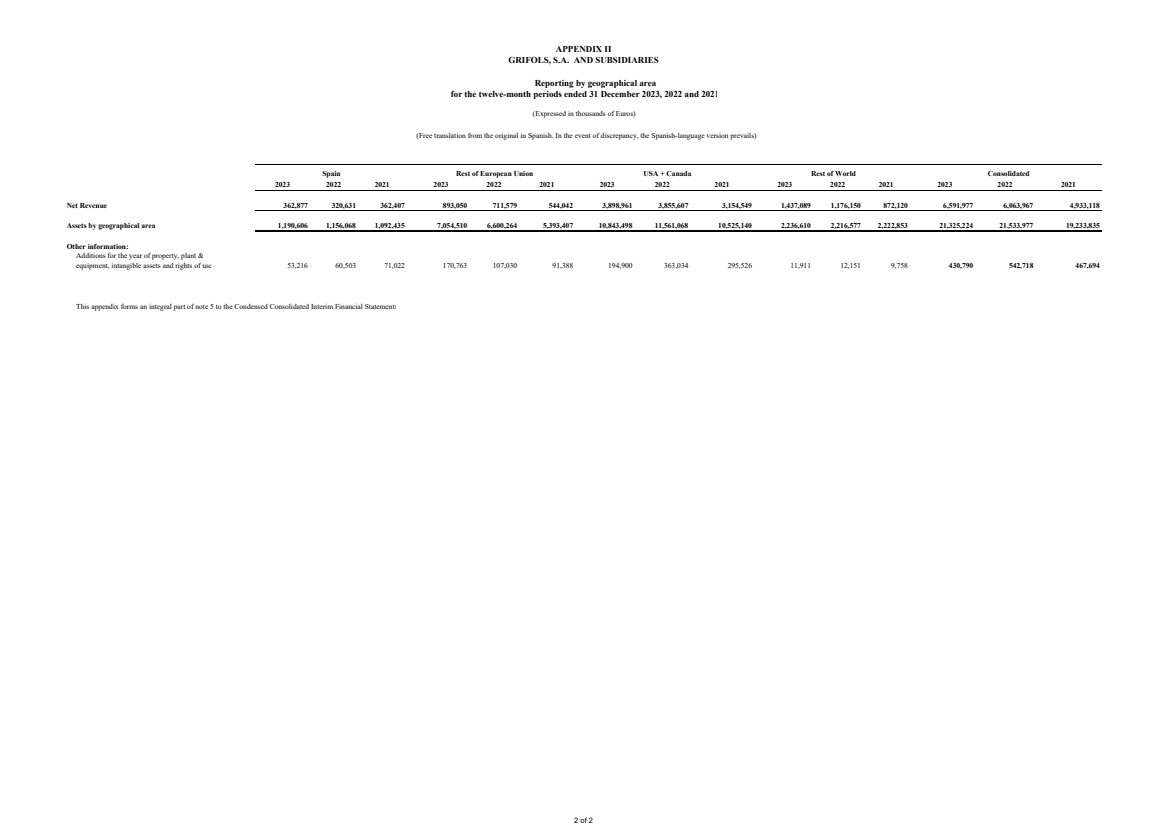
| 2023 2022 2021 2023 2022 2021 2023 2022 2021 2023 2022 2021 2023 2022 2021
Net Revenue 362,877 320,631 362,407 893,050 711,579 544,042 3,898,961 3,855,607 3,154,549 1,437,089 1,176,150 872,120 6,591,977 6,063,967 4,933,118
Assets by geographical area 1,190,606 1,156,068 1,092,435 7,054,510 6,600,264 5,393,407 10,843,498 11,561,068 10,525,140 2,236,610 2,216,577 2,222,853 21,325,224 21,533,977 19,233,835
Other information:
Additions for the year of property, plant &
equipment, intangible assets and rights of use 53,216 60,503 71,022 170,763 107,030 91,388 194,900 363,034 295,526 11,911 12,151 9,758 430,790 542,718 467,694
This appendix forms an integral part of note 5 to the Condensed Consolidated Interim Financial Statements
Consolidated
APPENDIX II
GRIFOLS, S.A. AND SUBSIDIARIES
for the twelve-month periods ended 31 December 2023, 2022 and 2021
(Expressed in thousands of Euros)
Reporting by geographical area
Spain Rest of European Union USA + Canada Rest of World
(Free translation from the original in Spanish. In the event of discrepancy, the Spanish-language version prevails)
2 of 2 |
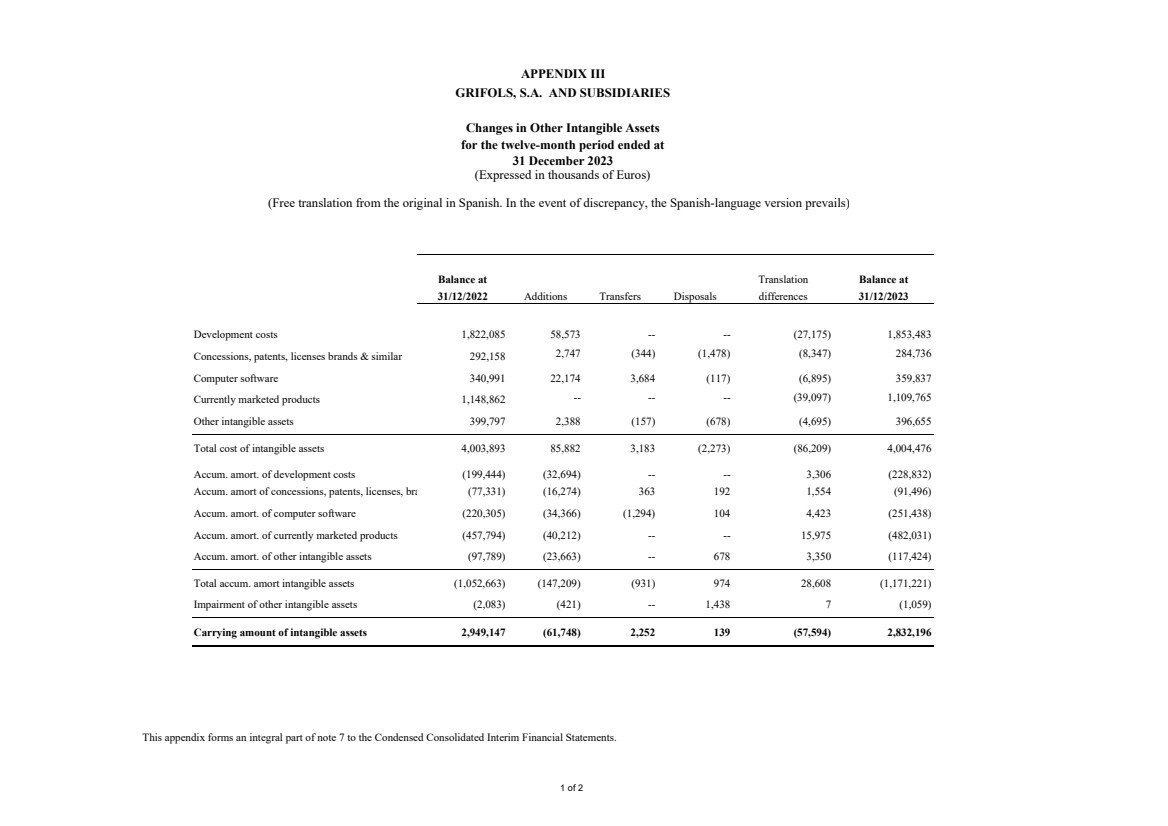
| (Free translation from the original in Spanish. In the event of discrepancy, the Spanish-language version prevails)
Balance at Translation Balance at
31/12/2022 Additions Transfers Disposals differences 31/12/2023
Development costs 1,822,085 58,573 -- -- (27,175) 1,853,483
Concessions, patents, licenses brands & similar 292,158 2,747 (344) (1,478) (8,347) 284,736
Computer software 340,991 22,174 3,684 (117) (6,895) 359,837
Currently marketed products 1,148,862 -- -- -- (39,097) 1,109,765
Other intangible assets 399,797 2,388 (157) (678) (4,695) 396,655
Total cost of intangible assets 4,003,893 85,882 3,183 (2,273) (86,209) 4,004,476
Accum. amort. of development costs (199,444) (32,694) -- -- 3,306 (228,832)
Accum. amort of concessions, patents, licenses, bra (77,331) (16,274) 363 192 1,554 (91,496)
Accum. amort. of computer software (220,305) (34,366) (1,294) 104 4,423 (251,438)
Accum. amort. of currently marketed products (457,794) (40,212) -- -- 15,975 (482,031)
Accum. amort. of other intangible assets (97,789) (23,663) -- 678 3,350 (117,424)
Total accum. amort intangible assets (1,052,663) (147,209) (931) 974 28,608 (1,171,221)
Impairment of other intangible assets (2,083) (421) -- 1,438 7 (1,059)
Carrying amount of intangible assets 2,949,147 (61,748) 2,252 139 (57,594) 2,832,196
This appendix forms an integral part of note 7 to the Condensed Consolidated Interim Financial Statements.
APPENDIX III
GRIFOLS, S.A. AND SUBSIDIARIES
Changes in Other Intangible Assets
for the twelve-month period ended at
31 December 2023
(Expressed in thousands of Euros)
1 of 2 |
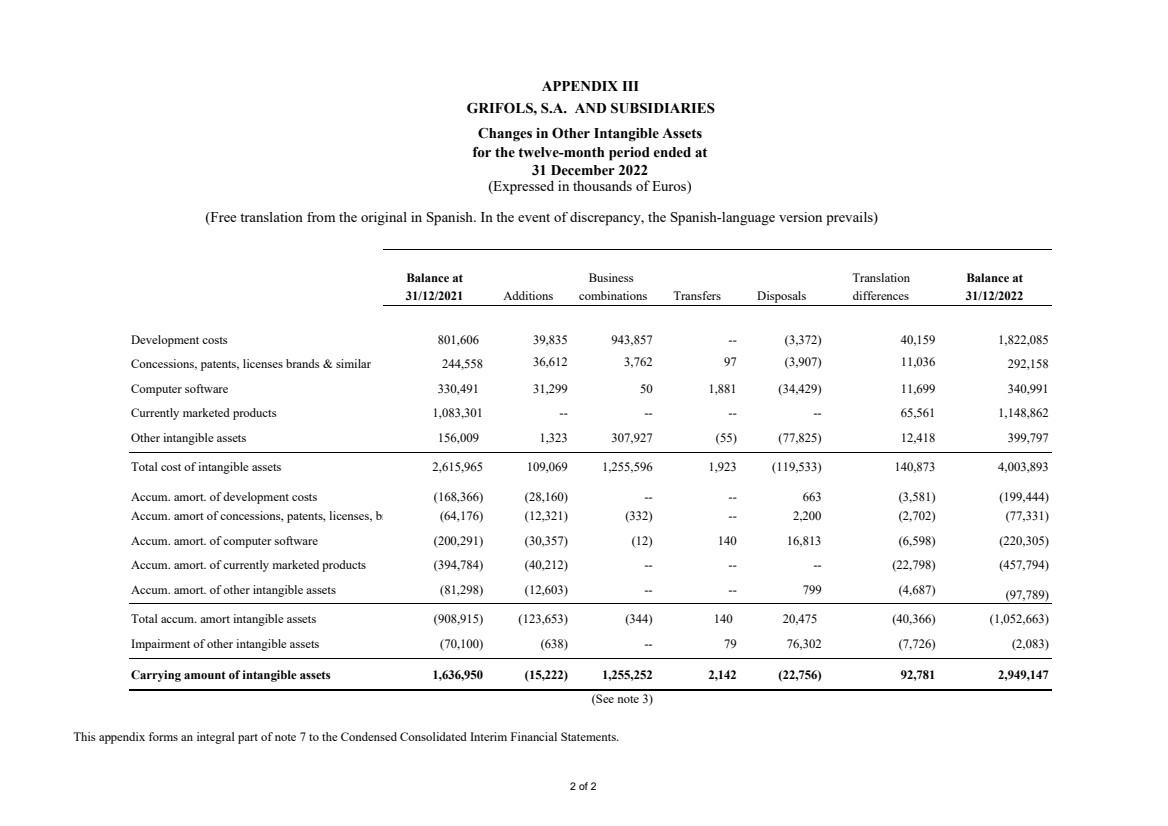
| (Free translation from the original in Spanish. In the event of discrepancy, the Spanish-language version prevails)
Balance at Business Translation Balance at
31/12/2021 Additions combinations Transfers Disposals differences 31/12/2022
Development costs 801,606 39,835 943,857 -- (3,372) 40,159 1,822,085
Concessions, patents, licenses brands & similar 244,558 36,612 3,762 97 (3,907) 11,036 292,158
Computer software 330,491 31,299 50 1,881 (34,429) 11,699 340,991
Currently marketed products 1,083,301 -- -- -- -- 65,561 1,148,862
Other intangible assets 156,009 1,323 307,927 (55) (77,825) 12,418 399,797
Total cost of intangible assets 2,615,965 109,069 1,255,596 1,923 (119,533) 140,873 4,003,893
Accum. amort. of development costs (168,366) (28,160) -- -- 663 (3,581) (199,444)
Accum. amort of concessions, patents, licenses, br (64,176) (12,321) (332) -- 2,200 (2,702) (77,331)
Accum. amort. of computer software (200,291) (30,357) (12) 140 16,813 (6,598) (220,305)
Accum. amort. of currently marketed products (394,784) (40,212) -- -- -- (22,798) (457,794)
Accum. amort. of other intangible assets (81,298) (12,603) -- -- 799 (4,687) (97,789)
Total accum. amort intangible assets (908,915) (123,653) (344) 140 20,475 (40,366) (1,052,663)
Impairment of other intangible assets (70,100) (638) -- 79 76,302 (7,726) (2,083)
Carrying amount of intangible assets 1,636,950 (15,222) 1,255,252 2,142 (22,756) 92,781 2,949,147
(See note 3)
This appendix forms an integral part of note 7 to the Condensed Consolidated Interim Financial Statements.
APPENDIX III
GRIFOLS, S.A. AND SUBSIDIARIES
Changes in Other Intangible Assets
for the twelve-month period ended at
31 December 2022
(Expressed in thousands of Euros)
2 of 2 |
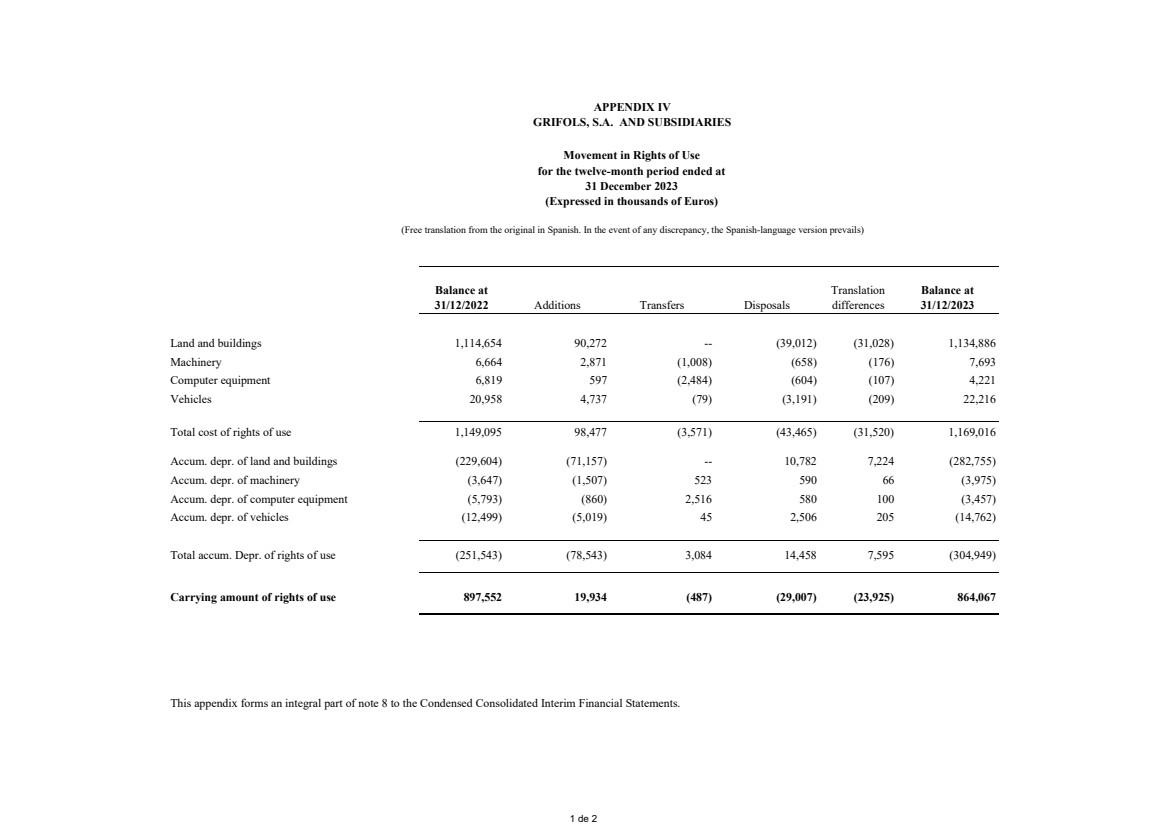
| Balance at Translation Balance at
31/12/2022 Additions Transfers Disposals differences 31/12/2023
Land and buildings 1,114,654 90,272 -- (39,012) (31,028) 1,134,886
Machinery 6,664 2,871 (1,008) (658) (176) 7,693
Computer equipment 6,819 597 (2,484) (604) (107) 4,221
Vehicles 20,958 4,737 (79) (3,191) (209) 22,216
Total cost of rights of use 1,149,095 98,477 (3,571) (43,465) (31,520) 1,169,016
Accum. depr. of land and buildings (229,604) (71,157) -- 10,782 7,224 (282,755)
Accum. depr. of machinery (3,647) (1,507) 523 590 66 (3,975)
Accum. depr. of computer equipment (5,793) (860) 2,516 580 100 (3,457)
Accum. depr. of vehicles (12,499) (5,019) 45 2,506 205 (14,762)
Total accum. Depr. of rights of use (251,543) (78,543) 3,084 14,458 7,595 (304,949)
Carrying amount of rights of use 897,552 19,934 (487) (29,007) (23,925) 864,067
This appendix forms an integral part of note 8 to the Condensed Consolidated Interim Financial Statements.
(Expressed in thousands of Euros)
(Free translation from the original in Spanish. In the event of any discrepancy, the Spanish-language version prevails)
APPENDIX IV
GRIFOLS, S.A. AND SUBSIDIARIES
Movement in Rights of Use
for the twelve-month period ended at
31 December 2023
1 de 2 |
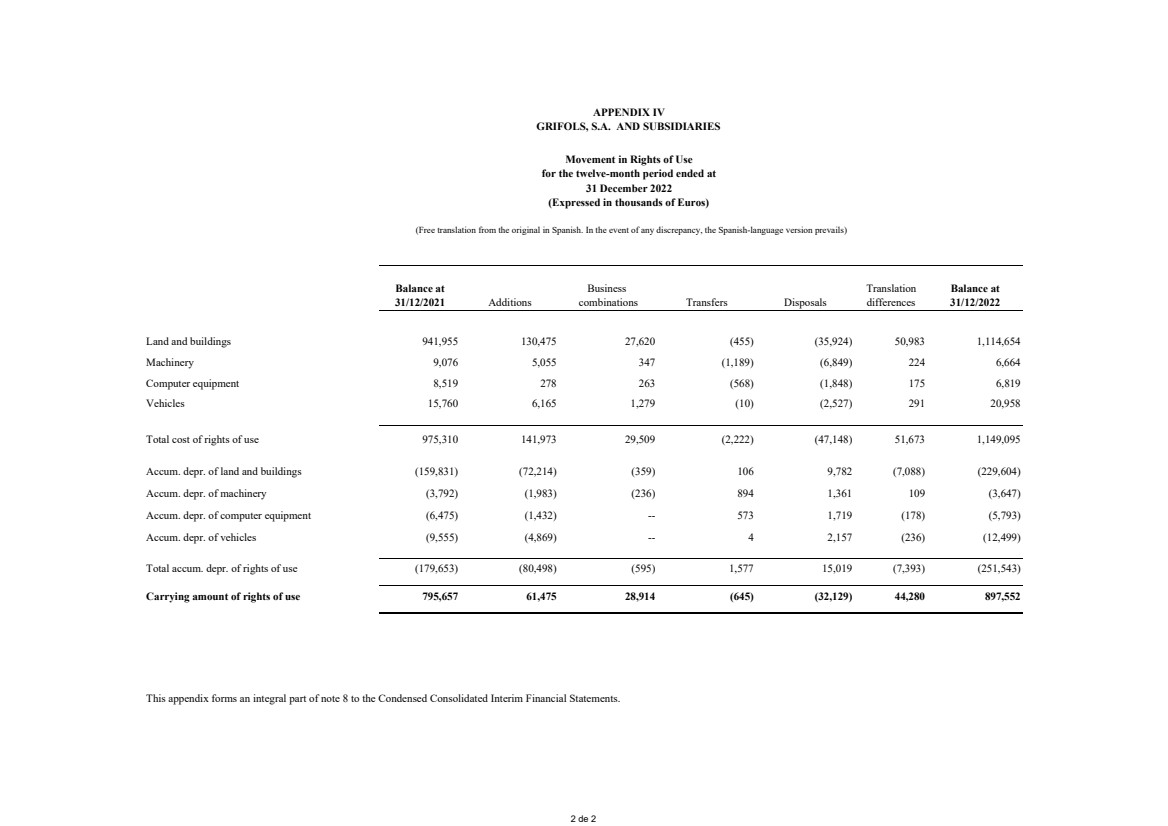
| Balance at Business Translation Balance at
31/12/2021 Additions combinations Transfers Disposals differences 31/12/2022
Land and buildings 941,955 130,475 27,620 (455) (35,924) 50,983 1,114,654
Machinery 9,076 5,055 347 (1,189) (6,849) 224 6,664
Computer equipment 8,519 278 263 (568) (1,848) 175 6,819
Vehicles 15,760 6,165 1,279 (10) (2,527) 291 20,958
Total cost of rights of use 975,310 141,973 29,509 (2,222) (47,148) 51,673 1,149,095
Accum. depr. of land and buildings (159,831) (72,214) (359) 106 9,782 (7,088) (229,604)
Accum. depr. of machinery (3,792) (1,983) (236) 894 1,361 109 (3,647)
Accum. depr. of computer equipment (6,475) (1,432) -- 573 1,719 (178) (5,793)
Accum. depr. of vehicles (9,555) (4,869) -- 4 2,157 (236) (12,499)
Total accum. depr. of rights of use (179,653) (80,498) (595) 1,577 15,019 (7,393) (251,543)
Carrying amount of rights of use 795,657 61,475 28,914 (645) (32,129) 44,280 897,552
This appendix forms an integral part of note 8 to the Condensed Consolidated Interim Financial Statements.
(Expressed in thousands of Euros)
(Free translation from the original in Spanish. In the event of any discrepancy, the Spanish-language version prevails)
APPENDIX IV
GRIFOLS, S.A. AND SUBSIDIARIES
Movement in Rights of Use
for the twelve-month period ended at
31 December 2022
2 de 2 |
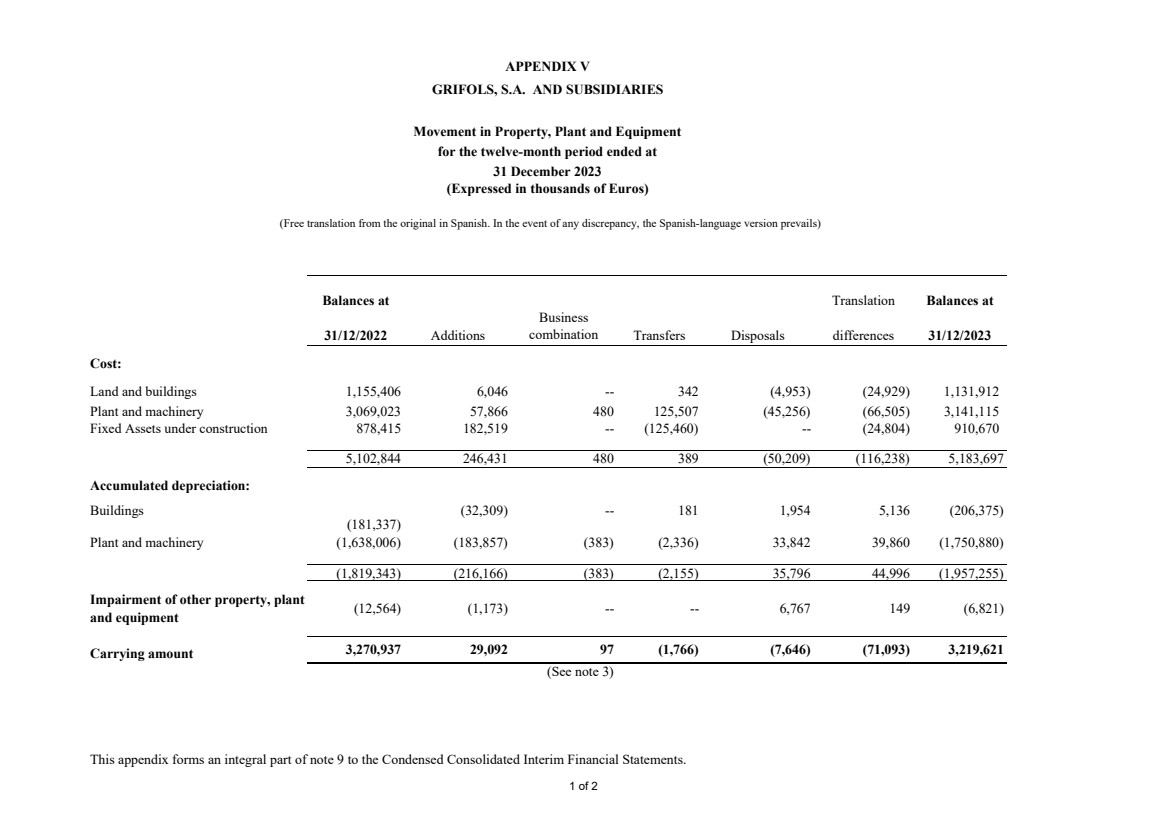
| Balances at Translation Balances at
31/12/2022 Additions
Business
combination Transfers Disposals differences 31/12/2023
Cost:
Land and buildings 1,155,406 6,046 -- 342 (4,953) (24,929) 1,131,912
Plant and machinery 3,069,023 57,866 480 125,507 (45,256) (66,505) 3,141,115
Fixed Assets under construction 878,415 182,519 -- (125,460) -- (24,804) 910,670
5,102,844 246,431 480 389 (50,209) (116,238) 5,183,697
Accumulated depreciation:
Buildings
(181,337)
(32,309) -- 181 1,954 5,136 (206,375)
Plant and machinery (1,638,006) (183,857) (383) (2,336) 33,842 39,860 (1,750,880)
(1,819,343) (216,166) (383) (2,155) 35,796 44,996 (1,957,255)
(12,564) (1,173) -- -- 6,767 149 (6,821)
Carrying amount 3,270,937 29,092 97 (1,766) (7,646) (71,093) 3,219,621
(See note 3)
This appendix forms an integral part of note 9 to the Condensed Consolidated Interim Financial Statements.
APPENDIX V
GRIFOLS, S.A. AND SUBSIDIARIES
Movement in Property, Plant and Equipment
for the twelve-month period ended at
Impairment of other property, plant
and equipment
(Expressed in thousands of Euros)
(Free translation from the original in Spanish. In the event of any discrepancy, the Spanish-language version prevails)
31 December 2023
1 of 2 |
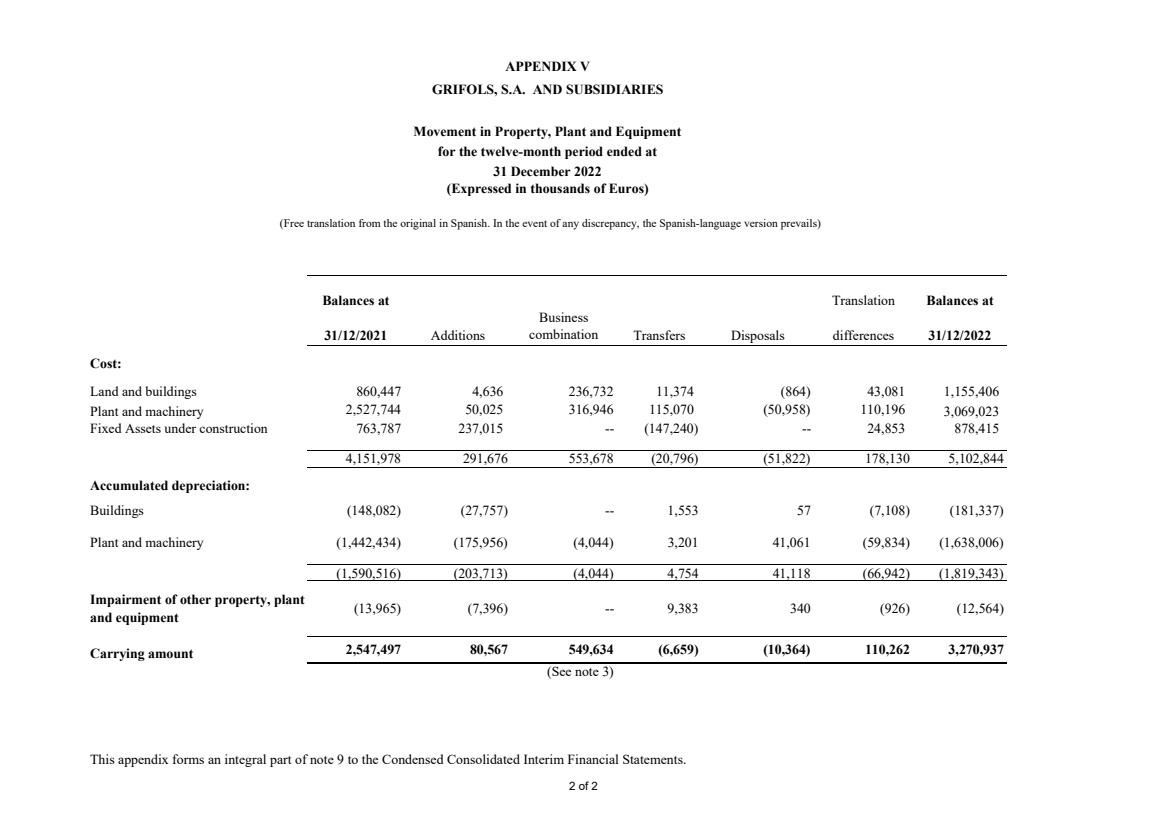
| Balances at Translation Balances at
31/12/2021 Additions
Business
combination Transfers Disposals differences 31/12/2022
Cost:
Land and buildings 860,447 4,636 236,732 11,374 (864) 43,081 1,155,406
Plant and machinery 2,527,744 50,025 316,946 115,070 (50,958) 110,196 3,069,023
Fixed Assets under construction 763,787 237,015 -- (147,240) -- 24,853 878,415
4,151,978 291,676 553,678 (20,796) (51,822) 178,130 5,102,844
Accumulated depreciation:
Buildings (148,082) (27,757) -- 1,553 57 (7,108) (181,337)
Plant and machinery (1,442,434) (175,956) (4,044) 3,201 41,061 (59,834) (1,638,006)
(1,590,516) (203,713) (4,044) 4,754 41,118 (66,942) (1,819,343)
(13,965) (7,396) -- 9,383 340 (926) (12,564)
Carrying amount 2,547,497 80,567 549,634 (6,659) (10,364) 110,262 3,270,937
(See note 3)
This appendix forms an integral part of note 9 to the Condensed Consolidated Interim Financial Statements.
(Expressed in thousands of Euros)
(Free translation from the original in Spanish. In the event of any discrepancy, the Spanish-language version prevails)
Impairment of other property, plant
and equipment
APPENDIX V
GRIFOLS, S.A. AND SUBSIDIARIES
Movement in Property, Plant and Equipment
for the twelve-month period ended at
31 December 2022
2 of 2 |
| GRIFOLS, S.A. AND SUBSIDIARIES
Consolidated Interim Director’s Report for the year ended
December 31, 2023
1
The management report for the year ended December 31, 2023 should be read in conjunction with the
condensed consolidated interim financial statements for the same period and related notes. The comments and
analyses included in the report may contain forward-looking statements and considerations that involve risks
and uncertainties. Please refer to the legal notice included at the end of the document.
For Grifols, 2023 was a year of transformation and growth. The company closed a decisive year that will
accelerate value creation in 2024, delivering on its commitments and making strides across the board, as
evidenced by its solid operating and financial results in the year.
Grifols has advanced its strategic roadmap centered on achieving solid financial results and operational
excellence, deleveraging and creating greater value for its stakeholders.
The company’s strategic alliance with Haier Group in China supports its deleveraging efforts, while the roll-out of the operational improvement plan announced in February 2023 has led to substantial cost savings and a
clear recovery of profit margins.
EVOLUTION OF REVENUES BY BUSINESS UNIT
In this context, Grifols’ revenue, including Biotest, reached EUR 6,592 million, representing an increase of
10.9% cc1
(+8.7% reported2
). Excluding Biotest, revenues grew by 9.1% cc (+6.8% reported) to EUR 6,089
million.
Biopharma
Biopharma’s revenues increased by 13.3% cc (+11.0% reported) to EUR 5,558 million in 2023. Excluding
Biotest, revenues grew 11.3% cc (+8.9%) to EUR 5,055 million. The main growth levers were the solid
performance of key proteins driven by higher plasma supply, robust underlying demand, and a favorable pricing
environment and product mix.
Worth noting is the robust sales uptick of immunoglobulins, one of the company’s main plasma proteins,
representing around 55-60% of Biopharma revenues. Sales grew by 15.8% cc excluding Biotest, fueled by
strong demand for intravenous immunoglobulin (IVIG) and the significant growth of subcutaneous
immunoglobulin (SCIG) Xembify® in key markets such as the United States.
In 2023, Grifols continued to strengthen its immunoglobulin franchise by focusing its efforts on the fastest-growing immunodeficiency segments, including primary (PID) and secondary (SID) immunodeficiencies,
while maintaining its leadership in neurology and intensive care.
The company aspires to continue to drive the growth of its franchise in the U.S. and prioritize certain countries,
while accelerating the expansion and penetration of Xembify®. In this regard, worth highlighting is the
1 Operating or constant exchange rate (cc) excludes exchange rate variations for the period.
2 Reported includes the impact of foreign exchange rates. |

| GRIFOLS, S.A. AND SUBSIDIARIES
Consolidated Interim Director’s Report for the year ended
December 31, 2023
2
European market launch of Xembify® in June, with Spain and the United Kingdom (Wales) as the first countries
to start marketing this plasma drug. It launched in Australia in 2023.
Sales of albumin, which account for around 10-15% of the business unit’s revenues, grew by 17.0% cc
excluding Biotest, driven mainly by demand in China and the solid performance in the main European countries.
In addition, Grifols’ innovative sales strategy under the SRAAS agreement leads to greater supply in the
country.
Alpha-1 and other specialty proteins, which represent roughly 25-30% of revenues, have remained stable with
0.2% cc growth. The solid evolution of alpha-1 sales was particularly notable, with a 2.4% cc increase in the
last quarter, primarily in European markets. Another contributing factor was the U.S. launch of AlphaID™ At
Home, a detection test for alpha-1 antitrypsin deficiency (AADT), a genetic disease with symptoms similar to
chronic obstructive pulmonary disease (COPD). Demand for hyperimmune immunoglobulins in the U.S. was
also strong.
Diagnostic
In 2023, Diagnostic recorded revenues of EUR 670 million in 2023, up 2.3% cc (-0.2% reported).
There was notable growth in blood typing solutions (+8.9% cc) in the main countries, including the U.S.,
Argentina, Brazil, Spain and Saudi Arabia. NAT blood and plasma screening solutions remained stable,
growing 0.4%. Highlights included the extension of the agreement with CTS in the U.S. and higher instrument
sales in Japan and Indonesia.
Revenues from recombinant proteins increased by 2.3% cc in the 2023 fiscal year, driven by demand in the
main regions, especially in the U.S., and by a major 10-year supply agreement with a key partner.
The most significant milestones in product commercialization, in addition to the launch of AlphaID™ At Home
in the U.S. in May 2023, include the CE mark being granted for Grifols’ sCD38 solution. This is the first soluble
recombinant protein to facilitate pre-transfusion compatibility testing in patients with multiple myeloma.
Furthermore, AlphaID™ At Home is the first Grifols product to be cleared by the U.S. FDA for direct consumer
use.
Bio Supplies
Bio Supplies grew by 11.3% cc (+9.5% reported) to EUR 160 million. Throughout the year, Grifols has
continued to maximize the value of its Bio Supplies product portfolio, expanded following the integration of
Access Biologicals, which continues to contribute significantly to the business unit’s revenues, together with
sales of hyperimmune plasma to third parties. |
| GRIFOLS, S.A. AND SUBSIDIARIES
Consolidated Interim Director’s Report for the year ended
December 31, 2023
3
PLASMA SUPPLY AND COST PER LITER
Grifols continues to increase plasma supply and effectively reduce its cost per liter (CPL), leading to significant
increases in profit margins. In 2023, plasma supply increased by 10% compared to 2022 and the cost per liter
fell 22% compared to the peak reached in July 2022. The main levers of these positive trends were the increase
in donors (920,000+), higher donation frequency and the 100% execution of planned initiatives in the
operational improvement plan announced in February 2023.
Under this plan, the company optimized and rationalized its network of plasma centers, which contributed
notably to improving CPL thanks to greater process efficiencies and an enhanced donor experience. Another
highlight is the implementation of new, more efficient plasmapheresis equipment which increases yield.
The company currently operates more than 390 plasma centers, which constitute the largest private plasma
supply network in the world.
As part of its pledge to help countries achieve self-sufficiency in plasma and plasma medicines, Grifols stands
as an industry leader in promoting public-private collaborations, with agreements in Canada, Egypt and other
countries.
FINANCIAL RESULTS
In 2023, gross margin increased to 39.4% (37.8% including Biotest), driven by strong revenue growth and lower
cost per liter of plasma (CPL) as a result of the operational improvement plan.
Grifols’ 2023 income statement has started to reflect the benefits from the drop in CPL following its all-time
high in July 2022, taking into account the approximate nine-month lag in inventory accounting in the plasma
industry. In this regard, the improvement in CPL led to a higher profit margin in the second half of 2023, and
is expected to continue to have a positive impact in the 2024 fiscal year.
Reported EBITDA stood at EUR 1,265 million in 2023 (EUR 1,251 million including Biotest). At the same
time, adjusted EBITDA3
reached EUR 1,455 million, representing a margin of 24.0% on revenues, and EUR
1,474 million, with a 22.4% margin, including Biotest.
The sequential expansion of the EBITDA margin throughout the year was supported by the growth of all
Biopharma-led business units, cost savings stemming from the operational improvement plan, and operating
leverage.
The financial result stood at EUR -574.5 million in 2023 (EUR -442.9 million in 2022).
3 Adjusted EBITDA excluding and including Biotest does not account for EUR 190 million and EUR 223 million of non-recurring expenses,
respectively, which include EUR 159 million of restructuring costs which arose from the implementation of the operational improvement
plan. |
| GRIFOLS, S.A. AND SUBSIDIARIES
Consolidated Interim Director’s Report for the year ended
December 31, 2023
4
Reported net income was positive at EUR 59.3 million in 2023 (EUR 208.3 million in 2022), but mainly reflects
EUR 118.8 million of non-recurring restructuring costs recognized over the course of the fiscal year.
BALANCE SHEET
On December 31, 2023, the balance sheet stood at EUR 21,326 million, compared with EUR 21,534 million on
December 31, 2022. Strategic investments made in recent years to boost plasma procurement and reinforce
innovation projects have been instrumental in driving the group’s growth.
Inventory control, collection and payment periods
Inventories remained stable at EUR 3,445 million with a turnover of 307 days (296 days in December 2022)
due to the progressive impact of the improved cost per liter of plasma in a context of increased supply. Average
collection and payment periods remained stable at 35 days (36 days in 2022) and 56 days (53 days in 2022).
The average payment period to suppliers of the Spanish group companies was 72 days, similar to the previous
year’s average of 69 days. All these figures include Biotest except for average payment period.
Working-capital management
Improvements in working-capital management continue to optimize Grifols’ financial structure. As of
December 31, 2023, the company’s liquidity position stood at EUR 1,141 million, including EUR 526 million
in cash.
Operational improvement and cost savings plan
Fully executed in 2023 and designed to reduce the cost base, this plan has elevated Grifols’ operating cash flow
and financial performance, generating over EUR 450 million in annualized cost savings. Given the
approximately nine-month inventory accounting lag applied in the plasma industry, most of these savings will
be reflected in the company’s 2024 income statement.
Deleveraging commitment
Deleveraging remains a core priority for Grifols, which reiterates its aim of reducing debt on its balance sheet.
At the close of 2023, the debt ratio fell to 6.3x (7.1x in December 2022) following an uptick in EBITDA and
operating cash flow generation, which stood at EUR 208 million in 2023 (EUR 351 million excluding
exceptionals).
Including the sale of SRAAS share capital to Haier Group, the debt ratio would stand at 5.4x (pro forma).
Grifols continues to advance in its objective of reaching 4.0x.
Evolution of equity
On December 31, 2023, shareholder equity totaled EUR 8,011 million. Grifols’ share capital is represented by
426,129,798 ordinary shares (Class A), with a nominal value of EUR 0.25 per share, and 261,425,110 non-voting shares (Class B), with a nominal value of EUR 0.05 per share. |
| GRIFOLS, S.A. AND SUBSIDIARIES
Consolidated Interim Director’s Report for the year ended
December 31, 2023
5
Grifols ordinary shares (Class A) are listed on the Spanish Stock Market and form part of the IBEX-35 (GRF)
and non-voting shares (Class B) are listed on the Spanish Stock Market (GRF.P). Grifols Class A and B shares
are also listed on NASDAQ (GRFS) through ADRs (American Depositary Receipts).
The company continues the suspension of the cash dividend payment until debt is below 4x/EBITDA, as
announced in September 2021.
LIQUIDITY AND CAPITAL RESOURCES
The debt ratio dropped to 6.3x (5.4x pro forma considering the SRAAS divestment). Grifols is making progress
toward its goal of reaching 4x. The liquidity position totaled EUR 1,141 million, including a cash position of
EUR 526 million.
Cash flows from operating activities
In 2023, net cash flows from operating activities continued on their positive trend fueled by solid business
performance and the effective 100% implementation of the operational improvement plan announced at the
onset of 2023. Operating cash flows reached EUR 208 million (EUR 351 million excluding one-offs), compared
to the -EUR 11 million reported in 2022.
Cash flow from investing activities
Net cash flows from investment activities totaled -EUR 398 million, the most significant of which was capital
expenditures (CAPEX). These were focused primarily on Biopharma’s new production facilities, including
investments in the plasma fractionation, immunoglobulin purification and albumin plants in Montreal (Canada),
as well as in the new albumin plant in Dublin. Investments were also made in various IT and digitalization-related projects.
Cash flow from financing activities
Cash flow from financing activities totaled EUR 182 million.
Capital resources and credit ratings
On December 31, 2023, Grifols’ net financial debt was EUR 9,420 million, excluding the impact of IFRS 164
..
In 2023, the company has continued to actively reduce its debt ratio both organically and inorganically through
divestments of specific assets. As part of its inorganic debt reduction strategy, Grifols announced a strategic
alliance with Haier Group, which includes the sale of ~20% of SRAAS capital for USD 1,800 million.
As of December 2023, the company’s net financial debt to EBITDA ratio stood at 6.3x and at 5.4x pro forma
including the SRAAS divestment. The company is on track to meet its goal of reaching 4x.
4 At December 31, 2023, the impact of the application of IFRS 16 on debt is EUR 997 million. |
| GRIFOLS, S.A. AND SUBSIDIARIES
Consolidated Interim Director’s Report for the year ended
December 31, 2023
6
Furthermore, in 2023 Grifols continued to optimize its financial structure. At the close of this report, 59% of
Grifols’ debt is linked to fixed interest rates. While there are no significant debt maturities before 2025 and no
periodic financial covenants, this financial structure lessens the impact of interest rate rises.
Grifols expects to meet its 2025 debt maturities mainly by using the proceeds from the SRAAS divestment.
With the support of its main banks, the company has marked a clear path to fulfil its expected maturities, while
remaining steadfast in its pledge to meet its debt reduction targets.
CAPITAL EXPENDITURES (CAPEX) AND INDUSTRIAL ACTIVITY
In 2023, Grifols advanced its capital investment plan to expand and improve the production facilities of its
business units. The company has greatly optimized its CAPEX resource allocations considering the investments
already made in recent years. In 2023, capital expenditures stood at EUR 210 million (EUR 266 million in
20225
).
U.S.: FDA approves Clayton’s new purification and filling plant
The immunoglobulin (Gamunex® -C.) purification and filling plant in Clayton (North Carolina) received FDA
approval, giving the company the flexibility to expand operations as needed. With this plant, Grifols increases
its Gamunex production capacity by up to 16 million grams.
U.S.: new fractionation plant operational. +6 M liters of plasma/year
The new plasma fractionation plant in North Carolina, with a capacity to fractionate six million liters of plasma
per year, is now operational, giving Grifols an additional annual fractionation capacity of six million liters of
plasma equivalent.
Spain: construction under way of a topical fibrin and thrombin plant
Construction continued in 2023 on a fibrin adhesive and topical thrombin production plant in Barcelona, set to
increase production capacity to 3.3 million liters of plasma equivalent per year for the production of fibrin
adhesive and 6.4 million liters of plasma equivalent per year for the production of topical thrombin.
Ireland: new albumin purification plant
Grifols inaugurated its new sterile albumin purification dosing and filling plant in Dublin in flexible packaging,
quadrupling its capacity for filling albumin in this format. The installation incorporates the latest eco-efficiency
technologies to save energy and water, testament to Grifols’ leadership in industrial design and engineering.
Canada: fractionation and purification facilities upgrade
Upgrades continue on Grifols’ industrial facilities in Quebec (Canada), which include a fractionation plant with
a capacity of 1.5 million liters of plasma per year and two purification plants.
5 For comparison purposes, figure reported in 2022 (EUR 297m) differs following a change of criteria in 2023 as software is not
considered CAPEX anymore |
| GRIFOLS, S.A. AND SUBSIDIARIES
Consolidated Interim Director’s Report for the year ended
December 31, 2023
7
CORPORATE TRANSACTIONS AND ACQUISITIONS
Strategic alliance with Haier Group
In December 2023, Grifols announced a Strategic Alliance and Share Purchase Agreement with Haier Group
Corporation ("Haier") for the sale of approximately a 20% equity stake in SRAAS in exchange for RMB 12.5
billion (approximately US$ 1.8 billion), while retaining a stake in SRAAS of 6.58%. The current commercial
strategic collaboration arrangements between Grifols and SRAAS remain in place. The parties have agreed that
Grifols will keep one board member at SRAAS' Board of Directors.
Through a share purchase agreement, Grifols will sell approximately 20% of its stake in SRAAS to Haier for
RMB 12,500 million (USD 1,800 million) in cash at a share price of RMB 9.405. Grifols will continue to hold
a significant ~6.6% stake in SRAAS, as well as a member on its board of directors.
Grifols and SRAAS will amend the existing Exclusive Distribution Agreement of human serum Albumin to the
Chinese market entered into with SRAAS to extend its current term for an initial period of 10 years (until 2034),
having SRAAS the option to extend for an additional 10 year period, with guaranteed minimum supply volumes
for 2024-2028 period. Demand for albumin in China is expected to continue to grow significantly in the coming
years. It currently accounts for more than 50% of global albumin consumption.
The closing of this transaction is subject to customary closing conditions, including regulatory approvals.
CORPORATE GOVERNANCE
Thomas Glanzmann appointed new CEO
In February 2023, Grifols’ Board of Directors appointed Thomas Glanzmann as Grifols’ new Executive
Chairperson, following the resignation of Steve F. Mayer for personal and health reasons. The new chairperson
has been a Grifols board member for more than 16 years and vice chairperson since 2017, in addition to chairing
Grifols’ Sustainability Committee since 2020.
Reinforcing corporate governance with the creation of SELT
In the first quarter of 2023, Grifols also made changes to its executive governance bodies. Grifols’ Board of
Directors streamlined the functions of Executive Chairperson and Chief Executive Officer (CEO), both now
led by Thomas Glanzmann, while the position of Co-CEO has evolved into the Senior Executive Leadership
Team (SELT), led by Mr. Glanzmann and comprising Raimon Grifols, Chief Corporate Officer (CCO); Víctor
Grifols Deu, Chief Operating Officer (COO); and Alfredo Arroyo, Chief Financial Officer (CFO).
The SELT’s areas of responsibility include capital allocation, strategy definition, communication, human
resources policies, business performance and oversight of key projects and priorities. |
| GRIFOLS, S.A. AND SUBSIDIARIES
Consolidated Interim Director’s Report for the year ended
December 31, 2023
8
New leadership and management team
Grifols requires a robust team and strong leadership to fully realize its potential and consolidate its standing as
a global powerhouse in the plasma industry. To this effect, Grifols appointed two new senior executives in the
third quarter.
Dr. Jörg Schüttrumpf was appointed Chief Scientific Innovation Officer (CSIO) and will focus on accelerating
the development of differentiated plasma and non-plasma medicines in key therapeutic areas, building on
Grifols’ strong innovation portfolio.
Miguel Louzan was named Chief Digital Information Officer (CDIO) to lead digital and data transformation,
focusing his work on accelerating the company’s use of digital platforms and new technologies to transform
and reinforce critical business activities such as plasma donor and customer relationships, manufacturing
operations, new therapy development and cybersecurity.
AGREEMENTS
Termination of the labor force reduction plan at Grifols S.A.
On March 31, Grifols S.A.’s labor force reduction plan (ERE) in Spain came to an end. This was implemented
as part of the Operational improvement plan. The final agreement reached in Spain with the employees’ legal
representatives has reduced the number of affected employees from 92 to 51.
Agreement to guarantee plasma supply in Canada
At the close of the second quarter of 2023, Grifols announced an agreement with the local company Canadian
Plasma Resources (CPR) to obtain plasma donated at its centers. This agreement, together with the plan to set
up its own network of plasma donation centers in Canada, will enable Grifols to fulfill its commitment to
Canadian Blood Services (CBS).
Specifically, in September 2022, Grifols announced a partnership with Canadian Blood Services (CBS) to form
an all-Canadian supply chain with the goal of progressively reaching the plasma volumes needed to produce
2.4 million grams of immunoglobulin per year by 2026, helping propel the country forward in essential plasma
medicine self-sufficiency.
INNOVATION
Grifols makes further strides in innovation
Grifols’ innovation pipeline continues to make solid progress focusing on lifecycle management and new
indications. Fueled by internal research and external innovation, the company achieved all its milestones set for
2023, including the completion of patient enrollment for the PRECIOSA and SPARTA studies, and the
successful completion of the GigaGen GIGA564 and GIGA2339 trials.
Biotest trials also continue gaining ground. In February 2024, Grifols announced positive results from Biotest’s
Phase 3 clinical trial for fibrinogen concentrate, marking significant headway in treating acquired fibrinogen |
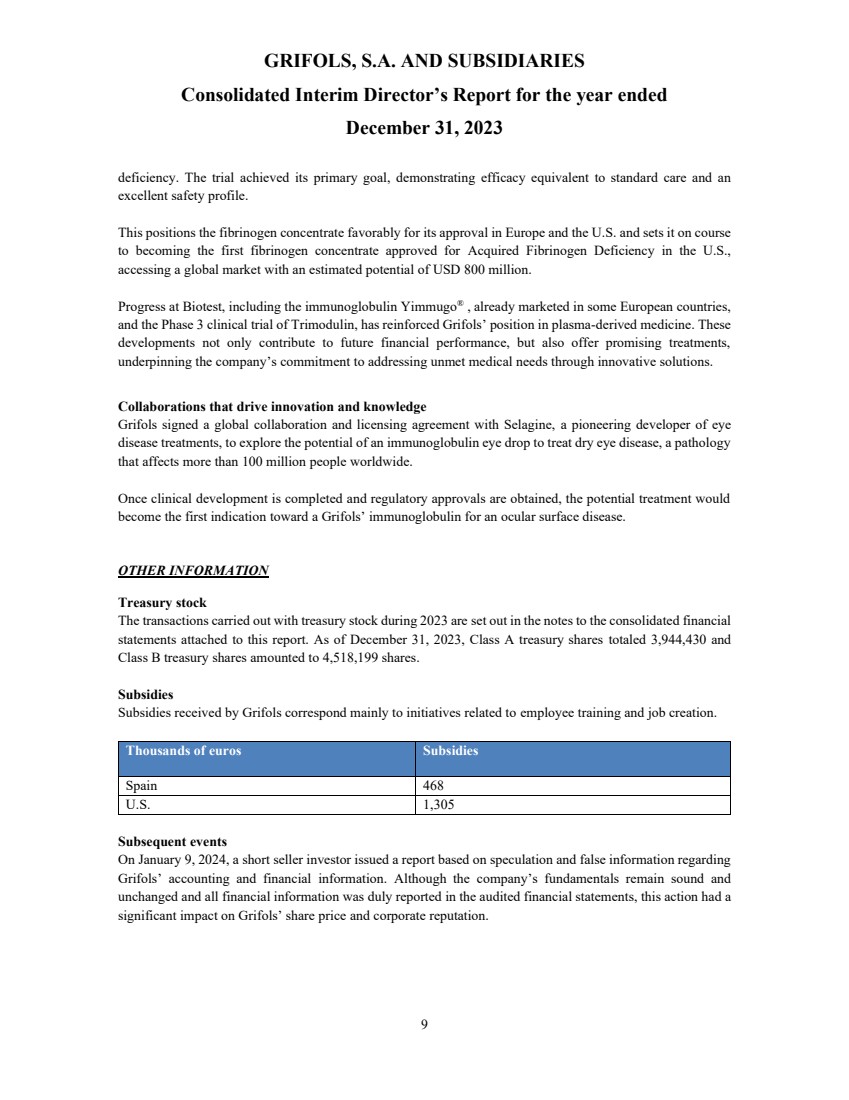
| GRIFOLS, S.A. AND SUBSIDIARIES
Consolidated Interim Director’s Report for the year ended
December 31, 2023
9
deficiency. The trial achieved its primary goal, demonstrating efficacy equivalent to standard care and an
excellent safety profile.
This positions the fibrinogen concentrate favorably for its approval in Europe and the U.S. and sets it on course
to becoming the first fibrinogen concentrate approved for Acquired Fibrinogen Deficiency in the U.S.,
accessing a global market with an estimated potential of USD 800 million.
Progress at Biotest, including the immunoglobulin Yimmugo® , already marketed in some European countries,
and the Phase 3 clinical trial of Trimodulin, has reinforced Grifols’ position in plasma-derived medicine. These
developments not only contribute to future financial performance, but also offer promising treatments,
underpinning the company’s commitment to addressing unmet medical needs through innovative solutions.
Collaborations that drive innovation and knowledge
Grifols signed a global collaboration and licensing agreement with Selagine, a pioneering developer of eye
disease treatments, to explore the potential of an immunoglobulin eye drop to treat dry eye disease, a pathology
that affects more than 100 million people worldwide.
Once clinical development is completed and regulatory approvals are obtained, the potential treatment would
become the first indication toward a Grifols’ immunoglobulin for an ocular surface disease.
OTHER INFORMATION
Treasury stock
The transactions carried out with treasury stock during 2023 are set out in the notes to the consolidated financial
statements attached to this report. As of December 31, 2023, Class A treasury shares totaled 3,944,430 and
Class B treasury shares amounted to 4,518,199 shares.
Subsidies
Subsidies received by Grifols correspond mainly to initiatives related to employee training and job creation.
Thousands of euros Subsidies
Spain 468
U.S. 1,305
Subsequent events
On January 9, 2024, a short seller investor issued a report based on speculation and false information regarding
Grifols’ accounting and financial information. Although the company’s fundamentals remain sound and
unchanged and all financial information was duly reported in the audited financial statements, this action had a
significant impact on Grifols’ share price and corporate reputation. |
| GRIFOLS, S.A. AND SUBSIDIARIES
Consolidated Interim Director’s Report for the year ended
December 31, 2023
10
The company is currently working to restore the confidence of markets, shareholders and other stakeholders in
three key areas:
• Communication and collaboration with the Spanish regulator (CNMV).
Transparent communication with all our stakeholders: sharing our clear response to the published
report through live conference calls and multiple official communications on the company’s website
and on the CNMV portal. All press releases are publicly available on Grifols’ website
(https://www.grifols.com/es/informacion-relevante).
• Clear and transparent communication with our teams and employee representatives, including major
unions.
• Reinforced communication with investors, official communications, direct phone calls, video calls and
e-mails.
• The company filed a complaint6
in the United States District Court for the Southern District of New
York against Daniel Yu, Gotham City Research LLC, General Industrial Partners LLP, Cyrus de
Weck, and their affiliates to claim for the financial and reputational damages caused to Grifols and
their stakeholders as a result of the defendants’ actions.
• The company established a working group comprising senior managers from the legal,
communications, finance, investor relations and management teams, together with external advisors
with expertise in communications.
Foreseeable evolution of the group
Grifols boasts strong fundamentals and a clear strategy to strengthen its position in the future. The foundations
for the company’s roadmap for the coming years include: maintaining a focus on its core areas by driving the
company’s growth through Biopharma, Diagnostic and Bio Supplies; spearheading innovation through a
product portfolio with a high competitive and differential advantage; advancing in the process of global
expansion in existing and new markets, through new alliances and disruptive business models; enhancing the
donor experience to meet their needs; and continuing to optimize operations and efficiencies, making greater
use of new technologies and digitization.
In parallel, Grifols continues to focus on talent development reflected in the continuous training of its
workforce; promoting cross-cutting initiatives and teams; and strengthening its leadership, which led to a
reorganization in its senior management team. Finally, promoting sustainability continues to be the cornerstone
of Grifols’ long-term business model with environmental, social and corporate governance (ESG) at its core.
In its quest for sustainable growth and further strengthening its robust industry status, the company conducted
an in-depth analysis of its business areas and functions, evaluating opportunities for greater organizational
6 Official communication on the lawsuit filed:
https://www.cnmv.es/webservices/verdocumento/ver?t=%7b3498d0f6-c93e-4f95-8add-001b02c1cf28%7d |
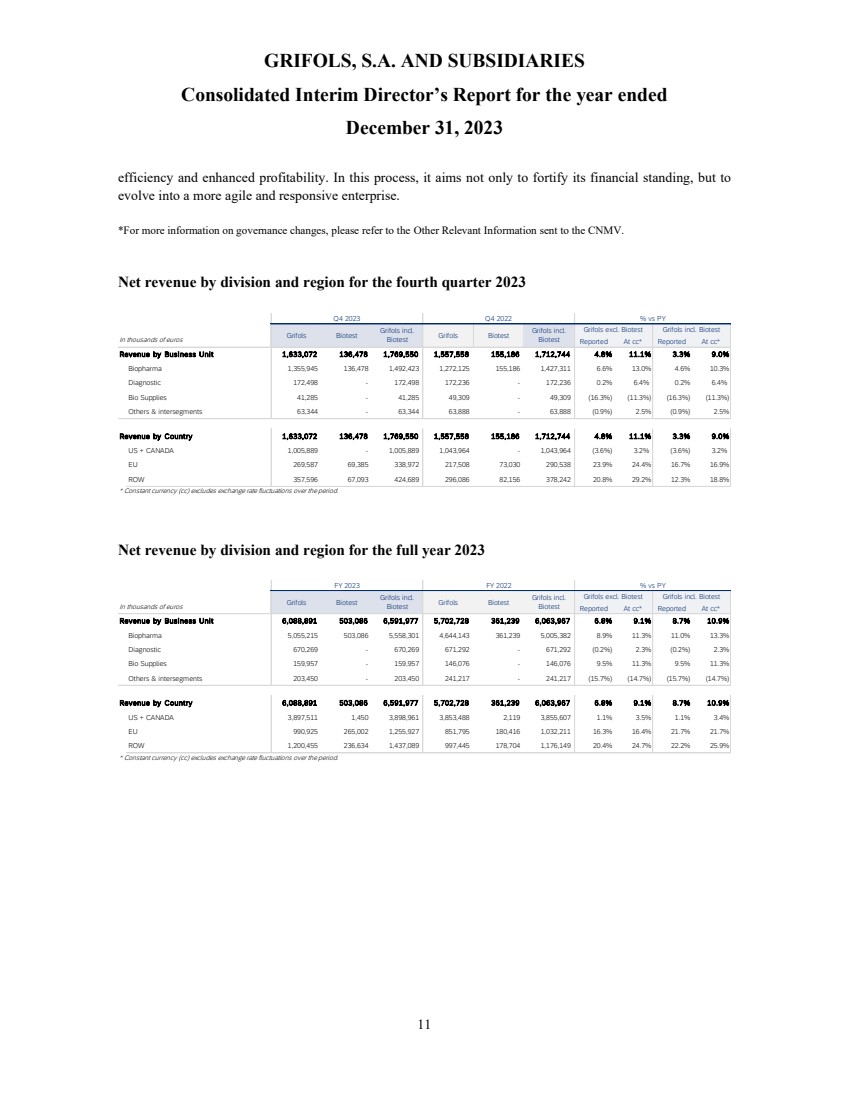
| GRIFOLS, S.A. AND SUBSIDIARIES
Consolidated Interim Director’s Report for the year ended
December 31, 2023
11
efficiency and enhanced profitability. In this process, it aims not only to fortify its financial standing, but to
evolve into a more agile and responsive enterprise.
*For more information on governance changes, please refer to the Other Relevant Information sent to the CNMV.
Net revenue by division and region for the fourth quarter 2023
Net revenue by division and region for the full year 2023
In thousands of euros Reported At cc* Reported At cc*
Revenue by Business Unit 1,633,072 136,478 1,769,550 1,557,558 155,186 1,712,744 4.8% 11.1% 3.3% 9.0%
Biopharma 1,355,945 136,478 1,492,423 1,272,125 155,186 1,427,311 6.6% 13.0% 4.6% 10.3%
Diagnostic 172,498 - 172,498 172,236 - 172,236 0.2% 6.4% 0.2% 6.4%
Bio Supplies 41,285 - 41,285 49,309 - 49,309 (16.3%) (11.3%) (16.3%) (11.3%)
Others & intersegments 63,344 - 63,344 63,888 - 63,888 (0.9%) 2.5% (0.9%) 2.5%
Revenue by Country 1,633,072 136,478 1,769,550 1,557,558 155,186 1,712,744 4.8% 11.1% 3.3% 9.0%
US + CANADA 1,005,889 - 1,005,889 1,043,964 - 1,043,964 (3.6%) 3.2% (3.6%) 3.2%
E U 269,587 69,385 338,972 217,508 73,030 290,538 23.9% 24.4% 16.7% 16.9%
ROW 357,596 67,093 424,689 296,086 82,156 378,242 20.8% 29.2% 12.3% 18.8%
* Constant currency (cc) excludes exchange rate fluctuations over the period.
Q4 2023 % vs PY
Grifols Biotest Grifols incl.
Biotest
Q4 2022
Grifols Biotest Grifols incl. Grifols excl. Biotest Grifols incl. Biotest
Biotest In thousands of euros Reported At cc* Reported At cc*
Revenue by Business Unit 6,088,891 503,086 6,591,977 5,702,728 361,239 6,063,967 6.8% 9.1% 8.7% 10.9%
Biopharma 5,055,215 503,086 5,558,301 4,644,143 361,239 5,005,382 8.9% 11.3% 11.0% 13.3%
Diagnostic 670,269 - 670,269 671,292 - 671,292 (0.2%) 2.3% (0.2%) 2.3%
Bio Supplies 159,957 - 159,957 146,076 - 146,076 9.5% 11.3% 9.5% 11.3%
Others & intersegments 203,450 - 203,450 241,217 - 241,217 (15.7%) (14.7%) (15.7%) (14.7%)
Revenue by Country 6,088,891 503,086 6,591,977 5,702,728 361,239 6,063,967 6.8% 9.1% 8.7% 10.9%
US + CANADA 3,897,511 1,450 3,898,961 3,853,488 2,119 3,855,607 1.1% 3.5% 1.1% 3.4%
E U 990,925 265,002 1,255,927 851,795 180,416 1,032,211 16.3% 16.4% 21.7% 21.7%
ROW 1,200,455 236,634 1,437,089 997,445 178,704 1,176,149 20.4% 24.7% 22.2% 25.9%
* Constant currency (cc) excludes exchange rate fluctuations over the period.
FY 2023 FY 2022 % vs PY
Grifols incl.
Biotest
Grifols excl. Biotest Grifols incl. Biotest Grifols Biotest Grifols incl.
Biotest Grifols Biotest |
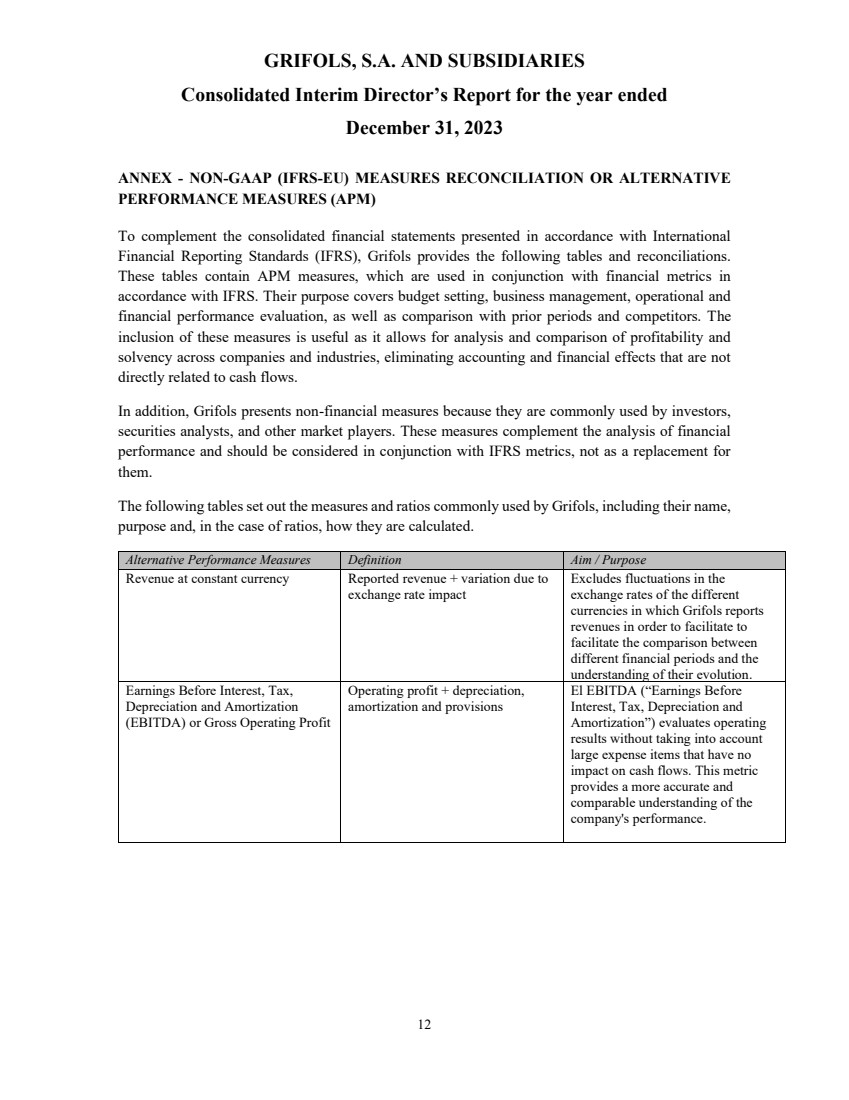
| GRIFOLS, S.A. AND SUBSIDIARIES
Consolidated Interim Director’s Report for the year ended
December 31, 2023
12
ANNEX - NON-GAAP (IFRS-EU) MEASURES RECONCILIATION OR ALTERNATIVE
PERFORMANCE MEASURES (APM)
To complement the consolidated financial statements presented in accordance with International
Financial Reporting Standards (IFRS), Grifols provides the following tables and reconciliations.
These tables contain APM measures, which are used in conjunction with financial metrics in
accordance with IFRS. Their purpose covers budget setting, business management, operational and
financial performance evaluation, as well as comparison with prior periods and competitors. The
inclusion of these measures is useful as it allows for analysis and comparison of profitability and
solvency across companies and industries, eliminating accounting and financial effects that are not
directly related to cash flows.
In addition, Grifols presents non-financial measures because they are commonly used by investors,
securities analysts, and other market players. These measures complement the analysis of financial
performance and should be considered in conjunction with IFRS metrics, not as a replacement for
them.
The following tables set out the measures and ratios commonly used by Grifols, including their name,
purpose and, in the case of ratios, how they are calculated.
Alternative Performance Measures Definition Aim / Purpose
Revenue at constant currency Reported revenue + variation due to
exchange rate impact
Excludes fluctuations in the
exchange rates of the different
currencies in which Grifols reports
revenues in order to facilitate to
facilitate the comparison between
different financial periods and the
understanding of their evolution.
Earnings Before Interest, Tax,
Depreciation and Amortization
(EBITDA) or Gross Operating Profit
Operating profit + depreciation,
amortization and provisions
El EBITDA (“Earnings Before
Interest, Tax, Depreciation and
Amortization”) evaluates operating
results without taking into account
large expense items that have no
impact on cash flows. This metric
provides a more accurate and
comparable understanding of the
company's performance. |
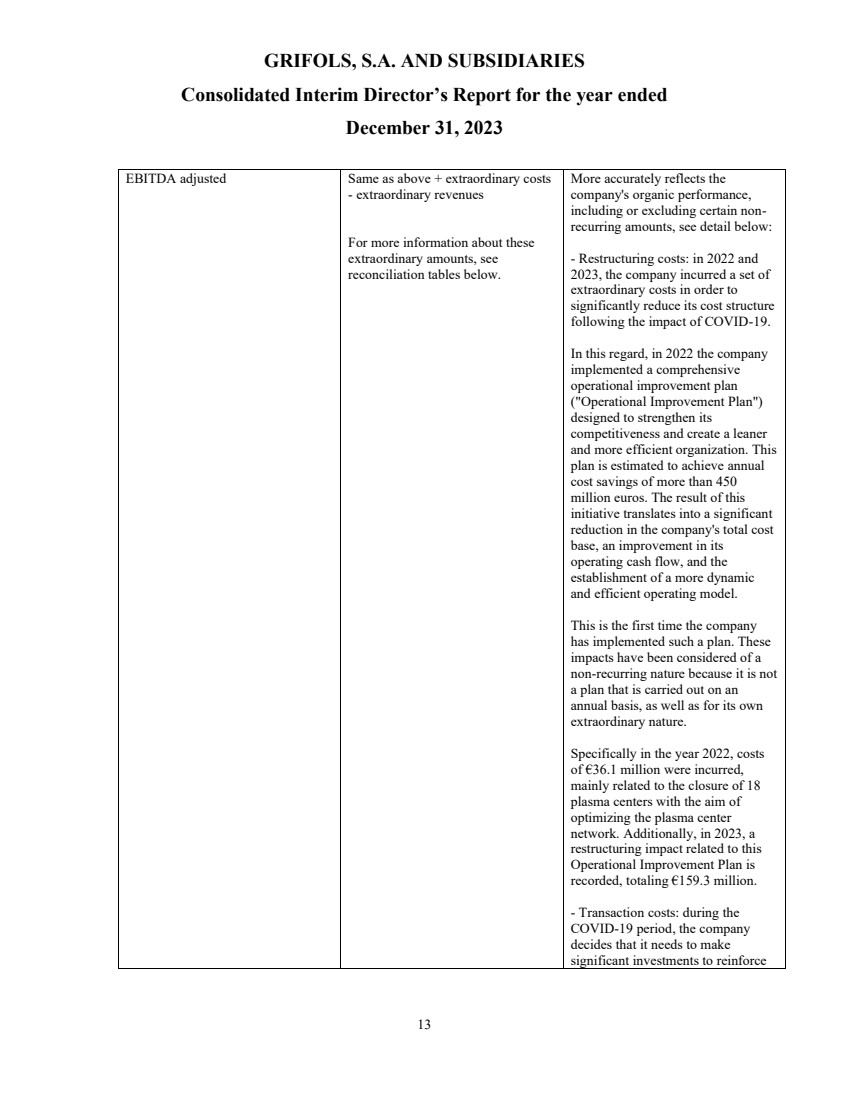
| GRIFOLS, S.A. AND SUBSIDIARIES
Consolidated Interim Director’s Report for the year ended
December 31, 2023
13
EBITDA adjusted Same as above + extraordinary costs
- extraordinary revenues
For more information about these
extraordinary amounts, see
reconciliation tables below.
More accurately reflects the
company's organic performance,
including or excluding certain non-recurring amounts, see detail below:
- Restructuring costs: in 2022 and
2023, the company incurred a set of
extraordinary costs in order to
significantly reduce its cost structure
following the impact of COVID-19.
In this regard, in 2022 the company
implemented a comprehensive
operational improvement plan
("Operational Improvement Plan")
designed to strengthen its
competitiveness and create a leaner
and more efficient organization. This
plan is estimated to achieve annual
cost savings of more than 450
million euros. The result of this
initiative translates into a significant
reduction in the company's total cost
base, an improvement in its
operating cash flow, and the
establishment of a more dynamic
and efficient operating model.
This is the first time the company
has implemented such a plan. These
impacts have been considered of a
non-recurring nature because it is not
a plan that is carried out on an
annual basis, as well as for its own
extraordinary nature.
Specifically in the year 2022, costs
of €36.1 million were incurred,
mainly related to the closure of 18
plasma centers with the aim of
optimizing the plasma center
network. Additionally, in 2023, a
restructuring impact related to this
Operational Improvement Plan is
recorded, totaling €159.3 million.
- Transaction costs: during the
COVID-19 period, the company
decides that it needs to make
significant investments to reinforce |

| GRIFOLS, S.A. AND SUBSIDIARIES
Consolidated Interim Director’s Report for the year ended
December 31, 2023
14
its innovation, specifically its R&D
product portfolio. In this sense,
Grifols acquires Biotest in
September 2021 and closes the
acquisition in April 2022. The
objective of this transaction is based
on acquiring two new key proteins
for its portfolio that will contribute
to improving profitability and
plasma liter revenues. In addition to
enhancing its economic
performance, this transaction will
contribute to expanding and
diversifying Grifols' plasma supply;
it will strengthen its operations and
revenues in Europe, the Middle East,
and Africa.
Related to the execution of this
transformative and, therefore,
extraordinary strategic operation,
costs are incurred in 2022, primarily
representing transaction costs
adjusted to EBITDA in this fiscal
year.
In 2023, transaction costs are related
to the strategic transaction in China
with Haier Group, through which it
will sell approximately a 20% stake
in Shanghai RAAS to Haier for
approximately USD 1.8 billion. The
extraordinary nature of this
transaction must be taken into
account in the context of the
company's leverage.
-Diagnostic commercial true-up:
excludes the extraordinary impact
related to revenue recognized as a
result of winning a litigation with a
customer in the Diagnostics business
unit in the first half of 2023.
-Impairments: in 2022, it refers to an
impairment in the Diagnostic
Business unit, and in 2023 it refers to
an impairment in “Others” business
unit. |
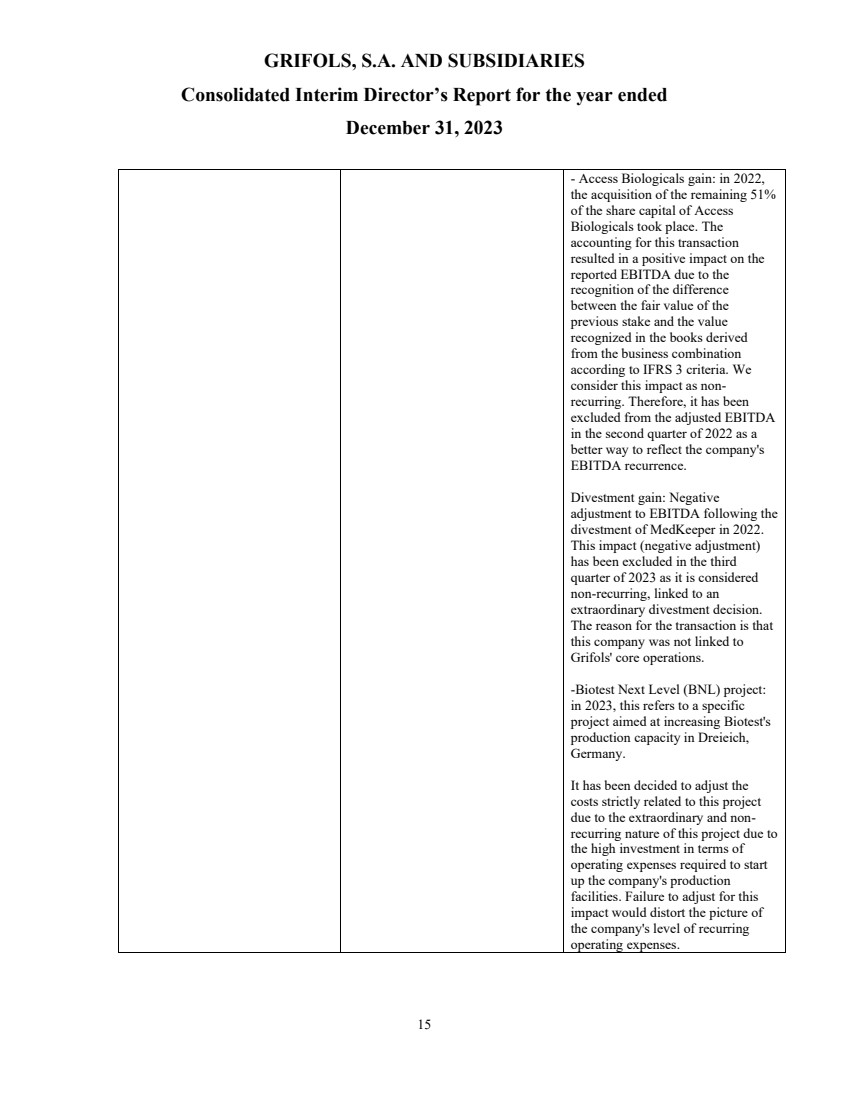
| GRIFOLS, S.A. AND SUBSIDIARIES
Consolidated Interim Director’s Report for the year ended
December 31, 2023
15
- Access Biologicals gain: in 2022,
the acquisition of the remaining 51%
of the share capital of Access
Biologicals took place. The
accounting for this transaction
resulted in a positive impact on the
reported EBITDA due to the
recognition of the difference
between the fair value of the
previous stake and the value
recognized in the books derived
from the business combination
according to IFRS 3 criteria. We
consider this impact as non-recurring. Therefore, it has been
excluded from the adjusted EBITDA
in the second quarter of 2022 as a
better way to reflect the company's
EBITDA recurrence.
Divestment gain: Negative
adjustment to EBITDA following the
divestment of MedKeeper in 2022.
This impact (negative adjustment)
has been excluded in the third
quarter of 2023 as it is considered
non-recurring, linked to an
extraordinary divestment decision.
The reason for the transaction is that
this company was not linked to
Grifols' core operations.
-Biotest Next Level (BNL) project:
in 2023, this refers to a specific
project aimed at increasing Biotest's
production capacity in Dreieich,
Germany.
It has been decided to adjust the
costs strictly related to this project
due to the extraordinary and non-recurring nature of this project due to
the high investment in terms of
operating expenses required to start
up the company's production
facilities. Failure to adjust for this
impact would distort the picture of
the company's level of recurring
operating expenses. |
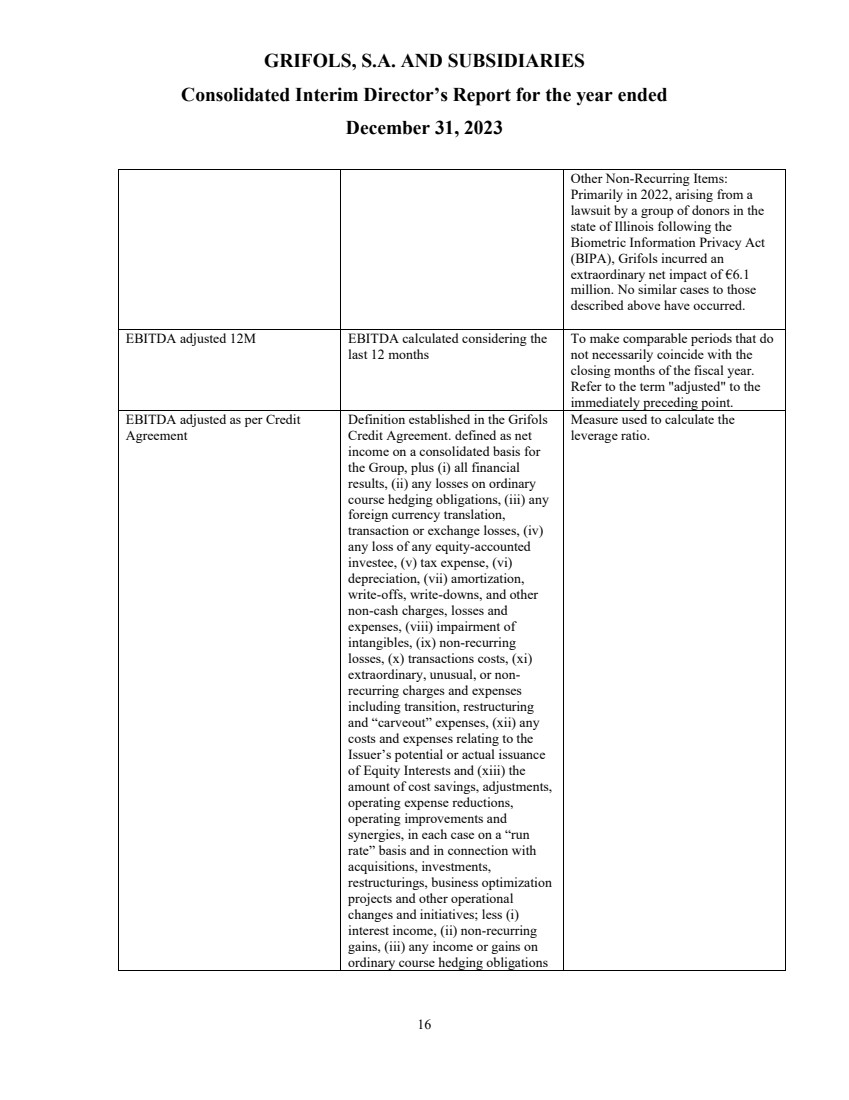
| GRIFOLS, S.A. AND SUBSIDIARIES
Consolidated Interim Director’s Report for the year ended
December 31, 2023
16
Other Non-Recurring Items:
Primarily in 2022, arising from a
lawsuit by a group of donors in the
state of Illinois following the
Biometric Information Privacy Act
(BIPA), Grifols incurred an
extraordinary net impact of €6.1
million. No similar cases to those
described above have occurred.
EBITDA adjusted 12M EBITDA calculated considering the
last 12 months
To make comparable periods that do
not necessarily coincide with the
closing months of the fiscal year.
Refer to the term "adjusted" to the
immediately preceding point.
EBITDA adjusted as per Credit
Agreement
Definition established in the Grifols
Credit Agreement. defined as net
income on a consolidated basis for
the Group, plus (i) all financial
results, (ii) any losses on ordinary
course hedging obligations, (iii) any
foreign currency translation,
transaction or exchange losses, (iv)
any loss of any equity-accounted
investee, (v) tax expense, (vi)
depreciation, (vii) amortization,
write-offs, write-downs, and other
non-cash charges, losses and
expenses, (viii) impairment of
intangibles, (ix) non-recurring
losses, (x) transactions costs, (xi)
extraordinary, unusual, or non-recurring charges and expenses
including transition, restructuring
and “carveout” expenses, (xii) any
costs and expenses relating to the
Issuer’s potential or actual issuance
of Equity Interests and (xiii) the
amount of cost savings, adjustments,
operating expense reductions,
operating improvements and
synergies, in each case on a “run
rate” basis and in connection with
acquisitions, investments,
restructurings, business optimization
projects and other operational
changes and initiatives; less (i)
interest income, (ii) non-recurring
gains, (iii) any income or gains on
ordinary course hedging obligations
Measure used to calculate the
leverage ratio. |
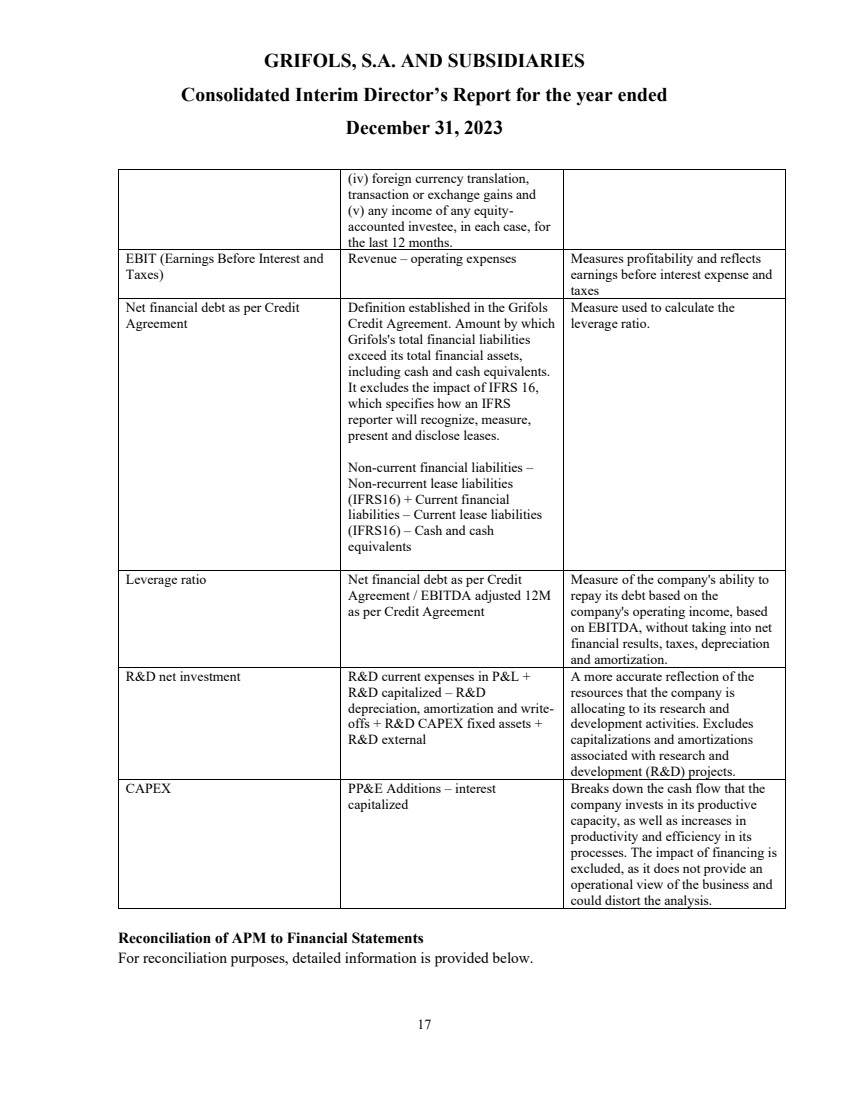
| GRIFOLS, S.A. AND SUBSIDIARIES
Consolidated Interim Director’s Report for the year ended
December 31, 2023
17
(iv) foreign currency translation,
transaction or exchange gains and
(v) any income of any equity-accounted investee, in each case, for
the last 12 months.
EBIT (Earnings Before Interest and
Taxes)
Revenue – operating expenses Measures profitability and reflects
earnings before interest expense and
taxes
Net financial debt as per Credit
Agreement
Definition established in the Grifols
Credit Agreement. Amount by which
Grifols's total financial liabilities
exceed its total financial assets,
including cash and cash equivalents.
It excludes the impact of IFRS 16,
which specifies how an IFRS
reporter will recognize, measure,
present and disclose leases.
Non-current financial liabilities –
Non-recurrent lease liabilities
(IFRS16) + Current financial
liabilities – Current lease liabilities
(IFRS16) – Cash and cash
equivalents
Measure used to calculate the
leverage ratio.
Leverage ratio Net financial debt as per Credit
Agreement / EBITDA adjusted 12M
as per Credit Agreement
Measure of the company's ability to
repay its debt based on the
company's operating income, based
on EBITDA, without taking into net
financial results, taxes, depreciation
and amortization.
R&D net investment R&D current expenses in P&L +
R&D capitalized – R&D
depreciation, amortization and write-offs + R&D CAPEX fixed assets +
R&D external
A more accurate reflection of the
resources that the company is
allocating to its research and
development activities. Excludes
capitalizations and amortizations
associated with research and
development (R&D) projects.
CAPEX PP&E Additions – interest
capitalized
Breaks down the cash flow that the
company invests in its productive
capacity, as well as increases in
productivity and efficiency in its
processes. The impact of financing is
excluded, as it does not provide an
operational view of the business and
could distort the analysis.
Reconciliation of APM to Financial Statements
For reconciliation purposes, detailed information is provided below. |
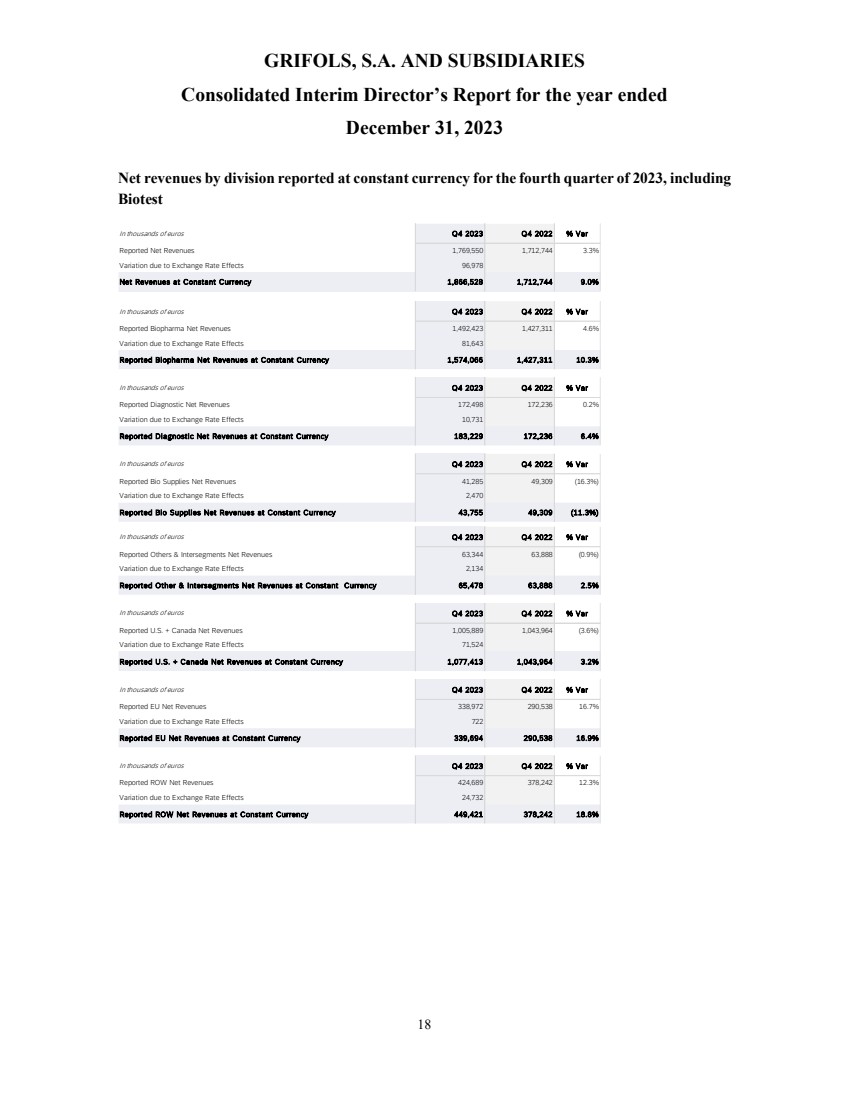
| GRIFOLS, S.A. AND SUBSIDIARIES
Consolidated Interim Director’s Report for the year ended
December 31, 2023
18
Net revenues by division reported at constant currency for the fourth quarter of 2023, including
Biotest
In thousands of euros Q4 2023 Q4 2022 % Var
Reported Net Revenues 1,769,550 1,712,744 3.3%
Variation due to Exchange Rate Effects 96,978
Net Revenues at Constant Currency 1,866,528 1,712,744 9.0%
In thousands of euros Q4 2023 Q4 2022 % Var
Reported Biopharma Net Revenues 1,492,423 1,427,311 4.6%
Variation due to Exchange Rate Effects 81,643
Reported Biopharma Net Revenues at Constant Currency 1,574,066 1,427,311 10.3%
In thousands of euros Q4 2023 Q4 2022 % Var
Reported Diagnostic Net Revenues 172,498 172,236 0.2%
Variation due to Exchange Rate Effects 10,731
Reported Diagnostic Net Revenues at Constant Currency 183,229 172,236 6.4%
In thousands of euros Q4 2023 Q4 2022 % Var
Reported Bio Supplies Net Revenues 41,285 49,309 (16.3%)
Variation due to Exchange Rate Effects 2,470
Reported Bio Supplies Net Revenues at Constant Currency 43,755 49,309 (11.3%)
In thousands of euros Q4 2023 Q4 2022 % Var
Reported Others & Intersegments Net Revenues 63,344 63,888 (0.9%)
Variation due to Exchange Rate Effects 2,134
Reported Other & Intersegments Net Revenues at Constant Currency 65,478 63,888 2.5%
In thousands of euros Q4 2023 Q4 2022 % Var
Reported U.S. + Canada Net Revenues 1,005,889 1,043,964 (3.6%)
Variation due to Exchange Rate Effects 71,524
Reported U.S. + Canada Net Revenues at Constant Currency 1,077,413 1,043,964 3.2%
In thousands of euros Q4 2023 Q4 2022 % Var
Reported EU Net Revenues 338,972 290,538 16.7%
Variation due to Exchange Rate Effects 722
Reported EU Net Revenues at Constant Currency 339,694 290,538 16.9%
In thousands of euros Q4 2023 Q4 2022 % Var
Reported ROW Net Revenues 424,689 378,242 12.3%
Variation due to Exchange Rate Effects 24,732
Reported ROW Net Revenues at Constant Currency 449,421 378,242 18.8% |

| GRIFOLS, S.A. AND SUBSIDIARIES
Consolidated Interim Director’s Report for the year ended
December 31, 2023
19
Net revenues by division reported at constant currency for the fourth quarter of 2023, excluding
Biotest
In thousands of euros Q4 2023 Q4 2022 % Var
Reported Net Revenues 1,633,072 1,557,558 4.8%
Variation due to Exchange Rate Effects 97,335
Net Revenues at Constant Currency 1,730,407 1,557,558 11.1%
In thousands of euros Q4 2023 Q4 2022 % Var
Reported Biopharma Revenues 1,355,945 1,272,125 6.6%
Variation due to Exchange Rate Effects 82,000
Reported Biopharma Net Revenues at Constant Currency 1,437,945 1,272,125 13.0%
In thousands of euros Q4 2023 Q4 2022 % Var
Reported U.S. + Canada Net Revenues 1,005,889 1,043,964 (3.6%)
Variation due to Exchange Rate Effects 71,524
Reported U.S. + Canada Net Revenues at Constant Currency 1,077,413 1,043,964 3.2%
In thousands of euros Q4 2023 Q4 2022 % Var
Reported EU Net Revenues 269,587 217,508 23.9%
Variation due to Exchange Rate Effects 978
Reported EU Net Revenues at Constant Currency 270,565 217,508 24.4%
In thousands of euros Q4 2023 Q4 2022 % Var
Reported ROW Net Revenues 357,596 296,086 20.8%
Variation due to Exchange Rate Effects 24,833
Reported ROW Net Revenues at Constant Currency 382,429 296,086 29.2% |

| GRIFOLS, S.A. AND SUBSIDIARIES
Consolidated Interim Director’s Report for the year ended
December 31, 2023
20
Net revenues by division reported at constant currency for the full year 2023, including Biotest
In thousands of euros 2023 2022 % Var
Reported Net Revenues 6,591,977 6,063,967 8.7%
Variation due to Exchange Rate Effects 133,610
Net Revenues at Constant Currency 6,725,587 6,063,967 10.9%
In thousands of euros 2023 2022 % Var
Reported Biopharma Net Revenues 5,558,301 5,005,382 11.0%
Variation due to Exchange Rate Effects 112,083
Reported Biopharma Net Revenues at Constant Currency 5,670,384 5,005,382 13.3%
In thousands of euros 2023 2022 % Var
Reported Diagnostic Net Revenues 670,269 671,292 (0.2%)
Variation due to Exchange Rate Effects 16,517
Reported Diagnostic Net Revenues at Constant Currency 686,786 671,292 2.3%
In thousands of euros 2023 2022 % Var
Reported Bio Supplies Net Revenues 159,957 146,076 9.5%
Variation due to Exchange Rate Effects 2,655
Reported Bio Supplies Net Revenues at Constant Currency 162,612 146,076 11.3%
In thousands of euros 2023 2022 % Var
Reported Others & Intersegments Net Revenues 203,450 241,217 (15.7%)
Variation due to Exchange Rate Effects 2,354
Reported Other & Intersegments Net Revenues at Constant Currency 205,804 241,217 (14.7%)
In thousands of euros 2023 2022 % Var
Reported U.S. + Canada Net Revenues 3,898,961 3,855,607 1.1%
Variation due to Exchange Rate Effects 88,993
Reported U.S. + Canada Net Revenues at Constant Currency 3,987,954 3,855,607 3.4%
In thousands of euros 2023 2022 % Var
Reported EU Net Revenues 1,255,927 1,032,211 21.7%
Variation due to Exchange Rate Effects 749
Reported EU Net Revenues at Constant Currency 1,256,676 1,032,211 21.7%
In thousands of euros 2023 2022 % Var
Reported ROW Net Revenues 1,437,089 1,176,149 22.2%
Variation due to Exchange Rate Effects 43,868
Reported ROW Net Revenues at Constant Currency 1,480,957 1,176,149 25.9% |
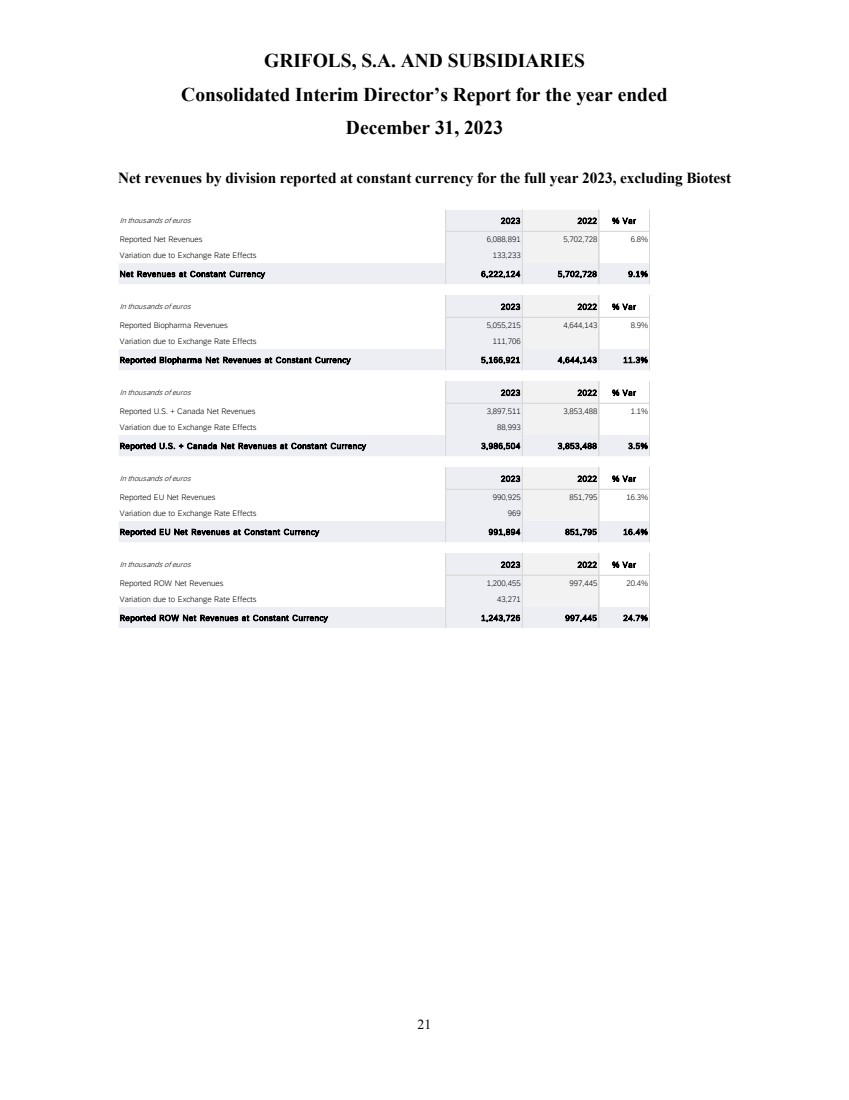
| GRIFOLS, S.A. AND SUBSIDIARIES
Consolidated Interim Director’s Report for the year ended
December 31, 2023
21
Net revenues by division reported at constant currency for the full year 2023, excluding Biotest
In thousands of euros 2023 2022 % Var
Reported Net Revenues 6,088,891 5,702,728 6.8%
Variation due to Exchange Rate Effects 133,233
Net Revenues at Constant Currency 6,222,124 5,702,728 9.1%
In thousands of euros 2023 2022 % Var
Reported Biopharma Revenues 5,055,215 4,644,143 8.9%
Variation due to Exchange Rate Effects 111,706
Reported Biopharma Net Revenues at Constant Currency 5,166,921 4,644,143 11.3%
In thousands of euros 2023 2022 % Var
Reported U.S. + Canada Net Revenues 3,897,511 3,853,488 1.1%
Variation due to Exchange Rate Effects 88,993
Reported U.S. + Canada Net Revenues at Constant Currency 3,986,504 3,853,488 3.5%
In thousands of euros 2023 2022 % Var
Reported EU Net Revenues 990,925 851,795 16.3%
Variation due to Exchange Rate Effects 969
Reported EU Net Revenues at Constant Currency 991,894 851,795 16.4%
In thousands of euros 2023 2022 % Var
Reported ROW Net Revenues 1,200,455 997,445 20.4%
Variation due to Exchange Rate Effects 43,271
Reported ROW Net Revenues at Constant Currency 1,243,726 997,445 24.7% |
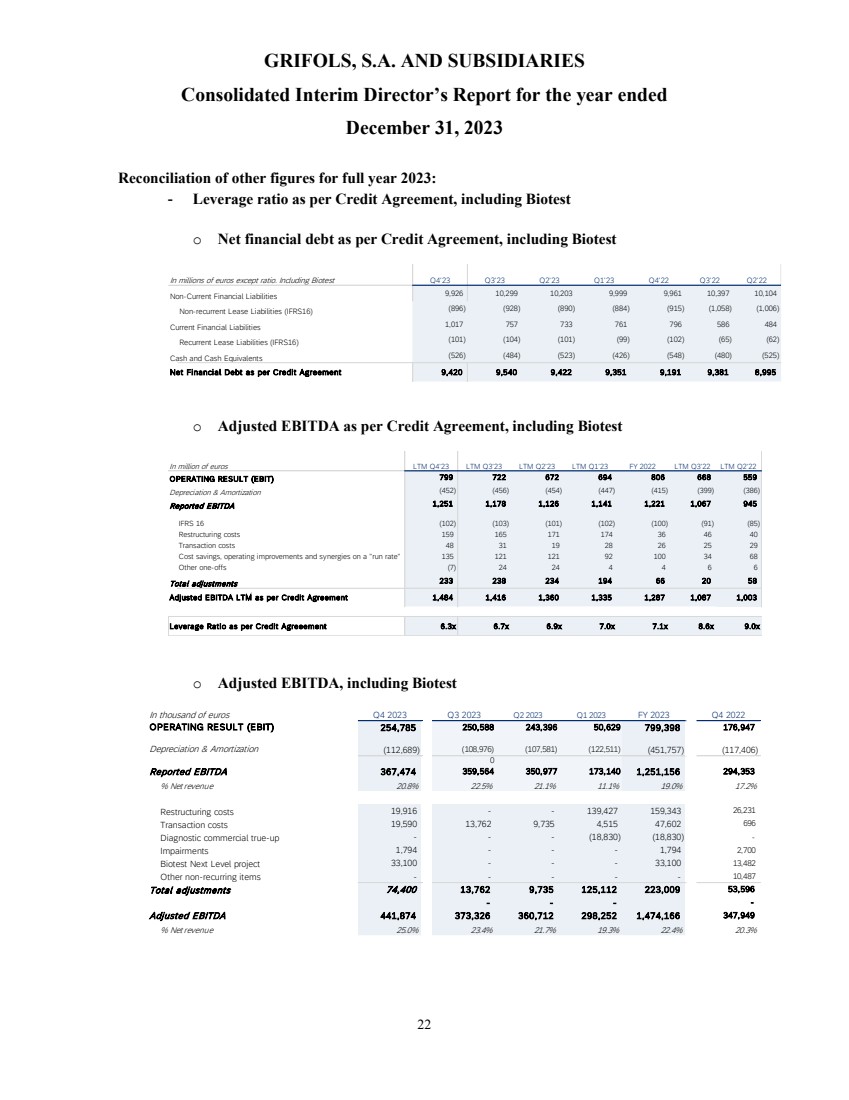
| GRIFOLS, S.A. AND SUBSIDIARIES
Consolidated Interim Director’s Report for the year ended
December 31, 2023
22
Reconciliation of other figures for full year 2023:
- Leverage ratio as per Credit Agreement, including Biotest
o Net financial debt as per Credit Agreement, including Biotest
o Adjusted EBITDA as per Credit Agreement, including Biotest
o Adjusted EBITDA, including Biotest
In million of euros LTM Q4'23 LTM Q3'23 LTM Q2'23 LTM Q1'23 FY 2022 LTM Q3'22 LTM Q2'22
OPERATING RESULT (EBIT) 799 722 672 694 806 668 559
Depreciation & Amortization (452) (456) (454) (447) (415) (399) (386)
Reported EBITDA 1,251 1,178 1,126 1,141 1,221 1,067 945
IFRS 16 (102) (103) (101) (102) (100) (91) (85)
Restructuring costs 159 165 171 174 36 46 40
Transaction costs 48 31 19 28 26 25 29
Cost savings, operating improvements and synergies on a "run rate" 135 121 121 92 100 34 68
Other one-offs (7) 24 24 4 4 6 6
Total adjustments 233 238 234 194 6 6 2 0 5 8
Adjusted EBITDA LTM as per Credit Agreement 1,484 1,416 1,360 1,335 1,287 1,087 1,003
Leverage Ratio as per Credit Agreeement 6.3x 6.7x 6.9x 7.0x 7.1x 8.6x 9.0x
In thousand of euros
254,785 250,588 243,396 50,629 799,398 176,947
(112,689) (108,976) (107,581) (122,511) (451,757) (117,406)
0
Reported EBITDA 367,474 359,564 350,977 173,140 1,251,156 294,353
% Net revenue 20.8% 22.5% 21.1% 11.1% 19.0% 17.2%
Restructuring costs 19,916 - - 139,427 159,343 26,231
Transaction costs 19,590 13,762 9,735 4,515 47,602 696
Diagnostic commercial true-up - - - (18,830) (18,830) -
Impairments 1,794 - - - 1,794 2,700
Biotest Next Level project 33,100 - - - 33,100 13,482
Other non-recurring items - - - - - 10,487
Total adjustments 74,400 13,762 9,735 125,112 223,009 53,596
- - - -
Adjusted EBITDA 441,874 373,326 360,712 298,252 1,474,166 347,949
% Net revenue 25.0% 23.4% 21.7% 19.3% 22.4% 20.3%
Depreciation & Amortization
OPERATING RESULT (EBIT)
Q4 2023 Q3 2023 Q2 2023 Q1 2023 FY 2023 Q4 2022
In millions of euros except ratio. Including Biotest Q4'23 Q3'23 Q2'23 Q1'23 Q4'22 Q3'22 Q2'22
Non-Current Financial Liabilities 9,926 10,299 10,203 9,999 9,961 10,397 10,104
Non-recurrent Lease Liabilities (IFRS16) (896) (928) (890) (884) (915) (1,058) (1,006)
Current Financial Liabilities 1,017 757 733 761 796 586 484
Recurrent Lease Liabilities (IFRS16) (101) (104) (101) (99) (102) (65) (62)
Cash and Cash Equivalents (526) (484) (523) (426) (548) (480) (525)
Net Financial Debt as per Credit Agreement 9,420 9,540 9,422 9,351 9,191 9,381 8,995 |
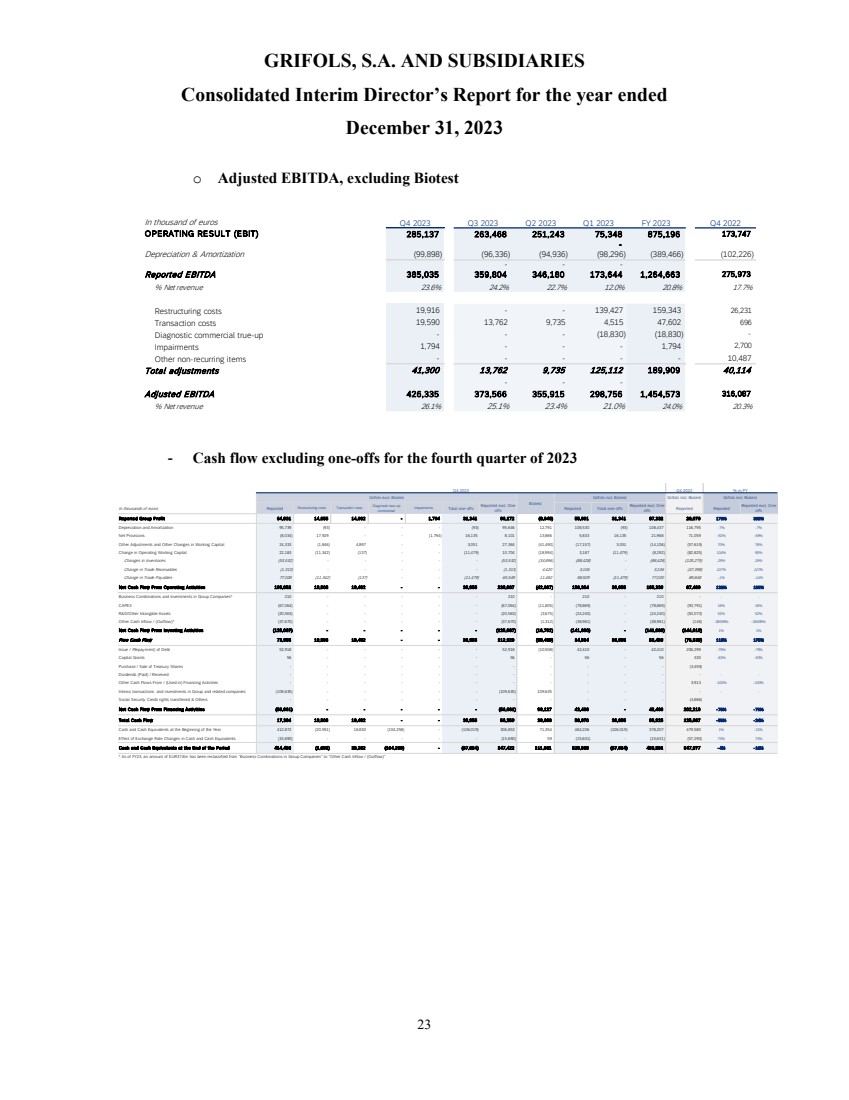
| GRIFOLS, S.A. AND SUBSIDIARIES
Consolidated Interim Director’s Report for the year ended
December 31, 2023
23
o Adjusted EBITDA, excluding Biotest
- Cash flow excluding one-offs for the fourth quarter of 2023
In thousand of euros
285,137 263,468 251,243 75,348 875,196 173,747
-
(99,898) (96,336) (94,936) (98,296) (389,466) (102,226)
- - -
Reported EBITDA 385,035 359,804 346,180 173,644 1,264,663 275,973
% Net revenue 23.6% 24.2% 22.7% 12.0% 20.8% 17.7%
Restructuring costs 19,916 - - 139,427 159,343 26,231
Transaction costs 19,590 13,762 9,735 4,515 47,602 696
Diagnostic commercial true-up - - - (18,830) (18,830) -
Impairments 1,794 - - - 1,794 2,700
Other non-recurring items - - - - - 10,487
Total adjustments 41,300 13,762 9,735 125,112 189,909 40,114
- - -
Adjusted EBITDA 426,335 373,566 355,915 298,756 1,454,573 316,087
% Net revenue 26.1% 25.1% 23.4% 21.0% 24.0% 20.3%
Depreciation & Amortization
Q4 2023 Q4 2022
OPERATING RESULT (EBIT)
Q3 2023 Q2 2023 Q1 2023 FY 2023
Q4 2022
Grifols incl. Biotest
In thousands of euros Reported Restructuring costs Transaction costs Diagnostic true-up
commercial Impairments Total one-offs Reported excl. One- offs Reported Total one-offs Reported excl. One- offs Reported Reported Reported excl. One- offs
Reported Group Profit 64,831 14,855 14,692 - 1,794 31,341 96,172 (8,840) 55,991 31,341 87,332 20,070 179% 335%
Depreciation and Amortization 95,739 (93) - - - (93) 95,646 12,791 108,530 (93) 108,437 116,795 -7% -7%
Net Provisions (8,034) 17,929 - - (1,794) 16,135 8,101 13,866 5,833 16,135 21,968 71,059 -92% -69%
Other Adjustments and Other Changes in Working Capital 24,333 (1,846) 4,897 - - 3,051 27,384 (41,490) (17,157) 3,051 (14,106) (57,619) 70% 76%
Change in Operating Working Capital 22,183 (11,342) (137) - - (11,479) 10,704 (18,994) 3,187 (11,479) (8,292) (82,825) 104% 90%
Changes in Inventories (53,532) - - - - - (53,532) (34,896) (88,428) - (88,428) (125,275) 29% 29%
Change in Trade Receivables (1,313) - - - - - (1,313) 4,420 3,106 - 3,106 (47,398) 107% 107%
Change in Trade Payables 77,028 (11,342) (137) - - (11,479) 65,549 11,482 88,509 (11,479) 77,030 89,848 -1% -14%
Net Cash Flow From Operating Activities 199,052 19,503 19,452 - - 38,955 238,007 (42,667) 156,384 38,955 195,339 67,480 132% 189%
Business Combinations and Investments in Group Companies* 210 - - - - - 210 - 210 - 210 - - -
CAPEX (67,064) - - - - - (67,064) (11,805) (78,869) - (78,869) (93,791) 16% 16%
R&D/Other Intangible Assets (20,563) - - - - - (20,563) (3,675) (24,240) - (24,240) (50,073) 52% 52%
Other Cash Inflow / (Outflow)* (37,670) - - - - - (37,670) (1,312) (38,981) - (38,981) (146) -26599% -26599%
Net Cash Flow From Investing Activities (125,087) - - - - - (125,087) (16,792) (141,880) - (141,880) (144,010) 1% 1%
Free Cash Flow 73,965 19,503 19,452 - - 38,955 112,920 (59,459) 14,504 38,955 53,459 (76,530) 119% 170%
Issue / /Repayment) of Debt 52,918 - - - - - 52,918 (10,508) 42,410 - 42,410 206,299 -79% -79%
Capital Grants 56 - - - - - 56 - 56 - 56 330 -83% -83%
Purchase / Sale of Treasury Shares - - - - - - - - - - - (3,459)
Dividends (Paid) / Received - - - - - - - - - - - - - -
Other Cash Flows From / (Used in) Financing Activities - - - - - - - - - - - 3,913 -100% -100%
Interco transactions and investments in Group and related companies (109,635) - - - - - (109,635) 109,635 - - - - - -
Social Security Credit rights transferred & Others - - - - - - - - - - - (4,866)
Net Cash Flow From Financing Activities (56,661) - - - - - (56,661) 99,127 42,466 - 42,466 202,218 - 79% - 79%
Total Cash Flow 17,304 19,503 19,452 - - 38,955 56,259 39,668 56,970 38,955 95,925 125,687 - 55% - 24%
Cash and Cash Equivalents at the Beginning of the Year 412,872 (20,591) 18,830 (104,258) - (106,019) 306,853 71,354 484,226 (106,019) 378,207 479,580 1% -21%
Effect of Exchange Rate Changes in Cash and Cash Equivalents (15,690) - - - - - (15,690) 59 (15,631) - (15,631) (57,290) 73% 73%
Cash and Cash Equivalents at the End of the Period 414,486 (1,088) 38,282 (104,258) - (67,064) 347,422 111,081 525,565 (67,064) 458,501 547,977 - 4% - 16%
* As of FY23, an amount of EUR37.8m has been reclassified from "Business Combinations in Group Companies" to "Other Cash Inflow / (Outflow)"
Q4 2023 % vs PY
Grifols excl. Biotest Biotest
Grifols incl. Biotest Grifols incl. Biotest |
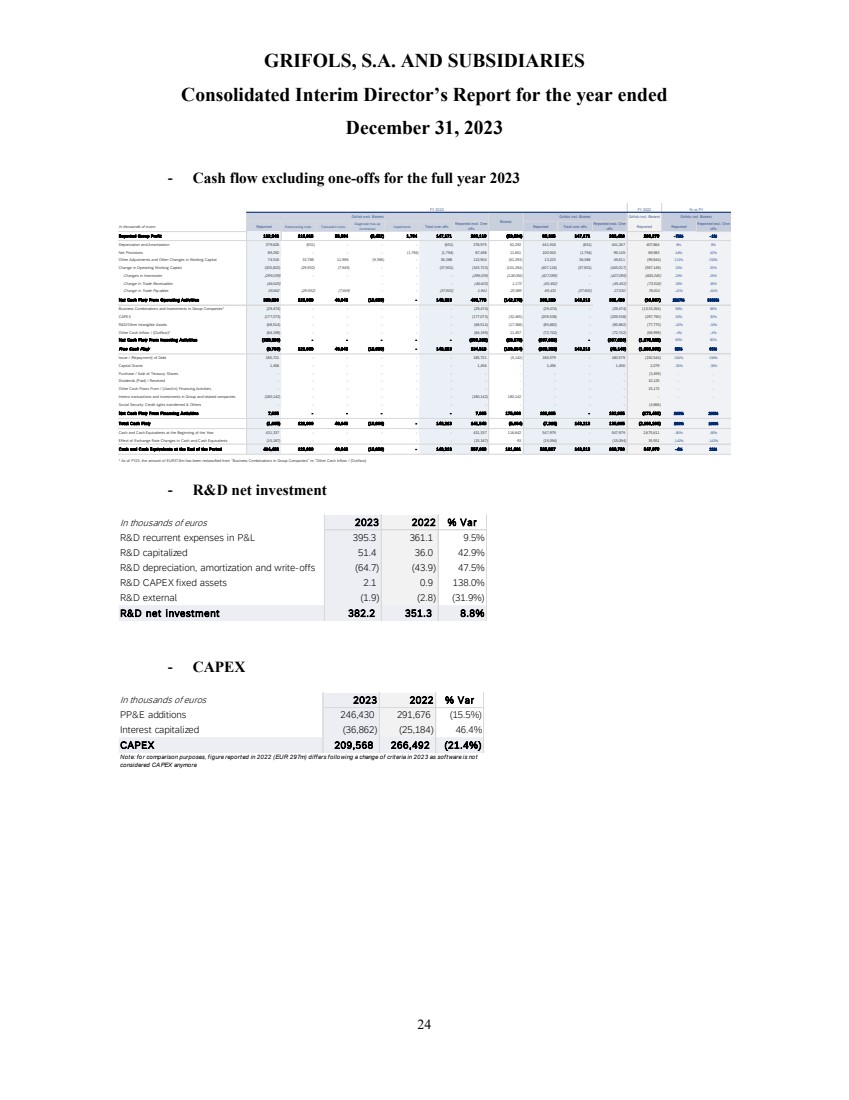
| GRIFOLS, S.A. AND SUBSIDIARIES
Consolidated Interim Director’s Report for the year ended
December 31, 2023
24
- Cash flow excluding one-offs for the full year 2023
- R&D net investment
- CAPEX
FY 2022 Grifols incl. Biotest
In thousands of euros Reported Restructuring costs Transaction costs Diagnostic true-up commercial Impairments Total one-offs Reported excl. One- offs Reported Total one-offs Reported excl. One- offs Reported Reported Reported excl. One- offs
Reported Group Profit 112,948 118,815 35,994 (9,432) 1,794 147,171 260,119 (53,634) 59,315 147,171 206,486 208,279 - 72% - 1%
Depreciation and Amortization 379,626 (651) - - - (651) 378,975 62,292 441,918 (651) 441,267 407,864 8% 8%
Net Provisions 89,292 - - - (1,794) (1,794) 87,498 11,651 100,943 (1,794) 99,149 69,983 44% 42%
Other Adjustments and Other Changes in Working Capital 74,516 33,788 11,998 (9,398) - 36,388 110,904 (61,293) 13,223 36,388 49,611 (99,844) 113% 150%
Change in Operating Working Capital (305,822) (29,952) (7,949) - - (37,901) (343,723) (101,294) (407,116) (37,901) (445,017) (597,149) 32% 25%
Changes in Inventories (299,039) - - - - - (299,039) (128,056) (427,095) - (427,095) (600,245) 29% 29%
Change in Trade Receivables (46,625) - - - (46,625) 1,173 (45,452) - (45,452) (73,518) 38% 38%
Change in Trade Payables 39,842 (29,952) (7,949) - - (37,901) 1,941 25,589 65,431 (37,901) 27,530 76,614 -15% -64%
Net Cash Flow From Operating Activities 350,560 122,000 40,043 (18,830) - 143,213 493,773 (142,278) 208,283 143,213 351,496 (10,867) 2017% 3335%
Business Combinations and Investments in Group Companies* (29,474) - - - - - (29,474) - (29,474) - (29,474) (1,533,264) 98% 98%
CAPEX (177,073) - - - - - (177,073) (32,465) (209,538) - (209,538) (297,790) 30% 30%
R&D/Other Intangible Assets (68,514) - - - - - (68,514) (17,368) (85,882) - (85,882) (77,770) -10% -10%
Other Cash Inflow / (Outflow)* (84,199) - - - - - (84,199) 11,457 (72,742) - (72,742) (69,999) -4% -4%
Net Cash Flow From Investing Activities (359,260) - - - - - (359,260) (38,376) (397,636) - (397,636) (1,978,823) 80% 80%
Free Cash Flow (8,700) 122,000 40,043 (18,830) - 143,213 134,513 (180,654) (189,353) 143,213 (46,140) (1,989,690) 90% 98%
Issue / /Repayment) of Debt 185,721 - - - - - 185,721 (5,142) 180,579 - 180,579 (192,544) 194% 194%
Capital Grants 1,456 - - - - - 1,456 - 1,456 - 1,456 2,079 -30% -30%
Purchase / Sale of Treasury Shares - - - - - - - - - - - (3,459) - -
Dividends (Paid) / Received - - - - - - - - - - - 10,125 - -
Other Cash Flows From / (Used in) Financing Activities - - - - - - - - - - - 15,172 - -
Interco transactions and investments in Group and related companies (180,142) - - - - - (180,142) 180,142 - - - - - -
Social Security Credit rights transferred & Others - - - - - - - - - - - (4,866)
Net Cash Flow From Financing Activities 7,035 - - - - 7,035 175,000 182,035 - 182,035 (173,492) 205% 205%
Total Cash Flow (1,665) 122,000 40,043 (18,830) - 143,213 141,548 (5,654) (7,318) 143,213 135,895 (2,163,183) 100% 106%
Cash and Cash Equivalents at the Beginning of the Year 431,337 - - - - - 431,337 116,642 547,979 - 547,979 2,675,611 -80% -80%
Effect of Exchange Rate Changes in Cash and Cash Equivalents (15,187) - - - - - (15,187) 93 (15,094) - (15,094) 35,551 -142% -142%
Cash and Cash Equivalents at the End of the Period 414,485 122,000 40,043 (18,830) - 143,213 557,698 111,081 525,567 143,213 668,780 547,979 - 4% 22%
* As of FY23, the amount of EUR37.8m has been reclassified from "Business Combinations in Group Companies" to "Other Cash Inflow / (Outflow)
FY 2023 Grifols excl. Biotest Biotest
Grifols incl. Biotest
% vs PY Grifols incl. Biotest In thousands of euros 2023 2022 % Var
R&D recurrent expenses in P&L 395.3 361.1 9.5%
R&D capitalized 51.4 36.0 42.9%
R&D depreciation, amortization and write-offs (64.7) (43.9) 47.5%
R&D CAPEX fixed assets 2.1 0.9 138.0%
R&D external (1.9) (2.8) (31.9%)
R&D net investment 382.2 351.3 8.8%
In thousands of euros 2023 2022 % Var
PP&E additions 246,430 291,676 (15.5%)
Interest capitalized (36,862) (25,184) 46.4%
CAPEX 209,568 266,492 (21.4%)
Note: for comparison purposes, figure reported in 2022 (EUR 297m) differs following a change of criteria in 2023 as software is not
considered CAPEX anymore |
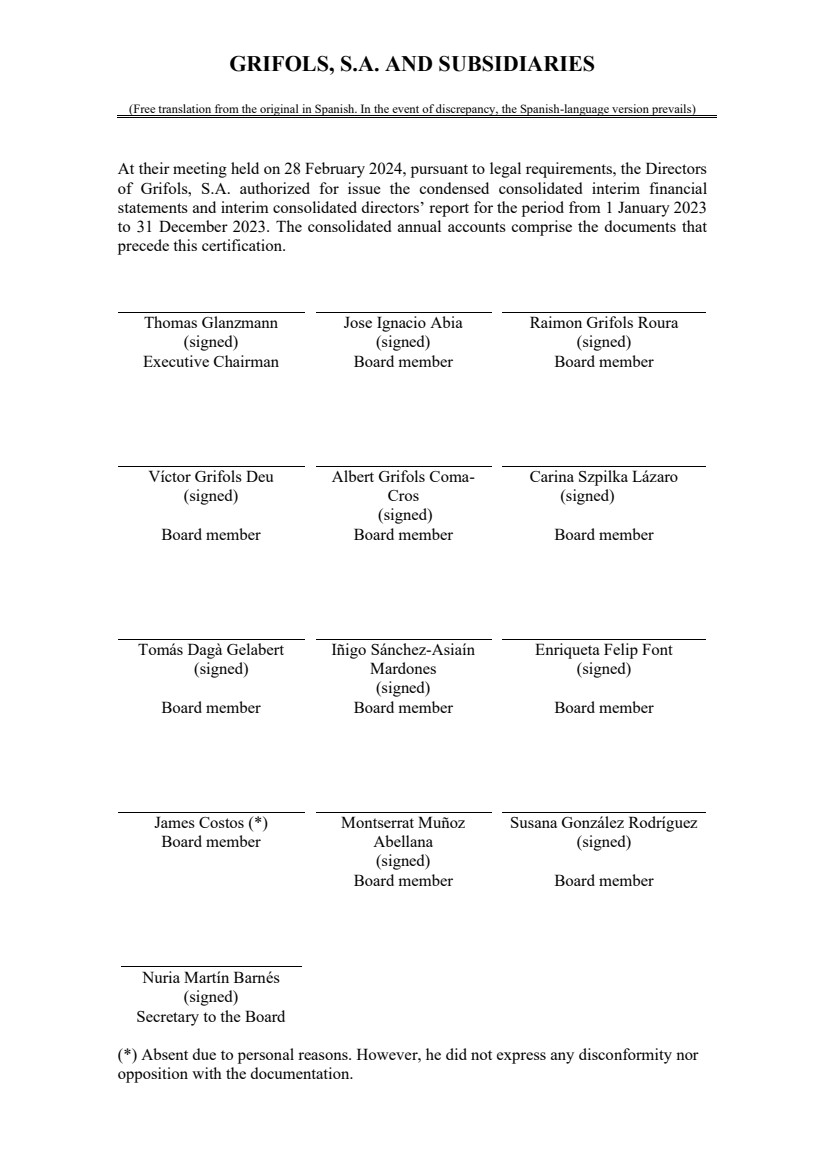
| GRIFOLS, S.A. AND SUBSIDIARIES
(Free translation from the original in Spanish. In the event of discrepancy, the Spanish-language version prevails)
At their meeting held on 28 February 2024, pursuant to legal requirements, the Directors
of Grifols, S.A. authorized for issue the condensed consolidated interim financial
statements and interim consolidated directors’ report for the period from 1 January 2023
to 31 December 2023. The consolidated annual accounts comprise the documents that
precede this certification.
Thomas Glanzmann
(signed)
Executive Chairman
Jose Ignacio Abia
(signed)
Board member
Raimon Grifols Roura
(signed)
Board member
Víctor Grifols Deu
(signed)
Albert Grifols Coma-Cros
(signed)
Carina Szpilka Lázaro
(signed)
Board member Board member Board member
Tomás Dagà Gelabert
(signed)
Iñigo Sánchez-Asiaín
Mardones
(signed)
Enriqueta Felip Font
(signed)
Board member Board member Board member
James Costos (*)
Board member
Montserrat Muñoz
Abellana
(signed)
Susana González Rodríguez
(signed)
Board member Board member
Nuria Martín Barnés
(signed)
Secretary to the Board
(*) Absent due to personal reasons. However, he did not express any disconformity nor
opposition with the documentation. |

| DECLARACIÓN DE RESPONSABILIDAD
CUENTAS SEMESTRALES
De conformidad con lo dispuesto en los artículos
11,12 y 13 del Real Decreto 1362/2007, de 19 de
octubre, los consejeros de Grifols, S.A. (la
"Sociedad")
DECLARATION OF RESPONSIBILITY
HALF-YEAR FINANCIAL REPORT
Pursuant to the provisions of articles 11,12 and 13
of Royal Decree 1362/2007, of 19 October, the
directors of Grifols, S.A. (the "Company")
DECLARAN DECLARE
Bajo su responsabilidad que, hasta donde alcanza
su conocimiento, las cuentas semestrales del
periodo de 12 meses terminado el 31 de diciembre
de 2023, elaboradas con arreglo a los principios
de contabilidad aplicables, ofrecen la imagen fiel
del patrimonio, de la situación financiera y de los
resultados de la Sociedad, y que el informe de
gestión semestral incluye un análisis fiel de la
evolución y los resultados empresariales y de la
posición de la Sociedad, junto con la descripción
de los principales riesgos e incertidumbres a que
se enfrentan.
On their own responsibility that, to the best of their
knowledge, the half-year financial report for the
12 month period ending on December 31, 2023,
prepared in accordance with applicable
accounting standards, give a fair view of the net
worth, financial situation and results of the
Company and that the director's report contains an
accurate analysis of the evolution, business
results and position of the Company, together with
a description of the main risks and uncertainties
which they face.
En Barcelona, a 28 de febrero 2024 In Barcelona, on 28 February 2024
Thomas Glanzmann
Executive Chairman
Jose Ignacio Abia
Board Member
Raimon Grifols Roura
Board Member
Víctor Grifols Deu
Board Member
Albert Grifols Coma-Cros
Board Member
Carina Szpilka Lázaro
Board Member
Tomás Dagà Gelabert
Board Member
Íñigo Sánchez-Asiaín
Mardones
Board Member
Enriqueta Felip Font
Board Member
James Costos (*)
Board Member
Montserrat Muñoz Abellana
Board Member
Susana González Rodríguez
Board Member
Núria Martín Barnés
Secretary
(*) Ausente por motivos personales. No obstante, no ha manifestado disconformidad ni oposición
alguna con la documentación./ Absent due to personal reasons. However, he did not express any
disconformity nor opposition with the documentation. |
| GRIFOLS, S.A.
Half-year financial report
for the 12-month period ending on December 31, 2023
(hereinafter “Half-year financial report” or “Half-year financial report for the year 2023”)
(Free translation from the original in Spanish. In the event of discrepancy, the Spanish-language version prevails) |
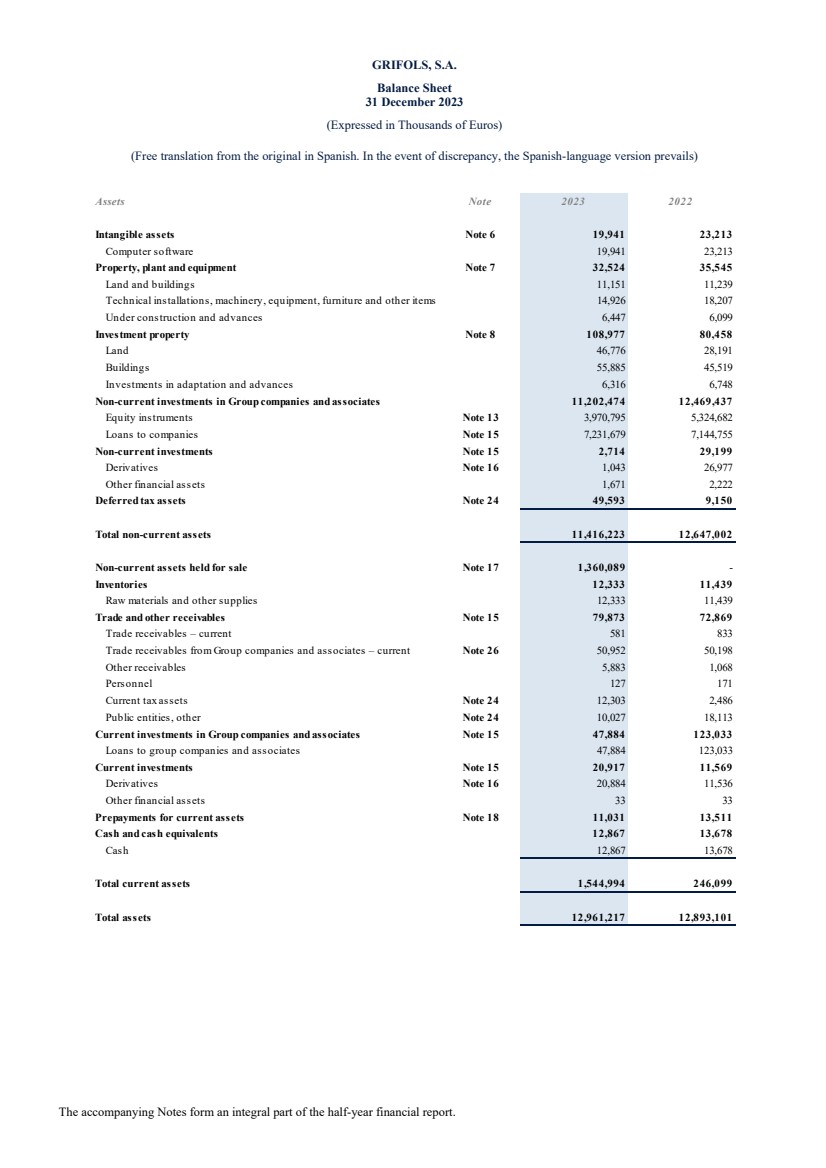
| GRIFOLS, S.A.
Balance Sheet
31 December 2023
(Expressed in Thousands of Euros)
(Free translation from the original in Spanish. In the event of discrepancy, the Spanish-language version prevails)
The accompanying Notes form an integral part of the half-year financial report.
Assets Note 2023 2022
Intangible assets Note 6 19,941 23,213
Computer software 19,941 23,213
Property, plant and equipment Note 7 32,524 35,545
Land and buildings 11,151 11,239
Technical installations, machinery, equipment, furniture and other items 14,926 18,207
Under construction and advances 6,447 6,099
Investment property Note 8 108,977 80,458
Land 46,776 28,191
Buildings 55,885 45,519
Investments in adaptation and advances 6,316 6,748
Non-current investments in Group companies and associates 11,202,474 12,469,437
Equity instruments Note 13 3,970,795 5,324,682
Loans to companies Note 15 7,231,679 7,144,755
Non-current investments Note 15 2,714 29,199
Derivatives Note 16 1,043 26,977
Other financial assets 1,671 2,222
Deferred tax assets Note 24 49,593 9,150
Total non-current assets 11,416,223 12,647,002
Non-current assets held for sale Note 17 1,360,089 -
Inventories 12,333 11,439
Raw materials and other supplies 12,333 11,439
Trade and other receivables Note 15 79,873 72,869
Trade receivables – current 581 833
Trade receivables from Group companies and associates – current Note 26 50,952 50,198
Other receivables 5,883 1,068
Personnel 127 171
Current tax assets Note 24 12,303 2,486
Public entities, other Note 24 10,027 18,113
Current investments in Group companies and associates Note 15 47,884 123,033
Loans to group companies and associates 47,884 123,033
Current investments Note 15 20,917 11,569
Derivatives Note 16 20,884 11,536
Other financial assets 33 33
Prepayments for current assets Note 18 11,031 13,511
Cash and cash equivalents 12,867 13,678
Cash 12,867 13,678
Total current assets 1,544,994 246,099
Total assets 12,961,217 12,893,101 |

| GRIFOLS, S.A.
Balance Sheet
31 December 2023
(Expressed in Thousands of Euros)
(Free translation from the original in Spanish. In the event of discrepancy, the Spanish-language version prevails)
The accompanying Notes form an integral part of the half-year financial report.
Equity and Liabilities Note 2023 2022
Capital and reserves Note 19 2,044,735 2,285,248
Capital
Registered capital 119,604 119,604
Share premium 910,728 910,728
Reserves
Legal and statutory reserves 23,921 23,921
Other reserves 1,381,683 1,652,208
(Treasury stock and equity holdings) (152,748) (162,220)
Profit for the year (246,735) (266,296)
Other equity instruments 8,282 7,303
Valuation adjustments 56,752 57,798
Valuation adjustments available for sale 53,018 53,018
Cash flow hedges Note 16 3,734 4,780
Grants, donations and bequests received - 79
Total equity 2,101,487 2,343,125
Non-current provisions 3,838 -
Other provisions 3,838 -
Non-current payables Note 22 5,879,325 3,901,732
Promissory notes 4,571,059 2,556,641
Loans and borrowings 1,308,026 1,340,473
Finance lease payables Note 9 27 52
Derivatives Note 16 - 3,990
Other financial liabilities 213 576
Group companies and associates, non-current Note 22 4,673,555 6,419,171
Deferred tax liabilities Note 24 4,907 2,580
Total non-current liabilities 10,561,625 10,323,483
Current provisions 14,000 7,000
Other provisions 14,000 7,000
Current payables Note 22 106,970 74,786
Promissory notes 30,170 12,554
Loans and borrowings 68,542 60,899
Finance lease payables Note 9 25 391
Derivatives Note 16 7,712
Other financial liabilities 521 942
Group companies and associates, current Note 22 64,699 61,720
Trade and other payables Note 22 112,436 82,987
Current payables to suppliers 69,365 58,812
Suppliers, Group companies and associates, current Note 26 9,731 9,235
Personnel (salaries payable) 29,249 11,541
Public entities, other Note 24 4,091 3,399
Total current liabilities 298,105 226,493
Total equity and liabilities 12,961,217 12,893,101 |
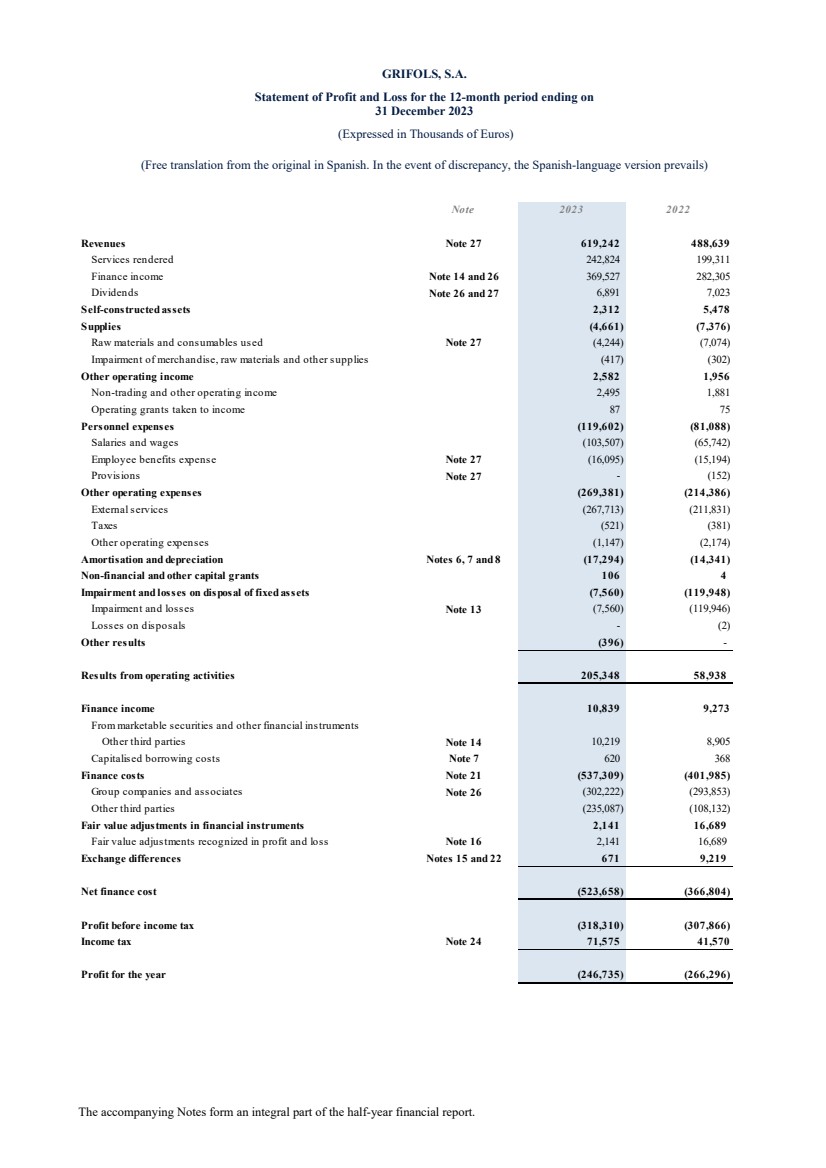
| GRIFOLS, S.A.
Statement of Profit and Loss for the 12-month period ending on
31 December 2023
(Expressed in Thousands of Euros)
(Free translation from the original in Spanish. In the event of discrepancy, the Spanish-language version prevails)
The accompanying Notes form an integral part of the half-year financial report.
Note 2023 2022
Revenues Note 27 619,242 488,639
Services rendered 242,824 199,311
Finance income Note 14 and 26 369,527 282,305
Dividends Note 26 and 27 6,891 7,023
Self-constructed assets 2,312 5,478
Supplies (4,661) (7,376)
Raw materials and consumables used Note 27 (4,244) (7,074)
Impairment of merchandise, raw materials and other supplies (417) (302)
Other operating income 2,582 1,956
Non-trading and other operating income 2,495 1,881
Operating grants taken to income 87 75
Personnel expenses (119,602) (81,088)
Salaries and wages (103,507) (65,742)
Employee benefits expense Note 27 (16,095) (15,194)
Provisions Note 27 - (152)
Other operating expenses (269,381) (214,386)
External services (267,713) (211,831)
Taxes (521) (381)
Other operating expenses (1,147) (2,174)
Amortisation and depreciation Notes 6, 7 and 8 (17,294) (14,341)
Non-financial and other capital grants 106 4
Impairment and losses on disposal of fixed assets (7,560) (119,948)
Impairment and losses Note 13 (7,560) (119,946)
Losses on disposals - (2)
Other results (396) -
Results from operating activities 205,348 58,938
Finance income 10,839 9,273
From marketable securities and other financial instruments
Other third parties Note 14 10,219 8,905
Capitalised borrowing costs Note 7 620 368
Finance costs Note 21 (537,309) (401,985)
Group companies and associates Note 26 (302,222) (293,853)
Other third parties (235,087) (108,132)
Fair value adjustments in financial instruments 2,141 16,689
Fair value adjustments recognized in profit and loss Note 16 2,141 16,689
Exchange differences Notes 15 and 22 671 9,219
Net finance cost (523,658) (366,804)
Profit before income tax (318,310) (307,866)
Income tax Note 24 71,575 41,570
Profit for the year (246,735) (266,296)
|
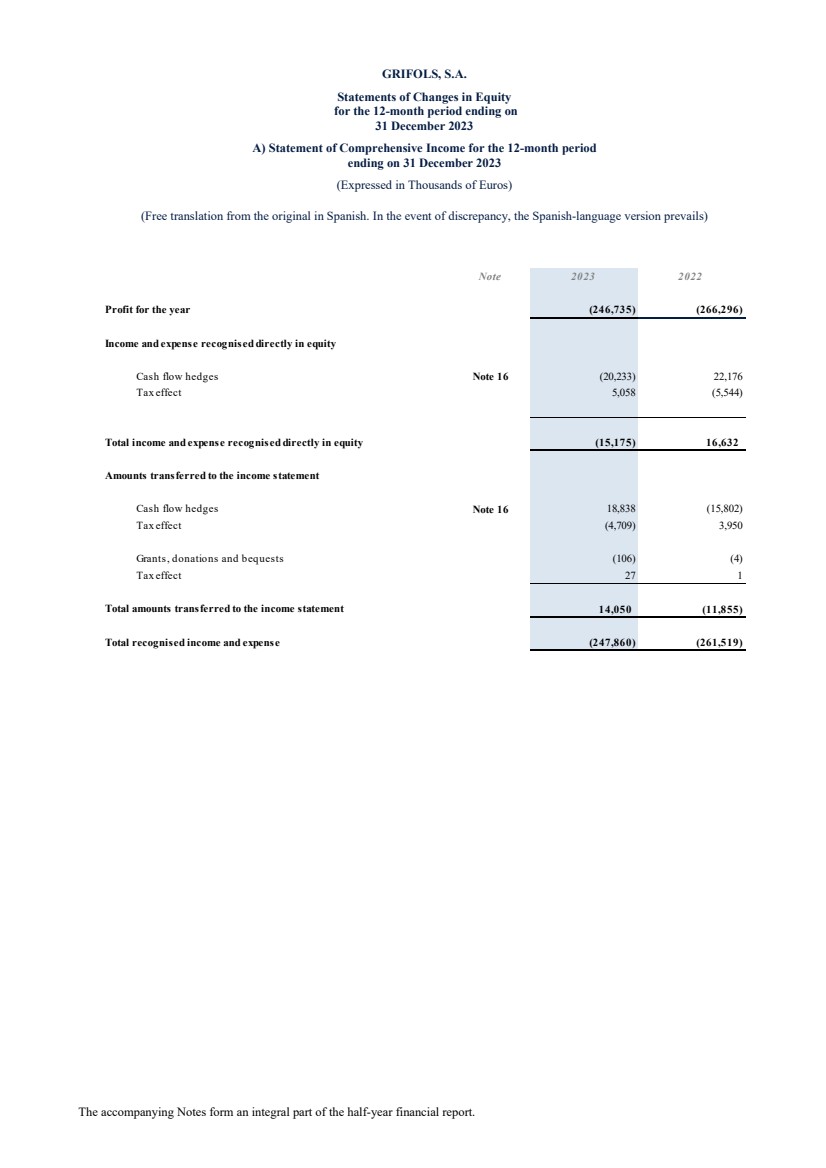
| GRIFOLS, S.A.
Statements of Changes in Equity
for the 12-month period ending on
31 December 2023
A) Statement of Comprehensive Income for the 12-month period
ending on 31 December 2023
(Expressed in Thousands of Euros)
(Free translation from the original in Spanish. In the event of discrepancy, the Spanish-language version prevails)
The accompanying Notes form an integral part of the half-year financial report.
Note 2023 2022
Profit for the year (246,735) (266,296)
Income and expense recognised directly in equity
Cash flow hedges Note 16 (20,233) 22,176
Tax effect 5,058 (5,544)
Total income and expense recognised directly in equity (15,175) 16,632
Amounts transferred to the income statement
Cash flow hedges Note 16 18,838 (15,802)
Tax effect (4,709) 3,950
Grants, donations and bequests (106) (4)
Tax effect 27 1
Total amounts transferred to the income statement 14,050 (11,855)
Total recognised income and expense (247,860) (261,519) |
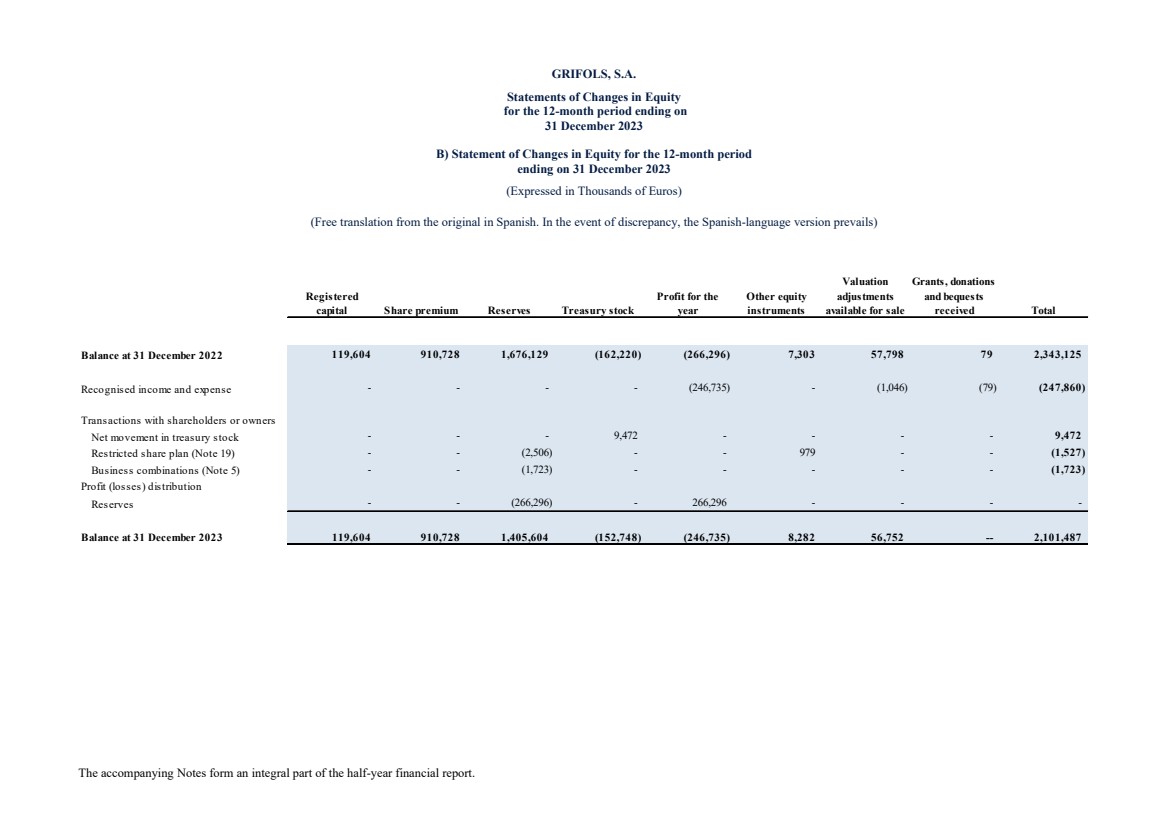
| GRIFOLS, S.A.
Statements of Changes in Equity
for the 12-month period ending on
31 December 2023
B) Statement of Changes in Equity for the 12-month period
ending on 31 December 2023
(Expressed in Thousands of Euros)
(Free translation from the original in Spanish. In the event of discrepancy, the Spanish-language version prevails)
The accompanying Notes form an integral part of the half-year financial report.
Registered
capital Share premium Reserves Treasury stock
Profit for the
year
Other equity
instruments
Valuation
adjustments
available for sale
Grants, donations
and bequests
received Total
Balance at 31 December 2022 119,604 910,728 1,676,129 (162,220) (266,296) 7,303 57,798 79 2,343,125
Recognised income and expense - - - - (246,735) - (1,046) (79) (247,860)
Transactions with shareholders or owners
Net movement in treasury stock - - - 9,472 - - - - 9,472
Restricted share plan (Note 19) - - (2,506) - - 979 - - (1,527)
Business combinations (Note 5) - - (1,723) - - - - - (1,723)
Profit (losses) distribution
Reserves - - (266,296) - 266,296 - - - -
Balance at 31 December 2023 119,604 910,728 1,405,604 (152,748) (246,735) 8,282 56,752 -- 2,101,487 |
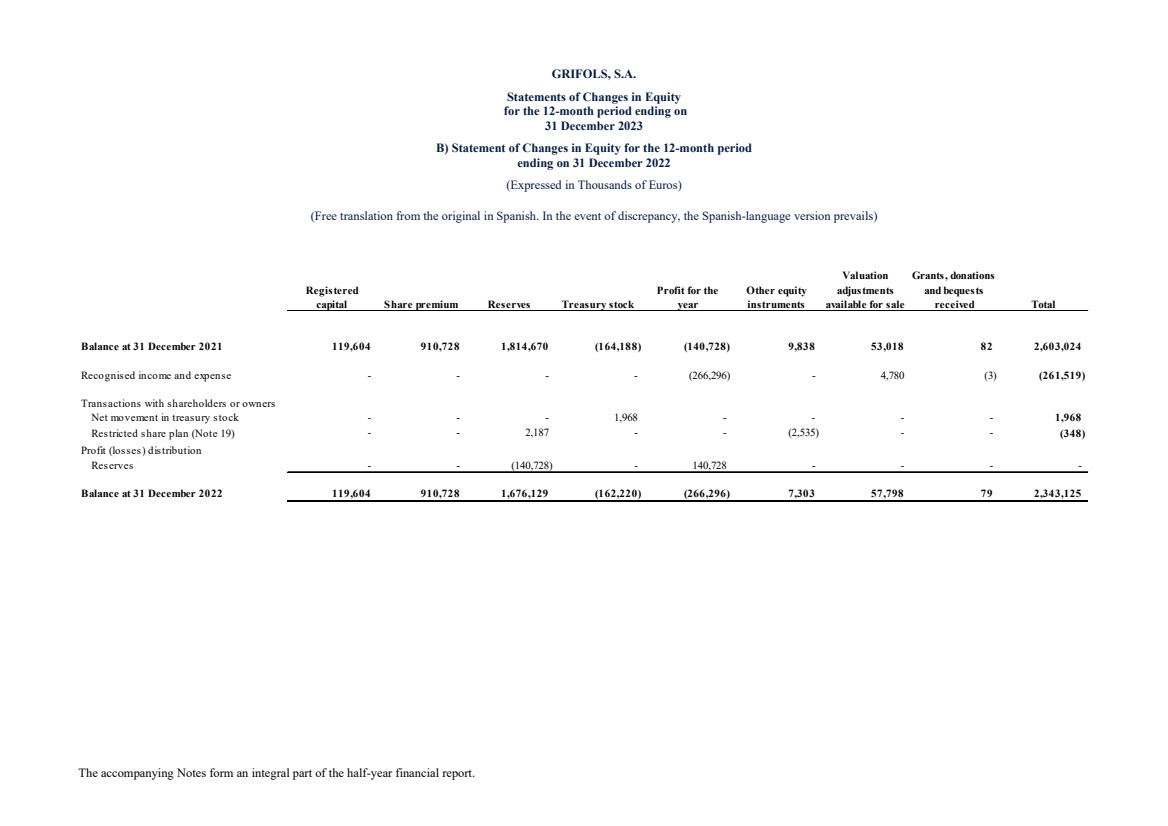
| GRIFOLS, S.A.
Statements of Changes in Equity
for the 12-month period ending on
31 December 2023
B) Statement of Changes in Equity for the 12-month period
ending on 31 December 2022
(Expressed in Thousands of Euros)
(Free translation from the original in Spanish. In the event of discrepancy, the Spanish-language version prevails)
The accompanying Notes form an integral part of the half-year financial report.
Registered
capital Share premium Reserves Treasury stock
Profit for the
year
Other equity
instruments
Valuation
adjustments
available for sale
Grants, donations
and bequests
received Total
Balance at 31 December 2021 119,604 910,728 1,814,670 (164,188) (140,728) 9,838 53,018 82 2,603,024
Recognised income and expense - - - - (266,296) - 4,780 (3) (261,519)
Transactions with shareholders or owners
Net movement in treasury stock - - - 1,968 - - - - 1,968
Restricted share plan (Note 19) - - 2,187 - - (2,535) - - (348)
Profit (losses) distribution
Reserves - - (140,728) - 140,728 - - - -
Balance at 31 December 2022 119,604 910,728 1,676,129 (162,220) (266,296) 7,303 57,798 79 2,343,125 |
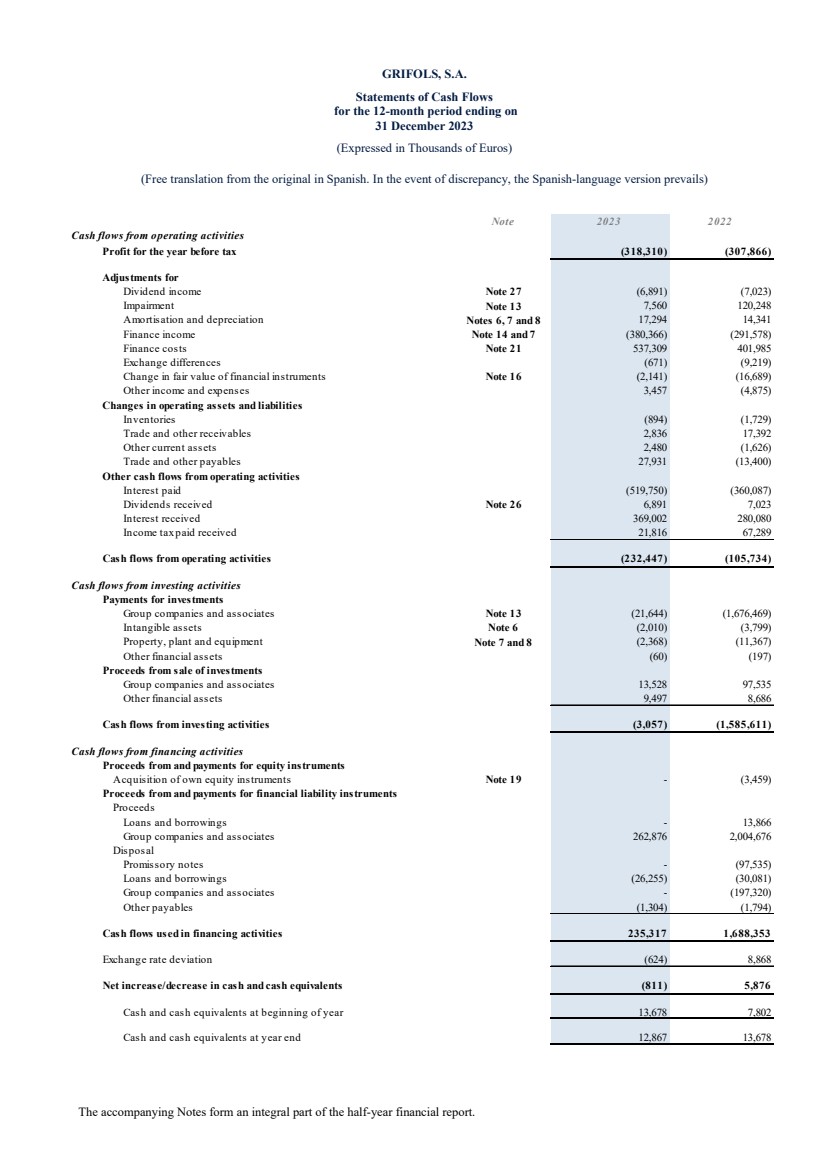
| GRIFOLS, S.A.
Statements of Cash Flows
for the 12-month period ending on
31 December 2023
(Expressed in Thousands of Euros)
(Free translation from the original in Spanish. In the event of discrepancy, the Spanish-language version prevails)
The accompanying Notes form an integral part of the half-year financial report.
Note 2023 2022
Cash flows from operating activities
Profit for the year before tax (318,310) (307,866)
Adjustments for
Dividend income Note 27 (6,891) (7,023)
Impairment Note 13 7,560 120,248
Amortisation and depreciation Notes 6, 7 and 8 17,294 14,341
Finance income Note 14 and 7 (380,366) (291,578)
Finance costs Note 21 537,309 401,985
Exchange differences (671) (9,219)
Change in fair value of financial instruments Note 16 (2,141) (16,689)
Other income and expenses 3,457 (4,875)
Changes in operating assets and liabilities
Inventories (894) (1,729)
Trade and other receivables 2,836 17,392
Other current assets 2,480 (1,626)
Trade and other payables 27,931 (13,400)
Other cash flows from operating activities
Interest paid (519,750) (360,087)
Dividends received Note 26 6,891 7,023
Interest received 369,002 280,080
Income tax paid received 21,816 67,289
Cash flows from operating activities (232,447) (105,734)
Cash flows from investing activities
Payments for investments
Group companies and associates Note 13 (21,644) (1,676,469)
Intangible assets Note 6 (2,010) (3,799)
Property, plant and equipment Note 7 and 8 (2,368) (11,367)
Other financial assets (60) (197)
Proceeds from sale of investments
Group companies and associates 13,528 97,535
Other financial assets 9,497 8,686
Cash flows from investing activities (3,057) (1,585,611)
Cash flows from financing activities
Proceeds from and payments for equity instruments
Acquisition of own equity instruments Note 19 - (3,459)
Proceeds from and payments for financial liability instruments
Proceeds
Loans and borrowings - 13,866
Group companies and associates 262,876 2,004,676
Disposal
Promissory notes - (97,535)
Loans and borrowings (26,255) (30,081)
Group companies and associates - (197,320)
Other payables (1,304) (1,794)
Cash flows used in financing activities 235,317 1,688,353
Exchange rate deviation (624) 8,868
Net increase/decrease in cash and cash equivalents (811) 5,876
Cash and cash equivalents at beginning of year 13,678 7,802
Cash and cash equivalents at year end 12,867 13,678 |
| 9
GRIFOLS, S.A.
Notes to the Half-year financial report
(Free translation from the original in Spanish. In the event of discrepancy, the Spanish-language version prevails)
(Continued on next page)
(1) Nature and Activities of the Company and Composition of the Group
Grifols, S.A. (hereinafter the “Company”) was incorporated with limited liability under Spanish law on 22 June 1987.
Its registered office is in Barcelona. The Company's statutory activity consists of providing corporate and business
administrative, management and control services, as well as investing in assets and property. Its principal activity
involves rendering administrative, management and control services to its subsidiaries.
Its main facilities are located in Sant Cugat del Vallès (Barcelona) and Parets del Vallès (Barcelona).
Grifols, S.A.’s shares are listed on the Barcelona, Madrid, Valencia and Bilbao stock exchanges and on the electronic
stock market. As of 2 June 2011, the class B non-voting shares were listed on the NASDAQ (USA) and the Automated
Quotation System (SIBE/Continuous Market).
In accordance with prevailing legislation, the Company is the Parent of a Group comprising the Company and the
subsidiaries, associated and multi-group companies listed in Note 13 and the Appendix II. In accordance with generally
accepted accounting principles in Spain, summarized consolidated interim financial statements must be prepared to
give a true and fair view of the financial position of the Group, the results of operations and changes in its equity and
cash flows.
On 28 February 2024 the Company’s board of directors authorised for issue the summarized consolidated interim
financial statements of Grifols, S.A. and subsidiaries for 2023 prepared in accordance with International Financial
Reporting Standards as adopted by the European Union (IFRS-EU), which show consolidated profit attributable to the
Parent of Euros 59,315 thousand, total assets Euros 21,325,895 thousand and consolidated equity of Euros 8,010,967
thousand (Euros 208,279 thousand, Euros 21,533,977 thousand and Euros 8,457,544 thousand, respectively, in 2022).
(2) Basis of Presentation
(a) True and fair view
The accompanying half-year financial report has been prepared on the basis of the accounting records of Grifols, S.A.
in compliance with the requirements of the articles 11, 12 and 13 of the Royal Decree 1362/2007, of October 19, which
develops Law 24/1988, of July 28, on the Securities Market, regarding transparency requirements related to information
about issuers whose securities are admitted to trading on an official secondary market or another regulated market of
the European Union. The half-year financial report for 2023 has been prepared in accordance with prevailing legislation
and the Spanish General Chart of Accounts to give a true and fair view of the equity and financial position of the
Company at 31 December 2023 and results of operations, changes in equity, and cash flows for the 12-month period
then ended.
(b) Comparative information
The balance sheet, income statement, statement of changes in equity, statement of cash flows and the notes thereto for
2023 include comparative figures for 2022, which formed part of the annual accounts approved by the shareholders at
the annual general meeting held on 16 June 2023.
(c) Functional and presentation currency
The figures disclosed in the half-year financial report are presented in Euros thousand, the Company’s functional and
presentation currency, rounded off to the nearest Euro thousand.
|

| 10
GRIFOLS, S.A.
Notes to the Half-year financial report
(Free translation from the original in Spanish. In the event of discrepancy, the Spanish-language version prevails)
(Continued on next page)
(d) Critical issues regarding the valuation and estimation of relevant uncertainties and judgements used when applying
accounting principles.
Relevant accounting estimates and judgements and other estimates and assumptions have to be made when applying
the Company’s accounting principles to prepare the half-year financial report. A summary of the items requiring a
greater degree of judgement, or which are more complex, or where the assumptions and estimates made are significant
to the preparation of the half-year financial report, is as follows:
(i) Relevant accounting estimates and assumptions
The Company tests investments in Group companies for impairment when there are signs that the book value is
lower than the recoverable value, understood as the higher amount between the fair value less costs of sales and
usage value. The determination of the recoverable value implies the use of estimates made by management. The
Company generally uses cash flow discounting methods to calculate this value. Cash flow discounting
calculations are based on the 5-year projections of the budgets approved by management. The cash flows take
into consideration past experience and represent management’s best estimate of future market performance. The
fifth-year cash flows are extrapolated using individual growth rates. The key assumptions employed include
growth rates and the discount rate. The estimates, including the methodology used, could have a significant
impact on values and impairment.
Additionally, the Company has considered as relevant judgment the classification of the 20% ownership held in
Shanghai RAAS Blood Products Co. Ltd. as a non-current asset held for sale.
(ii) Changes in accounting estimates
Although estimates are calculated by the Company’s directors based on the best information available at 31
December 2023, future events may require changes to these estimates in subsequent years. Any effect on the half-year financial report of adjustments to be made in subsequent years would be recognised prospectively. Grifols,
S.A. management does not consider that there are any assumptions or sources of uncertainty that would have a
significant risk of resulting in a material adjustment within the next financial year.
(3) Distribution of Profit
The distribution of profit and reserves of the Company for the year ended 31 December 2022, approved by the
shareholders at their annual general meeting held on 16 June 2023, was as follows:
The proposed distribution of losses for the 12-month period ending on 31 December 2023:
Thousand Euros
Basis of allocation
Losses for the year (246,735)
Allocation
Voluntary reserve (246,735)
Thousand Euros
Basis of allocation
Losses for the year (266,296)
Allocation
Voluntary reserve (266,296) |

| 11
GRIFOLS, S.A.
Notes to the Half-year financial report
(Free translation from the original in Spanish. In the event of discrepancy, the Spanish-language version prevails)
(Continued on next page)
As of December 31, 2023 and 2022, non-distributable reserves are as follows:
2023 2022
Non-distributable reserves
Legal reserve 23,921 23,921
Other 3 3
23,924 23,924
Thousand Euros
Profit recognised directly in equity cannot be distributed, either directly or indirectly.
(4) Significant Accounting Policies
(a) Business combinations
Business combinations are accounted for by applying the acquisition method, for which the acquisition date is
determined and the cost of the combination is calculated, recording the identifiable assets acquired and liabilities
assumed at their fair value as of that date.
The cost of the combination is determined by the aggregation of:
- The fair values at the acquisition date of assets transferred, liabilities incurred or assumed, and equity instruments
issued.
- The fair value of any contingent consideration that depends on future events or the fulfilment of predetermined
conditions.
Expenses related to the issuance of equity instruments or financial liabilities exchanged for the acquired items are not
part of the cost of the combination.
Similarly, fees paid to legal advisors or other professionals involved in the combination, as well as internally generated
expenses related to these matters, are not part of the cost of the combination. These amounts are directly charged to the
income statement.
(b) Foreign currency transactions, balances and cash flows
Foreign currency transactions have been translated into Euros using average exchange rates for the prior month for all
foreign currency transactions during the current month. This method does not differ significantly from applying the
exchange rate at the date of the transaction.
Monetary assets and liabilities denominated in foreign currencies have been translated into Euros at the closing rate,
while non-monetary assets and liabilities measured at historical cost have been translated at the exchange rate prevailing
at the transaction date. In the statement of cash flows, cash flows from foreign currency transactions have been
translated into Euros using the average exchange rates for the prior month for all flows that occur during the following
month. This method does not differ significantly from applying the exchange rate at the date of the transaction.
Exchange gains and losses arising on the settlement of foreign currency transactions and the translation into Euros of
monetary assets and liabilities denominated in foreign currencies are recognised in profit and loss.
(c) Capitalised borrowing costs
In accordance with the second transitional provision of Royal Decree 1514/2007 enacting the Spanish General Chart
of Accounts, the Company has opted to apply this accounting policy to work in progress at 1 January 2008 which will
not be available for use, capable of operating or available for sale for more than one year. Until that date, the Company
opted to recognise borrowing costs as an expense as they were incurred. |
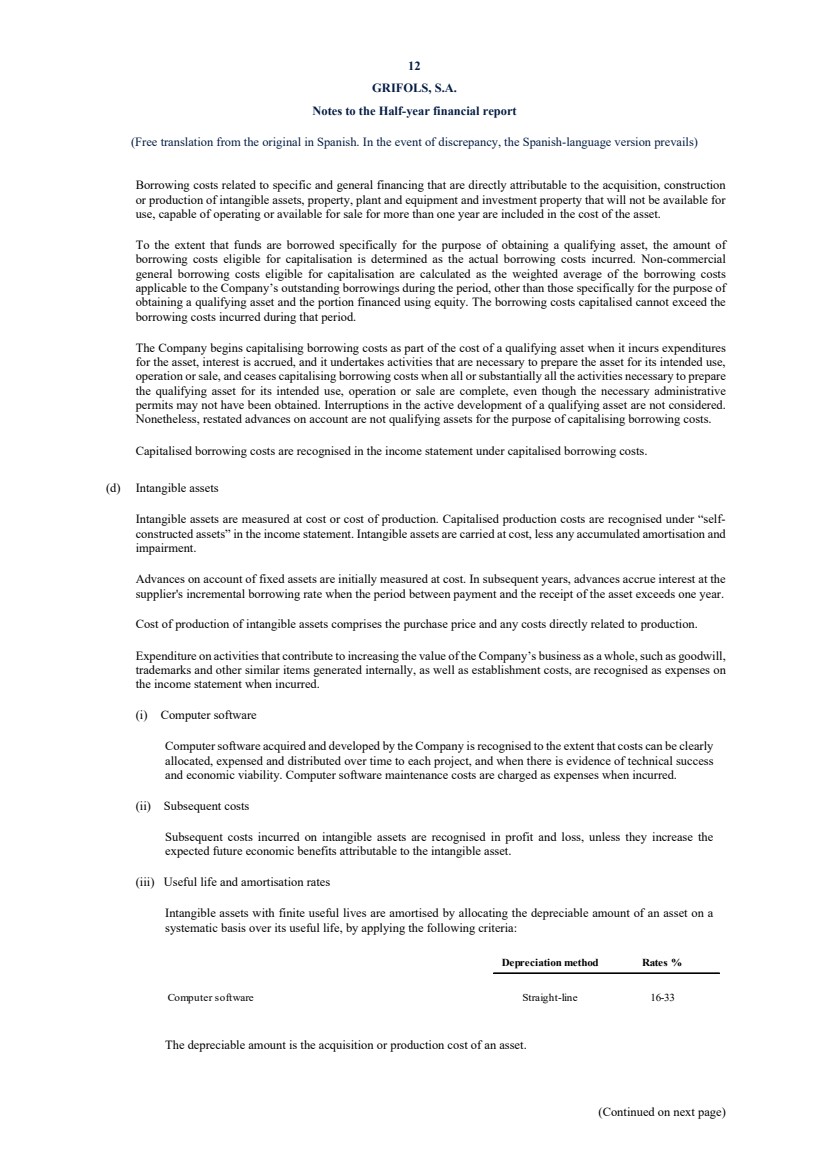
| 12
GRIFOLS, S.A.
Notes to the Half-year financial report
(Free translation from the original in Spanish. In the event of discrepancy, the Spanish-language version prevails)
(Continued on next page)
Borrowing costs related to specific and general financing that are directly attributable to the acquisition, construction
or production of intangible assets, property, plant and equipment and investment property that will not be available for
use, capable of operating or available for sale for more than one year are included in the cost of the asset.
To the extent that funds are borrowed specifically for the purpose of obtaining a qualifying asset, the amount of
borrowing costs eligible for capitalisation is determined as the actual borrowing costs incurred. Non-commercial
general borrowing costs eligible for capitalisation are calculated as the weighted average of the borrowing costs
applicable to the Company’s outstanding borrowings during the period, other than those specifically for the purpose of
obtaining a qualifying asset and the portion financed using equity. The borrowing costs capitalised cannot exceed the
borrowing costs incurred during that period.
The Company begins capitalising borrowing costs as part of the cost of a qualifying asset when it incurs expenditures
for the asset, interest is accrued, and it undertakes activities that are necessary to prepare the asset for its intended use,
operation or sale, and ceases capitalising borrowing costs when all or substantially all the activities necessary to prepare
the qualifying asset for its intended use, operation or sale are complete, even though the necessary administrative
permits may not have been obtained. Interruptions in the active development of a qualifying asset are not considered.
Nonetheless, restated advances on account are not qualifying assets for the purpose of capitalising borrowing costs.
Capitalised borrowing costs are recognised in the income statement under capitalised borrowing costs.
(d) Intangible assets
Intangible assets are measured at cost or cost of production. Capitalised production costs are recognised under “self-constructed assets” in the income statement. Intangible assets are carried at cost, less any accumulated amortisation and
impairment.
Advances on account of fixed assets are initially measured at cost. In subsequent years, advances accrue interest at the
supplier's incremental borrowing rate when the period between payment and the receipt of the asset exceeds one year.
Cost of production of intangible assets comprises the purchase price and any costs directly related to production.
Expenditure on activities that contribute to increasing the value of the Company’s business as a whole, such as goodwill,
trademarks and other similar items generated internally, as well as establishment costs, are recognised as expenses on
the income statement when incurred.
(i) Computer software
Computer software acquired and developed by the Company is recognised to the extent that costs can be clearly
allocated, expensed and distributed over time to each project, and when there is evidence of technical success
and economic viability. Computer software maintenance costs are charged as expenses when incurred.
(ii) Subsequent costs
Subsequent costs incurred on intangible assets are recognised in profit and loss, unless they increase the
expected future economic benefits attributable to the intangible asset.
(iii) Useful life and amortisation rates
Intangible assets with finite useful lives are amortised by allocating the depreciable amount of an asset on a
systematic basis over its useful life, by applying the following criteria:
Depreciation method Rates %
Computer software Straight-line 16‑33
The depreciable amount is the acquisition or production cost of an asset.
|
| 13
GRIFOLS, S.A.
Notes to the Half-year financial report
(Free translation from the original in Spanish. In the event of discrepancy, the Spanish-language version prevails)
(Continued on next page)
The Company considers that the residual value of the assets is zero unless:
- There is a commitment by a third party to purchase the asset at the end of its useful life.
- There is an active market for the intangible asset and:
Residual value can be determined by reference to that market; and
It is probable that such market will exist at the end of the asset's useful life.
The Company reviews the useful life and amortisation method for intangible assets at each financial year end.
Changes to initially established criteria are accounted for as a change in accounting estimates.
(iv) Impairment losses
The Company measures and determines impairment to be recognised or reversed based on the criteria in section
(g) Impairment of non-financial assets subject to amortisation or depreciation.
(e) Property, plant and equipment
(i) Initial recognition
Property, plant and equipment are measured at cost of acquisition or production, using the same criteria as for
determining the cost of production of intangible assets. Capitalised production costs are recognised under
“Self-constructed assets” in the income statement. Property, plant and equipment are carried at cost less any
accumulated depreciation and impairment.
The cost of an item of property, plant and equipment includes the estimated costs of its dismantling or removal
and restoration of the site on which it is located, provided that the obligation is incurred as a consequence of
having used the item.
(ii) Property, plant and equipment swap
Property, plant and equipment acquired in exchange for one or more non-monetary assets or a combination of
monetary and non-monetary assets, is recognized for the monetary amount delivered plus the fair value of the
non-monetary assets delivered in the transaction, except in those cases in which those that do not have a
commercial substance or for which the fair value of the property, plant and equipment received or the asset
delivered cannot be reliably measured.
The fair value of the asset received should be recognized by reference to the fair value of the asset delivered
except in those transactions in which the fair value of the asset received can be determined with greater
reliability.
In those cases in which the fair value of the asset received or delivered cannot be determined reliably or in
which the transaction lacks commercial substance, the acquisition cost is determined by reference to the net
book value of the asset delivered, plus, where appropriate, the monetary counterparts paid or pending payment,
with the limit of the fair value of the asset received if it were less.
(iii) Depreciation
Property, plant and equipment are depreciated by allocating the depreciable amount of the asset on a systematic
basis over its useful life. The depreciable amount is the cost of an asset. The Company determines the
depreciation charge separately for each component of an item of property, plant and equipment with a cost that
is significant in relation to the total cost of the asset and with a useful life that differs from the remainder of
the asset.
|
| 14
GRIFOLS, S.A.
Notes to the Half-year financial report
(Free translation from the original in Spanish. In the event of discrepancy, the Spanish-language version prevails)
(Continued on next page)
Property, plant and equipment are depreciated using the following criteria:
Depreciation method Rates %
Buildings Straight-line 2
Technical installations and machinery Straight-line 10
Other installations, equipment and furniture Straight-line 4‑10
Other property, plant and equipment Straight-line 7‑33
The Company reviews useful lives and depreciation methods at each financial year end. Changes to initially
established criteria are accounted for as a change in accounting estimates.
(iv) Subsequent costs
Subsequent to initial recognition of the asset, only the costs incurred which increase capacity or productivity
or which lengthen the useful life of the asset are capitalised. The carrying amount of parts that are replaced is
derecognised. Costs of day-to-day servicing are recognised in profit and loss as incurred.
Replacements of property, plant and equipment that qualify for capitalisation are recognised as a reduction in
the carrying amount of the items replaced. Where the cost of the replaced items has not been depreciated
independently and it is not possible to determine the respective carrying amount, the replacement cost is used
as indicative of the cost of items at the time of acquisition or construction.
(v) Impairment
The Company measures and determines impairment to be recognised or reversed based on the criteria in section
(g) Impairment of non-financial assets subject to amortisation or depreciation.
(f) Investment property
The Company classifies property leased to its subsidiaries under this caption.
Property that is being constructed or developed for future use as investment property is classified as property, plant and
equipment under development until construction or development is complete. Nevertheless, redevelopment work to
extend or improve property is classified as investment property.
The Company measures and recognises investment property following the policy for property, plant and equipment.
The Company reclassifies property, plant and equipment to investment property when it ceases to use the building in
the production or supply of goods or services, for administrative purposes or when it is held to earn rentals or for capital
appreciation or both.
Investment property is depreciated applying the following policies:
Depreciation method Rates %
Buildings and other installations Straight-line 1‑10
(g) Impairment of non-financial assets subject to amortisation or depreciation
The Company evaluates whether there are indications of possible impairment losses on non-financial assets subject to
amortisation or depreciation to verify whether the carrying amount of these assets exceeds the recoverable amount. The
recoverable amount is the higher of the fair value less costs to sell and the value in use.
Impairment losses are recognised in the income statement. |
| 15
GRIFOLS, S.A.
Notes to the Half-year financial report
(Free translation from the original in Spanish. In the event of discrepancy, the Spanish-language version prevails)
(Continued on next page)
At the end of each reporting period the Company assesses whether there is any indication that an impairment loss
recognised in prior periods may no longer exist or may have decreased. Impairment losses on goodwill are not
reversible. Impairment losses on other assets are only reversed if there has been a change in the estimates used to
calculate the recoverable amount of the asset.
A reversal of an impairment loss is recognised in the income statement. The increased carrying amount of an asset
attributable to a reversal of an impairment loss may not exceed the carrying amount that would have been determined,
net of depreciation or amortisation, had no impairment loss been recognised.
After an impairment loss or reversal of an impairment loss is recognised, the depreciation (amortisation) charge for the
asset is adjusted in future periods based on its new carrying amount.
However, if the specific circumstances of the assets indicate an irreversible loss, this is recognised directly in losses on
the disposal of fixed assets in the income statement.
(h) Leases
(i) Lessor accounting
Leases which, on inception, transfer to third parties substantially all the risks and rewards incidental to
ownership of the assets are classified as finance leases, otherwise they are classified as operating leases.
(ii) Lessee accounting
Leases in which, upon inception, the Company assumes substantially all the risks and rewards incidental to
ownership are classified as finance leases, otherwise they are classified as operating leases.
- Finance leases
At the commencement of the lease term, the Company recognises finance leases as assets and liabilities at the
lower of the fair value of the leased asset and the present value of the minimum lease payments. Initial direct
costs are added to the asset’s carrying amount. Minimum lease payments are apportioned between the finance
charge and the reduction of the outstanding liability. Interest is expensed using the effective interest method.
Contingent rents are recognised as an expense when it is probable that they will be incurred.
The accounting policies applied to the assets used by the Company by virtue of finance lease contracts are the
same as those set out in sections (e) and (f) (Property, plant and equipment or Investment Property).
- Operating leases
Lease payments under an operating lease, net of incentives received, are recognised as an expense on a straight-line basis over the lease term.
Contingent rents are recognised as an expense when it is probable that they will be incurred.
(i) Financial instruments
(i) Classification of financial instruments
Financial instruments are classified at the time of their initial recognition as a financial asset, a financial liability
or an equity instrument, in accordance with the economic substance of the contractual agreement and with the
definitions of financial assets, financial liabilities or equity instruments. |
| 16
GRIFOLS, S.A.
Notes to the Half-year financial report
(Free translation from the original in Spanish. In the event of discrepancy, the Spanish-language version prevails)
(Continued on next page)
For valuation purposes, the Company classifies financial instruments in the following categories: financial
assets and liabilities valued at amortised cost; financial assets and liabilities at fair value through profit or loss,
by considering separately those initially designated from those held for trading and those compulsorily valued
at fair value through profit or loss; financial assets measured at fair value through equity, by considering
separately the equity instruments designated as such from the rest of the financial assets; and financial assets
valued at cost.
The Company classifies a financial asset at amortised cost if it is held in the framework of a business model
whose objective is to hold financial assets to obtain contractual cash flows and the contractual terms of the
financial asset give rise, on specified dates, to cash flows which are only principal and interest payments on
the outstanding principal amount (OPIP).
The Company classifies as a financial asset at fair value through equity those financial assets whose contractual
conditions, on specified dates, result in cash flows that are solely receipts of principal and interests on the
outstanding principal amount, and they are not held for trading nor classified in the previous category. In this
category are also included the investments in equity instruments designated irrevocably by the Company at the
time of its initial recognition, as far as they are not held for trading and should not be valued at cost.
The Company classifies as a financial asset at fair value through profit or loss those financial assets held for
trading and those financial assets that have not been classified in any of the previous categories. In this category
are also included the financial assets that the Company optionally designates at the time of the initial
recognition, which otherwise would have been included in another category, as such designation eliminates or
significantly reduces a valuation inconsistency or accounting asymmetry.
The Company classifies a financial asset at cost when it is an (i) investment in the equity of group, multigroup
and associates (ii) participating loans with contingent interests, either because a fixed or conditional variable
interest rate is conditioned to the fulfilment of a milestone in the borrowing company, or because they are
calculated exclusively with respect to the evolution of the activity of the aforementioned company.
The Company classifies its financial liabilities at amortised cost.
(ii) Valuation
At the time of initial recognition, the Company values a financial asset at its fair value plus, in the case of a
financial asset that is not at fair value through profit or loss, the costs of the transaction that are directly
attributable to the acquisition. The transaction costs of financial assets at fair value through profit or loss are
taken to results. In order to determine the fair value of financial assets or liabilities, the Company uses market
data as much as possible. Based on the factors used for the measurement, the fair values are hierarchized based
on the following factors:
Level 1: estimates based on quoted prices (unadjusted) within current markets for assets or liabilities identical
to those that the company may have access at the valuation date;
Level 2: estimates based on quoted prices in active markets for similar instruments or other valuation
methodologies in which all significant variables are based on directly or indirectly observable market data; or
Level 3: estimates based on any significant variable that is not based on observable market data.
In the event that the factors used to determine the fair value of an asset or liability are included in different
levels of hierarchy, the fair value will be determined in its entirety based on the significant component located
at the lowest level of hierarchy.
(iii) Offsetting principles
A financial asset and a financial liability are offset only when the Company currently has the legally
enforceable right to offset the recognised amounts and intends either to settle on a net basis or to realise the
asset and settle the liability simultaneously.
|
| 17
GRIFOLS, S.A.
Notes to the Half-year financial report
(Free translation from the original in Spanish. In the event of discrepancy, the Spanish-language version prevails)
(Continued on next page)
(iv) Financial assets and liabilities at fair value through profit or loss
Financial assets and financial liabilities at fair value through profit or loss are initially recognised at fair value.
Transaction costs directly attributable to the acquisition or issue are recognised as an expense when incurred.
After initial recognition, they are recognized at fair value through profit or loss. Changes in the fair value
include the component of interest and dividends. The fair value is not reduced by the transaction costs that may
be incurred by their eventual sale or disposal by other means.
(v) Financial assets and liabilities at amortised cost
Financial assets and financial liabilities at amortised cost are initially recognized at their fair value, including
the transaction costs incurred, and are subsequently measured at amortised cost, using the effective interest
method.
(vi) Investments in Group companies and associates
Group companies are those over which the Company, either directly, or indirectly through subsidiaries,
exercises control as defined in article 42 of the Spanish Code of Commerce, or when the companies are
controlled by one or more individuals or entities acting jointly or under the same management through
agreements or statutory clauses.
Control is the power to govern the financial and operating policies of an entity or business so as to obtain
benefits from its activities. In assessing control, potential voting rights held by the Company or other entities
that are exercisable or convertible at the end of each reporting period are considered.
Associates are entities over which the Company, either directly, or indirectly through subsidiaries, exercises
significant influence. Significant influence is the power to participate in the financial and operating policy
decisions of the investee but is not control or joint control over those policies. The existence of potential voting
rights that are exercisable or convertible at the end of each reporting period, including potential voting rights
held by the Company or other entities, are considered when assessing whether an entity has significant
influence.
Investments in Group companies and associates are initially recognised at cost, which is equivalent to the fair
value of the consideration given, including transaction costs in the case of investments in associates, and are
subsequently measured at cost net of any accumulated impairment. The cost of investments in Group
companies acquired before 1 January 2010 includes any transaction costs incurred.
If an investment no longer qualifies for classification under this category, it is reclassified at fair value through
profit or loss, unless it is designated at fair value through equity and it is valued as such from the date of
reclassification, recognizing any difference in the profit or loss or in equity, respectively.
In non-monetary business contributions to other group companies, including investments in group companies,
the equity investments received are valued at the date the operation is carried out, for the amount representing
the percentage of participation equivalent to the book value of the net assets of the investment contributed in
the consolidated financial statements of the largest group whose parent company is Spanish according to the
Standards for the Formulation of Consolidated Annual Accounts, plus transaction costs. Any difference
between the book value of the investments received and the book value of the equity elements delivered (or
the investment contributed), is recognized in reserves.
The Company recognizes the amount contributed in a capital increase, including the preferential subscription
rights acquired, as a higher value of the equity instruments.
However, when the Company does not contribute proportionally to its stake in the issuer, it recognizes the
difference as a donation expense.
If the Company receives an asset or group of assets other than cash, the swap criteria previously indicated for
non-monetary contributions are applied.
|
| 18
GRIFOLS, S.A.
Notes to the Half-year financial report
(Free translation from the original in Spanish. In the event of discrepancy, the Spanish-language version prevails)
(Continued on next page)
(vii) Reclassifications of financial instruments
The Company reclassifies a financial asset when the business model for its management is modified or when
it meets or no longer meets the aforementioned classification criteria. The Company does not reclassify
financial liabilities.
(viii) Derecognition of financial assets
The Company applies the criteria for the derecognition of financial assets to a part of a financial asset or to a
part of a group of similar financial assets or to a financial asset or a group of similar financial assets.
Financial assets are derecognized when the rights to receive cash flows related to them have expired or have
been transferred and the Company has substantially transferred the risks and rewards derived from their
ownership.
(ix) Impairment of financial assets
A financial asset or a group of financial assets is impaired and impairment losses are incurred if there is
objective evidence of impairment as a result of one or more events that occurred after the initial recognition of
the asset and the event or events have an impact on the estimated future cash flows of the financial asset or
group of financial assets that can be reliably estimated.
Impairment of financial assets valued at amortised cost
The loss due to an impairment of financial assets valued at amortised cost is the difference between the book
value of the financial asset and the present value of the estimated future cash flows. However, the Company
uses the financial assets market value, as long as it is reliable enough to be considered representative of the
value to be recovered.
The impairment loss is recognized with charge to profit or loss and it is reversible in subsequent years, if the
decrease can be objectively related to an event subsequent to its recognition. However, the reversal of the
loss is limited to the amortised cost that the assets had if the loss due to the impairment in value had not been
recorded.
The Company directly reduces the carrying amount of a financial asset when it does not have reasonable
expectations of full or partial recovery.
Investments in Group companies
Impairment is calculated by comparing the carrying amount of the net investment in the associate with its
recoverable amount. The recoverable amount is the higher of value in use and fair value less costs to sell.
Value in use is calculated based on the Company’s share of the present value of future cash flows expected
to be derived from ordinary activities and from the disposal of the asset. Unless better evidence is available,
the investee’s equity is taken into consideration, corrected for any unrealised gains existing at the
measurement date.
In subsequent years, reversals of impairment losses in the form of increases in the recoverable amount are
recognised, up to the limit of the carrying amount that would have been determined for the investment if no
impairment loss had been recognised.
The recognition or reversal of an impairment loss is disclosed in the income statement unless it should be
recognised in equity.
Impairment of an investment is limited to the amount of the investment, except when contractual, legal or
constructive obligations have been assumed by the Company or payments have been made on behalf of the
companies. In the latter case, provision is made.
|
| 19
GRIFOLS, S.A.
Notes to the Half-year financial report
(Free translation from the original in Spanish. In the event of discrepancy, the Spanish-language version prevails)
(Continued on next page)
(x) Derecognition and modifications of financial liabilities
The Company derecognises all or part of a financial liability when it either discharges the liability by paying
the creditor or is legally released from primary responsibility for the liability either by process of law or by the
creditor. The exchange of debt instruments between the Company and the counterparty or substantial
modifications of initially recognised liabilities are accounted for as an extinguishment of the original financial
liability and the recognition of a new financial liability, provided that the instruments have substantially
different terms.
The Company considers the terms to be substantially different if the discounted present value of the cash flows
under the new terms, including any fees paid net of any fees received and discounted using the original effective
interest rate, is at least 10 per cent different from the discounted present value of the remaining cash flows of
the original financial liability.
If the exchange is accounted for as an extinguishment of the financial liability, any costs or fees incurred are
recognised as part of the gain or loss on the extinguishment. If the exchange is not accounted for as an
extinguishment, any costs or fees incurred adjust the carrying amount of the liability and are amortised over
the remaining term of the modified liability.
The difference between the carrying amount of a financial liability, or part of a financial liability, extinguished
or transferred to another party and the consideration paid, including any non-cash assets transferred or liabilities
assumed, is recognised in profit or loss.
However, the Company may designate the financial guarantee to be measured at fair value through profit or
loss.
(xi) Reverse factoring
The Company has contracted reverse factoring facilities with various financial institutions to manage payments
to suppliers. Trade payables settled under the management of financial institutions are recognised under “trade
and other payables” in the balance sheet until they are settled, repaid or have expired.
(j) Hedge accounting
Derivative financial instruments are initially recognized following the criteria set forth above for financial assets and
liabilities. Derivative financial instruments that do not meet the hedge accounting criteria are classified and valued as
financial assets or liabilities at fair value through profit or loss.
(k) Own equity instruments held by the Company
Equity instruments acquired by the Company are shown separately at cost of acquisition as a reduction in capital and
reserves in the balance sheet. Any gains or losses on transactions with own equity instruments are not recognised in
profit or loss.
Transaction costs related to own equity instruments, including issue costs related to a business combination, are
accounted for as a deduction from reserves, net of any tax effect.
(l) Inventories
(i) General
Inventories are measured using the FIFO (first in, first out) method. When the cost of inventories exceeds
replacement value, materials are written down to net realisable value.
Inventories are mainly spare parts used to maintain the Company’s buildings and facilities.
Emission allowances
Emission allowances acquired are classified and measured by applying accounting policies. |
| 20
GRIFOLS, S.A.
Notes to the Half-year financial report
(Free translation from the original in Spanish. In the event of discrepancy, the Spanish-language version prevails)
(Continued on next page)
(m) Cash and cash equivalents
Cash and cash equivalents include cash on hand and demand deposits in financial institutions. They also include other
short-term, highly liquid investments that are readily convertible to known amounts of cash and which are subject to
an insignificant risk of changes in value. An investment normally qualifies as a cash equivalent when it has a maturity
of less than three months from the date of acquisition.
(n) Grants
Grants are recorded in recognised income and expense when, where applicable, they have been officially awarded and
the conditions attached to them have been met or there is reasonable assurance that they will be received.
Grants that are given to finance specific expenses are recognised as income in the same year as the finance cost is
accrued.
(o) Defined contribution plans
The Company recognises the contributions payable to a defined contribution plan in exchange for a service when an
employee has rendered service to the Company. The contributions payable are recognised as an expense for employee
remuneration and as a liability after deducting any contribution already paid. If the contribution already paid exceeds
the contribution due for service before the end of the period, the Company only recognises that excess as an asset
(prepaid expense) to the extent that the prepayments will lead to, for example, a reduction in future payments or cash
refund.
(p) Provisions
(i) General criteria
Provisions are recognised when the Company has a present obligation (legal, contractual, constructive or tacit)
as a result of a past event; it is probable that an outflow of resources embodying economic benefits will be
required to settle the obligation; and a reliable estimate can be made of the amount of the obligation.
The amount recognised as a provision is the best estimate of the expenditure required to settle the present
obligation at the end of the reporting period, taking into account all risks and uncertainties surrounding the
amount to be recognised as a provision and, where the time value of money is material, the financial effect of
discounting provided that the expenditure to be made each period can be reliably estimated. The discount rate
is a pre-tax rate that reflects the time value of money and the specific risks for which future cash flows
associated with the provision have not been adjusted at each reporting date.
If it is not probable that an outflow of resources will be required to settle an obligation, the provision is reversed.
(ii) Provisions for taxes
Provisions for taxes are measured at the estimated amount of tax debt calculated in accordance with the
aforementioned criteria. Provision is made with a charge to income tax for the tax expense for the year, to
finance costs for the late payment interest, and to other income for the penalty. The effects of changes in
estimates of prior years’ provisions are recognised according to their nature, unless they involve the correction
of an error.
(q) Revenue
(i) Revenue from the rendering of services
Revenue from the rendering of services is measured at the fair value of the consideration received or receivable.
Practically all services are rendered to Group companies.
|
| 21
GRIFOLS, S.A.
Notes to the Half-year financial report
(Free translation from the original in Spanish. In the event of discrepancy, the Spanish-language version prevails)
(Continued on next page)
(ii) Interests and dividends
The Company recognizes interests and dividends on financial assets accrued after the acquisition date as
income in the profit and loss.
The Company recognizes interests on financial assets valued at amortised cost using the effective interest
method and dividends when the Company is entitled to receive them.
In the initial valuation of financial assets, the Company records separately, based on their maturity, the amount
of explicit interest accrued and not due at that time, as well as the amount of dividends agreed by the competent
authority at the time of the acquisition. As a result, these amounts are not recognized as income in the profit or
loss.
If the dividends are clearly derived from profits generated prior to the acquisition date because amounts higher
than the profits generated by the investment since the acquisition have been distributed, the carrying amount
of the investment is reduced. This criterion is applied regardless of the valuation criterion used for the equity
instruments, so for equity instruments valued at fair value, the value of the investment is also reduced and an
increase in subsequent value in the profit or loss account or in equity is recognized, based on the instruments
classification.
The Company recognizes the dividends received by the delivery of an equity element or group of equity
elements other than cash, in accordance with the previously indicated criteria. However, if the dividend is
received as a business of a group company, the criteria indicated in BOICAC 85 should be applied.
Interest and dividend income are classified as revenue when they form part of the Company’s ordinary activity.
(r) Income tax
The income tax expense or tax income for the year comprises current tax and deferred tax.
Current tax assets or liabilities are measured at the amount expected to be paid to or recovered from the taxation
authorities, using the tax rates and tax laws that have been enacted or substantially enacted at the reporting date.
Current and deferred tax are recognised as income or an expense and included in profit or loss for the year, except to
the extent that the tax arises from a transaction or event which is recognised, in the same or a different year, directly in
equity, or from a business combination.
Government assistance provided in the form of deductions and other tax relief applicable to income tax payable is
recognised as a reduction in the income tax expense in the year in which it is accrued.
The Company files consolidated tax returns with its Spanish subsidiaries: Laboratorios Grifols, S.A., Instituto Grifols,
S.A., Grifols Movaco, S.A., Biomat, S.A., Grifols International, S.A., Araclon Biotech, S.L., Grifols Engineering, S.A.,
Grifols Viajes S.A., Aigües Minerals de Vilajuïga, S.A. and Biotest Medical S.L.U.
In addition to the factors to be considered for individual taxation, set out previously, the following factors are taken
into account when determining the accrued income tax expense for the companies forming the consolidated tax group:
- Temporary and permanent differences arising from the elimination of profits and losses on transactions between
Group companies, derived from the process of determining consolidated taxable income.
- Deductions and credits corresponding to each company forming the consolidated tax group. For these purposes,
deductions and credits are allocated to the company that carried out the activity or obtained the profit necessary to
obtain the right to the deduction or tax credit.
Temporary differences arising from the elimination of profits and losses on transactions between tax group companies
are allocated to the company which recognised the profit/loss and are valued using the tax rate of that company. |
| 22
GRIFOLS, S.A.
Notes to the Half-year financial report
(Free translation from the original in Spanish. In the event of discrepancy, the Spanish-language version prevails)
(Continued on next page)
A reciprocal credit and debit arises between the companies that contribute tax losses to the consolidated Group and the
rest of the companies that offset those losses. Where a tax loss cannot be offset by the other consolidated Group
companies, these tax credits for loss carryforwards are recognised as deferred tax assets using the applicable recognition
criteria, considering the tax group as a taxable entity.
The Parent of the Group records the total consolidated income tax payable under payable to Group companies.
The amount of the debt relating to the subsidiaries is recognised as receivables from Group companies.
(i) Deferred Tax liabilities
Deferred tax liabilities derived from taxable temporary differences are recognised in all cases except where
they arise from the initial recognition of goodwill or an asset or liability in a transaction that is not a business
combination and, at the time of the transaction, affects neither accounting profit nor taxable income.
(ii) Deferred Tax assets
Deferred tax assets derived from deductible temporary differences are recognised provided that it is probable
that sufficient taxable income will be available against which they can be utilised or when the tax legislation
considers the possibility to convert future assets for deferred taxes on receivables in front of the Public
Administration.
Nonetheless, assets arising from the initial recognition of an asset or liability in a transaction that is not a
business combination and, at the time of the transaction, affects neither accounting profit nor taxable income,
are not recognised.
(iii) Measurement
Deferred tax assets and liabilities are measured at the tax rates that are expected to apply to the years when the
asset is realised or the liability is settled, based on tax rates and tax laws that have been enacted or substantially
enacted. The tax consequences that would follow from the manner in which the Company expects to recover
or settle the carrying amount of its assets or liabilities are also reflected in the measurement of deferred tax
assets and liabilities.
(iv) Offset and classification
The Company only offsets tax assets and liabilities if it has a legally enforceable right to offset the recognised
amounts and intends either to settle on a net basis or to realise the assets and settle the liabilities simultaneously.
Deferred tax assets and liabilities are recognised in the balance sheet under non-current assets or liabilities,
irrespective of the expected date of recovery or settlement.
(s) Share-based payment transactions
The Company has granted various equity-based compensation plans to certain members of the management team who
are serving the company, which will be settled with either equity instruments or in cash, depending on the plan.
The granted equity instruments become irrevocable when employees complete a certain service period and meet the
objectives established in the incentive plan. Grifols recognizes the services received from its employees as such services
are rendered during the irrevocable period, as a personnel expense in the income statement, and on the other hand, the
corresponding increase in equity if the transaction is settled with equity instruments or the corresponding liability if the
transaction is settled in cash, with an amount based on the value of the equity instruments.
In transactions with employees settled with equity instruments, the recognized amount corresponds to the amount that
will be settled once the agreed conditions are met and will not be revised or revalued during the accrual period, as the
commitment is settled in shares. If an employee resigns before the accrual period ends, they will only receive the agreed
incentive in shares. The fair value of the services received is estimated by estimating the fair value of the shares granted
at the grant date, net of estimated dividends to which the employee is not entitled during the performance period. |
| 23
GRIFOLS, S.A.
Notes to the Half-year financial report
(Free translation from the original in Spanish. In the event of discrepancy, the Spanish-language version prevails)
(Continued on next page)
In plans settled in cash, the services received and the corresponding liability are recognized at the fair value of the
liability, as of the date the recognition criteria are met. Subsequently, and until settlement, the corresponding liability
will be valued at its fair value at the end of each reporting period, with any changes in valuation during the period
charged to the income statement. The fair value is determined by reference to the market value of the shares at the date
of estimation, net of estimated dividends to which the employee is not entitled during the performance period.
The Company assumes the payment related to employees of other group companies. Therefore, the Company
recognizes the accrued cost of the plan in accordance with the criteria set out above as an increase in the investment in
the subsidiary with credit to the "Other equity instruments" heading if the transaction is settled with equity instruments,
or as a liability if the transaction is settled in cash.
(t) Classification of assets and liabilities as current and non-current
The Company classifies assets and liabilities in the balance sheet as current and non-current. Current assets and
liabilities are determined as follows:
- Assets are classified as current when they are expected to be realised or are intended for sale or consumption in
the Company’s normal operating cycle, they are held primarily for the purpose of trading, they are expected to be
realised within twelve months after the reporting date or are cash or a cash equivalent.
- Liabilities are classified as current when they are expected to be settled in the Company’s normal operating cycle,
they are held primarily for the purpose of trading, or they are due to be settled within twelve months after the
reporting date.
(u) Environmental issues
The Company takes measures to prevent, reduce or repair the damage caused to the environment by its activities.
Expenses derived from environmental activities are recognised as other operating expenses in the period in which they
are incurred.
Property, plant and equipment acquired by the Company to minimise the environmental impact of its activity and
protect and improve the environment, including the reduction and elimination of future pollution from the Company’s
activities, are recognised as assets applying the measurement, presentation and disclosure criteria described in section
(e) Property, plant and equipment.
(v) Transactions between Group companies
Transactions between Group companies, except those related to mergers, spin-offs and non-cash business contributions,
are recognised at the fair value of the consideration given or received. The difference between this value and the amount
agreed is recognised in line with the underlying economic substance of the transaction.
In non-monetary contributions to Group companies, the contributor will value its interests at the carrying amount of
the equity investments, in the consolidated financial statements at the date the transaction occurred.
Any difference between the value assigned to the interest received by the contributor and the carrying amount of the
investments contributed will be recognised in reserves.
(w) Non-current assets and disposal groups held for sale
All related assets and liabilities to which active efforts have been initiated for their sale, are available in their current
condition for sale, and it is highly probable that the sale will be completed within the next twelve months, are classified
as held for sale. These assets are presented valued at the lower of their carrying amount and fair value less costs to sell
and are not subject to depreciation from the moment they are classified as non-current assets held for sale.
In the event of delays caused by events or circumstances beyond the control of Grifols and if there is sufficient evidence
that the commitment to the plan to sell those classified as held for sale is maintained, the classification is maintained
even if the period to complete the sale extends beyond one year. |
| 24
GRIFOLS, S.A.
Notes to the Half-year financial report
(Free translation from the original in Spanish. In the event of discrepancy, the Spanish-language version prevails)
(Continued on next page)
Non-current assets held for sale are presented on the balance sheet under the headings "Non-current assets held for
sale" for assets, and "Liabilities related to non-current assets held for sale" for liabilities, if any.
Additionally, discontinued operations are considered to be components (cash-generating units or groups of cash-generating units) representing a significant business unit or geographic area of operations that can be considered
separate from the rest, which have been sold or disposed of by other means, or that meet the conditions to be classified
as held for sale. Also, entities acquired solely for the purpose of resale are considered discontinued operations. The
post-tax results of discontinued operations are presented in a single line of the income statement called "Profit (Loss)
from discontinued operations net of taxes".
(5) Business combinations
The Company merged with Gripdan Invest, S.L. and Grifols Escrow Issuer, S.A. in 2023. Gripdan Invest, S.L. was
based in Barcelona and its main activities included buying and selling, intermediation, leasing, administration, and
operation in any form of rural and urban properties. It also engaged in various construction projects, both public and
private, including buildings and developments of all kinds. The company was also involved in the management, advice,
administration, organization, and operation of projects related to the construction of real estate, its repair, and
maintenance, whether on its own behalf or on behalf of third parties. Grifols Escrow Issuer, S.A., based in Barcelona,
primarily offered services in the administration, management, and control of companies and businesses. Additionally,
the investment in tangible assets, advisory services to any affiliated entities or those within the same group and
financing activities, particularly through the issuance, negotiation, and placement of bonds.
The merger project has been prepared and signed by the administrators of both companies on April 13, 2023, and
registered in the Commercial Registry of Barcelona on July 7, 2023. For the purposes of the merger project, January 1,
2023, has been considered as the effective date for accounting and acquisition.
As of December 31, 2022, the Company held an investment in Gripdan Invest, S.L. amounting to Euros 24,583
thousand and in Grifols Escrow Issuer, S.A. amounting to Euros 2,667 thousand. Both companies were 100% owned
by Grifols, S.A.
The breakdown of the business combination cost, the value of acquired net assets, and the excess of acquired net assets
over the cost of the combination is as follows:
Gripdan Invest, S.L. Grifols Escrow
Issuer, S.A.
Business combination costs
Investment value 24,583 2,667
Value of the acquired net assets 20,477 5,050
Reserves (4,106) 2,383
Thousand Euros
|

| 25
GRIFOLS, S.A.
Notes to the Half-year financial report
(Free translation from the original in Spanish. In the event of discrepancy, the Spanish-language version prevails)
(Continued on next page)
For the company Gripdan Invest, S.L., the amounts recognized at the acquisition date for assets and liabilities are based
on their consolidated value obtained from consolidated financial statements prepared in accordance with the Standards
for the Preparation of Consolidated Annual Accounts (NOFCAC) and are as follows:
Consolidated values Assigned value
Investment property 32,210 32,210
Non-current investments 603 603
Deferred tax assets 29 29
Trade and other receivables 483 483
Total assets 33,325 33,325
Non-current payables 666 666
Group companies and associates, non-current 8,573 8,573
Deferred tax liabilites 2,983 2,983
Group companies and associates, current 624 624
Trade and other payables 2 2
Total liabilities 12,848 12,848
Total net assets 20,477 20,477
Total net assets acquired 20,477
Thousand Euros
For the company Grifols Escrow Issuer, S.A., the amounts recognized at the acquisition date for assets and liabilities
are based on their consolidated value obtained from consolidated financial statements prepared in accordance with the
Standards for the Preparation of Consolidated Annual Accounts (NOFCAC) and are as follows:
Consolidated values Assigned value
Non-current investments in Group companies and associates 2,017,065 2,017,065
Deferred tax assets 5,799 5,799
Current investments in Group companies and associates 25,698 25,698
Total assets 2,048,562 2,048,562
Non-current payables 2,025,448 2,025,448
Current payables 17,843 17,843
Group companies and associates, current 215 215
Trade and other payables 6 6
Total liabilities 2,043,512 2,043,512
Total net assets 5,050 5,050
Total net assets acquired 5,050
Thousand Euros |

| 26
GRIFOLS, S.A.
Notes to the Half-year financial report
(Free translation from the original in Spanish. In the event of discrepancy, the Spanish-language version prevails)
(Continued on next page)
The information required in accordance with the provisions of article 86 of chapter VII of the Corporate Tax Law
27/2014, of November 27, in relation to the merger operations described above, is detailed below.
The merger has been subject to the tax neutrality regime.
1. Latest balance sheet of the transferring company
The balance sheet of the companies Gripdan Invest, S.L. and Grifols Escrow Issuer, S.A. is attached in Appendix XIII.
2. Year in which the transferring company acquired the transferred assets susceptible to amortization
2011 2022
Land 16,521 - 16,521 - 16,521
Buildings 20,121 32 20,153 (16,394) 3,759
Total cost 36,642 32 36,674 (16,394) 20,280
Thousand Euros
Investment property
Cost/Acquisition year
Total Cost
Accumulated
amortisation Net value
3. List of acquired assets that have been incorporated into the accounting books for a value different from that for which
they appeared in those of the transferring company.
For the merger of Gripdan Invest, S.L., the land and buildings have been incorporated into the Company for a value of
Euros 32,210 thousand (consolidation value recognized in Grifols, S.A. according to local accounting regulation), while
the value in the absorbed company was Euros 20,280 thousand. Additionally, and related to this difference, a deferred
tax liability of Euros 2,983 thousand has also been recognized.
For the merger of Grifols Escrow Issuer, S.A., all assets and liabilities have been incorporated into the Company for
the same book value as those recorded in the absorbed company.
4. List of tax benefits enjoyed by the transferring company with respect to which the absorbing company must assume
compliance with certain requirements
There were no tax benefits in the absorbed companies that have been incorporated into Grifols, S.A.
5. List of tax credits pending compensation by the transferring company that are transferred to the absorbing company.
In the case of Gripdan Invest, S.L., there were no tax credits pending compensation.
In the case of Grifols Escrow Issuer, S.A., there were tax credits worth 5,614 thousand euros for limitation of financial
expenses and 185 thousand euros for negative tax bases generated in the year 2022. As of January 1, 2023, the entire
tax credits were activated in the absorbed company.
|
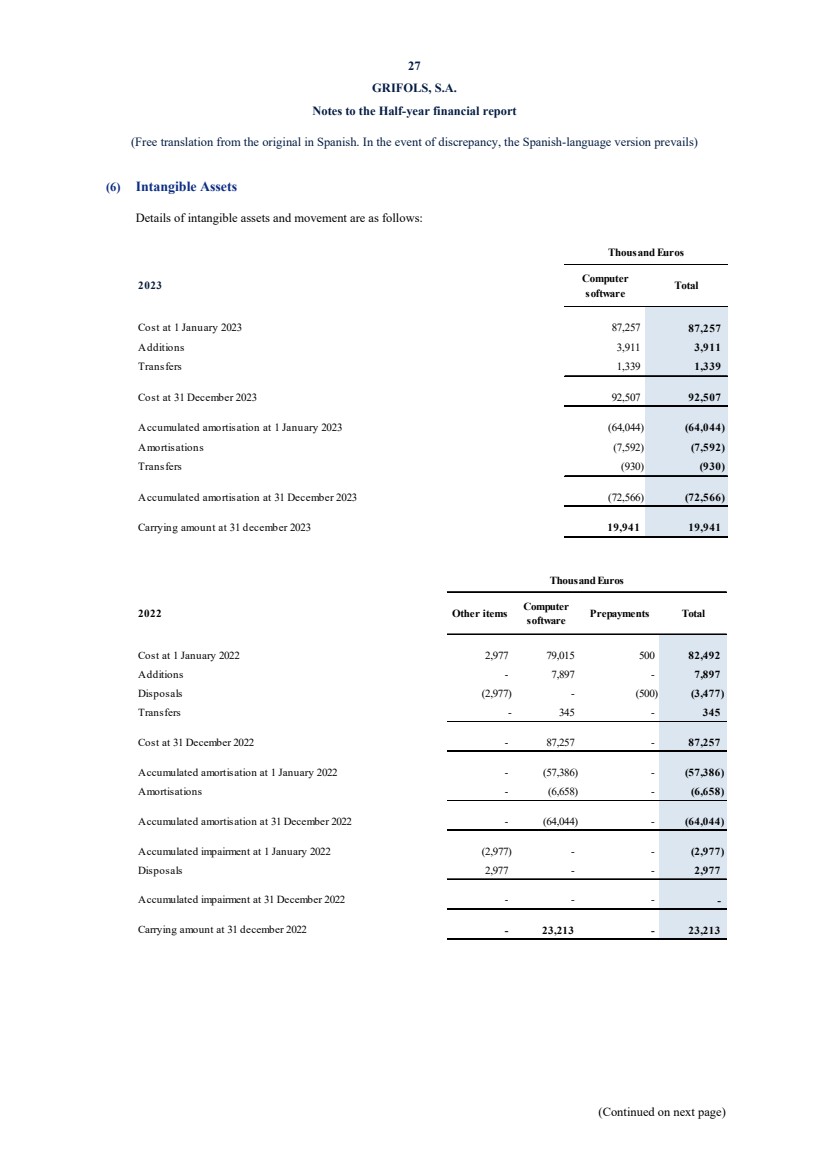
| 27
GRIFOLS, S.A.
Notes to the Half-year financial report
(Free translation from the original in Spanish. In the event of discrepancy, the Spanish-language version prevails)
(Continued on next page)
(6) Intangible Assets
Details of intangible assets and movement are as follows:
2023 Computer
software Total
Cost at 1 January 2023 87,257 87,257
Additions 3,911 3,911
Transfers 1,339 1,339
Cost at 31 December 2023 92,507 92,507
Accumulated amortisation at 1 January 2023 (64,044) (64,044)
Amortisations (7,592) (7,592)
Transfers (930) (930)
Accumulated amortisation at 31 December 2023 (72,566) (72,566)
Carrying amount at 31 december 2023 19,941 19,941
Thousand Euros
2022 Other items Computer
software Prepayments Total
Cost at 1 January 2022 2,977 79,015 500 82,492
Additions - 7,897 - 7,897
Disposals (2,977) - (500) (3,477)
Transfers - 345 - 345
Cost at 31 December 2022 - 87,257 - 87,257
Accumulated amortisation at 1 January 2022 - (57,386) - (57,386)
Amortisations - (6,658) - (6,658)
Accumulated amortisation at 31 December 2022 - (64,044) - (64,044)
Accumulated impairment at 1 January 2022 (2,977) - - (2,977)
Disposals 2,977 - - 2,977
Accumulated impairment at 31 December 2022 - - - -
Carrying amount at 31 december 2022 23,213 - - 23,213
Thousand Euros
|
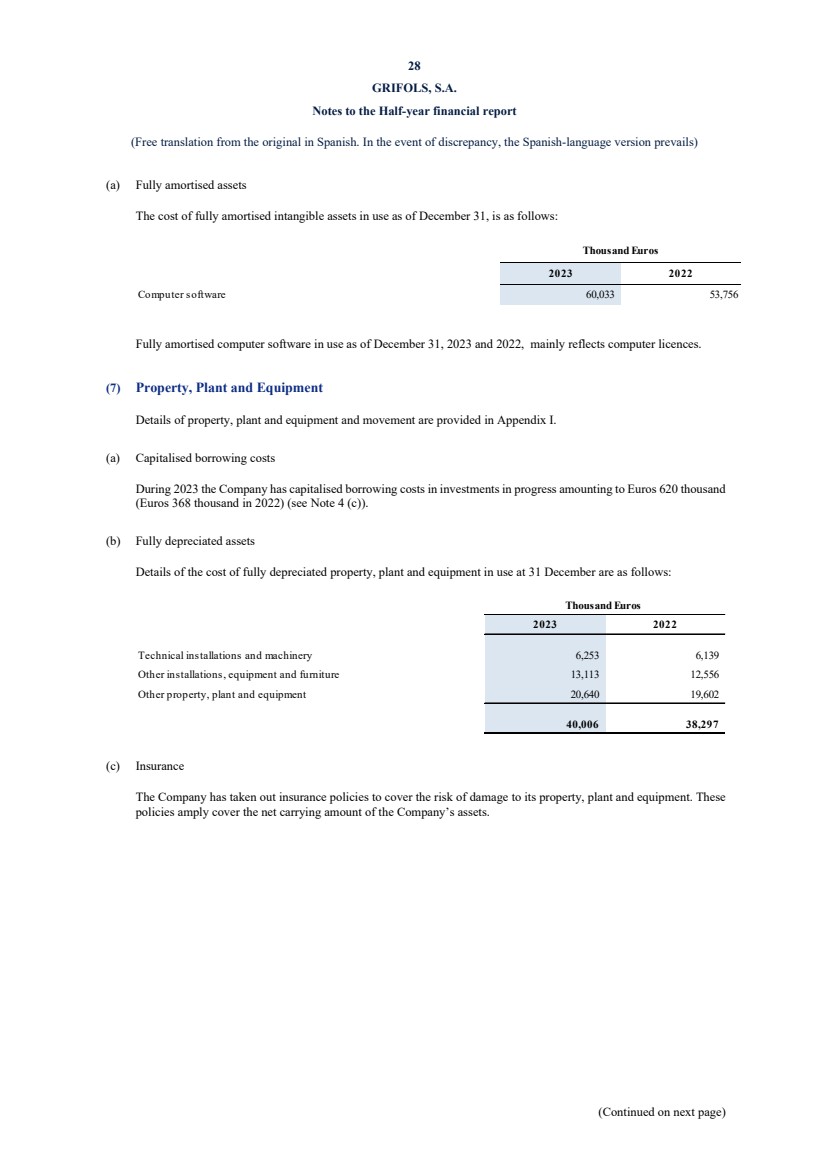
| 28
GRIFOLS, S.A.
Notes to the Half-year financial report
(Free translation from the original in Spanish. In the event of discrepancy, the Spanish-language version prevails)
(Continued on next page)
(a) Fully amortised assets
The cost of fully amortised intangible assets in use as of December 31, is as follows:
Computer software 60,033 53,756
Thousand Euros
2023 2022
Fully amortised computer software in use as of December 31, 2023 and 2022, mainly reflects computer licences.
(7) Property, Plant and Equipment
Details of property, plant and equipment and movement are provided in Appendix I.
(a) Capitalised borrowing costs
During 2023 the Company has capitalised borrowing costs in investments in progress amounting to Euros 620 thousand
(Euros 368 thousand in 2022) (see Note 4 (c)).
(b) Fully depreciated assets
Details of the cost of fully depreciated property, plant and equipment in use at 31 December are as follows:
Technical installations and machinery 6,253 6,139
Other installations, equipment and furniture 13,113 12,556
Other property, plant and equipment 20,640 19,602
40,006 38,297
Thousand Euros
2023 2022
(c) Insurance
The Company has taken out insurance policies to cover the risk of damage to its property, plant and equipment. These
policies amply cover the net carrying amount of the Company’s assets. |
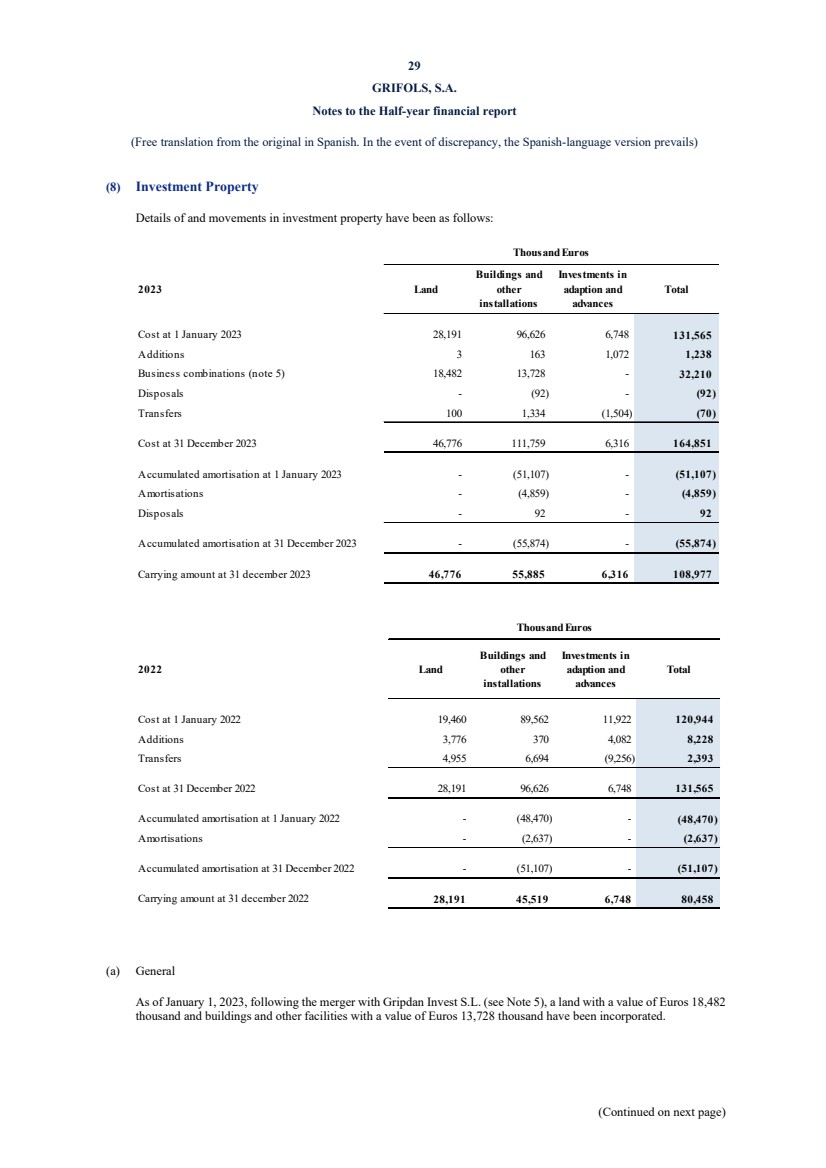
| 29
GRIFOLS, S.A.
Notes to the Half-year financial report
(Free translation from the original in Spanish. In the event of discrepancy, the Spanish-language version prevails)
(Continued on next page)
(8) Investment Property
Details of and movements in investment property have been as follows:
2023 Land
Buildings and
other
installations
Investments in
adaption and
advances
Total
Cost at 1 January 2023 28,191 96,626 6,748 131,565
Additions 3 163 1,072 1,238
Business combinations (note 5) 18,482 13,728 - 32,210
Disposals - (92) - (92)
Transfers 100 1,334 (1,504) (70)
Cost at 31 December 2023 46,776 111,759 6,316 164,851
Accumulated amortisation at 1 January 2023 - (51,107) - (51,107)
Amortisations - (4,859) - (4,859)
Disposals - 92 - 92
Accumulated amortisation at 31 December 2023 - (55,874) - (55,874)
Carrying amount at 31 december 2023 46,776 55,885 6,316 108,977
Thousand Euros
2022 Land
Buildings and
other
installations
Investments in
adaption and
advances
Total
Cost at 1 January 2022 19,460 89,562 11,922 120,944
Additions 3,776 370 4,082 8,228
Transfers 4,955 6,694 (9,256) 2,393
Cost at 31 December 2022 28,191 96,626 6,748 131,565
Accumulated amortisation at 1 January 2022 - (48,470) - (48,470)
Amortisations - (2,637) - (2,637)
Accumulated amortisation at 31 December 2022 - (51,107) - (51,107)
Carrying amount at 31 december 2022 28,191 45,519 6,748 80,458
Thousand Euros
(a) General
As of January 1, 2023, following the merger with Gripdan Invest S.L. (see Note 5), a land with a value of Euros 18,482
thousand and buildings and other facilities with a value of Euros 13,728 thousand have been incorporated. |
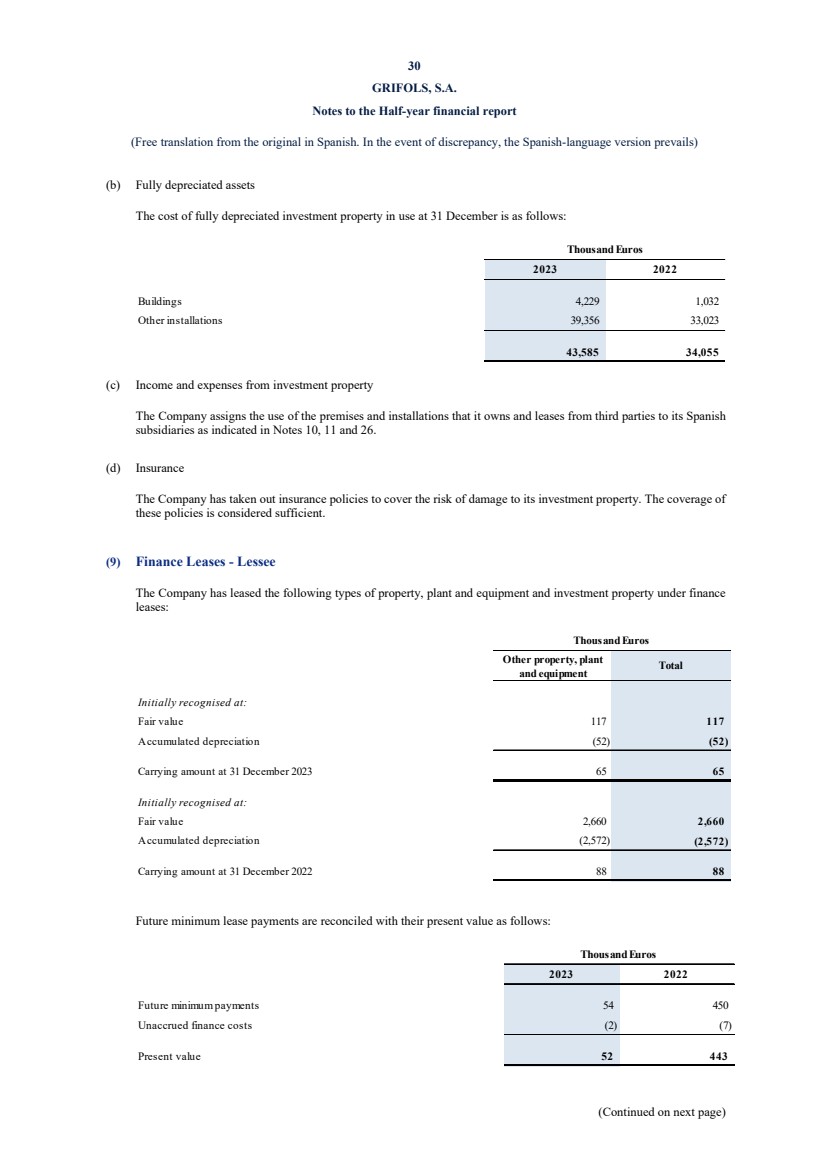
| 30
GRIFOLS, S.A.
Notes to the Half-year financial report
(Free translation from the original in Spanish. In the event of discrepancy, the Spanish-language version prevails)
(Continued on next page)
(b) Fully depreciated assets
The cost of fully depreciated investment property in use at 31 December is as follows:
Buildings 4,229 1,032
Other installations 39,356 33,023
43,585 34,055
Thousand Euros
2023 2022
(c) Income and expenses from investment property
The Company assigns the use of the premises and installations that it owns and leases from third parties to its Spanish
subsidiaries as indicated in Notes 10, 11 and 26.
(d) Insurance
The Company has taken out insurance policies to cover the risk of damage to its investment property. The coverage of
these policies is considered sufficient.
(9) Finance Leases - Lessee
The Company has leased the following types of property, plant and equipment and investment property under finance
leases:
Other property, plant
and equipment Total
Initially recognised at:
Fair value 117 117
Accumulated depreciation (52) (52)
Carrying amount at 31 December 2023 65 65
Initially recognised at:
Fair value 2,660 2,660
Accumulated depreciation (2,572) (2,572)
Carrying amount at 31 December 2022 88 88
Thousand Euros
Future minimum lease payments are reconciled with their present value as follows:
2023 2022
Future minimum payments 54 450
Unaccrued finance costs (2) (7)
Present value 52 443
Thousand Euros |
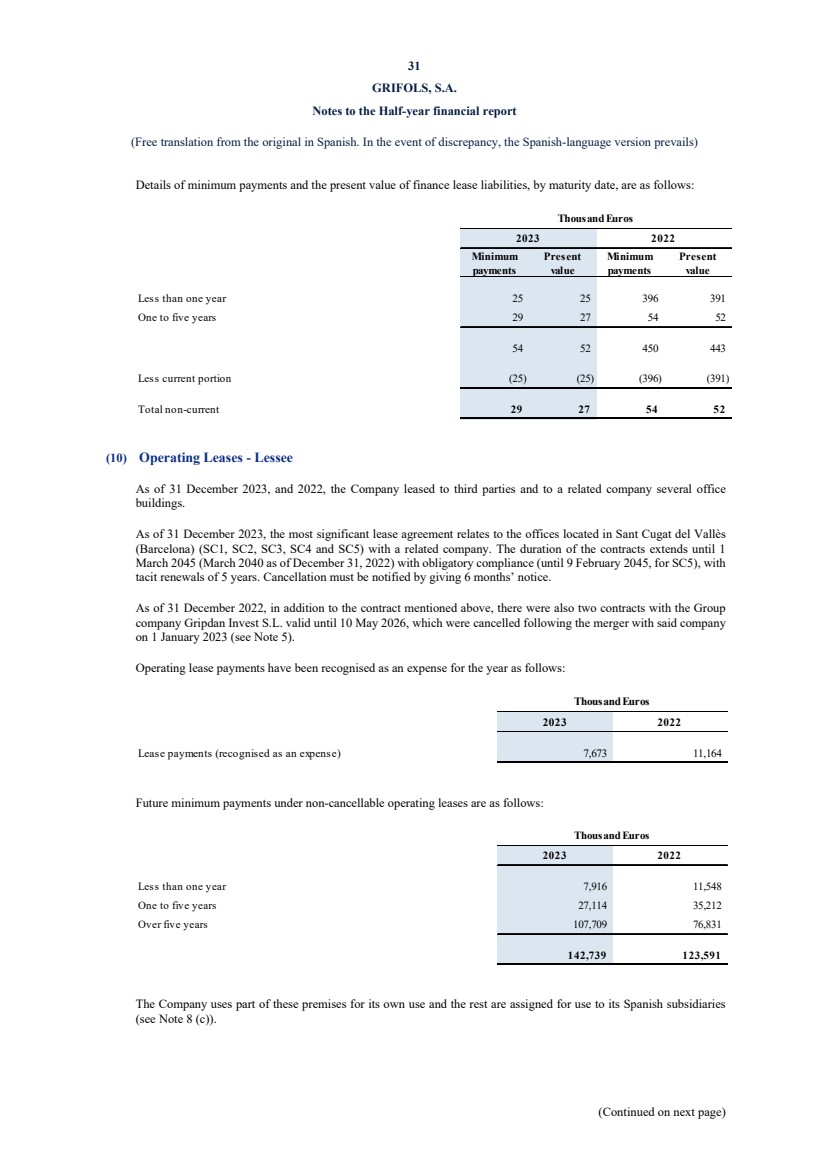
| 31
GRIFOLS, S.A.
Notes to the Half-year financial report
(Free translation from the original in Spanish. In the event of discrepancy, the Spanish-language version prevails)
(Continued on next page)
Details of minimum payments and the present value of finance lease liabilities, by maturity date, are as follows:
Minimum
payments
Present
value
Minimum
payments
Present
value
Less than one year 25 25 396 391
One to five years 29 27 54 52
54 52 450 443
Less current portion (25) (25) (396) (391)
Total non-current 29 27 54 52
Thousand Euros
2023 2022
(10) Operating Leases - Lessee
As of 31 December 2023, and 2022, the Company leased to third parties and to a related company several office
buildings.
As of 31 December 2023, the most significant lease agreement relates to the offices located in Sant Cugat del Vallès
(Barcelona) (SC1, SC2, SC3, SC4 and SC5) with a related company. The duration of the contracts extends until 1
March 2045 (March 2040 as of December 31, 2022) with obligatory compliance (until 9 February 2045, for SC5), with
tacit renewals of 5 years. Cancellation must be notified by giving 6 months’ notice.
As of 31 December 2022, in addition to the contract mentioned above, there were also two contracts with the Group
company Gripdan Invest S.L. valid until 10 May 2026, which were cancelled following the merger with said company
on 1 January 2023 (see Note 5).
Operating lease payments have been recognised as an expense for the year as follows:
2023 2022
Lease payments (recognised as an expense) 7,673 11,164
Thousand Euros
Future minimum payments under non-cancellable operating leases are as follows:
2023 2022
Less than one year 7,916 11,548
One to five years 27,114 35,212
Over five years 107,709 76,831
142,739 123,591
Thousand Euros
The Company uses part of these premises for its own use and the rest are assigned for use to its Spanish subsidiaries
(see Note 8 (c)). |

| 32
GRIFOLS, S.A.
Notes to the Half-year financial report
(Free translation from the original in Spanish. In the event of discrepancy, the Spanish-language version prevails)
(Continued on next page)
(11) Assignment for Use of Premises and Installations
As described in Note 8 (c), Note 10 and Note 26, the Company assigns the use of the premises and installations that it
owns and leases from third parties to its Spanish subsidiaries.
Services included in the assignment for use agreements are surveillance, cleaning of common areas, greeting and
messaging, maintenance and water, energy and gas supplies. In order to take advantage of these services, the Spanish
subsidiaries will use the premises in accordance with the statutory activity.
Contracts signed with its subsidiaries are renewed automatically on an annual basis and can be cancelled at any time
with three months’ prior notice. The minimum non-cancellable amount receivable totals Euros 8,794 thousand as of
December 31, 2023 (Euros 11,874 thousand in 2022).
(12) Risk Management Policy
(a) Financial risk factors
The Company's activities are exposed to various financial risks: market risk (including currency risk, fair value interest
rate risk and price risk), credit risk, liquidity risk, and cash flow interest rate risk. The Company’s global risk
management programme focuses on uncertainty in the financial markets and aims to minimise potentially adverse
effects on the Company’s profits.
The Company’s risk management policies are established in order to identify and analyse the risks to which the
Company is exposed, establish suitable risk limits and controls, and control risks and compliance with limits. Risk
management procedures and policies are regularly reviewed to ensure they take into account changes in market
conditions and in the Company’s activities. The Company’s management procedures and rules are designed to create
a strict and constructive control environment in which all employees understand their duties and obligations.
The Group’s Audit Committee supervises how management controls compliance with the Group’s risk management
procedures and policies and reviews whether the risk management policy is suitable considering the risks to which the
Group is exposed. This committee is assisted by Internal Audit which acts as supervisor. Internal Audit performs regular
and ad hoc reviews of the risk management controls and procedures and reports its findings to the Audit Committee.
Market risk
Market risk is the risk that changes in market prices, for example, exchange rates, interest rates or the prices of equity
instruments, affect the Company’s subsidiaries revenues or the value of the financial instruments that the Company
holds. The objective of managing market risk is to manage and control the Company and its subsidiaries exposure to
this risk within reasonable parameters at the same time as optimizing returns.
(i) Market risk
The Company is not exposed to market risks associated with non-financial assets. Even though, the Group is
exposed to the price risk affecting raw materials, that is mitigated by the vertical integration of the hemoderivatives
business in a highly-concentrated industry.
(ii) Currency risk
The Company operates internationally and is therefore exposed to currency risk when operating with foreign
currencies, especially with regard to the US Dollar. Currency risk is associated with recognised assets and
liabilities, and net investments in foreign operations.
The Company holds several investments in foreign operations, the net assets of which are exposed to currency
risk. Currency risk affecting net assets of the Company’s foreign operations in US Dollars is mitigated primarily
through borrowings in the corresponding foreign currency.
Details of financial assets and liabilities denominated in foreign currency, as well as transactions denominated in
foreign currency are presented in the Notes 15 and 22. |
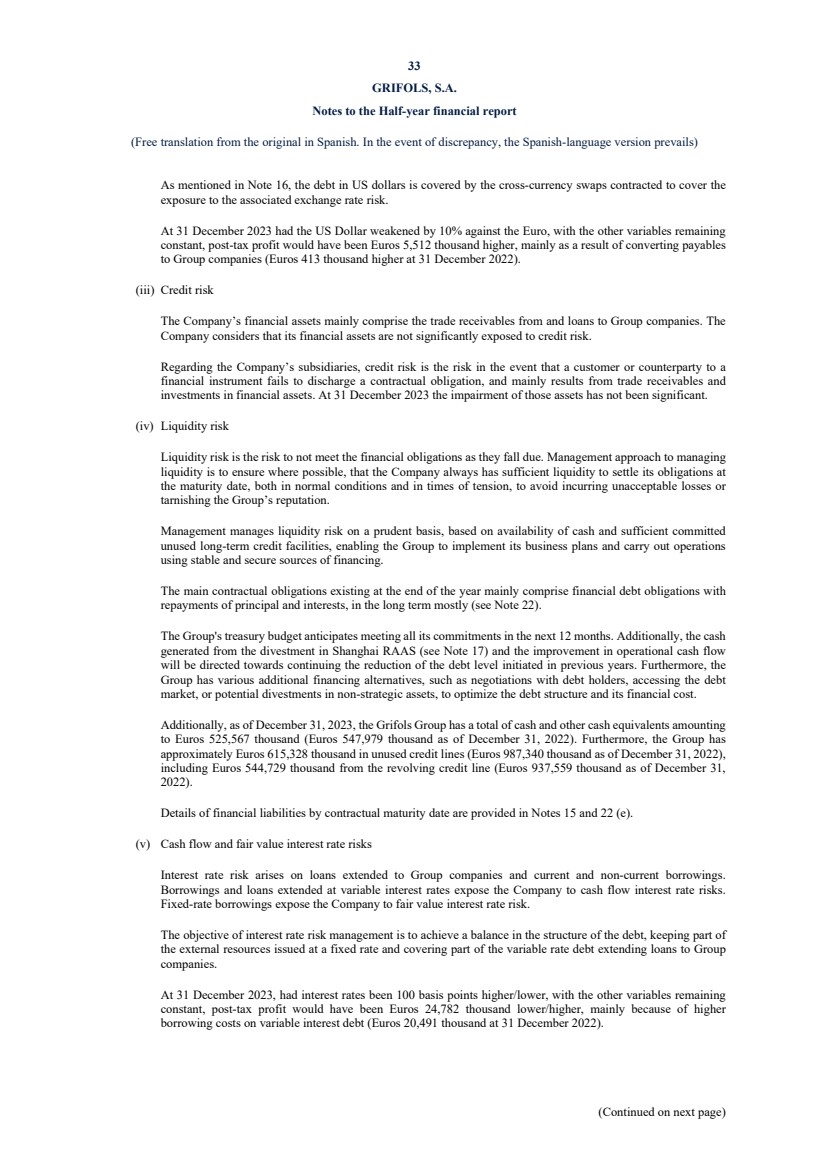
| 33
GRIFOLS, S.A.
Notes to the Half-year financial report
(Free translation from the original in Spanish. In the event of discrepancy, the Spanish-language version prevails)
(Continued on next page)
As mentioned in Note 16, the debt in US dollars is covered by the cross-currency swaps contracted to cover the
exposure to the associated exchange rate risk.
At 31 December 2023 had the US Dollar weakened by 10% against the Euro, with the other variables remaining
constant, post-tax profit would have been Euros 5,512 thousand higher, mainly as a result of converting payables
to Group companies (Euros 413 thousand higher at 31 December 2022).
(iii) Credit risk
The Company’s financial assets mainly comprise the trade receivables from and loans to Group companies. The
Company considers that its financial assets are not significantly exposed to credit risk.
Regarding the Company’s subsidiaries, credit risk is the risk in the event that a customer or counterparty to a
financial instrument fails to discharge a contractual obligation, and mainly results from trade receivables and
investments in financial assets. At 31 December 2023 the impairment of those assets has not been significant.
(iv) Liquidity risk
Liquidity risk is the risk to not meet the financial obligations as they fall due. Management approach to managing
liquidity is to ensure where possible, that the Company always has sufficient liquidity to settle its obligations at
the maturity date, both in normal conditions and in times of tension, to avoid incurring unacceptable losses or
tarnishing the Group’s reputation.
Management manages liquidity risk on a prudent basis, based on availability of cash and sufficient committed
unused long-term credit facilities, enabling the Group to implement its business plans and carry out operations
using stable and secure sources of financing.
The main contractual obligations existing at the end of the year mainly comprise financial debt obligations with
repayments of principal and interests, in the long term mostly (see Note 22).
The Group's treasury budget anticipates meeting all its commitments in the next 12 months. Additionally, the cash
generated from the divestment in Shanghai RAAS (see Note 17) and the improvement in operational cash flow
will be directed towards continuing the reduction of the debt level initiated in previous years. Furthermore, the
Group has various additional financing alternatives, such as negotiations with debt holders, accessing the debt
market, or potential divestments in non-strategic assets, to optimize the debt structure and its financial cost.
Additionally, as of December 31, 2023, the Grifols Group has a total of cash and other cash equivalents amounting
to Euros 525,567 thousand (Euros 547,979 thousand as of December 31, 2022). Furthermore, the Group has
approximately Euros 615,328 thousand in unused credit lines (Euros 987,340 thousand as of December 31, 2022),
including Euros 544,729 thousand from the revolving credit line (Euros 937,559 thousand as of December 31,
2022).
Details of financial liabilities by contractual maturity date are provided in Notes 15 and 22 (e).
(v) Cash flow and fair value interest rate risks
Interest rate risk arises on loans extended to Group companies and current and non-current borrowings.
Borrowings and loans extended at variable interest rates expose the Company to cash flow interest rate risks.
Fixed-rate borrowings expose the Company to fair value interest rate risk.
The objective of interest rate risk management is to achieve a balance in the structure of the debt, keeping part of
the external resources issued at a fixed rate and covering part of the variable rate debt extending loans to Group
companies.
At 31 December 2023, had interest rates been 100 basis points higher/lower, with the other variables remaining
constant, post-tax profit would have been Euros 24,782 thousand lower/higher, mainly because of higher
borrowing costs on variable interest debt (Euros 20,491 thousand at 31 December 2022). |
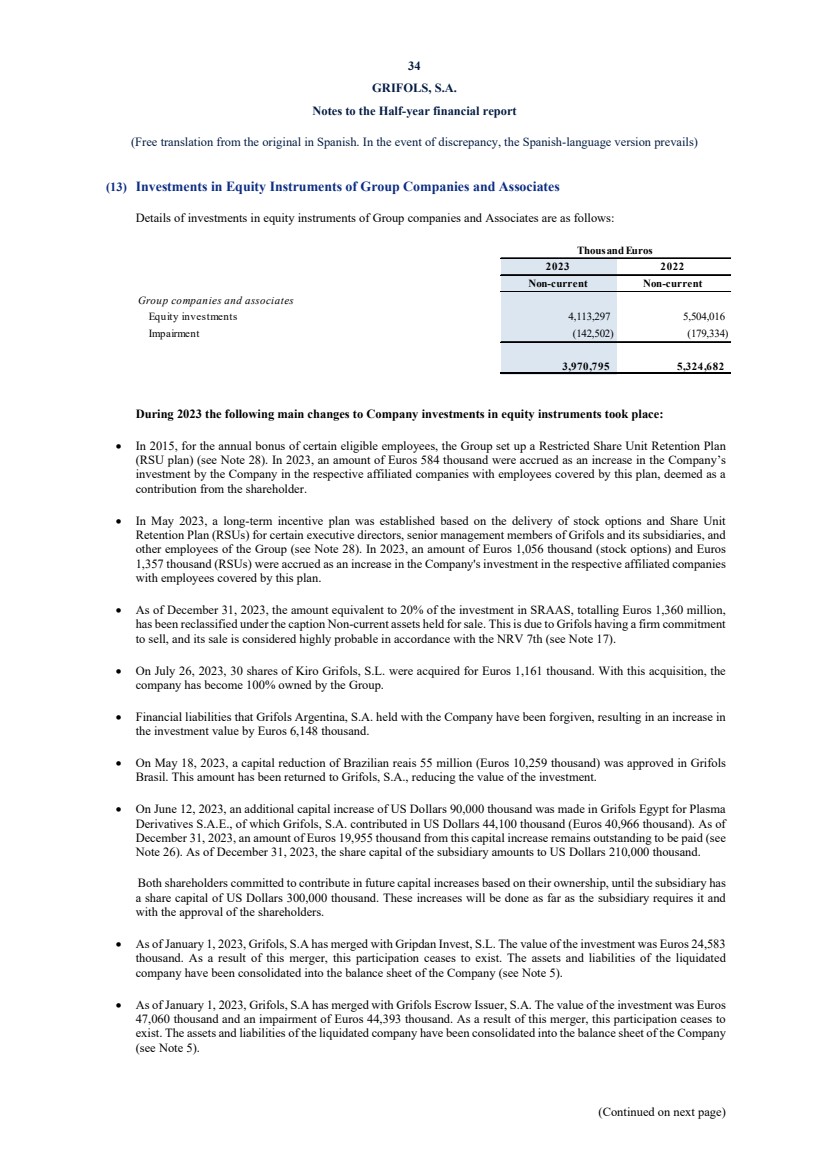
| 34
GRIFOLS, S.A.
Notes to the Half-year financial report
(Free translation from the original in Spanish. In the event of discrepancy, the Spanish-language version prevails)
(Continued on next page)
(13) Investments in Equity Instruments of Group Companies and Associates
Details of investments in equity instruments of Group companies and Associates are as follows:
2023 2022
Non-current Non-current
Group companies and associates
Equity investments 4,113,297 5,504,016
Impairment (142,502) (179,334)
3,970,795 5,324,682
Thousand Euros
During 2023 the following main changes to Company investments in equity instruments took place:
In 2015, for the annual bonus of certain eligible employees, the Group set up a Restricted Share Unit Retention Plan
(RSU plan) (see Note 28). In 2023, an amount of Euros 584 thousand were accrued as an increase in the Company’s
investment by the Company in the respective affiliated companies with employees covered by this plan, deemed as a
contribution from the shareholder.
In May 2023, a long-term incentive plan was established based on the delivery of stock options and Share Unit
Retention Plan (RSUs) for certain executive directors, senior management members of Grifols and its subsidiaries, and
other employees of the Group (see Note 28). In 2023, an amount of Euros 1,056 thousand (stock options) and Euros
1,357 thousand (RSUs) were accrued as an increase in the Company's investment in the respective affiliated companies
with employees covered by this plan.
As of December 31, 2023, the amount equivalent to 20% of the investment in SRAAS, totalling Euros 1,360 million,
has been reclassified under the caption Non-current assets held for sale. This is due to Grifols having a firm commitment
to sell, and its sale is considered highly probable in accordance with the NRV 7th (see Note 17).
On July 26, 2023, 30 shares of Kiro Grifols, S.L. were acquired for Euros 1,161 thousand. With this acquisition, the
company has become 100% owned by the Group.
Financial liabilities that Grifols Argentina, S.A. held with the Company have been forgiven, resulting in an increase in
the investment value by Euros 6,148 thousand.
On May 18, 2023, a capital reduction of Brazilian reais 55 million (Euros 10,259 thousand) was approved in Grifols
Brasil. This amount has been returned to Grifols, S.A., reducing the value of the investment.
On June 12, 2023, an additional capital increase of US Dollars 90,000 thousand was made in Grifols Egypt for Plasma
Derivatives S.A.E., of which Grifols, S.A. contributed in US Dollars 44,100 thousand (Euros 40,966 thousand). As of
December 31, 2023, an amount of Euros 19,955 thousand from this capital increase remains outstanding to be paid (see
Note 26). As of December 31, 2023, the share capital of the subsidiary amounts to US Dollars 210,000 thousand.
Both shareholders committed to contribute in future capital increases based on their ownership, until the subsidiary has
a share capital of US Dollars 300,000 thousand. These increases will be done as far as the subsidiary requires it and
with the approval of the shareholders.
As of January 1, 2023, Grifols, S.A has merged with Gripdan Invest, S.L. The value of the investment was Euros 24,583
thousand. As a result of this merger, this participation ceases to exist. The assets and liabilities of the liquidated
company have been consolidated into the balance sheet of the Company (see Note 5).
As of January 1, 2023, Grifols, S.A has merged with Grifols Escrow Issuer, S.A. The value of the investment was Euros
47,060 thousand and an impairment of Euros 44,393 thousand. As a result of this merger, this participation ceases to
exist. The assets and liabilities of the liquidated company have been consolidated into the balance sheet of the Company
(see Note 5). |
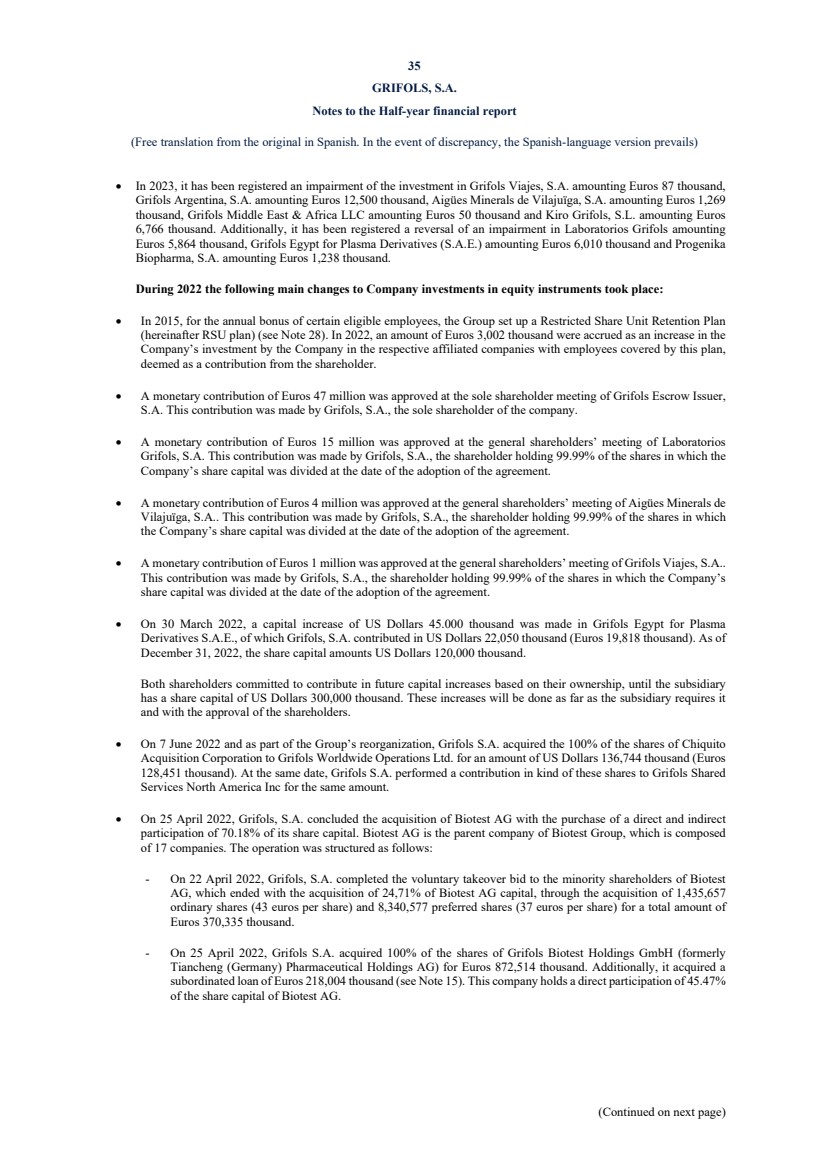
| 35
GRIFOLS, S.A.
Notes to the Half-year financial report
(Free translation from the original in Spanish. In the event of discrepancy, the Spanish-language version prevails)
(Continued on next page)
In 2023, it has been registered an impairment of the investment in Grifols Viajes, S.A. amounting Euros 87 thousand,
Grifols Argentina, S.A. amounting Euros 12,500 thousand, Aigües Minerals de Vilajuïga, S.A. amounting Euros 1,269
thousand, Grifols Middle East & Africa LLC amounting Euros 50 thousand and Kiro Grifols, S.L. amounting Euros
6,766 thousand. Additionally, it has been registered a reversal of an impairment in Laboratorios Grifols amounting
Euros 5,864 thousand, Grifols Egypt for Plasma Derivatives (S.A.E.) amounting Euros 6,010 thousand and Progenika
Biopharma, S.A. amounting Euros 1,238 thousand.
During 2022 the following main changes to Company investments in equity instruments took place:
In 2015, for the annual bonus of certain eligible employees, the Group set up a Restricted Share Unit Retention Plan
(hereinafter RSU plan) (see Note 28). In 2022, an amount of Euros 3,002 thousand were accrued as an increase in the
Company’s investment by the Company in the respective affiliated companies with employees covered by this plan,
deemed as a contribution from the shareholder.
A monetary contribution of Euros 47 million was approved at the sole shareholder meeting of Grifols Escrow Issuer,
S.A. This contribution was made by Grifols, S.A., the sole shareholder of the company.
A monetary contribution of Euros 15 million was approved at the general shareholders’ meeting of Laboratorios
Grifols, S.A. This contribution was made by Grifols, S.A., the shareholder holding 99.99% of the shares in which the
Company’s share capital was divided at the date of the adoption of the agreement.
A monetary contribution of Euros 4 million was approved at the general shareholders’ meeting of Aigües Minerals de
Vilajuïga, S.A.. This contribution was made by Grifols, S.A., the shareholder holding 99.99% of the shares in which
the Company’s share capital was divided at the date of the adoption of the agreement.
A monetary contribution of Euros 1 million was approved at the general shareholders’ meeting of Grifols Viajes, S.A..
This contribution was made by Grifols, S.A., the shareholder holding 99.99% of the shares in which the Company’s
share capital was divided at the date of the adoption of the agreement.
On 30 March 2022, a capital increase of US Dollars 45.000 thousand was made in Grifols Egypt for Plasma
Derivatives S.A.E., of which Grifols, S.A. contributed in US Dollars 22,050 thousand (Euros 19,818 thousand). As of
December 31, 2022, the share capital amounts US Dollars 120,000 thousand.
Both shareholders committed to contribute in future capital increases based on their ownership, until the subsidiary
has a share capital of US Dollars 300,000 thousand. These increases will be done as far as the subsidiary requires it
and with the approval of the shareholders.
On 7 June 2022 and as part of the Group’s reorganization, Grifols S.A. acquired the 100% of the shares of Chiquito
Acquisition Corporation to Grifols Worldwide Operations Ltd. for an amount of US Dollars 136,744 thousand (Euros
128,451 thousand). At the same date, Grifols S.A. performed a contribution in kind of these shares to Grifols Shared
Services North America Inc for the same amount.
On 25 April 2022, Grifols, S.A. concluded the acquisition of Biotest AG with the purchase of a direct and indirect
participation of 70.18% of its share capital. Biotest AG is the parent company of Biotest Group, which is composed
of 17 companies. The operation was structured as follows:
- On 22 April 2022, Grifols, S.A. completed the voluntary takeover bid to the minority shareholders of Biotest
AG, which ended with the acquisition of 24,71% of Biotest AG capital, through the acquisition of 1,435,657
ordinary shares (43 euros per share) and 8,340,577 preferred shares (37 euros per share) for a total amount of
Euros 370,335 thousand.
- On 25 April 2022, Grifols S.A. acquired 100% of the shares of Grifols Biotest Holdings GmbH (formerly
Tiancheng (Germany) Pharmaceutical Holdings AG) for Euros 872,514 thousand. Additionally, it acquired a
subordinated loan of Euros 218,004 thousand (see Note 15). This company holds a direct participation of 45.47%
of the share capital of Biotest AG. |
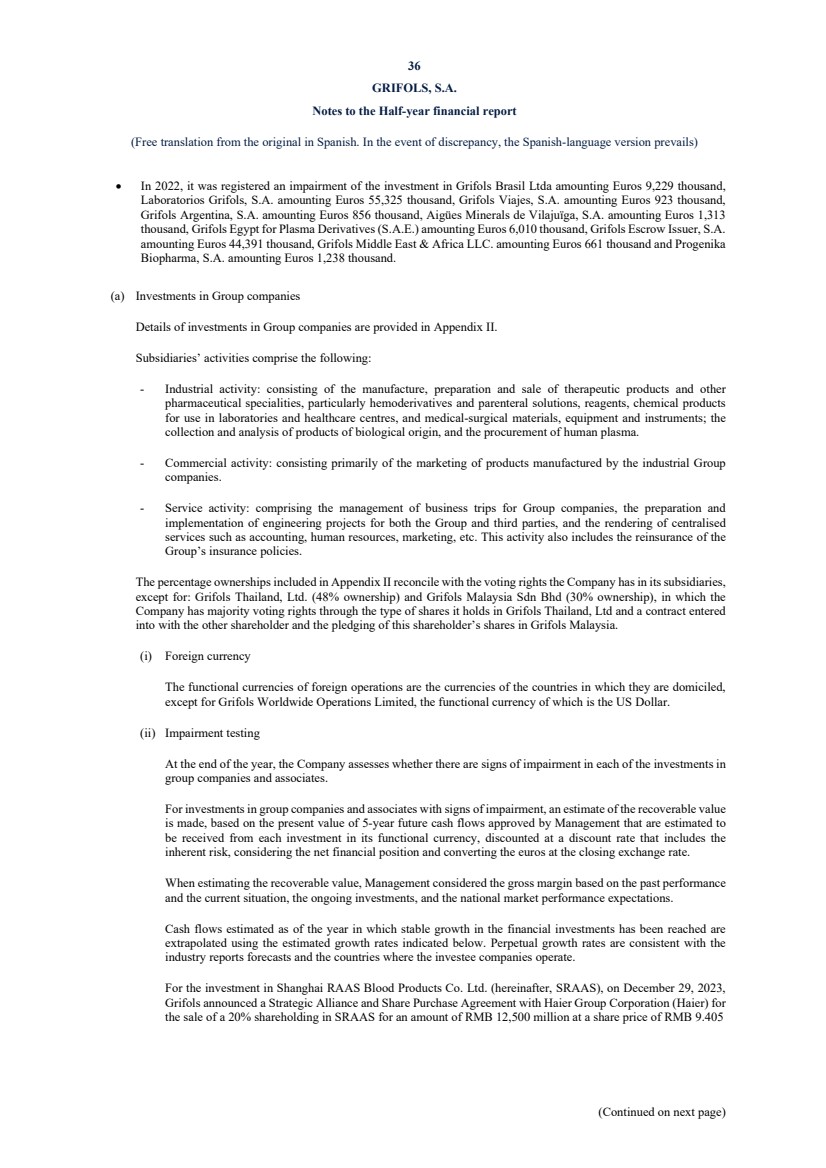
| 36
GRIFOLS, S.A.
Notes to the Half-year financial report
(Free translation from the original in Spanish. In the event of discrepancy, the Spanish-language version prevails)
(Continued on next page)
In 2022, it was registered an impairment of the investment in Grifols Brasil Ltda amounting Euros 9,229 thousand,
Laboratorios Grifols, S.A. amounting Euros 55,325 thousand, Grifols Viajes, S.A. amounting Euros 923 thousand,
Grifols Argentina, S.A. amounting Euros 856 thousand, Aigües Minerals de Vilajuïga, S.A. amounting Euros 1,313
thousand, Grifols Egypt for Plasma Derivatives (S.A.E.) amounting Euros 6,010 thousand, Grifols Escrow Issuer, S.A.
amounting Euros 44,391 thousand, Grifols Middle East & Africa LLC. amounting Euros 661 thousand and Progenika
Biopharma, S.A. amounting Euros 1,238 thousand.
(a) Investments in Group companies
Details of investments in Group companies are provided in Appendix II.
Subsidiaries’ activities comprise the following:
- Industrial activity: consisting of the manufacture, preparation and sale of therapeutic products and other
pharmaceutical specialities, particularly hemoderivatives and parenteral solutions, reagents, chemical products
for use in laboratories and healthcare centres, and medical-surgical materials, equipment and instruments; the
collection and analysis of products of biological origin, and the procurement of human plasma.
- Commercial activity: consisting primarily of the marketing of products manufactured by the industrial Group
companies.
- Service activity: comprising the management of business trips for Group companies, the preparation and
implementation of engineering projects for both the Group and third parties, and the rendering of centralised
services such as accounting, human resources, marketing, etc. This activity also includes the reinsurance of the
Group’s insurance policies.
The percentage ownerships included in Appendix II reconcile with the voting rights the Company has in its subsidiaries,
except for: Grifols Thailand, Ltd. (48% ownership) and Grifols Malaysia Sdn Bhd (30% ownership), in which the
Company has majority voting rights through the type of shares it holds in Grifols Thailand, Ltd and a contract entered
into with the other shareholder and the pledging of this shareholder’s shares in Grifols Malaysia.
(i) Foreign currency
The functional currencies of foreign operations are the currencies of the countries in which they are domiciled,
except for Grifols Worldwide Operations Limited, the functional currency of which is the US Dollar.
(ii) Impairment testing
At the end of the year, the Company assesses whether there are signs of impairment in each of the investments in
group companies and associates.
For investments in group companies and associates with signs of impairment, an estimate of the recoverable value
is made, based on the present value of 5-year future cash flows approved by Management that are estimated to
be received from each investment in its functional currency, discounted at a discount rate that includes the
inherent risk, considering the net financial position and converting the euros at the closing exchange rate.
When estimating the recoverable value, Management considered the gross margin based on the past performance
and the current situation, the ongoing investments, and the national market performance expectations.
Cash flows estimated as of the year in which stable growth in the financial investments has been reached are
extrapolated using the estimated growth rates indicated below. Perpetual growth rates are consistent with the
industry reports forecasts and the countries where the investee companies operate.
For the investment in Shanghai RAAS Blood Products Co. Ltd. (hereinafter, SRAAS), on December 29, 2023,
Grifols announced a Strategic Alliance and Share Purchase Agreement with Haier Group Corporation (Haier) for
the sale of a 20% shareholding in SRAAS for an amount of RMB 12,500 million at a share price of RMB 9.405 |
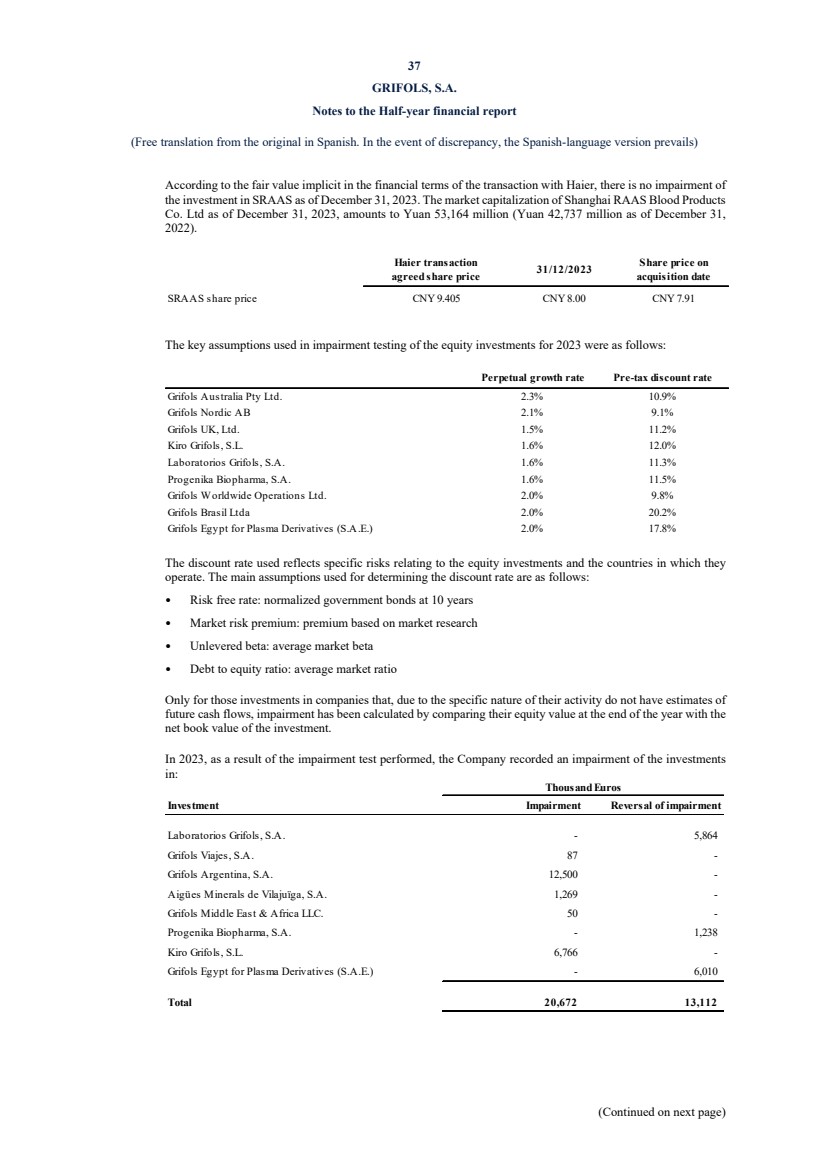
| 37
GRIFOLS, S.A.
Notes to the Half-year financial report
(Free translation from the original in Spanish. In the event of discrepancy, the Spanish-language version prevails)
(Continued on next page)
According to the fair value implicit in the financial terms of the transaction with Haier, there is no impairment of
the investment in SRAAS as of December 31, 2023. The market capitalization of Shanghai RAAS Blood Products
Co. Ltd as of December 31, 2023, amounts to Yuan 53,164 million (Yuan 42,737 million as of December 31,
2022).
Haier transaction
agreed share price 31/12/2023 Share price on
acquisition date
SRAAS share price CNY 9.405 CNY 8.00 CNY 7.91
The key assumptions used in impairment testing of the equity investments for 2023 were as follows:
Perpetual growth rate Pre-tax discount rate
Grifols Australia Pty Ltd. 2.3% 10.9%
Grifols Nordic AB 2.1% 9.1%
Grifols UK, Ltd. 1.5% 11.2%
Kiro Grifols, S.L. 1.6% 12.0%
Laboratorios Grifols, S.A. 1.6% 11.3%
Progenika Biopharma, S.A. 1.6% 11.5%
Grifols Worldwide Operations Ltd. 2.0% 9.8%
Grifols Brasil Ltda 2.0% 20.2%
Grifols Egypt for Plasma Derivatives (S.A.E.) 2.0% 17.8%
The discount rate used reflects specific risks relating to the equity investments and the countries in which they
operate. The main assumptions used for determining the discount rate are as follows:
• Risk free rate: normalized government bonds at 10 years
• Market risk premium: premium based on market research
• Unlevered beta: average market beta
• Debt to equity ratio: average market ratio
Only for those investments in companies that, due to the specific nature of their activity do not have estimates of
future cash flows, impairment has been calculated by comparing their equity value at the end of the year with the
net book value of the investment.
In 2023, as a result of the impairment test performed, the Company recorded an impairment of the investments
in:
Investment Impairment Reversal of impairment
Laboratorios Grifols, S.A. - 5,864
Grifols Viajes, S.A. 87 -
Grifols Argentina, S.A. 12,500 -
Aigües Minerals de Vilajuïga, S.A. 1,269 -
Grifols Middle East & Africa LLC. 50 -
Progenika Biopharma, S.A. - 1,238
Kiro Grifols, S.L. 6,766 -
Grifols Egypt for Plasma Derivatives (S.A.E.) - 6,010
Total 20,672 13,112
Thousand Euros
|
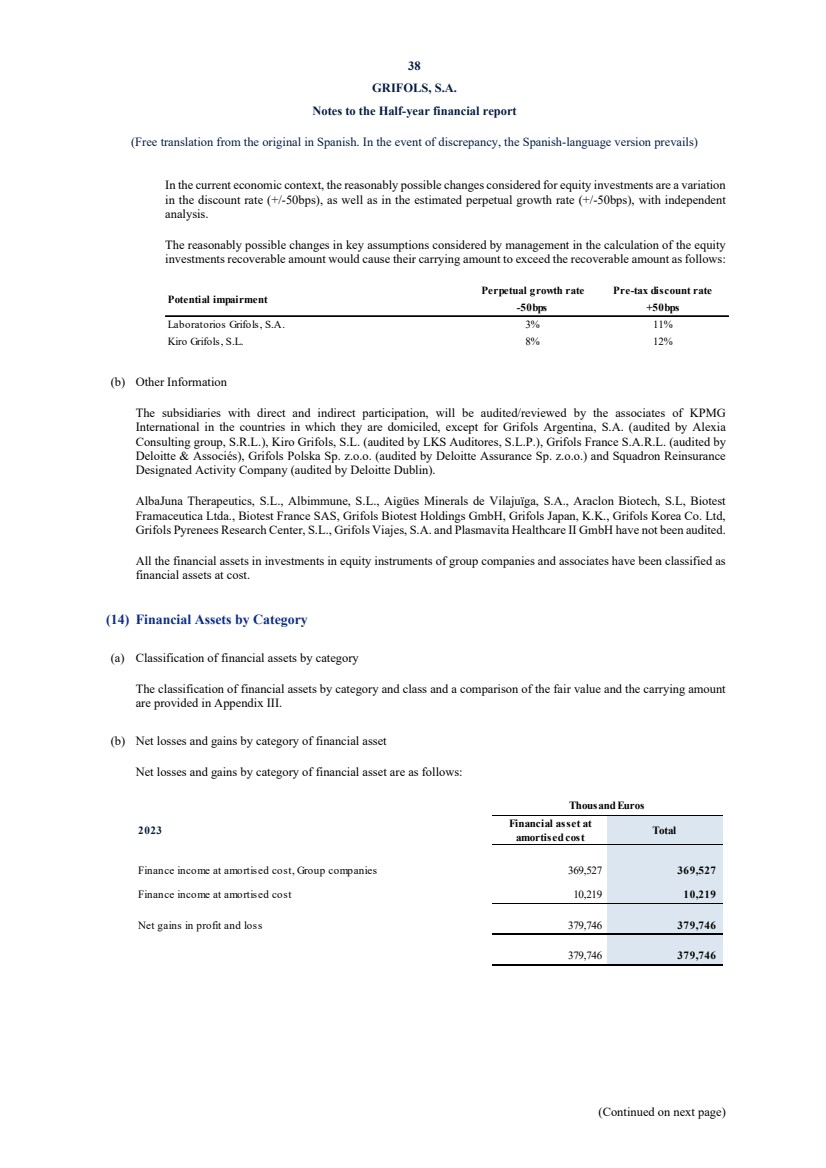
| 38
GRIFOLS, S.A.
Notes to the Half-year financial report
(Free translation from the original in Spanish. In the event of discrepancy, the Spanish-language version prevails)
(Continued on next page)
In the current economic context, the reasonably possible changes considered for equity investments are a variation
in the discount rate (+/-50bps), as well as in the estimated perpetual growth rate (+/-50bps), with independent
analysis.
The reasonably possible changes in key assumptions considered by management in the calculation of the equity
investments recoverable amount would cause their carrying amount to exceed the recoverable amount as follows:
Perpetual growth rate Pre-tax discount rate
-50bps +50bps
Laboratorios Grifols, S.A. 3% 11%
Kiro Grifols, S.L. 8% 12%
Potential impairment
(b) Other Information
The subsidiaries with direct and indirect participation, will be audited/reviewed by the associates of KPMG
International in the countries in which they are domiciled, except for Grifols Argentina, S.A. (audited by Alexia
Consulting group, S.R.L.), Kiro Grifols, S.L. (audited by LKS Auditores, S.L.P.), Grifols France S.A.R.L. (audited by
Deloitte & Associés), Grifols Polska Sp. z.o.o. (audited by Deloitte Assurance Sp. z.o.o.) and Squadron Reinsurance
Designated Activity Company (audited by Deloitte Dublin).
AlbaJuna Therapeutics, S.L., Albimmune, S.L., Aigües Minerals de Vilajuïga, S.A., Araclon Biotech, S.L, Biotest
Framaceutica Ltda., Biotest France SAS, Grifols Biotest Holdings GmbH, Grifols Japan, K.K., Grifols Korea Co. Ltd,
Grifols Pyrenees Research Center, S.L., Grifols Viajes, S.A. and Plasmavita Healthcare II GmbH have not been audited.
All the financial assets in investments in equity instruments of group companies and associates have been classified as
financial assets at cost.
(14) Financial Assets by Category
(a) Classification of financial assets by category
The classification of financial assets by category and class and a comparison of the fair value and the carrying amount
are provided in Appendix III.
(b) Net losses and gains by category of financial asset
Net losses and gains by category of financial asset are as follows:
2023 Financial asset at
amortised cost Total
Finance income at amortised cost, Group companies 369,527 369,527
Finance income at amortised cost 10,219 10,219
Net gains in profit and loss 379,746 379,746
379,746 379,746
Thousand Euros |

| 39
GRIFOLS, S.A.
Notes to the Half-year financial report
(Free translation from the original in Spanish. In the event of discrepancy, the Spanish-language version prevails)
(Continued on next page)
2022 Financial asset at
amortised cost Total
Finance income at amortised cost, Group companies 282,305 282,305
Finance income at amortised cost 8,905 8,905
Net gains in profit and loss 291,210 291,210
291,210 291,210
Thousand Euros
(15) Investments and Trade Receivables
(a) Investments in Group companies
Details of investments in Group companies and related parties are as follows:
Non-current Current Non-current Current
Group
Loans 7,231,679 13,076 7,144,755 103,269
Receivables, tax effect (Note 24) - 29,179 - 14,771
Interest - 5,629 - 4,993
7,231,679 47,884 7,144,755 123,033
Thousand Euros
2023 2022
As of December 31, 2023, the Company has several loans with Group companies. The most significant loans are:
- Three subordinated loans with subsidiary entities that accrue interest at a market rate, with no due date
established and an amount of Euros 3,412 million. The Company will not request the payment of these loans
in the short term. One of them was signed during 2022 with Grifols Biotest Holdings GmbH and amounts
Euros 218 million.
- Loans totaling Euros 3,833 million that accrue interest at a market rate (see Appendix III). The detail by
maturity of these loans as of December 31, 2023 and 2022, is the following:
2023 2022
Maturity Currency Principal Principal
2023 Euros - 103,269
2024 Euros 13,076 13,076
2025 Euros 1,850,932 1,850,932
2026 Euros 13,076 13,076
2027 Euros 1,955,667 1,855,667
3,832,751 3,836,020
Thousand Euros
Interest correspond to the interests on the subordinated loans. |
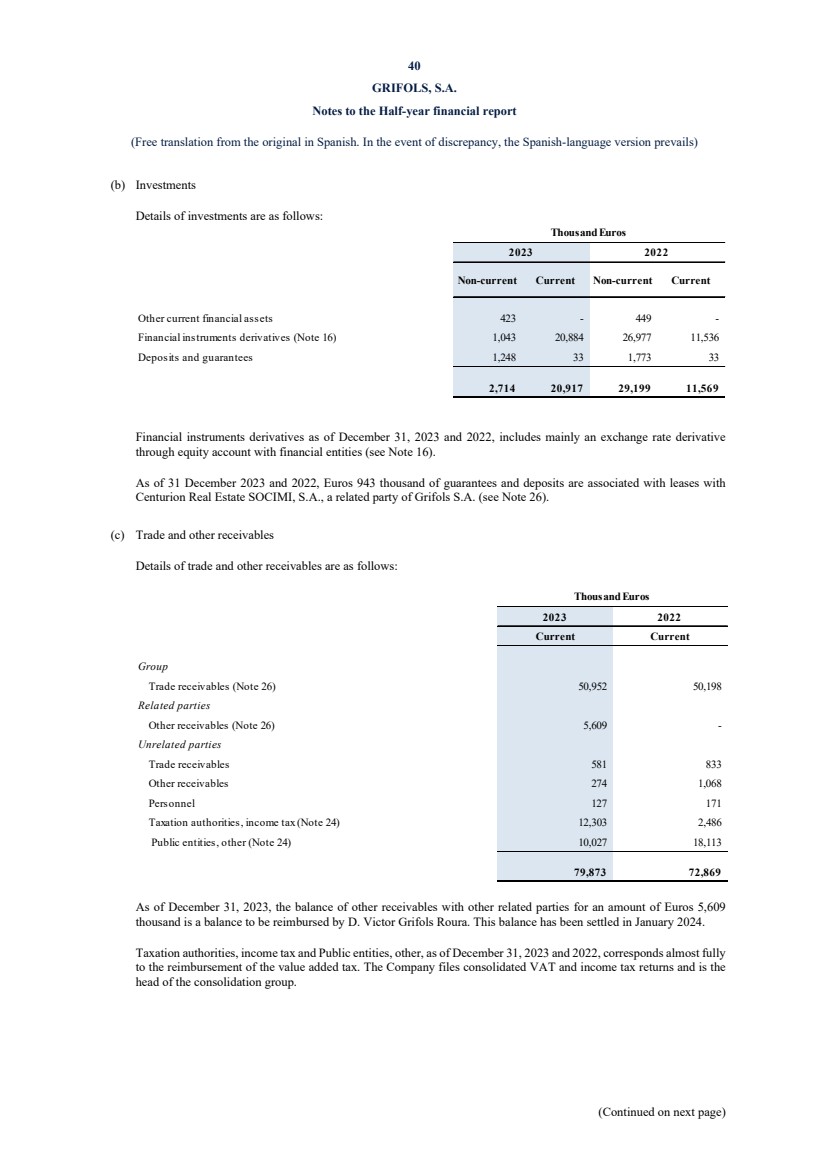
| 40
GRIFOLS, S.A.
Notes to the Half-year financial report
(Free translation from the original in Spanish. In the event of discrepancy, the Spanish-language version prevails)
(Continued on next page)
(b) Investments
Details of investments are as follows:
Non-current Current Non-current Current
Other current financial assets 423 - 449 -
Financial instruments derivatives (Note 16) 1,043 20,884 26,977 11,536
Deposits and guarantees 1,248 33 1,773 33
2,714 20,917 29,199 11,569
Thousand Euros
2023 2022
Financial instruments derivatives as of December 31, 2023 and 2022, includes mainly an exchange rate derivative
through equity account with financial entities (see Note 16).
As of 31 December 2023 and 2022, Euros 943 thousand of guarantees and deposits are associated with leases with
Centurion Real Estate SOCIMI, S.A., a related party of Grifols S.A. (see Note 26).
(c) Trade and other receivables
Details of trade and other receivables are as follows:
2023 2022
Current Current
Group
Trade receivables (Note 26) 50,952 50,198
Related parties
Other receivables (Note 26) 5,609 -
Unrelated parties
Trade receivables 581 833
Other receivables 274 1,068
Personnel 127 171
Taxation authorities, income tax (Note 24) 12,303 2,486
Public entities, other (Note 24) 10,027 18,113
79,873 72,869
Thousand Euros
As of December 31, 2023, the balance of other receivables with other related parties for an amount of Euros 5,609
thousand is a balance to be reimbursed by D. Victor Grifols Roura. This balance has been settled in January 2024.
Taxation authorities, income tax and Public entities, other, as of December 31, 2023 and 2022, corresponds almost fully
to the reimbursement of the value added tax. The Company files consolidated VAT and income tax returns and is the
head of the consolidation group.
|

| 41
GRIFOLS, S.A.
Notes to the Half-year financial report
(Free translation from the original in Spanish. In the event of discrepancy, the Spanish-language version prevails)
(Continued on next page)
(d) Amounts denominated in foreign currencies
Details of monetary financial assets denominated in foreign currencies are as follows:
2023 US Dollar Other Total
Trade and other receivables
Trade receivables – current 153 - 153
Trade receivables from Group companies and associates – current 3,328 100 3,428
Other receivables - - -
Total current financial assets 3,481 100 3,581
Total financial assets 3,481 100 3,581
Thousand Euros
2022 US Dollar Other Total
Trade and other receivables
Trade receivables – current 159 - 159
Trade receivables from Group companies and associates – current 2,820 130 2,950
Other receivables 2 - 2
Total current financial assets 2,981 130 3,111
Total financial assets 2,981 130 3,111
Thousand Euros
Details of exchange differences recognised in profit or loss on financial instruments, distinguishing between settled and
outstanding transactions, are as follows:
Settled Outstanding Settled Outstanding
Trade and other receivables
Trade receivables – current 18 (6) (14) 9
Trade receivables from Group companies – current (1,094) 1 546 (124)
Cash and cash equivalents
Cash (856) - (409) -
Total current financial assets (1,932) (5) 123 (115)
Total financial assets (1,932) (5) 123 (115)
2023 2022
Thousand Euros |

| 42
GRIFOLS, S.A.
Notes to the Half-year financial report
(Free translation from the original in Spanish. In the event of discrepancy, the Spanish-language version prevails)
(Continued on next page)
(16) Financial derivatives
The Company uses financial derivatives to hedge against the risk that the future cash flows are exposed. In 2022, the
Company considered that the requirements detailed in Note 4, regarding the registration and valuation rules, have been
fulfilled in order to classify the financial instruments detailed below as hedging instruments.
The Company performs an analysis to assess to what extent the changes in the cash flows of the hedging instrument
would offset the changes in the cash flows of the hedged item attributable to the risk that is intended to be hedged.
Taking this analysis into account, the Company determines the existence of the economic relationship and the coverage
ratio.
At the year-end, the Company analyses the ineffectiveness and assesses whether an economic relationship continues to
exist or whether the set hedge ratio is appropriate. The possible sources of ineffectiveness considered by the Company
to determine the hedging relationship and the hedge ratio are:
- The hedging instrument and the hedged item have different start dates and trade dates.
- The underlying of the hedged item and the hedging instrument are not homogeneous.
a) Cash flow hedge
As of 31 December 2023, the Company held the following hedging instruments:
Thousand
Dollars
Asset2 Liability
Liabilities
issued in USD
Currency
swap
USD/EUR
exchange rate
USD
purchase 150,000 2024 - 5,945 -
Liabilities
issued in USD
Currency
swap
USD/EUR
exchange rate
USD
purchase 150,000 2024 - 5,940 -
Liabilities
issued in USD
Currency
swap
USD/EUR
exchange rate
USD
purchase 200,000 2024 - 7,919 -
Liabilities
issued in USD
Currency
swap
USD/EUR
exchange rate
USD
purchase 205,000 2024 (620) - 7,712
Energy price Energy swap Energy price Energy
swap 2032 (21) 1,529 -
21,333 7,712
Hedging
instrument Hedged risk Type
Thousand Euros
Notional
value Due date1
Ineffectiveness
recognised in
profit or loss
Hedging instrument
fair value
Hedged item
(1) The maturity of the hedging instrument matches with the year when the cash flows are expected to occur and affect the profit
and loss account.
(2) The balance sheet caption "Short-term derivatives" includes Euros 594 thousand corresponding to the initial cost that is accrued
over the life of the instrument.
|
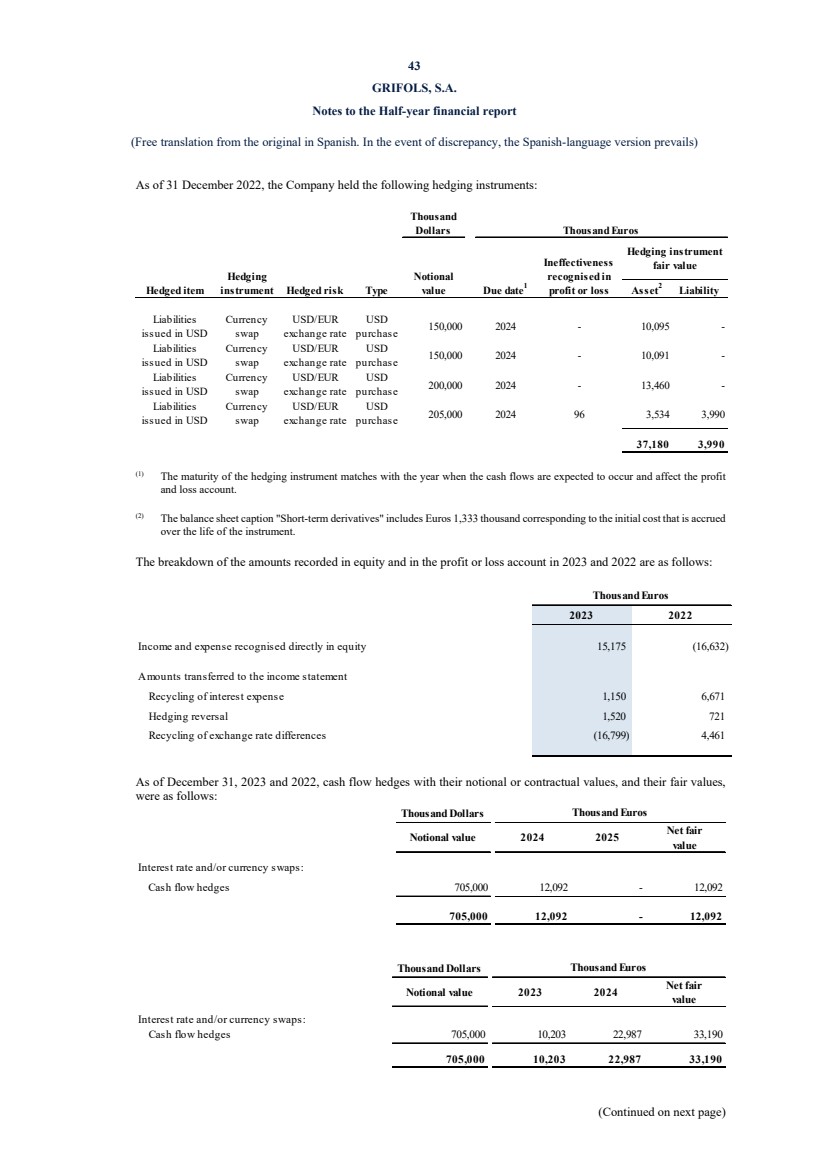
| 43
GRIFOLS, S.A.
Notes to the Half-year financial report
(Free translation from the original in Spanish. In the event of discrepancy, the Spanish-language version prevails)
(Continued on next page)
As of 31 December 2022, the Company held the following hedging instruments:
Thousand
Dollars
Asset2 Liability
Liabilities
issued in USD
Currency
swap
USD/EUR
exchange rate
USD
purchase 150,000 2024 - 10,095 -
Liabilities
issued in USD
Currency
swap
USD/EUR
exchange rate
USD
purchase 150,000 2024 - 10,091 -
Liabilities
issued in USD
Currency
swap
USD/EUR
exchange rate
USD
purchase 200,000 2024 - 13,460 -
Liabilities
issued in USD
Currency
swap
USD/EUR
exchange rate
USD
purchase 205,000 2024 96 3,534 3,990
37,180 3,990
Hedged item
Hedging
instrument Hedged risk Type
Thousand Euros
Notional
value Due date1
Ineffectiveness
recognised in
profit or loss
Hedging instrument
fair value
(1) The maturity of the hedging instrument matches with the year when the cash flows are expected to occur and affect the profit
and loss account.
(2) The balance sheet caption "Short-term derivatives" includes Euros 1,333 thousand corresponding to the initial cost that is accrued
over the life of the instrument.
The breakdown of the amounts recorded in equity and in the profit or loss account in 2023 and 2022 are as follows:
2023 2022
Income and expense recognised directly in equity 15,175 (16,632)
Amounts transferred to the income statement
Recycling of interest expense 1,150 6,671
Hedging reversal 1,520 721
Recycling of exchange rate differences (16,799) 4,461
Thousand Euros
As of December 31, 2023 and 2022, cash flow hedges with their notional or contractual values, and their fair values,
were as follows:
Thousand Dollars
Notional value 2024 2025 Net fair
value
Interest rate and/or currency swaps:
Cash flow hedges 705,000 12,092 - 12,092
705,000 12,092 - 12,092
Thousand Euros
Thousand Dollars
Notional value 2023 2024 Net fair
value
Interest rate and/or currency swaps:
Cash flow hedges 705,000 10,203 22,987 33,190
705,000 10,203 22,987 33,190
Thousand Euros |
| 44
GRIFOLS, S.A.
Notes to the Half-year financial report
(Free translation from the original in Spanish. In the event of discrepancy, the Spanish-language version prevails)
(Continued on next page)
Cross-currency swaps
The loan signed with the Group company, Grifols Escrow Issuer, S.A. amounting to US Dollars 687.4 million and
maturing in October 2028, was hedged through currency swaps that convert the face value of the loan and the interest
to be settled from US Dollars to Euros. During 2023, the hedge item has changed to the senior unsecured notes in US
Dollars absorbed in the merger with Grifols Escrow Issuer, S.A. (see Note 5).
The characteristics of the financial derivatives are as follows:
On 28 June 2022 the Company entered into a fixed-for-fixed currency swap agreement with due date 15 October
2024. The agreement set the exchange of currency flows EUR-USD under the following terms:
- Grifols, S.A. received a loan in euros for an amount of Euros 194 million with an interest rate of 3.10%.
- Grifols S.A. granted a loan in US dollars for an amount of US Dollars 205 million with an interest rate of
4.75%.
On 5 October 2021 the Company entered into a fixed-for-fixed currency swap agreement with some financial
entities with due date 15 October 2024. The agreement set the exchange of currency flows EUR-USD under the
following terms:
- Grifols, S.A. received a loan in euros for an amount of Euros 173 million with an interest rate of 3.78%.
- Grifols S.A. granted a loan in US dollars for an amount of US Dollars 200 million with an interest rate of
4.75%.
On 5 October 2021 the Company entered into two fixed-for-fixed currency swap agreements with due date 15
October 2024. The agreement set the exchange of currency flows EUR-USD under the following terms:
- Grifols, S.A. received a loan in euros for an amount of Euros 259 million with an interest rate of 3.59%.
- Grifols S.A. granted a loan in US dollars for an amount of US Dollars 300 million with an interest rate of
4.75%.
Regarding the financial derivative agreement dated on October 5, 2021, it was considered as a hedge instrument on 21
April 2022, being treated previously as a financial asset at fair value with changes in the profit or loss account. Up to
that date, the impact on the profit or loss account of the fair value variations of such instrument amounted to an income
of 16,646 thousand Euros, recorded under the disclosure "Fair value adjustments recognized in profit and loss" in the
attached profit and loss statement.
Energy swaps
At the beginning of the 2023, the Company has entered into a hedge for the variation in the price of electricity. This
contract has been entirely used to hedge the purchase price of electric energy against potential market price increases.
The derivatives hedging the energy price meet the requirements for hedge accounting, and therefore, variations in the
value of this financial instrument are recorded (net of taxes) in equity.
(17) Non- currents assets held for sale
On December 29, 2023, Grifols reached an agreement with Haier Group Corporation ("Haier") for the sale of a 20%
equity stake in Shanghai RAAS (SRAAS) for an amount of RMB 12,500 million (approximately US Dollars 1,800
million), retaining a 6.58% stake in SRAAS.
The completion of the transaction is subject to relevant regulatory approvals and confirmatory due diligence by the
buyer. Both parties estimate that the closing of the transaction will occur in June 2024, although it could be postponed
in the event that any regulatory approval is outstanding at that date.
As part of the agreement with Haier, the parties agreed that Grifols will maintain a director on the Board of Directors
of SRAAS. Grifols and SRAAS will modify the Exclusive Distribution Agreement with SRAAS to supply larger
quantities of Albumin human serum in the Chinese market, to extend its current duration for an initial period of 10
years (until 2034), with SRAAS having the option to extend said term by an additional period of 10 years. Grifols and
the buyer agree not to transfer any part of their shares in SRAAS for a period of 3 years after the closing of the
transaction. |
| 45
GRIFOLS, S.A.
Notes to the Half-year financial report
(Free translation from the original in Spanish. In the event of discrepancy, the Spanish-language version prevails)
(Continued on next page)
Additionally, Grifols, S.A. commits to:
- The achievement of an aggregate EBITDA in the group company Grifols Diagnostic Solutions (GDS) of US
Dollars 850 million for the period 2024-2028 and if that EBITDA is not met, Grifols will compensate SRAAS
with 45% of the remaining amount until reach that total amount. As of the preparation date of these half-year
financial report, no impact is expected for the Company associated with this commitment.
- The distribution of 50% of the distributable profit in GDS to GDS shareholders in the period 2024-2028.
- Transfer to Haier the exercise of the voting rights relating to the 6.58% of shares in SRAAS that Grifols
retains.
With this operation, Grifols maintains its presence in China, continues with its commercial agreements with SRAAS,
and at the same time, fulfils its deleveraging commitment.
As of December 31, 2023, the amount equivalent to 20% of the stake in SRAAS, which amounts to Euros 1,360 million,
has been reclassified to the caption Non-current assets held for sale, given that Grifols has a firm commitment to sell
said participation and that its sale is considered highly probable in application of NRV 7th . This reclassification has
not had an impact on the income statement as of December 31, 2023, because the sales price less costs is higher than
the book value. Likewise, the sale of said participation has not been considered as discontinued operations because it
does not represent a business division, or a significant separated geographical area of operations.
As of the date of preparation of these financial statements, the closing of the sale of the 20% investment in SRAAS is
pending approval by the competition authorities.
(18) Prepayments
As of December 31, 2023 and 2022, prepayments include mainly insurance premium and maintenance prepayments.
(19) Equity
Details of equity and movement during the year are shown in the statement of changes in equity.
(a) Capital
As of December 31, 2023 and 2022, the share capital of Grifols S.A. amounts to Euros 119,603,705 and is represented
by:
- Class A shares: 426,129,798 ordinary shares of Euros 0.25 par value each, subscribed and fully paid and of the
same class and series, and which are ordinary shares of the Company.
- Class B shares: 261,425,110 non-voting preference shares of Euros 0.05 par value each, of the same class and
series, and with the preferential rights set forth in the Company’s by-laws.
The main characteristics of the Class B shares are as follows:
• Each Class B share entitles its holder to receive a minimum annual preferred dividend out of the distributable
profits at the end of each year equal to Euros 0.01 per Class B share provided that the aggregate preferred dividend
does not exceed the distributable profits of that year and, subject, according to the commercial law, to the approval
of the distribution of dividends by the Company’s shareholders. This preferred dividend is not cumulative if
sufficient distributable profits are not obtained in the period.
• Each Class B share holder is entitled to receive, in addition to the above-mentioned preferred dividend, the same
dividends and other distributions as for one Grifols, S.A. ordinary share.
|

| 46
GRIFOLS, S.A.
Notes to the Half-year financial report
(Free translation from the original in Spanish. In the event of discrepancy, the Spanish-language version prevails)
(Continued on next page)
• Each Class B share entitles the holder to its redemption under certain circumstances, if a takeover bid for all or
part of the shares in the Company has been made, except if holders of Class B shares have been entitled to
participate in the bid on the same terms as holders of Class A shares. The redemption terms and conditions reflected
in the Company’s by-laws limit the amount that may be redeemed, requiring that sufficient distributable reserves
be available, and limit the percentage of shares to be redeemed in line with the ordinary shares to which the bid is
addressed.
• In the event the Company were to be wound up and liquidated, each Class B share entitles the holder to receive,
before any amounts are paid to holders of ordinary shares, an amount equal to the sum of (i) the par value of the
Class B share, and (ii) the share premium paid for the Class B share when it was subscribed. In addition to the
Class B liquidation preference amount, each holder is entitled to receive the same liquidation amount that is paid
for each ordinary share.
These shares are freely transferable.
The Company’s knowledge of its shareholders is based on information provided voluntarily or in compliance with
applicable legislation. According to the information available to the Company, there are no interests higher than 10%
with voting rights as of December 31, 2023 and 2022.
(b) Share premium
This reserve is freely distributable.
(c) Reserves
Details of reserves and movement during the year are shown in Appendix IV.
During 2022 the Company settled the 2020 RSU plan causing an increase of Euros 2,187 thousand in reserves. In 2023
the Company has settled the 2021 RSU plan leading to a rise of Euros 2,506 thousand in reserves.
(i) Legal reserve
The legal reserve has been appropriated in compliance with article 274 of the Spanish Companies Act, which
requires that companies transfer 10% of profits for the year to a legal reserve until this reserve reaches an amount
equal to 20% of share capital. As of December 31, 2023 and 2022, the legal reserve represents 20% of share
capital.
The legal reserve is not distributable to shareholders and if it is used to offset losses, in the event that no other
reserves are available, the reserve must be replenished with future profits.
(ii) Treasury stock and reserve for Company shares
As of December 31, 2023, the Company held Class B treasury stock equivalent to 1.2% of its capital (1.3% of its
capital as of December 31, 2022.
Movement in Class A treasury stock during 2023 and 2022 has been as follows:
Thousand Euros Euros
Balance at 1 January 2022 3,944,430 89,959 -
Balance at 31 December 2022 3,944,430 89,959 -
Balance at 31 December 2023 3,944,430 89,959 -
Number of Class
A shares Nominal Average
acquisition value |
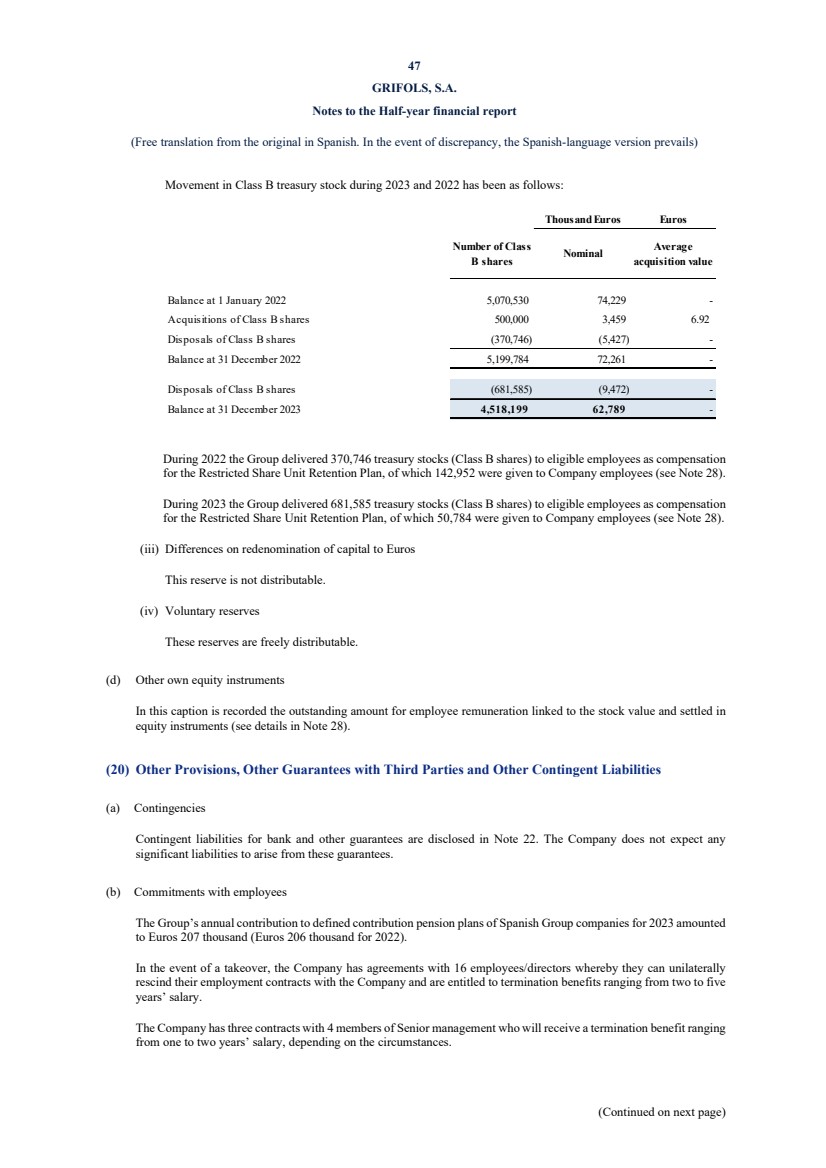
| 47
GRIFOLS, S.A.
Notes to the Half-year financial report
(Free translation from the original in Spanish. In the event of discrepancy, the Spanish-language version prevails)
(Continued on next page)
Movement in Class B treasury stock during 2023 and 2022 has been as follows:
Thousand Euros Euros
Balance at 1 January 2022 5,070,530 74,229 -
Acquisitions of Class B shares 500,000 3,459 6.92
Disposals of Class B shares (370,746) (5,427) -
Balance at 31 December 2022 5,199,784 72,261 -
Disposals of Class B shares (681,585) (9,472) -
Balance at 31 December 2023 4,518,199 62,789 -
Number of Class
B shares
Nominal Average
acquisition value
During 2022 the Group delivered 370,746 treasury stocks (Class B shares) to eligible employees as compensation
for the Restricted Share Unit Retention Plan, of which 142,952 were given to Company employees (see Note 28).
During 2023 the Group delivered 681,585 treasury stocks (Class B shares) to eligible employees as compensation
for the Restricted Share Unit Retention Plan, of which 50,784 were given to Company employees (see Note 28).
(iii) Differences on redenomination of capital to Euros
This reserve is not distributable.
(iv) Voluntary reserves
These reserves are freely distributable.
(d) Other own equity instruments
In this caption is recorded the outstanding amount for employee remuneration linked to the stock value and settled in
equity instruments (see details in Note 28).
(20) Other Provisions, Other Guarantees with Third Parties and Other Contingent Liabilities
(a) Contingencies
Contingent liabilities for bank and other guarantees are disclosed in Note 22. The Company does not expect any
significant liabilities to arise from these guarantees.
(b) Commitments with employees
The Group’s annual contribution to defined contribution pension plans of Spanish Group companies for 2023 amounted
to Euros 207 thousand (Euros 206 thousand for 2022).
In the event of a takeover, the Company has agreements with 16 employees/directors whereby they can unilaterally
rescind their employment contracts with the Company and are entitled to termination benefits ranging from two to five
years’ salary.
The Company has three contracts with 4 members of Senior management who will receive a termination benefit ranging
from one to two years’ salary, depending on the circumstances. |
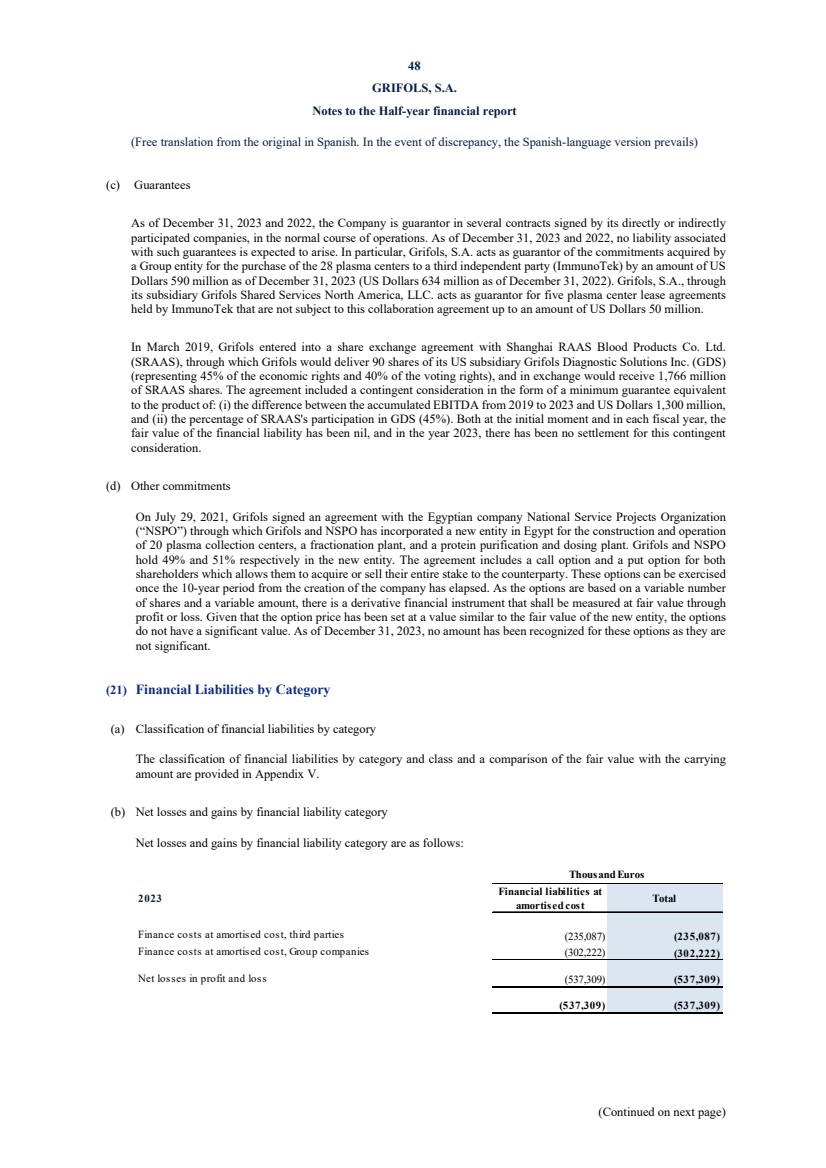
| 48
GRIFOLS, S.A.
Notes to the Half-year financial report
(Free translation from the original in Spanish. In the event of discrepancy, the Spanish-language version prevails)
(Continued on next page)
(c) Guarantees
As of December 31, 2023 and 2022, the Company is guarantor in several contracts signed by its directly or indirectly
participated companies, in the normal course of operations. As of December 31, 2023 and 2022, no liability associated
with such guarantees is expected to arise. In particular, Grifols, S.A. acts as guarantor of the commitments acquired by
a Group entity for the purchase of the 28 plasma centers to a third independent party (ImmunoTek) by an amount of US
Dollars 590 million as of December 31, 2023 (US Dollars 634 million as of December 31, 2022). Grifols, S.A., through
its subsidiary Grifols Shared Services North America, LLC. acts as guarantor for five plasma center lease agreements
held by ImmunoTek that are not subject to this collaboration agreement up to an amount of US Dollars 50 million.
In March 2019, Grifols entered into a share exchange agreement with Shanghai RAAS Blood Products Co. Ltd.
(SRAAS), through which Grifols would deliver 90 shares of its US subsidiary Grifols Diagnostic Solutions Inc. (GDS)
(representing 45% of the economic rights and 40% of the voting rights), and in exchange would receive 1,766 million
of SRAAS shares. The agreement included a contingent consideration in the form of a minimum guarantee equivalent
to the product of: (i) the difference between the accumulated EBITDA from 2019 to 2023 and US Dollars 1,300 million,
and (ii) the percentage of SRAAS's participation in GDS (45%). Both at the initial moment and in each fiscal year, the
fair value of the financial liability has been nil, and in the year 2023, there has been no settlement for this contingent
consideration.
(d) Other commitments
On July 29, 2021, Grifols signed an agreement with the Egyptian company National Service Projects Organization
(“NSPO”) through which Grifols and NSPO has incorporated a new entity in Egypt for the construction and operation
of 20 plasma collection centers, a fractionation plant, and a protein purification and dosing plant. Grifols and NSPO
hold 49% and 51% respectively in the new entity. The agreement includes a call option and a put option for both
shareholders which allows them to acquire or sell their entire stake to the counterparty. These options can be exercised
once the 10-year period from the creation of the company has elapsed. As the options are based on a variable number
of shares and a variable amount, there is a derivative financial instrument that shall be measured at fair value through
profit or loss. Given that the option price has been set at a value similar to the fair value of the new entity, the options
do not have a significant value. As of December 31, 2023, no amount has been recognized for these options as they are
not significant.
(21) Financial Liabilities by Category
(a) Classification of financial liabilities by category
The classification of financial liabilities by category and class and a comparison of the fair value with the carrying
amount are provided in Appendix V.
(b) Net losses and gains by financial liability category
Net losses and gains by financial liability category are as follows:
2023 Financial liabilities at
amortised cost Total
Finance costs at amortised cost, third parties (235,087) (235,087)
Finance costs at amortised cost, Group companies (302,222) (302,222)
Net losses in profit and loss (537,309) (537,309)
(537,309) (537,309)
Thousand Euros |
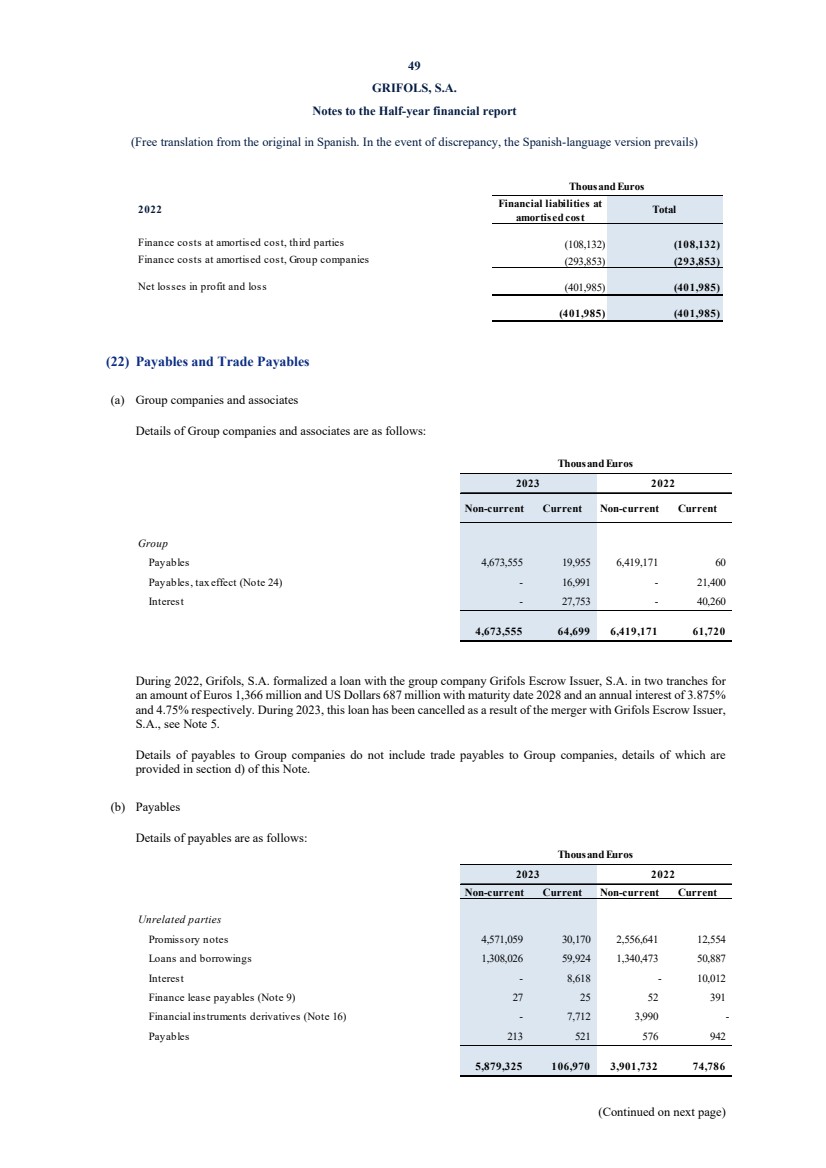
| 49
GRIFOLS, S.A.
Notes to the Half-year financial report
(Free translation from the original in Spanish. In the event of discrepancy, the Spanish-language version prevails)
(Continued on next page)
2022 Financial liabilities at
amortised cost Total
Finance costs at amortised cost, third parties (108,132) (108,132)
Finance costs at amortised cost, Group companies (293,853) (293,853)
Net losses in profit and loss (401,985) (401,985)
(401,985) (401,985)
Thousand Euros
(22) Payables and Trade Payables
(a) Group companies and associates
Details of Group companies and associates are as follows:
Non-current Current Non-current Current
Group
Payables 4,673,555 19,955 6,419,171 60
Payables, tax effect (Note 24) - 16,991 - 21,400
Interest - 27,753 - 40,260
4,673,555 64,699 6,419,171 61,720
Thousand Euros
2023 2022
During 2022, Grifols, S.A. formalized a loan with the group company Grifols Escrow Issuer, S.A. in two tranches for
an amount of Euros 1,366 million and US Dollars 687 million with maturity date 2028 and an annual interest of 3.875%
and 4.75% respectively. During 2023, this loan has been cancelled as a result of the merger with Grifols Escrow Issuer,
S.A., see Note 5.
Details of payables to Group companies do not include trade payables to Group companies, details of which are
provided in section d) of this Note.
(b) Payables
Details of payables are as follows:
Non-current Current Non-current Current
Unrelated parties
Promissory notes 4,571,059 30,170 2,556,641 12,554
Loans and borrowings 1,308,026 59,924 1,340,473 50,887
Interest - 8,618 - 10,012
Finance lease payables (Note 9) 27 25 52 391
Financial instruments derivatives (Note 16) - 7,712 3,990 -
Payables 213 521 576 942
5,879,325 106,970 3,901,732 74,786
Thousand Euros
2023 2022 |
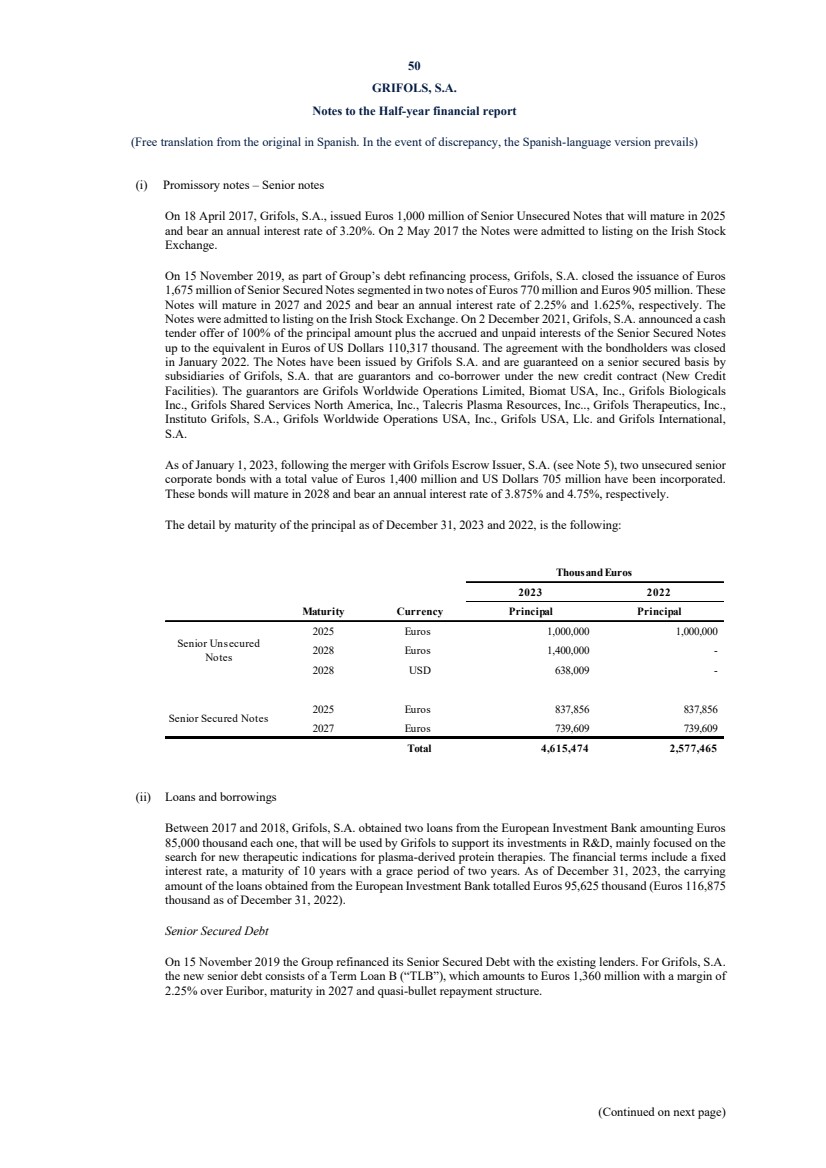
| 50
GRIFOLS, S.A.
Notes to the Half-year financial report
(Free translation from the original in Spanish. In the event of discrepancy, the Spanish-language version prevails)
(Continued on next page)
(i) Promissory notes – Senior notes
On 18 April 2017, Grifols, S.A., issued Euros 1,000 million of Senior Unsecured Notes that will mature in 2025
and bear an annual interest rate of 3.20%. On 2 May 2017 the Notes were admitted to listing on the Irish Stock
Exchange.
On 15 November 2019, as part of Group’s debt refinancing process, Grifols, S.A. closed the issuance of Euros
1,675 million of Senior Secured Notes segmented in two notes of Euros 770 million and Euros 905 million. These
Notes will mature in 2027 and 2025 and bear an annual interest rate of 2.25% and 1.625%, respectively. The
Notes were admitted to listing on the Irish Stock Exchange. On 2 December 2021, Grifols, S.A. announced a cash
tender offer of 100% of the principal amount plus the accrued and unpaid interests of the Senior Secured Notes
up to the equivalent in Euros of US Dollars 110,317 thousand. The agreement with the bondholders was closed
in January 2022. The Notes have been issued by Grifols S.A. and are guaranteed on a senior secured basis by
subsidiaries of Grifols, S.A. that are guarantors and co-borrower under the new credit contract (New Credit
Facilities). The guarantors are Grifols Worldwide Operations Limited, Biomat USA, Inc., Grifols Biologicals
Inc., Grifols Shared Services North America, Inc., Talecris Plasma Resources, Inc.., Grifols Therapeutics, Inc.,
Instituto Grifols, S.A., Grifols Worldwide Operations USA, Inc., Grifols USA, Llc. and Grifols International,
S.A.
As of January 1, 2023, following the merger with Grifols Escrow Issuer, S.A. (see Note 5), two unsecured senior
corporate bonds with a total value of Euros 1,400 million and US Dollars 705 million have been incorporated.
These bonds will mature in 2028 and bear an annual interest rate of 3.875% and 4.75%, respectively.
The detail by maturity of the principal as of December 31, 2023 and 2022, is the following:
2023 2022
Maturity Currency Principal Principal
2025 Euros 1,000,000 1,000,000
2028 Euros 1,400,000 -
2028 USD 638,009 -
2025 Euros 837,856 837,856
2027 Euros 739,609 739,609
Total 4,615,474 2,577,465
Thousand Euros
Senior Unsecured
Notes
Senior Secured Notes
(ii) Loans and borrowings
Between 2017 and 2018, Grifols, S.A. obtained two loans from the European Investment Bank amounting Euros
85,000 thousand each one, that will be used by Grifols to support its investments in R&D, mainly focused on the
search for new therapeutic indications for plasma-derived protein therapies. The financial terms include a fixed
interest rate, a maturity of 10 years with a grace period of two years. As of December 31, 2023, the carrying
amount of the loans obtained from the European Investment Bank totalled Euros 95,625 thousand (Euros 116,875
thousand as of December 31, 2022).
Senior Secured Debt
On 15 November 2019 the Group refinanced its Senior Secured Debt with the existing lenders. For Grifols, S.A.
the new senior debt consists of a Term Loan B (“TLB”), which amounts to Euros 1,360 million with a margin of
2.25% over Euribor, maturity in 2027 and quasi-bullet repayment structure.
|

| 51
GRIFOLS, S.A.
Notes to the Half-year financial report
(Free translation from the original in Spanish. In the event of discrepancy, the Spanish-language version prevails)
(Continued on next page)
The detail by maturity of the principal as of December 31, 2023 and 2022, is the following:
2023 2022
Maturity Currency Principal Principal
2023 Euros - 3,269
2024 Euros 13,076 13,076
2025 Euros 13,076 13,076
2026 Euros 13,076 13,076
2027 Euros 1,216,058 1,216,058
Total 1,255,286 1,258,555
Thousand Euros
As of December 31, 2023, the Tranche B in US Dollars obtained by Grifols Worldwide Operations USA, Inc.
amounting Euros 2,088,578 thousand, and the revolving loan obtained by Grifols Worldwide Operations Ltd.
amounting Euros 360,249 thousand, are guaranteed by Grifols, S.A. and other group companies, that together
with Grifols, S.A. represent, in the aggregate, at least 60% of the consolidated EBITDA of the Group.
In accordance with the senior secured debt contract, the Group is subject to compliance with some covenants. As
of December 31, 2023 and 2022, the Group complies with the covenants in the contract.
(c) Other information on payables
(i) Main characteristics of payables
The terms and conditions of loans and payables are provided in Appendix VII.
Non-current and current promissory notes are presented net of loan arrangement costs. As of December 31,
2023, these costs amount to Euros 44,415 thousand (Euros 20,824 thousand as of December 31, 2022).
Non-current and current loans and borrowings are presented net of loan arrangement costs. As of December
31, 2023, these costs amount to Euros 11,464 thousand (Euros 14,330 thousand as of December 31, 2022).
Additionally to the guarantees disclosed in section b) of this Note, the Company has extended guarantees to
banks on behalf of Group companies for Euros 654 million as of December 31, 2023, (Euros 670 million as of
December 31, 2022).
(d) Trade and other payables
Details of trade and other payables are as follows:
2023 2022
Current Current
Group
Suppliers (Note 26) 9,731 9,235
Related parties
Suppliers (Note 26) 2,675 4,757
Unrelated parties
Suppliers 66,690 54,055
Personnel 29,249 11,541
Public entities, other (Note 24) 4,091 3,399
112,436 82,987
Thousand Euros |
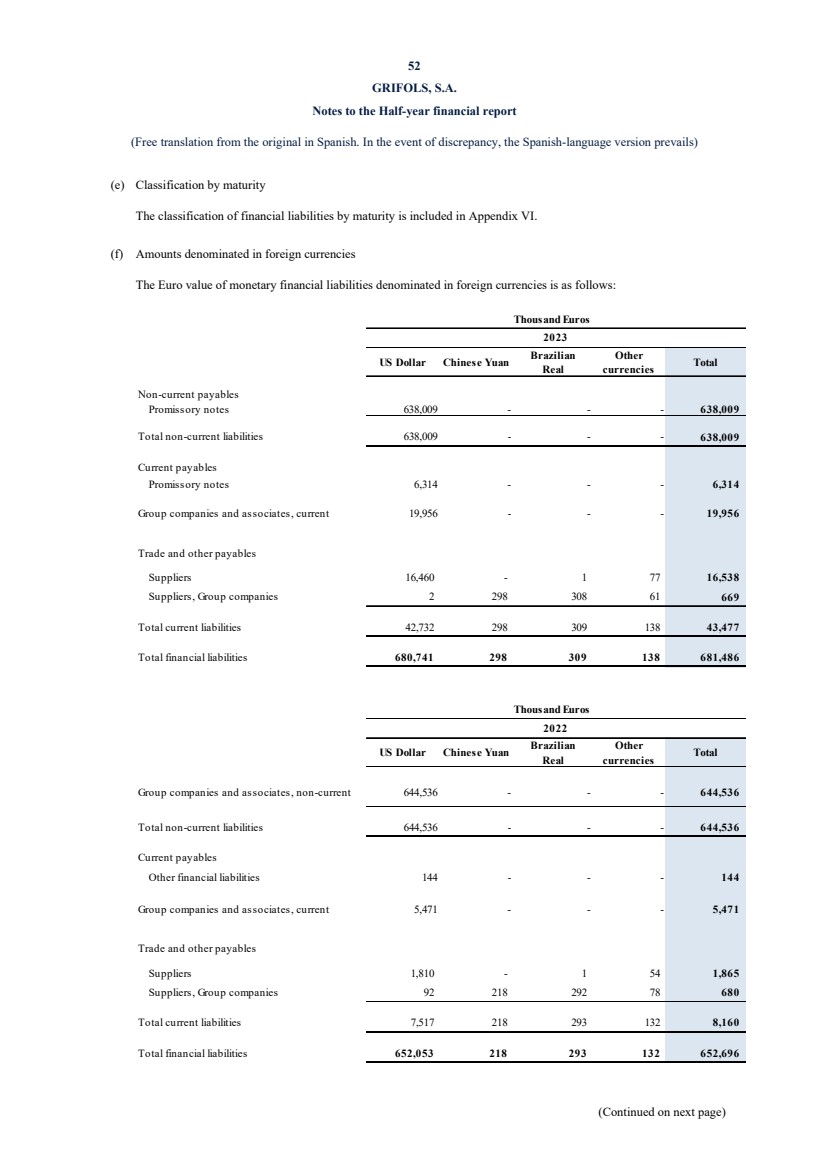
| 52
GRIFOLS, S.A.
Notes to the Half-year financial report
(Free translation from the original in Spanish. In the event of discrepancy, the Spanish-language version prevails)
(Continued on next page)
(e) Classification by maturity
The classification of financial liabilities by maturity is included in Appendix VI.
(f) Amounts denominated in foreign currencies
The Euro value of monetary financial liabilities denominated in foreign currencies is as follows:
Thousand Euros
US Dollar Chinese Yuan Brazilian
Real
Other
currencies
Total
Non-current payables
Promissory notes 638,009 - - - 638,009
Total non-current liabilities 638,009 - - - 638,009
Current payables
Promissory notes 6,314 - - - 6,314
Group companies and associates, current 19,956 - - - 19,956
Trade and other payables
Suppliers 16,460 - 1 77 16,538
Suppliers, Group companies 2 298 308 61 669
Total current liabilities 42,732 298 309 138 43,477
Total financial liabilities 680,741 298 309 138 681,486
2023
Thousand Euros
US Dollar Chinese Yuan Brazilian
Real
Other
currencies
Total
Group companies and associates, non-current 644,536 - - - 644,536
Total non-current liabilities 644,536 - - - 644,536
Current payables
Other financial liabilities 144 - - - 144
Group companies and associates, current 5,471 - - - 5,471
Trade and other payables
Suppliers 1,810 - 1 54 1,865
Suppliers, Group companies 92 218 292 78 680
Total current liabilities 7,517 218 293 132 8,160
Total financial liabilities 652,053 218 293 132 652,696
2022 |

| 53
GRIFOLS, S.A.
Notes to the Half-year financial report
(Free translation from the original in Spanish. In the event of discrepancy, the Spanish-language version prevails)
(Continued on next page)
Details of exchange differences recognised in profit or loss on financial instruments, distinguishing between settled and
outstanding transactions, are as follows:
Settled Outstanding Settled Outstanding
Non- Current payables
Promissory notes - 571 - -
Group companies and associates, non-current 810 - 12,795 -
Total non-current liabilities 810 571 12,795 -
Current payables
Promissory notes 866 (222) - -
Loans and borrowings (377) - (326) -
Group companies and associates, current 142 529 (1,229) 299
Trade and other payables
Current payables to suppliers (149) 391 (496) 167
Current group payables to suppliers 17 30 (2,000) -
Total current liabilities 499 728 (4,051) 466
Total financial liabilities 1,309 1,299 8,744 466
Thousand Euros
2023 2022
(g) Other guarantees to group companies and associates
In accordance with the provision of section 357 of the Irish Companies Act 2014, the Company has irrevocably
guaranteed all liabilities of an Irish subsidiary undertaking, Grifols Worldwide Operations Limited (Ireland).
(23) Late Payments to Suppliers. "Reporting Requirement". Second Additional Provision of Law
31/2014 of 4 December 2014
In accordance with the aforementioned Law, the following information corresponding to the Company is disclosed:
2023 2022
Weighted average maturity period 61 56
Ratio of payments 61 57
Ratio of outstanding invoices 55 50
2023 2022
Total payments 303,671 306,701
Outstanding invoices 29,399 35,957
Days
Thousand Euros
|
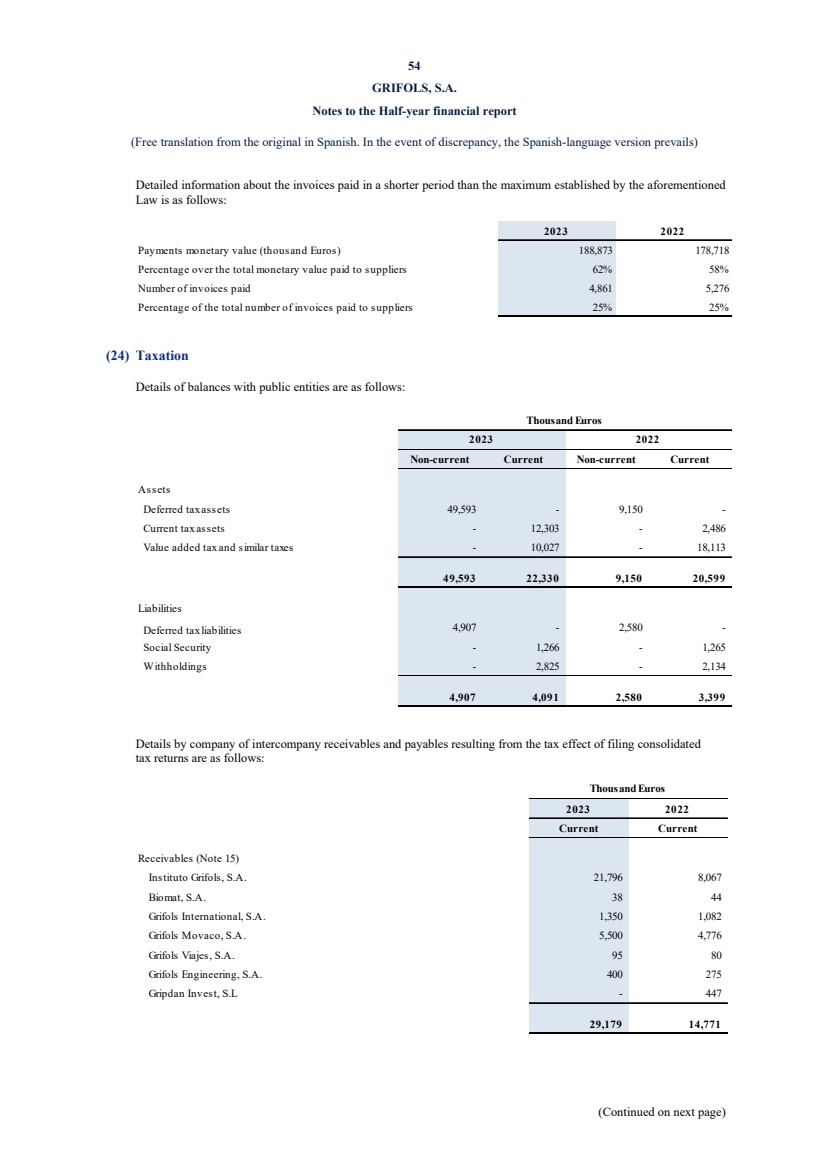
| 54
GRIFOLS, S.A.
Notes to the Half-year financial report
(Free translation from the original in Spanish. In the event of discrepancy, the Spanish-language version prevails)
(Continued on next page)
Detailed information about the invoices paid in a shorter period than the maximum established by the aforementioned
Law is as follows:
2023 2022
Payments monetary value (thousand Euros) 188,873 178,718
Percentage over the total monetary value paid to suppliers 62% 58%
Number of invoices paid 4,861 5,276
Percentage of the total number of invoices paid to suppliers 25% 25%
(24) Taxation
Details of balances with public entities are as follows:
Non-current Current Non-current Current
Assets
Deferred tax assets 49,593 - 9,150 -
Current tax assets - 12,303 - 2,486
Value added tax and similar taxes - 10,027 - 18,113
49,593 22,330 9,150 20,599
Liabilities
Deferred tax liabilities 4,907 - 2,580 -
Social Security - 1,266 - 1,265
Withholdings - 2,825 - 2,134
4,907 4,091 2,580 3,399
Thousand Euros
2023 2022
Details by company of intercompany receivables and payables resulting from the tax effect of filing consolidated
tax returns are as follows:
2023 2022
Current Current
Receivables (Note 15)
Instituto Grifols, S.A. 21,796 8,067
Biomat, S.A. 38 44
Grifols International, S.A. 1,350 1,082
Grifols Movaco, S.A. 5,500 4,776
Grifols Viajes, S.A. 95 80
Grifols Engineering, S.A. 400 275
Gripdan Invest, S.L - 447
29,179 14,771
Thousand Euros |
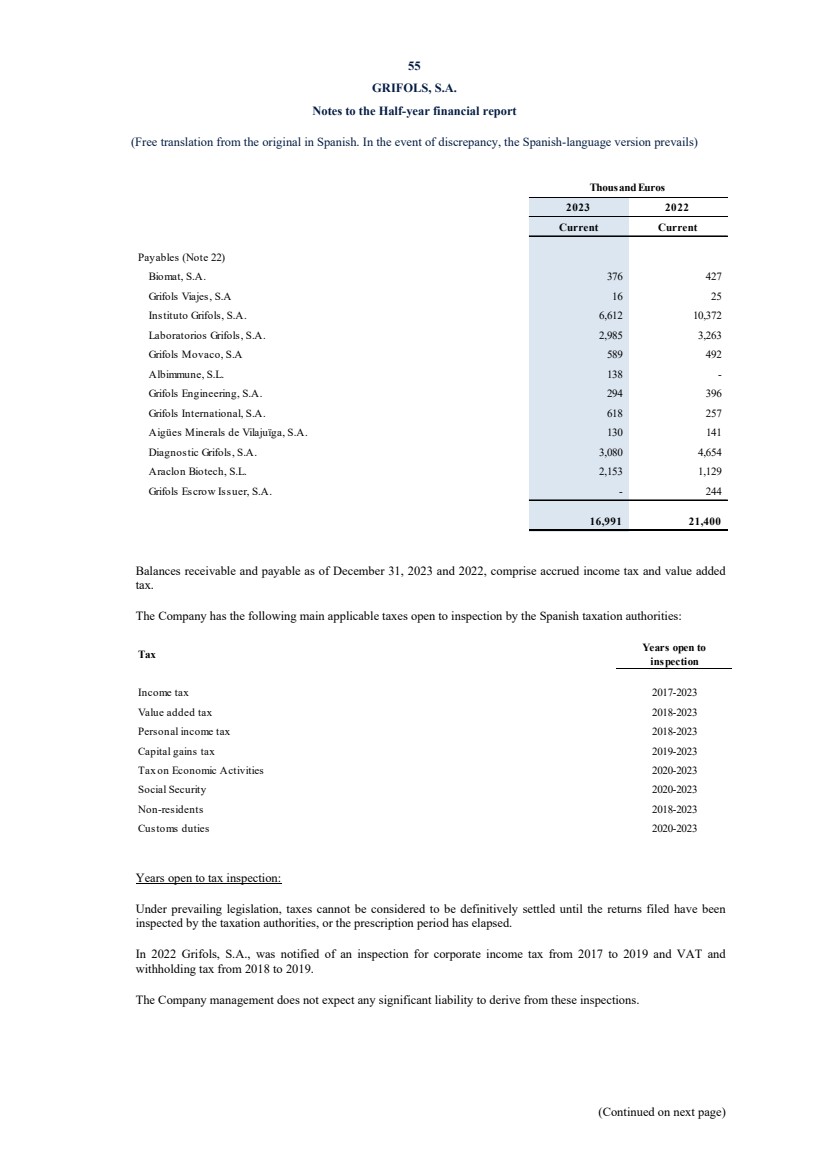
| 55
GRIFOLS, S.A.
Notes to the Half-year financial report
(Free translation from the original in Spanish. In the event of discrepancy, the Spanish-language version prevails)
(Continued on next page)
2023 2022
Current Current
Payables (Note 22)
Biomat, S.A. 376 427
Grifols Viajes, S.A 16 25
Instituto Grifols, S.A. 6,612 10,372
Laboratorios Grifols, S.A. 2,985 3,263
Grifols Movaco, S.A 589 492
Albimmune, S.L. 138 -
Grifols Engineering, S.A. 294 396
Grifols International, S.A. 618 257
Aigües Minerals de Vilajuïga, S.A. 130 141
Diagnostic Grifols, S.A. 3,080 4,654
Araclon Biotech, S.L. 2,153 1,129
Grifols Escrow Issuer, S.A. - 244
16,991 21,400
Thousand Euros
Balances receivable and payable as of December 31, 2023 and 2022, comprise accrued income tax and value added
tax.
The Company has the following main applicable taxes open to inspection by the Spanish taxation authorities:
Tax Years open to
inspection
Income tax 2017-2023
Value added tax 2018-2023
Personal income tax 2018-2023
Capital gains tax 2019-2023
Tax on Economic Activities 2020-2023
Social Security 2020-2023
Non-residents 2018-2023
Customs duties 2020-2023
Years open to tax inspection:
Under prevailing legislation, taxes cannot be considered to be definitively settled until the returns filed have been
inspected by the taxation authorities, or the prescription period has elapsed.
In 2022 Grifols, S.A., was notified of an inspection for corporate income tax from 2017 to 2019 and VAT and
withholding tax from 2018 to 2019.
The Company management does not expect any significant liability to derive from these inspections. |
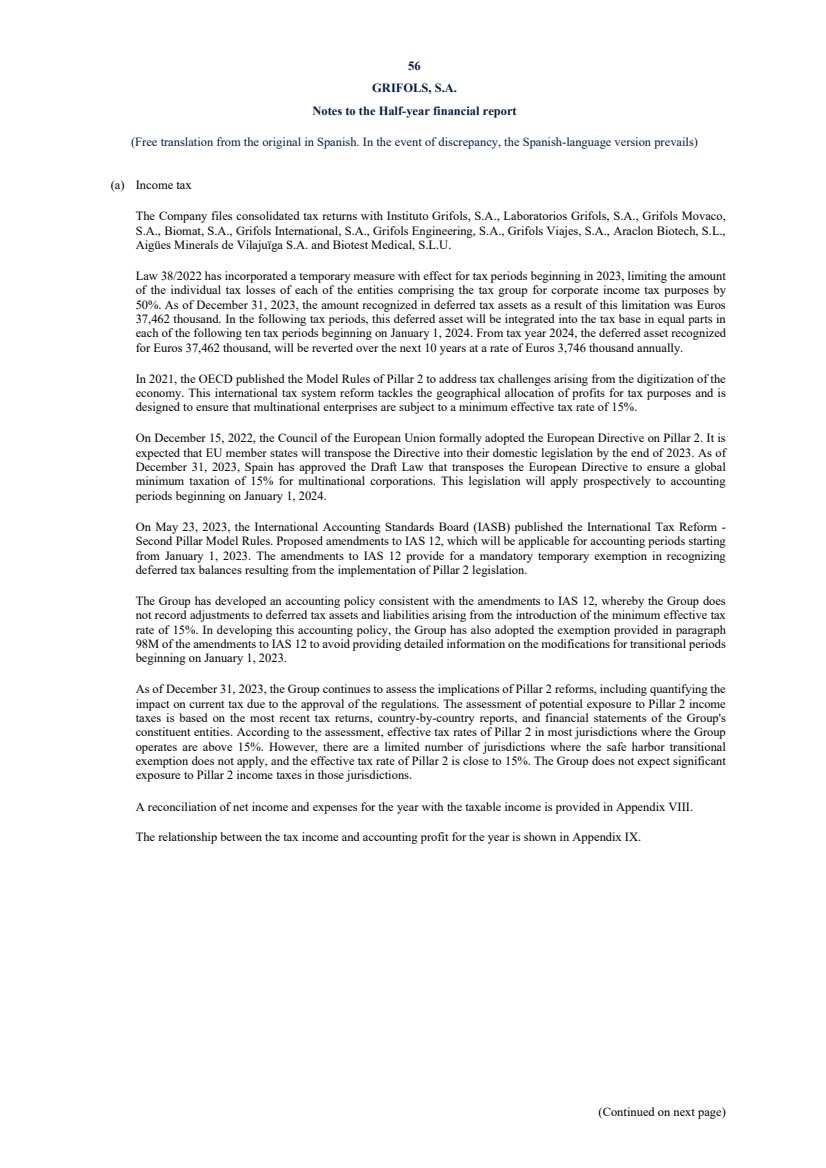
| 56
GRIFOLS, S.A.
Notes to the Half-year financial report
(Free translation from the original in Spanish. In the event of discrepancy, the Spanish-language version prevails)
(Continued on next page)
(a) Income tax
The Company files consolidated tax returns with Instituto Grifols, S.A., Laboratorios Grifols, S.A., Grifols Movaco,
S.A., Biomat, S.A., Grifols International, S.A., Grifols Engineering, S.A., Grifols Viajes, S.A., Araclon Biotech, S.L.,
Aigües Minerals de Vilajuïga S.A. and Biotest Medical, S.L.U.
Law 38/2022 has incorporated a temporary measure with effect for tax periods beginning in 2023, limiting the amount
of the individual tax losses of each of the entities comprising the tax group for corporate income tax purposes by
50%. As of December 31, 2023, the amount recognized in deferred tax assets as a result of this limitation was Euros
37,462 thousand. In the following tax periods, this deferred asset will be integrated into the tax base in equal parts in
each of the following ten tax periods beginning on January 1, 2024. From tax year 2024, the deferred asset recognized
for Euros 37,462 thousand, will be reverted over the next 10 years at a rate of Euros 3,746 thousand annually.
In 2021, the OECD published the Model Rules of Pillar 2 to address tax challenges arising from the digitization of the
economy. This international tax system reform tackles the geographical allocation of profits for tax purposes and is
designed to ensure that multinational enterprises are subject to a minimum effective tax rate of 15%.
On December 15, 2022, the Council of the European Union formally adopted the European Directive on Pillar 2. It is
expected that EU member states will transpose the Directive into their domestic legislation by the end of 2023. As of
December 31, 2023, Spain has approved the Draft Law that transposes the European Directive to ensure a global
minimum taxation of 15% for multinational corporations. This legislation will apply prospectively to accounting
periods beginning on January 1, 2024.
On May 23, 2023, the International Accounting Standards Board (IASB) published the International Tax Reform -
Second Pillar Model Rules. Proposed amendments to IAS 12, which will be applicable for accounting periods starting
from January 1, 2023. The amendments to IAS 12 provide for a mandatory temporary exemption in recognizing
deferred tax balances resulting from the implementation of Pillar 2 legislation.
The Group has developed an accounting policy consistent with the amendments to IAS 12, whereby the Group does
not record adjustments to deferred tax assets and liabilities arising from the introduction of the minimum effective tax
rate of 15%. In developing this accounting policy, the Group has also adopted the exemption provided in paragraph
98M of the amendments to IAS 12 to avoid providing detailed information on the modifications for transitional periods
beginning on January 1, 2023.
As of December 31, 2023, the Group continues to assess the implications of Pillar 2 reforms, including quantifying the
impact on current tax due to the approval of the regulations. The assessment of potential exposure to Pillar 2 income
taxes is based on the most recent tax returns, country-by-country reports, and financial statements of the Group's
constituent entities. According to the assessment, effective tax rates of Pillar 2 in most jurisdictions where the Group
operates are above 15%. However, there are a limited number of jurisdictions where the safe harbor transitional
exemption does not apply, and the effective tax rate of Pillar 2 is close to 15%. The Group does not expect significant
exposure to Pillar 2 income taxes in those jurisdictions.
A reconciliation of net income and expenses for the year with the taxable income is provided in Appendix VIII.
The relationship between the tax income and accounting profit for the year is shown in Appendix IX.
|
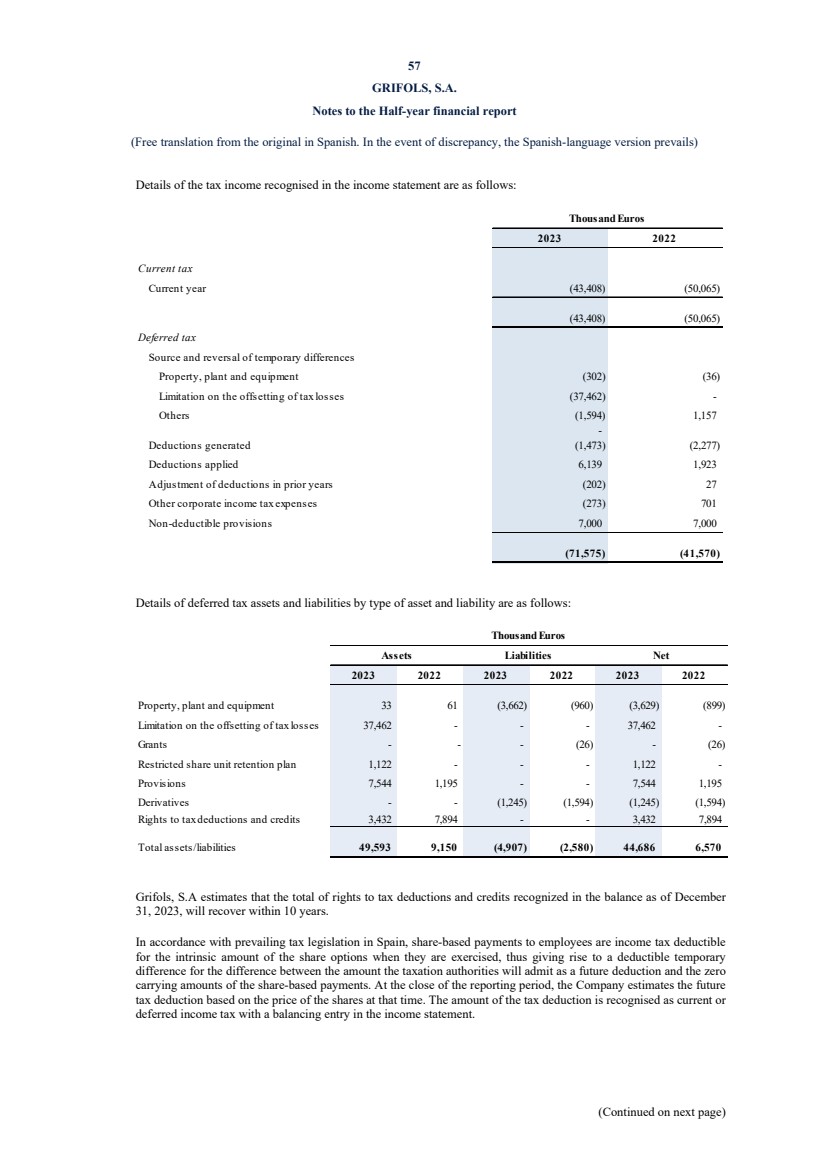
| 57
GRIFOLS, S.A.
Notes to the Half-year financial report
(Free translation from the original in Spanish. In the event of discrepancy, the Spanish-language version prevails)
(Continued on next page)
Details of the tax income recognised in the income statement are as follows:
2023 2022
Current tax
Current year (43,408) (50,065)
(43,408) (50,065)
Deferred tax
Source and reversal of temporary differences
Property, plant and equipment (302) (36)
Limitation on the offsetting of tax losses (37,462) -
Others (1,594) 1,157
-
Deductions generated (1,473) (2,277)
Deductions applied 6,139 1,923
Adjustment of deductions in prior years (202) 27
Other corporate income tax expenses (273) 701
Non-deductible provisions 7,000 7,000
(71,575) (41,570)
Thousand Euros
Details of deferred tax assets and liabilities by type of asset and liability are as follows:
2023 2022 2023 2022 2023 2022
Property, plant and equipment 33 61 (3,662) (960) (3,629) (899)
Limitation on the offsetting of tax losses 37,462 - - - 37,462 -
Grants - - - (26) - (26)
Restricted share unit retention plan 1,122 - - - 1,122 -
Provisions 7,544 1,195 - - 7,544 1,195
Derivatives - - (1,245) (1,594) (1,245) (1,594)
Rights to tax deductions and credits 3,432 7,894 - - 3,432 7,894
Total assets/liabilities 49,593 9,150 (4,907) (2,580) 44,686 6,570
Thousand Euros
Assets Liabilities Net
Grifols, S.A estimates that the total of rights to tax deductions and credits recognized in the balance as of December
31, 2023, will recover within 10 years.
In accordance with prevailing tax legislation in Spain, share-based payments to employees are income tax deductible
for the intrinsic amount of the share options when they are exercised, thus giving rise to a deductible temporary
difference for the difference between the amount the taxation authorities will admit as a future deduction and the zero
carrying amounts of the share-based payments. At the close of the reporting period, the Company estimates the future
tax deduction based on the price of the shares at that time. The amount of the tax deduction is recognised as current or
deferred income tax with a balancing entry in the income statement.
|
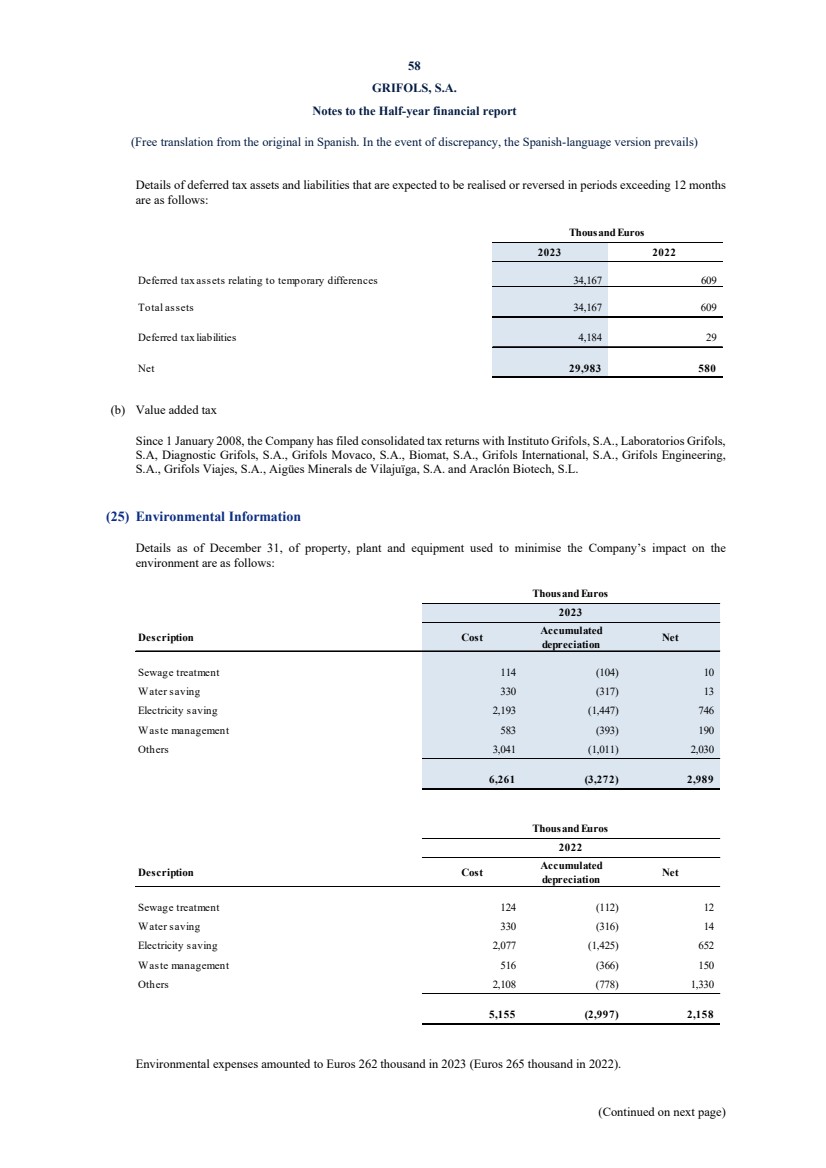
| 58
GRIFOLS, S.A.
Notes to the Half-year financial report
(Free translation from the original in Spanish. In the event of discrepancy, the Spanish-language version prevails)
(Continued on next page)
Details of deferred tax assets and liabilities that are expected to be realised or reversed in periods exceeding 12 months
are as follows:
2023 2022
Deferred tax assets relating to temporary differences 34,167 609
Total assets 34,167 609
Deferred tax liabilities 4,184 29
Net 29,983 580
Thousand Euros
(b) Value added tax
Since 1 January 2008, the Company has filed consolidated tax returns with Instituto Grifols, S.A., Laboratorios Grifols,
S.A, Diagnostic Grifols, S.A., Grifols Movaco, S.A., Biomat, S.A., Grifols International, S.A., Grifols Engineering,
S.A., Grifols Viajes, S.A., Aigües Minerals de Vilajuïga, S.A. and Araclón Biotech, S.L.
(25) Environmental Information
Details as of December 31, of property, plant and equipment used to minimise the Company’s impact on the
environment are as follows:
Description Cost Accumulated
depreciation Net
Sewage treatment 114 (104) 10
Water saving 330 (317) 13
Electricity saving 2,193 (1,447) 746
Waste management 583 (393) 190
Others 3,041 (1,011) 2,030
6,261 (3,272) 2,989
Thousand Euros
2023
Description Cost Accumulated
depreciation Net
Sewage treatment 124 (112) 12
Water saving 330 (316) 14
Electricity saving 2,077 (1,425) 652
Waste management 516 (366) 150
Others 2,108 (778) 1,330
5,155 (2,997) 2,158
Thousand Euros
2022
Environmental expenses amounted to Euros 262 thousand in 2023 (Euros 265 thousand in 2022). |
| 59
GRIFOLS, S.A.
Notes to the Half-year financial report
(Free translation from the original in Spanish. In the event of discrepancy, the Spanish-language version prevails)
(Continued on next page)
(26) Related Party Balances and Transactions
(a) Related party balances
Details of balances receivable from and payable to Group companies and related parties and the main characteristics
are disclosed in Notes 15 and 22.
Details of balances by category are provided in Appendix X.
(b) Related party transactions
Details of the Company’s transactions with related parties are provided in Appendix XI.
Services are normally negotiated with Group companies to include a mark-up of between 5% and 10%.
The Company contributes 0.7% of pre-tax consolidated profits for each year to a non-profit organisation.
Transactions with other related parties are conducted at arm’s length.
(c) Information on the Company's directors and senior management personnel
In 2023 the independent members of the Company’s board of directors accrued Euros 825 thousand in their capacity
as such (Euros 963 thousand in 2022). In 2023, the proprietary director’s total accrued remuneration amounted to Euros
965 thousand (Euros 965 thousand in 2022). The members of the Company’s board of directors who have a labour
relationship with the Company and senior management personnel accrued Euros 5,328 thousand and Euros 17,046
thousand, respectively (Euros 2,500 thousand and Euros 6,201 thousand in 2022).
Members of the board of directors have not received any loans or advances nor has the Company extended any
guarantees on their behalf. The Company has no pension or life insurance obligations with its former or current directors
or senior management personnel. In addition, termination benefit commitments are in place for certain Company
directors and senior management personnel (see Note 20).
During 2023, the Company has paid insurance premiums for civil liability of directors amounting to Euros 1,113
thousand (Euros 1,216 thousand in 2022).
(d) Conflicts of interest concerning the directors
The directors of the Company and their related parties have had no conflicts of interest requiring disclosure in
accordance with article 229 of the Revised Spanish Companies Act.
(27) Income and Expenses
(a) Revenues
Details of revenues by category of activity and geographical market are shown in Appendix XII.
|

| 60
GRIFOLS, S.A.
Notes to the Half-year financial report
(Free translation from the original in Spanish. In the event of discrepancy, the Spanish-language version prevails)
(Continued on next page)
(b) Supplies
Details of other supplies used are as follows:
(c) Employee benefits expense and provisions
Details of employee benefits expense are as follows:
2023 2022
Employee benefits expense
Social Security payable by the Company 13,378 12,315
Defined contribution plan contributions 207 206
Other employee benefits expenses 2,510 2,673
Provisions - 152
16,095 15,346
Thousand Euros
(28) Employee Information
The average headcount of the Company, distributed by department, is as follows:
2023 2022
Technical area 156 137
Administration and other 567 586
General management 75 81
798 804
Number
2023 2022
Other supplies used
Purchases of spare parts 5,555 8,889
Change in inventories (1,311) (1,815)
4,244 7,074
Thousand Euros |
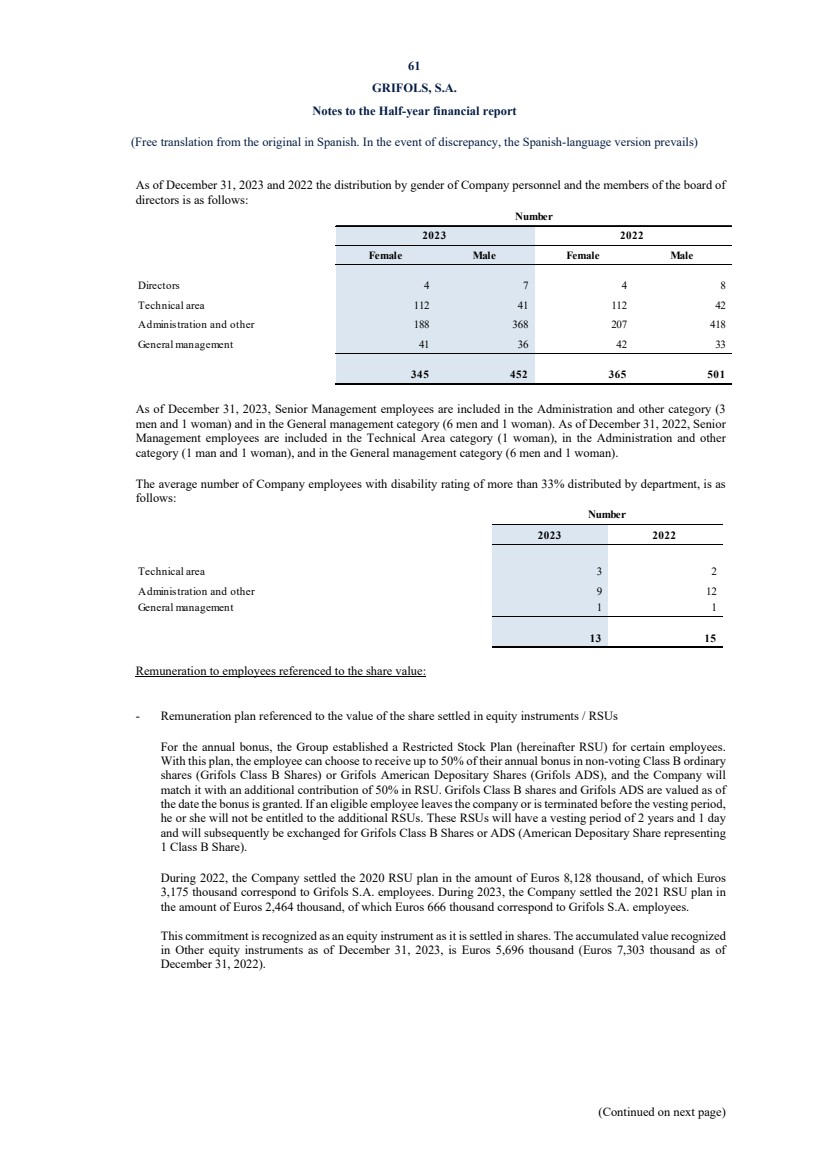
| 61
GRIFOLS, S.A.
Notes to the Half-year financial report
(Free translation from the original in Spanish. In the event of discrepancy, the Spanish-language version prevails)
(Continued on next page)
As of December 31, 2023 and 2022 the distribution by gender of Company personnel and the members of the board of
directors is as follows:
Female Male Female Male
Directors 4 7 4 8
Technical area 112 41 112 42
Administration and other 188 368 207 418
General management 41 36 42 33
345 452 365 501
2023 2022
Number
As of December 31, 2023, Senior Management employees are included in the Administration and other category (3
men and 1 woman) and in the General management category (6 men and 1 woman). As of December 31, 2022, Senior
Management employees are included in the Technical Area category (1 woman), in the Administration and other
category (1 man and 1 woman), and in the General management category (6 men and 1 woman).
The average number of Company employees with disability rating of more than 33% distributed by department, is as
follows:
2023 2022
Technical area 3 2
Administration and other 9 12
General management 1 1
13 15
Number
Remuneration to employees referenced to the share value:
- Remuneration plan referenced to the value of the share settled in equity instruments / RSUs
For the annual bonus, the Group established a Restricted Stock Plan (hereinafter RSU) for certain employees.
With this plan, the employee can choose to receive up to 50% of their annual bonus in non-voting Class B ordinary
shares (Grifols Class B Shares) or Grifols American Depositary Shares (Grifols ADS), and the Company will
match it with an additional contribution of 50% in RSU. Grifols Class B shares and Grifols ADS are valued as of
the date the bonus is granted. If an eligible employee leaves the company or is terminated before the vesting period,
he or she will not be entitled to the additional RSUs. These RSUs will have a vesting period of 2 years and 1 day
and will subsequently be exchanged for Grifols Class B Shares or ADS (American Depositary Share representing
1 Class B Share).
During 2022, the Company settled the 2020 RSU plan in the amount of Euros 8,128 thousand, of which Euros
3,175 thousand correspond to Grifols S.A. employees. During 2023, the Company settled the 2021 RSU plan in
the amount of Euros 2,464 thousand, of which Euros 666 thousand correspond to Grifols S.A. employees.
This commitment is recognized as an equity instrument as it is settled in shares. The accumulated value recognized
in Other equity instruments as of December 31, 2023, is Euros 5,696 thousand (Euros 7,303 thousand as of
December 31, 2022).
|

| 62
GRIFOLS, S.A.
Notes to the Half-year financial report
(Free translation from the original in Spanish. In the event of discrepancy, the Spanish-language version prevails)
(Continued on next page)
- Remuneration plan referenced to the value of the share settled in equity instruments / Stock options
In May 2023, the Board of Directors has approved a long-term incentive plan based on the granting of stock
options for certain executive directors, members of senior management of Grifols and its subsidiaries. The plan is
valid for four years for each beneficiary, from the date of entry into force where, 40% of the options granted will
be consolidated (provided that the conditions for their consolidation are met) at the end of the second year of the
plan and the remaining 60% will be consolidated (provided that the conditions for its consolidation are met) at the
end of the fourth year of the plan. A maximum of 4,020,000 share options will be granted, which represent the
right to acquire 4,020,000 Class A shares of the Company with an exercise price of Euros 8.96 per Class A share.
As a condition for consolidation of the options granted, each beneficiary must have remained continuously
employed by Grifols on each vesting date, must pass an individual performance evaluation and, in addition, the
settlement is subject to compliance with specific, predetermined and quantifiable objectives, related to metrics.
financial and non-financial, in order to reward the creation of value through the achievement of the objectives set
in the plan. The Company will allocate the shares that it currently owns in treasury stock or that it may own to
cover the needs of the plan.
This commitment is recognized as an equity instrument as it is settled in shares. The accumulated value recognized
in Other equity instruments as of December 31, 2023, is Euros 2,586 thousand.
Settlement date Number of shares assigned Unitary fair value (euros)
2025 1,148,000 3.05
2027 1,722,000 2.85
Additionally, there is a special remuneration plan linked to the stock value settled in equity instruments for certain
executives with an exercise price of Euros 8.964 and Euros 12.84 per Class A share, expiring in 2024 and 2025.
Settlement date Number of shares assigned Unitary fair value (euros)
28/02/2024 180,000 2.39
22/02/2025 700,000 1.08
28/02/2025 270,000 2.19
- Remuneration plan referenced to the value of the share settled in cash
In May 2023, the Board of Directors of Grifols, S.A. has approved a new long-term incentive plan based on
restricted stock units (RSU) aimed at certain members of the management team of the Company and its
subsidiaries. The plan has a total duration of four years, where 50% of the RSUs granted will be liquidated at the
end of the second year of the plan and the remaining at the end of the fourth year of the plan. As a condition for
the vesting of the RSUs granted, each beneficiary must have remained continuously employed by Grifols as of the
date of liquidation of the plan and, in addition, said liquidation is subject to compliance with performance
objectives. The RSUs will be settled in cash for an amount equivalent to the average price of Class A shares during
the five (5) business days prior to settlement.
As of December 31, 2023, the accumulated value recognized as liability amounts to Euros 1,610 thousand and is
included in the caption “Trade creditors and other accounts payable”.
Settlement date Number of shares assigned
as of 31 December 2023 Unitary fair value (euros)
2025 278,400 13.22
2027 278,400 11.08 |

| 63
GRIFOLS, S.A.
Notes to the Half-year financial report
(Free translation from the original in Spanish. In the event of discrepancy, the Spanish-language version prevails)
(Continued on next page)
(29) Audit Fees
In 2023 the Company’s annual accounts auditor, Deloitte S.L., invoiced the Company for audit services that amounted
a total of Euros 98 thousand (Euros 84 thousand in 2022).
During 2023 and 2022 the fees related to audit services and other services invoiced by the Company’s auditor, Deloitte,
S.L., or for a company associated to the auditor by control, common property or management to the Company and the
associated companies have been the following:
2023 2022
Audit services 189 84
Non-audit services
Other services required by the regulations - -
Other assurance services - -
Tax services - 18
Other services - -
Total professional services 189 102
Thousand Euros
Fees by Deloitte S.L. or member firms
of its network
The 18 thousand euros in 2022 of the table above were rendered to associated companies to the Company for a
controlling relationship.
The amounts in the above table include the total fees for services rendered in 2023 and 2022, irrespectively of the date
of invoice.
|
| 64
GRIFOLS, S.A.
Notes to the Half-year financial report
(Free translation from the original in Spanish. In the event of discrepancy, the Spanish-language version prevails)
(Continued on next page)
(30) Subsequent events
On January 9, 2024, a short seller investor issued a report based on speculation and false information regarding Grifols’
accounting and financial information. Although the company’s fundamentals remain sound and unchanged and all
financial information was duly reported in the audited financial statements, this action had a significant impact on
Grifols’ share price and corporate reputation.
The company is currently working to restore the confidence of markets, shareholders and other stakeholders in three
key areas:
Communication and collaboration with the Spanish regulator (CNMV).
Transparent communication with all our stakeholders: sharing our clear response to the published report through
live conference calls and multiple official communications on the company’s website and on the CNMV portal.
All press releases are publicly available on Grifols’ website:
(https://www.grifols.com/es/informacion-relevante).
Clear and transparent communication with our teams and employee representatives, including major unions.
Reinforced communication with investors, official communications, direct phone calls, video calls and e-mails.
The company filed a complaint1 in the United States District Court for the Southern District of New York against
Daniel Yu, Gotham City Research LLC, General Industrial Partners LLP, Cyrus de Weck, and their affiliates to
claim for the financial and reputational damages caused to Grifols and their stakeholders as a result of the
defendants’ actions.
The company established a dedicated working group comprising senior managers from the legal,
communications, finance, investor relations and management teams, together with external advisors with
expertise in communications.
1 Official communication on the lawsuit filed:
https://www.cnmv.es/webservices/verdocumento/ver?t=%7b3498d0f6-c93e-4f95-8add-001b02c1cf28%7d |
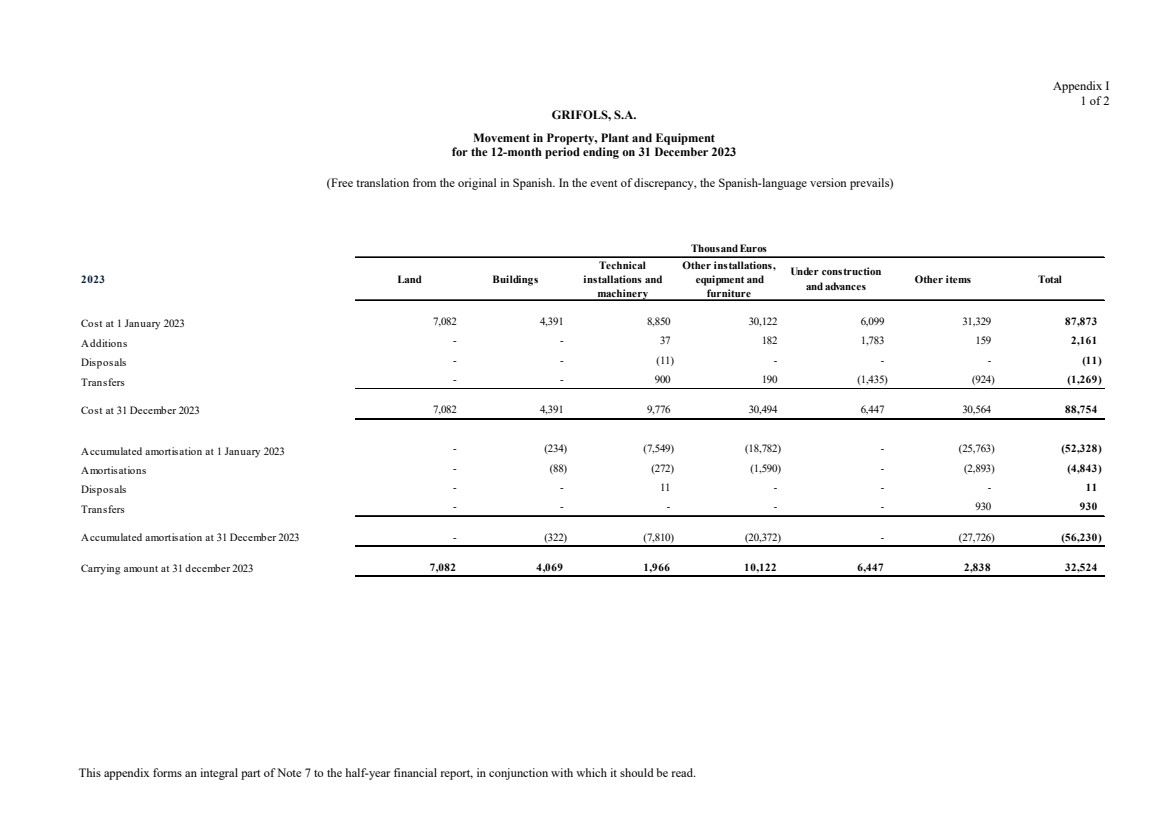
| This appendix forms an integral part of Note 7 to the half-year financial report, in conjunction with which it should be read.
Appendix I
1 of 2
GRIFOLS, S.A.
Movement in Property, Plant and Equipment
for the 12-month period ending on 31 December 2023
(Free translation from the original in Spanish. In the event of discrepancy, the Spanish-language version prevails)
Thousand Euros
2023 Land Buildings
Technical
installations and
machinery
Other installations,
equipment and
furniture
Under construction
and advances Other items Total
Cost at 1 January 2023 7,082 4,391 8,850 30,122 6,099 31,329 87,873
Additions - - 37 182 1,783 159 2,161
Disposals - - (11) - - - (11)
Transfers - - 900 190 (1,435) (924) (1,269)
Cost at 31 December 2023 7,082 4,391 9,776 30,494 6,447 30,564 88,754
Accumulated amortisation at 1 January 2023 - (234) (7,549) (18,782) - (25,763) (52,328)
Amortisations - (88) (272) (1,590) - (2,893) (4,843)
Disposals - - 11 - - - 11
Transfers - - - - - 930 930
Accumulated amortisation at 31 December 2023 - (322) (7,810) (20,372) - (27,726) (56,230)
Carrying amount at 31 december 2023 7,082 4,069 1,966 10,122 6,447 2,838 32,524 |
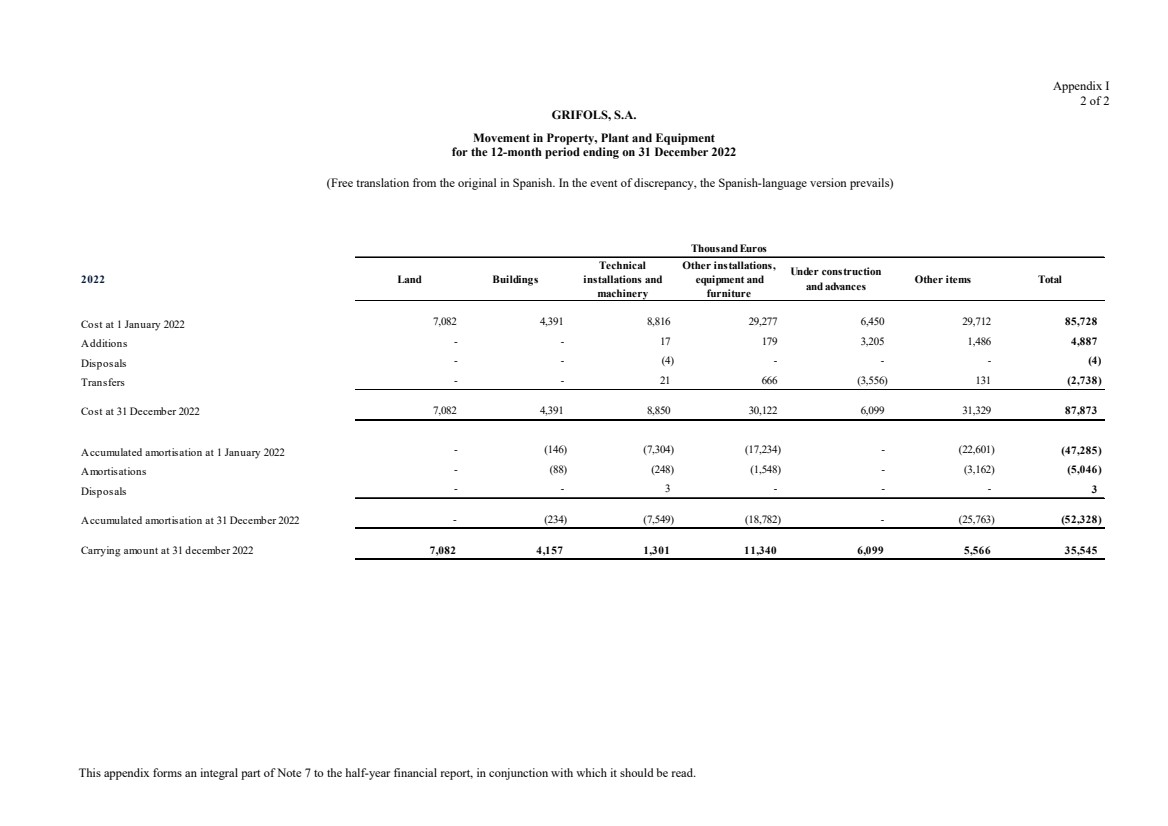
| This appendix forms an integral part of Note 7 to the half-year financial report, in conjunction with which it should be read.
Appendix I
2 of 2
GRIFOLS, S.A.
Movement in Property, Plant and Equipment
for the 12-month period ending on 31 December 2022
(Free translation from the original in Spanish. In the event of discrepancy, the Spanish-language version prevails)
Thousand Euros
2022 Land Buildings
Technical
installations and
machinery
Other installations,
equipment and
furniture
Under construction
and advances Other items Total
Cost at 1 January 2022 7,082 4,391 8,816 29,277 6,450 29,712 85,728
Additions - - 17 179 3,205 1,486 4,887
Disposals - - (4) - - - (4)
Transfers - - 21 666 (3,556) 131 (2,738)
Cost at 31 December 2022 7,082 4,391 8,850 30,122 6,099 31,329 87,873
Accumulated amortisation at 1 January 2022 - (146) (7,304) (17,234) - (22,601) (47,285)
Amortisations - (88) (248) (1,548) - (3,162) (5,046)
Disposals - - 3 - - - 3
Accumulated amortisation at 31 December 2022 - (234) (7,549) (18,782) - (25,763) (52,328)
Carrying amount at 31 december 2022 7,082 4,157 1,301 11,340 6,099 5,566 35,545 |
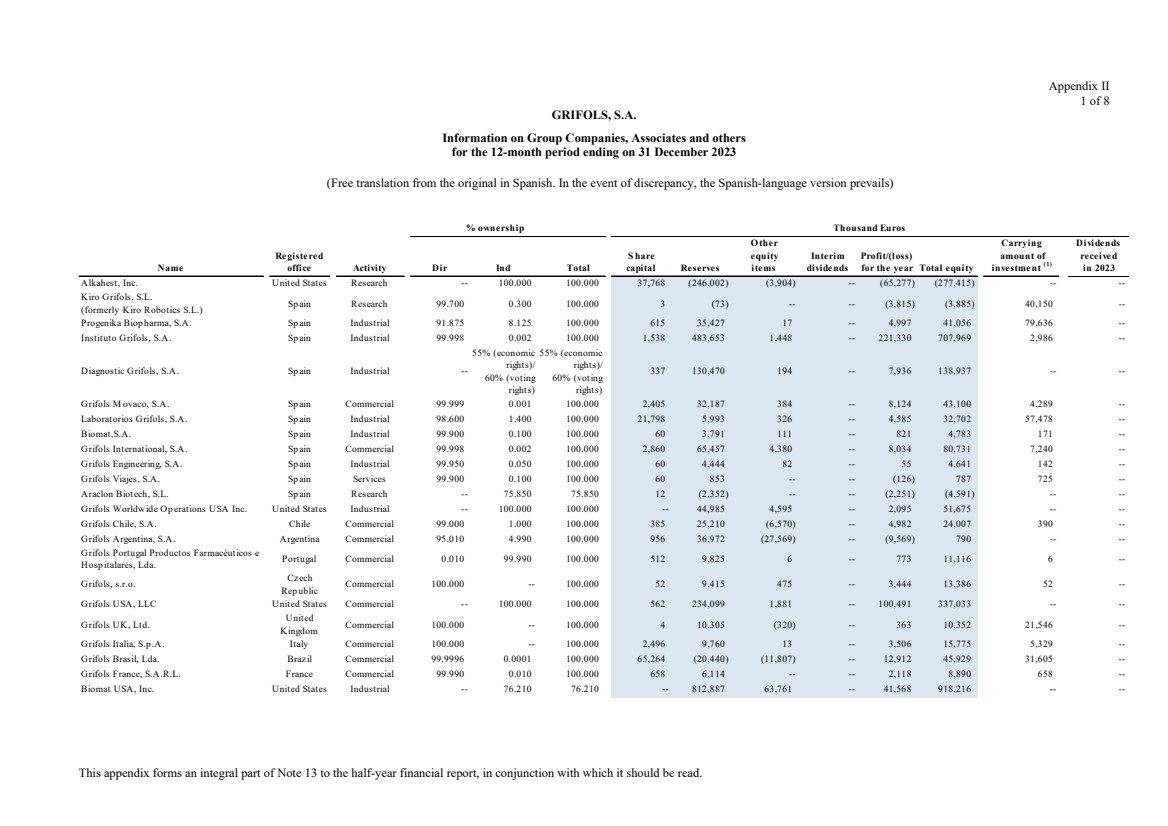
| This appendix forms an integral part of Note 13 to the half-year financial report, in conjunction with which it should be read.
Appendix II
1 of 8
GRIFOLS, S.A.
Information on Group Companies, Associates and others
for the 12-month period ending on 31 December 2023
(Free translation from the original in Spanish. In the event of discrepancy, the Spanish-language version prevails)
Other Carrying Dividends
Registered S hare equity Interim Profit/(loss) amount of received
Name office Activity Dir Ind Total capital Reserves items dividends for the year Total equity investment (1) in 2023
Alkahest, Inc. United States Research -- 100.000 100.000 37,768 (246,002) (3,904) -- (65,277) (277,415) -- --
Kiro Grifols, S.L.
(formerly Kiro Robotics S.L.) Sp ain Research 99.700 0.300 100.000 3 (73) -- -- (3,815) (3,885) 40,150 --
Progenika Biop harma, S.A. Sp ain Industrial 91.875 8.125 100.000 615 35,427 17 -- 4,997 41,056 79,636 --
Instituto Grifols, S.A. Sp ain Industrial 99.998 0.002 100.000 1,538 483,653 1,448 -- 221,330 707,969 2,986 --
Diagnostic Grifols, S.A. Sp ain Industrial --
55% (economic
rights)/
60% (voting
rights)
55% (economic
rights)/
60% (voting
rights)
337 130,470 194 -- 7,936 138,937 -- --
Grifols M ovaco, S.A. Sp ain Commercial 99.999 0.001 100.000 2,405 32,187 384 -- 8,124 43,100 4,289 --
Laboratorios Grifols, S.A. Sp ain Industrial 98.600 1.400 100.000 21,798 5,993 326 -- 4,585 32,702 57,478 --
Biomat,S.A. Sp ain Industrial 99.900 0.100 100.000 60 3,791 111 -- 821 4,783 171 --
Grifols International, S.A. Sp ain Commercial 99.998 0.002 100.000 2,860 65,457 4,380 -- 8,034 80,731 7,240 --
Grifols Engineering, S.A. Sp ain Industrial 99.950 0.050 100.000 60 4,444 82 -- 55 4,641 142 --
Grifols Viajes, S.A. Sp ain Services 99.900 0.100 100.000 60 853 -- -- (126) 787 725 --
Araclon Biotech, S.L. Sp ain Research -- 75.850 75.850 12 (2,352) -- -- (2,251) (4,591) -- --
Grifols Worldwide Operations USA Inc. United States Industrial -- 100.000 100.000 -- 44,985 4,595 -- 2,095 51,675 -- --
Grifols Chile, S.A. Chile Commercial 99.000 1.000 100.000 385 25,210 (6,570) -- 4,982 24,007 390 --
Grifols Argentina, S.A. Argentina Commercial 95.010 4.990 100.000 956 36,972 (27,569) -- (9,569) 790 -- --
Grifols Portugal Productos Farmacéuticos e
Hosp italares, Lda. Portugal Commercial 0.010 99.990 100.000 512 9,825 6 -- 773 11,116 6 --
Grifols, s.r.o. Czech Rep ublic Commercial 100.000 -- 100.000 52 9,415 475 -- 3,444 13,386 52 --
Grifols USA, LLC United States Commercial -- 100.000 100.000 562 234,099 1,881 -- 100,491 337,033 -- --
Grifols UK, Ltd. United Kingdom Commercial 100.000 -- 100.000 4 10,305 (320) -- 363 10,352 21,546 --
Grifols Italia, S.p.A. Italy Commercial 100.000 -- 100.000 2,496 9,760 13 -- 3,506 15,775 5,329 --
Grifols Brasil, Lda. Brazil Commercial 99.9996 0.0001 100.000 65,264 (20,440) (11,807) -- 12,912 45,929 31,605 --
Grifols France, S.A.R.L. France Commercial 99.990 0.010 100.000 658 6,114 -- -- 2,118 8,890 658 --
Biomat USA, Inc. United States Industrial -- 76.210 76.210 -- 812,887 63,761 -- 41,568 918,216 -- --
% ownership Thousand Euros |
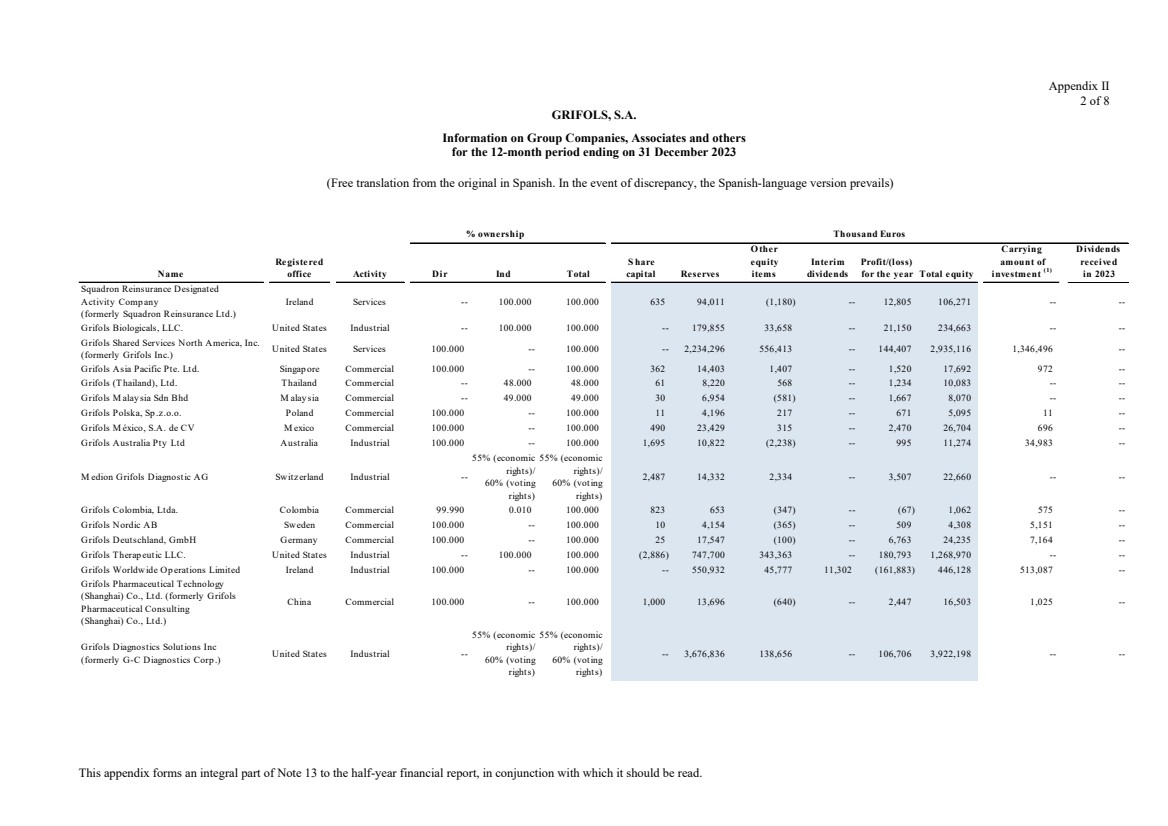
| This appendix forms an integral part of Note 13 to the half-year financial report, in conjunction with which it should be read.
Appendix II
2 of 8
GRIFOLS, S.A.
Information on Group Companies, Associates and others
for the 12-month period ending on 31 December 2023
(Free translation from the original in Spanish. In the event of discrepancy, the Spanish-language version prevails)
Other Carrying Dividends
Registered S hare equity Interim Profit/(loss) amount of received
Name office Activity Dir Ind Total capital Reserves items dividends for the year Total equity investment (1) in 2023
Squadron Reinsurance Designated
Activity Comp any
(formerly Squadron Reinsurance Ltd.)
Ireland Services -- 100.000 100.000 635 94,011 (1,180) -- 12,805 106,271 -- --
Grifols Biologicals, LLC. United States Industrial -- 100.000 100.000 -- 179,855 33,658 -- 21,150 234,663 -- --
Grifols Shared Services North America, Inc.
(formerly Grifols Inc.) United States Services 100.000 -- 100.000 -- 2,234,296 556,413 -- 144,407 2,935,116 1,346,496 --
Grifols Asia Pacific Pte. Ltd. Singap ore Commercial 100.000 -- 100.000 362 14,403 1,407 -- 1,520 17,692 972 --
Grifols (Thailand), Ltd. Thailand Commercial -- 48.000 48.000 61 8,220 568 -- 1,234 10,083 -- --
Grifols M alay sia Sdn Bhd M alay sia Commercial -- 49.000 49.000 30 6,954 (581) -- 1,667 8,070 -- --
Grifols Polska, Sp .z.o.o. Poland Commercial 100.000 -- 100.000 11 4,196 217 -- 671 5,095 11 --
Grifols M éxico, S.A. de CV M exico Commercial 100.000 -- 100.000 490 23,429 315 -- 2,470 26,704 696 --
Grifols Australia Pty Ltd Australia Industrial 100.000 -- 100.000 1,695 10,822 (2,238) -- 995 11,274 34,983 --
M edion Grifols Diagnostic AG Switzerland Industrial --
55% (economic
rights)/
60% (voting
rights)
55% (economic
rights)/
60% (voting
rights)
2,487 14,332 2,334 -- 3,507 22,660 -- --
Grifols Colombia, Ltda. Colombia Commercial 99.990 0.010 100.000 823 653 (347) -- (67) 1,062 575 --
Grifols Nordic AB Sweden Commercial 100.000 -- 100.000 10 4,154 (365) -- 509 4,308 5,151 --
Grifols Deutschland, GmbH Germany Commercial 100.000 -- 100.000 25 17,547 (100) -- 6,763 24,235 7,164 --
Grifols Therap eutic LLC. United States Industrial -- 100.000 100.000 (2,886) 747,700 343,363 -- 180,793 1,268,970 -- --
Grifols Worldwide Op erations Limited Ireland Industrial 100.000 -- 100.000 -- 550,932 45,777 11,302 (161,883) 446,128 513,087 --
Grifols Pharmaceutical Technology
(Shanghai) Co., Ltd. (formerly Grifols
Pharmaceutical Consulting
(Shanghai) Co., Ltd.)
China Commercial 100.000 -- 100.000 1,000 13,696 (640) -- 2,447 16,503 1,025 --
Grifols Diagnostics Solutions Inc
(formerly G-C Diagnostics Corp .) United States Industrial --
55% (economic
rights)/
60% (voting
rights)
55% (economic
rights)/
60% (voting
rights)
-- 3,676,836 138,656 -- 106,706 3,922,198 -- --
% ownership Thousand Euros |

| This appendix forms an integral part of Note 13 to the half-year financial report, in conjunction with which it should be read.
Appendix II
3 of 8
GRIFOLS, S.A.
Information on Group Companies, Associates and others
for the 12-month period ending on 31 December 2023
(Free translation from the original in Spanish. In the event of discrepancy, the Spanish-language version prevails)
Other Carrying Dividends
Registered S hare equity Interim Profit/(loss) amount of received
Name office Activity Dir Ind Total capital Reserves items dividends for the year Total equity investment (1) in 2023
Grifols (H.K.), Limited Hong Kong Commercial --
55% (economic
rights)/
60% (voting
rights)
55% (economic
rights)/
60% (voting
rights)
37,899 44,467 8,564 -- 6,062 96,992 -- --
Grifols Jap an K.K. Jap an Commercial 100.000 -- 100.000 354 3,456 (517) -- 376 3,669 713 --
Grifols Pharmaceutical Technology Co.,
Ltd. Beijing Branch China Commercial -- 100.000 100.000 -- (10,012) 451 -- (1,450) (11,011) -- --
Grifols India Healthcare Private Ltd. India Commercial 99.984 0.016 100.000 2 2,268 (286) -- 163 2,147 603 --
Grifols Canada, Ltd. Canada Industrial 100.000 -- 100.000 -- 7,404 (917) (604) 2,991 8,874 2,263 --
Grifols Diagnostics Equip ment Taiwan Ltd. Taiwan Commercial 100.000 -- 100.000 181 1,513 37 -- 183 1,914 185 --
Grifols Innovation and New
Technologies Ltd. Ireland Research -- 100.000 100.000 -- 281,223 11,822 -- (41,023) 252,022 -- --
AlbaJuna Therap eutics, S.L Sp ain Research -- 100.000 100.000 10 (1,804) -- -- (30) (1,824) -- --
Grifols Bio Sup p lies Inc.
(formerly Interstate Blood Bank, Inc.) United States Industrial -- 100.000 100.000 103 (84,819) 1,784 -- (10,344) (93,276) -- --
Aigües M inerals Vilajuïga, S.A. Sp ain Industrial 99.990 0.010 100.000 75 2,706 -- -- (1,352) 1,429 1,457 --
GigaGen Inc. United States Industrial -- 100.000 100.000 1 (22,986) 2,498 -- (22,023) (42,510) -- --
Plasmavita Healthcare GmbH Germany Industrial -- 50.000 50.000 25 5,498 20,000 -- 7,927 33,450 -- --
M ecwins, S.A. Sp ain Industrial -- 24.990 24.990 141 6,520 201 - (718) 6,144 -- --
M edcom, S.A. Sp ain Research -- 45.000 45.000 -- -- -- -- -- -- -- --
Plasmavita Healthcare II GmbH Austria Industrial -- 50.000 50.000 35 (746) 6,500 -- 382 6,171 -- --
Shanghai RAAS Blood Products Co. Ltd. China Corp orate 26.200 -- 26.200 844,139 2,237,996 415,354 -- 228,049 3,725,539 447,262 6,891
Grifols Korea Co., Ltd South Korea Commercial 100.000 -- 100.000 75 1,656 (78) -- 576 2,229 73 --
Grifols Canada Therap eutics Inc. (formerly
Green Cross Biotherap eutics, Inc) Canada Industrial 0.020 99.980 100.000 (983) 379,989 23,117 -- (5,160) 396,963 19,731 --
Grifols Laboratory Solutions Inc. United States Commercial -- 100.000 100.000 -- (2,787) 32 -- (3,113) (5,868) -- --
Grifols M iddle East & Africa LLC Egy p t Services 99.990 0.010 100.000 684 (984) 244 -- (467) (523) -- --
Biomat Newco, Corp . United States Industrial -- 100.000 100.000 -- 6,878 29,758 -- (32,830) 3,806 -- --
Biomat Holdco, LLC. United States Services -- 100.000 100.000 -- 62,189 10,408 -- -- 72,597 -- --
Grifols Bio North America, LLC. United States Industrial -- 100.000 100.000 -- 4,079 (312) -- 4,694 8,461 -- --
Grifols Py renees Research Center, S.L. Andorra Industrial -- 80.000 80.000 4 163 -- -- (54) 113 -- --
% ownership Thousand Euros |
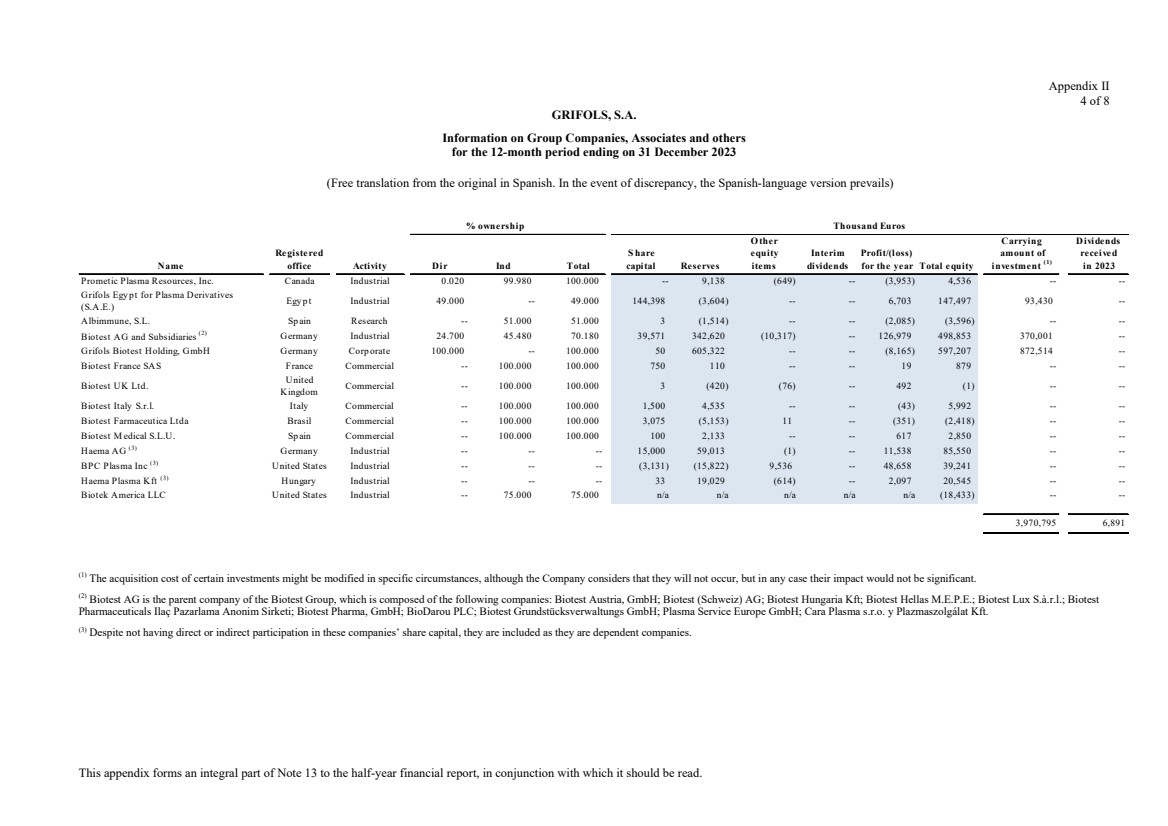
| This appendix forms an integral part of Note 13 to the half-year financial report, in conjunction with which it should be read.
Appendix II
4 of 8
GRIFOLS, S.A.
Information on Group Companies, Associates and others
for the 12-month period ending on 31 December 2023
(Free translation from the original in Spanish. In the event of discrepancy, the Spanish-language version prevails)
Other Carrying Dividends
Registered S hare equity Interim Profit/(loss) amount of received
Name office Activity Dir Ind Total capital Reserves items dividends for the year Total equity investment (1) in 2023
Prometic Plasma Resources, Inc. Canada Industrial 0.020 99.980 100.000 -- 9,138 (649) -- (3,953) 4,536 -- --
Grifols Egy p t for Plasma Derivatives
(S.A.E.) Egy p t Industrial 49.000 -- 49.000 144,398 (3,604) -- -- 6,703 147,497 93,430 --
Albimmune, S.L. Sp ain Research -- 51.000 51.000 3 (1,514) -- -- (2,085) (3,596) -- --
Biotest AG and Subsidiaries (2) Germany Industrial 24.700 45.480 70.180 39,571 342,620 (10,317) -- 126,979 498,853 370,001 --
Grifols Biotest Holding, GmbH Germany Corp orate 100.000 -- 100.000 50 605,322 -- -- (8,165) 597,207 872,514 --
Biotest France SAS France Commercial -- 100.000 100.000 750 110 -- -- 19 879 -- --
Biotest UK Ltd. United Kingdom Commercial -- 100.000 100.000 3 (420) (76) -- 492 (1) -- --
Biotest Italy S.r.l. Italy Commercial -- 100.000 100.000 1,500 4,535 -- -- (43) 5,992 -- --
Biotest Farmaceutica Ltda Brasil Commercial -- 100.000 100.000 3,075 (5,153) 11 -- (351) (2,418) -- --
Biotest M edical S.L.U. Sp ain Commercial -- 100.000 100.000 100 2,133 -- -- 617 2,850 -- --
Haema AG (3) Germany Industrial -- -- -- 15,000 59,013 (1) -- 11,538 85,550 -- --
BPC Plasma Inc (3) United States Industrial -- -- -- (3,131) (15,822) 9,536 -- 48,658 39,241 -- --
Haema Plasma Kft (3) Hungary Industrial -- -- -- 33 19,029 (614) -- 2,097 20,545 -- --
Biotek America LLC United States Industrial -- 75.000 75.000 n/a n/a n/a n/a n/a (18,433) -- --
3,970,795 6,891
% ownership Thousand Euros
(1) The acquisition cost of certain investments might be modified in specific circumstances, although the Company considers that they will not occur, but in any case their impact would not be significant.
(2) Biotest AG is the parent company of the Biotest Group, which is composed of the following companies: Biotest Austria, GmbH; Biotest (Schweiz) AG; Biotest Hungaria Kft; Biotest Hellas M.E.P.E.; Biotest Lux S.à.r.l.; Biotest
Pharmaceuticals Ilaç Pazarlama Anonim Sirketi; Biotest Pharma, GmbH; BioDarou PLC; Biotest Grundstücksverwaltungs GmbH; Plasma Service Europe GmbH; Cara Plasma s.r.o. y Plazmaszolgálat Kft.
(3) Despite not having direct or indirect participation in these companies’ share capital, they are included as they are dependent companies. |
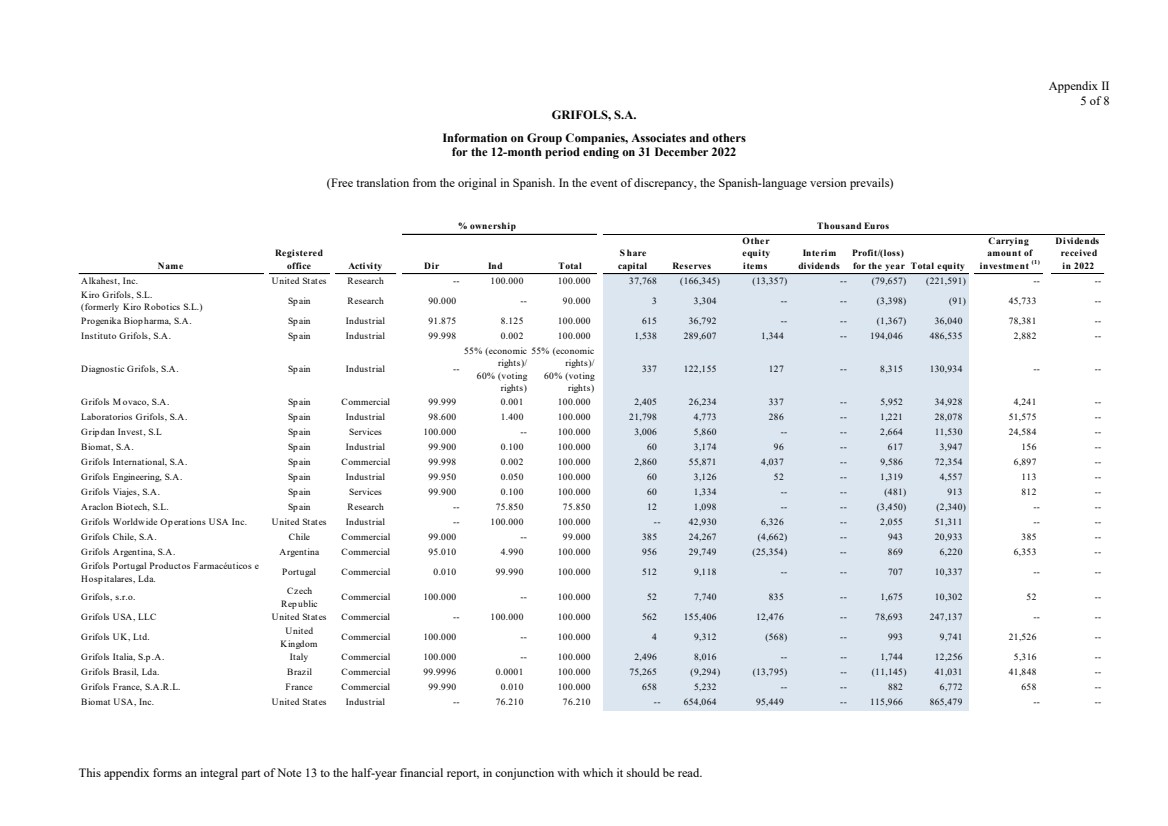
| This appendix forms an integral part of Note 13 to the half-year financial report, in conjunction with which it should be read.
Appendix II
5 of 8
GRIFOLS, S.A.
Information on Group Companies, Associates and others
for the 12-month period ending on 31 December 2022
(Free translation from the original in Spanish. In the event of discrepancy, the Spanish-language version prevails)
Other Carrying Dividends
Registered S hare equity Interim Profit/(loss) amount of received
Name office Activity Dir Ind Total capital Reserves items dividends for the year Total equity investment (1) in 2022
Alkahest, Inc. United States Research -- 100.000 100.000 37,768 (166,345) (13,357) -- (79,657) (221,591) -- --
Kiro Grifols, S.L.
(formerly Kiro Robotics S.L.) Sp ain Research 90.000 -- 90.000 3 3,304 -- -- (3,398) (91) 45,733 --
Progenika Biop harma, S.A. Sp ain Industrial 91.875 8.125 100.000 615 36,792 -- -- (1,367) 36,040 78,381 --
Instituto Grifols, S.A. Sp ain Industrial 99.998 0.002 100.000 1,538 289,607 1,344 -- 194,046 486,535 2,882 --
Diagnostic Grifols, S.A. Sp ain Industrial --
55% (economic
rights)/
60% (voting
rights)
55% (economic
rights)/
60% (voting
rights)
337 122,155 127 -- 8,315 130,934 -- --
Grifols M ovaco, S.A. Sp ain Commercial 99.999 0.001 100.000 2,405 26,234 337 -- 5,952 34,928 4,241 --
Laboratorios Grifols, S.A. Sp ain Industrial 98.600 1.400 100.000 21,798 4,773 286 -- 1,221 28,078 51,575 --
Grip dan Invest, S.L Sp ain Services 100.000 -- 100.000 3,006 5,860 -- -- 2,664 11,530 24,584 --
Biomat, S.A. Sp ain Industrial 99.900 0.100 100.000 60 3,174 96 -- 617 3,947 156 --
Grifols International, S.A. Sp ain Commercial 99.998 0.002 100.000 2,860 55,871 4,037 -- 9,586 72,354 6,897 --
Grifols Engineering, S.A. Sp ain Industrial 99.950 0.050 100.000 60 3,126 52 -- 1,319 4,557 113 --
Grifols Viajes, S.A. Sp ain Services 99.900 0.100 100.000 60 1,334 -- -- (481) 913 812 --
Araclon Biotech, S.L. Sp ain Research -- 75.850 75.850 12 1,098 -- -- (3,450) (2,340) -- --
Grifols Worldwide Op erations USA Inc. United States Industrial -- 100.000 100.000 -- 42,930 6,326 -- 2,055 51,311 -- --
Grifols Chile, S.A. Chile Commercial 99.000 -- 99.000 385 24,267 (4,662) -- 943 20,933 385 --
Grifols Argentina, S.A. Argentina Commercial 95.010 4.990 100.000 956 29,749 (25,354) -- 869 6,220 6,353 --
Grifols Portugal Productos Farmacéuticos e
Hosp italares, Lda. Portugal Commercial 0.010 99.990 100.000 512 9,118 -- -- 707 10,337 -- --
Grifols, s.r.o. Czech Rep ublic Commercial 100.000 -- 100.000 52 7,740 835 -- 1,675 10,302 52 --
Grifols USA, LLC United States Commercial -- 100.000 100.000 562 155,406 12,476 -- 78,693 247,137 -- --
Grifols UK, Ltd. United Kingdom Commercial 100.000 -- 100.000 4 9,312 (568) -- 993 9,741 21,526 --
Grifols Italia, S.p .A. Italy Commercial 100.000 -- 100.000 2,496 8,016 -- -- 1,744 12,256 5,316 --
Grifols Brasil, Lda. Brazil Commercial 99.9996 0.0001 100.000 75,265 (9,294) (13,795) -- (11,145) 41,031 41,848 --
Grifols France, S.A.R.L. France Commercial 99.990 0.010 100.000 658 5,232 -- -- 882 6,772 658 --
Biomat USA, Inc. United States Industrial -- 76.210 76.210 -- 654,064 95,449 -- 115,966 865,479 -- --
% ownership Thousand Euros |
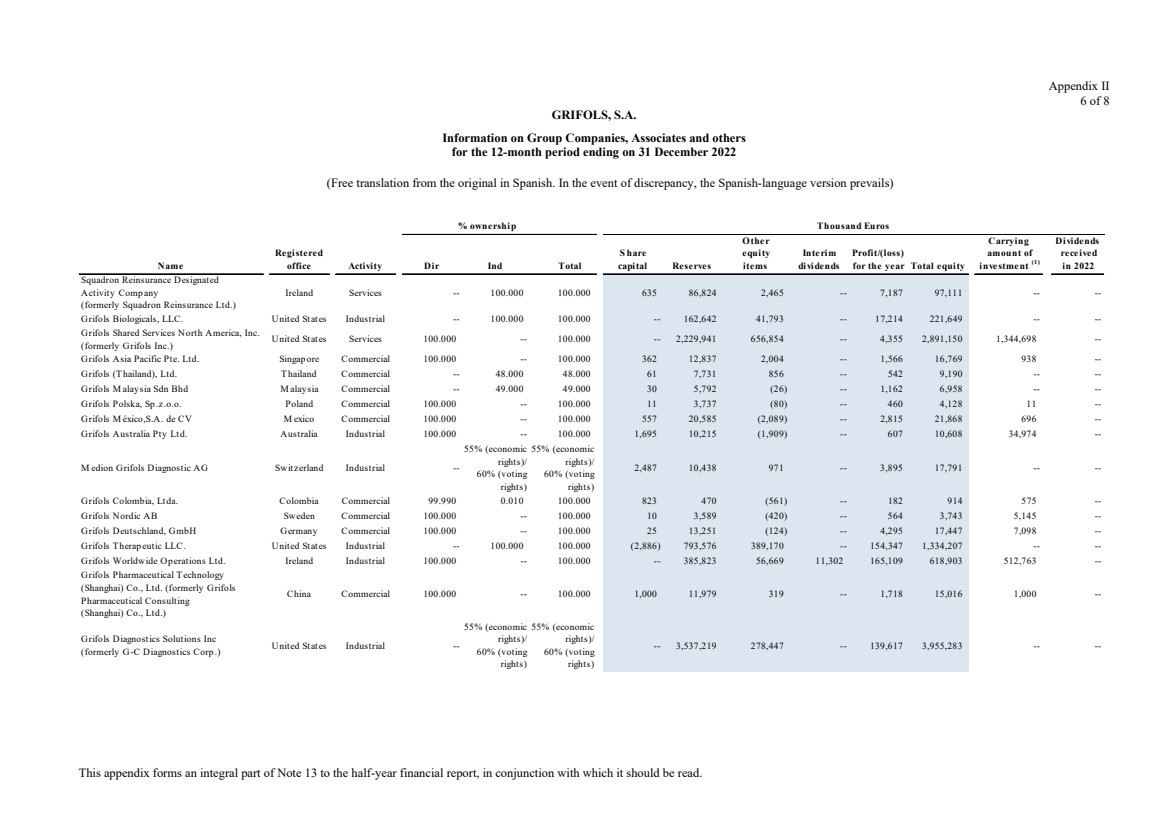
| This appendix forms an integral part of Note 13 to the half-year financial report, in conjunction with which it should be read.
Appendix II
6 of 8
GRIFOLS, S.A.
Information on Group Companies, Associates and others
for the 12-month period ending on 31 December 2022
(Free translation from the original in Spanish. In the event of discrepancy, the Spanish-language version prevails)
Other Carrying Dividends
Registered S hare equity Interim Profit/(loss) amount of received
Name office Activity Dir Ind Total capital Reserves items dividends for the year Total equity investment (1) in 2022
Squadron Reinsurance Designated
Activity Company
(formerly Squadron Reinsurance Ltd.)
Ireland Services -- 100.000 100.000 635 86,824 2,465 -- 7,187 97,111 -- --
Grifols Biologicals, LLC. United States Industrial -- 100.000 100.000 -- 162,642 41,793 -- 17,214 221,649 -- --
Grifols Shared Services North America, Inc.
(formerly Grifols Inc.) United States Services 100.000 -- 100.000 -- 2,229,941 656,854 -- 4,355 2,891,150 1,344,698 --
Grifols Asia Pacific Pte. Ltd. Singap ore Commercial 100.000 -- 100.000 362 12,837 2,004 -- 1,566 16,769 938 --
Grifols (Thailand), Ltd. Thailand Commercial -- 48.000 48.000 61 7,731 856 -- 542 9,190 -- --
Grifols M alaysia Sdn Bhd M alaysia Commercial -- 49.000 49.000 30 5,792 (26) -- 1,162 6,958 -- --
Grifols Polska, Sp.z.o.o. Poland Commercial 100.000 -- 100.000 11 3,737 (80) -- 460 4,128 11 --
Grifols M éxico,S.A. de CV M exico Commercial 100.000 -- 100.000 557 20,585 (2,089) -- 2,815 21,868 696 --
Grifols Australia Pty Ltd. Australia Industrial 100.000 -- 100.000 1,695 10,215 (1,909) -- 607 10,608 34,974 --
M edion Grifols Diagnostic AG Switzerland Industrial --
55% (economic
rights)/
60% (voting
rights)
55% (economic
rights)/
60% (voting
rights)
2,487 10,438 971 -- 3,895 17,791 -- --
Grifols Colombia, Ltda. Colombia Commercial 99.990 0.010 100.000 823 470 (561) -- 182 914 575 --
Grifols Nordic AB Sweden Commercial 100.000 -- 100.000 10 3,589 (420) -- 564 3,743 5,145 --
Grifols Deutschland, GmbH Germany Commercial 100.000 -- 100.000 25 13,251 (124) -- 4,295 17,447 7,098 --
Grifols Therap eutic LLC. United States Industrial -- 100.000 100.000 (2,886) 793,576 389,170 -- 154,347 1,334,207 -- --
Grifols Worldwide Operations Ltd. Ireland Industrial 100.000 -- 100.000 -- 385,823 56,669 11,302 165,109 618,903 512,763 --
Grifols Pharmaceutical Technology
(Shanghai) Co., Ltd. (formerly Grifols
Pharmaceutical Consulting
(Shanghai) Co., Ltd.)
China Commercial 100.000 -- 100.000 1,000 11,979 319 -- 1,718 15,016 1,000 --
Grifols Diagnostics Solutions Inc
(formerly G-C Diagnostics Corp .) United States Industrial --
55% (economic
rights)/
60% (voting
rights)
55% (economic
rights)/
60% (voting
rights)
-- 3,537,219 278,447 -- 139,617 3,955,283 -- --
% ownership Thousand Euros |
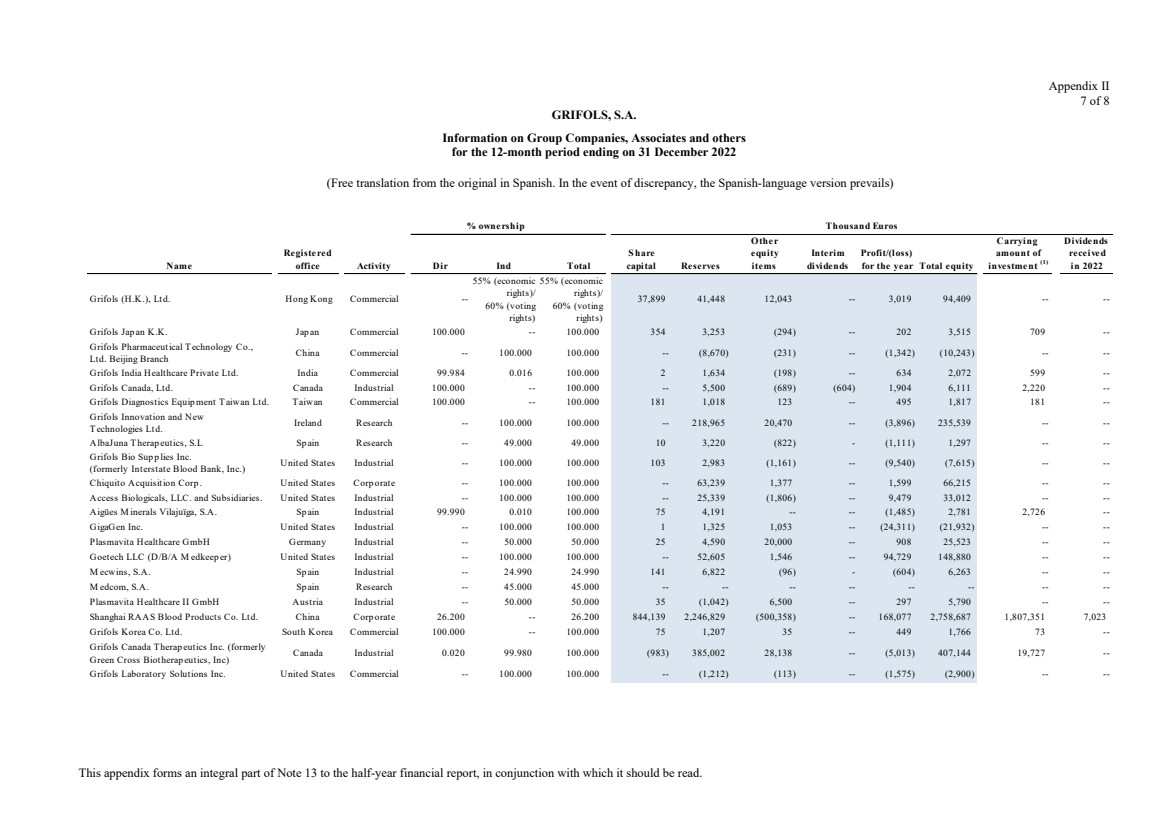
| This appendix forms an integral part of Note 13 to the half-year financial report, in conjunction with which it should be read.
Appendix II
7 of 8
GRIFOLS, S.A.
Information on Group Companies, Associates and others
for the 12-month period ending on 31 December 2022
(Free translation from the original in Spanish. In the event of discrepancy, the Spanish-language version prevails)
Other Carrying Dividends
Registered S hare equity Interim Profit/(loss) amount of received
Name office Activity Dir Ind Total capital Reserves items dividends for the year Total equity investment (1) in 2022
Grifols (H.K.), Ltd. Hong Kong Commercial --
55% (economic
rights)/
60% (voting
rights)
55% (economic
rights)/
60% (voting
rights)
37,899 41,448 12,043 -- 3,019 94,409 -- --
Grifols Jap an K.K. Jap an Commercial 100.000 -- 100.000 354 3,253 (294) -- 202 3,515 709 --
Grifols Pharmaceutical Technology Co.,
Ltd. Beijing Branch China Commercial -- 100.000 100.000 -- (8,670) (231) -- (1,342) (10,243) -- --
Grifols India Healthcare Private Ltd. India Commercial 99.984 0.016 100.000 2 1,634 (198) -- 634 2,072 599 --
Grifols Canada, Ltd. Canada Industrial 100.000 -- 100.000 -- 5,500 (689) (604) 1,904 6,111 2,220 --
Grifols Diagnostics Equip ment Taiwan Ltd. Taiwan Commercial 100.000 -- 100.000 181 1,018 123 -- 495 1,817 181 --
Grifols Innovation and New
Technologies Ltd. Ireland Research -- 100.000 100.000 -- 218,965 20,470 -- (3,896) 235,539 -- --
AlbaJuna Therap eutics, S.L Sp ain Research -- 49.000 49.000 10 3,220 (822) - (1,111) 1,297 -- --
Grifols Bio Sup p lies Inc.
(formerly Interstate Blood Bank, Inc.) United States Industrial -- 100.000 100.000 103 2,983 (1,161) -- (9,540) (7,615) -- --
Chiquito Acquisition Corp . United States Corp orate -- 100.000 100.000 -- 63,239 1,377 -- 1,599 66,215 -- --
Access Biologicals, LLC. and Subsidiaries. United States Industrial -- 100.000 100.000 -- 25,339 (1,806) -- 9,479 33,012 -- --
Aigües M inerals Vilajuïga, S.A. Sp ain Industrial 99.990 0.010 100.000 75 4,191 -- -- (1,485) 2,781 2,726 --
GigaGen Inc. United States Industrial -- 100.000 100.000 1 1,325 1,053 -- (24,311) (21,932) -- --
Plasmavita Healthcare GmbH Germany Industrial -- 50.000 50.000 25 4,590 20,000 -- 908 25,523 -- --
Goetech LLC (D/B/A M edkeep er) United States Industrial -- 100.000 100.000 -- 52,605 1,546 -- 94,729 148,880 -- --
M ecwins, S.A. Sp ain Industrial -- 24.990 24.990 141 6,822 (96) - (604) 6,263 -- --
M edcom, S.A. Sp ain Research -- 45.000 45.000 -- -- -- -- -- -- -- --
Plasmavita Healthcare II GmbH Austria Industrial -- 50.000 50.000 35 (1,042) 6,500 -- 297 5,790 -- --
Shanghai RAAS Blood Products Co. Ltd. China Corp orate 26.200 -- 26.200 844,139 2,246,829 (500,358) -- 168,077 2,758,687 1,807,351 7,023
Grifols Korea Co. Ltd. South Korea Commercial 100.000 -- 100.000 75 1,207 35 -- 449 1,766 73 --
Grifols Canada Therap eutics Inc. (formerly
Green Cross Biotherap eutics, Inc) Canada Industrial 0.020 99.980 100.000 (983) 385,002 28,138 -- (5,013) 407,144 19,727 --
Grifols Laboratory Solutions Inc. United States Commercial -- 100.000 100.000 -- (1,212) (113) -- (1,575) (2,900) -- --
% ownership Thousand Euros |

| This appendix forms an integral part of Note 13 to the half-year financial report, in conjunction with which it should be read.
Appendix II
8 of 8
GRIFOLS, S.A.
Information on Group Companies, Associates and others
for the 12-month period ending on 31 December 2022
(Free translation from the original in Spanish. In the event of discrepancy, the Spanish-language version prevails)
Other Carrying Dividends
Registered S hare equity Interim Profit/(loss) amount of received
Name office Activity Dir Ind Total capital Reserves items dividends for the year Total equity investment (1) in 2022
Grifols M iddle East & Africa LLC Egy p t Services 99.990 0.010 100.000 684 (142) 211 -- (842) (89) 50 --
Biomat Newco, Corp . United States Industrial -- 87.100 87.100 -- 45,673 29,845 -- (38,795) 36,723 -- --
Biomat Holdco, LLC. United States Services -- 100.000 100.000 -- 62,189 12,599 -- -- 74,788 -- --
Grifols Bio North America, LLC. United States Industrial -- 100.000 100.000 -- 338 (60) -- 3,742 4,020 -- --
Grifols Escrow Issuer, S.A. Sp ain Services 100.000 -- 100.000 60 29,603 -- -- (24,613) 5,050 2,667 --
Grifols Py renees Research Center, S.L. Andorra Industrial -- 80.000 80.000 3 -- -- -- (37) (34) -- --
Prometic Plasma Resources, Inc. Canada Industrial 0.020 99.980 100.000 -- 5,204 (537) -- 3,933 8,600 -- --
Grifols Egy p t for Plasma Derivatives
(S.A.E.) Egy p t Industrial 49.000 -- 49.000 102,596 (3,604) -- -- 445 99,437 46,454 --
Albimmune, S.L. Sp ain Research -- 51.000 51.000 3 -- -- -- (1,514) (1,511) -- --
Biotest AG and Subsidiaries (2) Germany Industrial 24.700 45.480 70.180 39,571 359,238 (9,783) -- (16,036) 372,990 370,001 --
Grifols Biotest Holding, GmbH Germany Corp orate 100.000 -- 100.000 50 610,884 -- -- (5,562) 605,372 872,514 --
Haema AG (3) Germany Industrial -- -- -- 15,000 53,041 (1) -- 5,972 74,012 -- --
BPC Plasma Inc (3) United States Industrial -- -- -- (3,131) 201,545 13,937 -- 49,028 261,379 -- --
Haema Plasma Kft (3) Hungary Industrial -- -- -- 33 17,047 (1,473) -- 1,982 17,589 -- --
Biotek America LLC United States Industrial -- 75.000 75.000 n/a n/a n/a n/a n/a (27,100) -- --
5,324,682 7,023
% ownership Thousand Euros
(1) The acquisition cost of certain investments might be modified in specific circumstances, although the Company considers that they will not occur, but in any case their impact would not be significant.
(2) Biotest AG is the parent company of the Biotest Group, which is composed of the following companies: Biotest Austria, GmbH; Biotest Italia, S.R.L.; Biotest (UK) Ltd.; Biotest (Schweiz) AG; Biotest Hungaria Kft; Biotest
Farmacêutica LTDA; Biotest Hellas M.E.P.E.; Biotest France SAS; Biotest Pharmaceuticals Ilaç Pazarlama Anonim Sirketi; Biotest Medical, S.L.U.; Biotest Pharma, GmbH; BioDarou PLC; Biotest Grundstücksverwaltungs GmbH;
Plasma Service Europe GmbH; Cara Plasma s.r.o. y Plazmaszolgálat Kft.
(3) Despite not having direct or indirect participation in these companies’ share capital, they are included as they are dependent companies. |
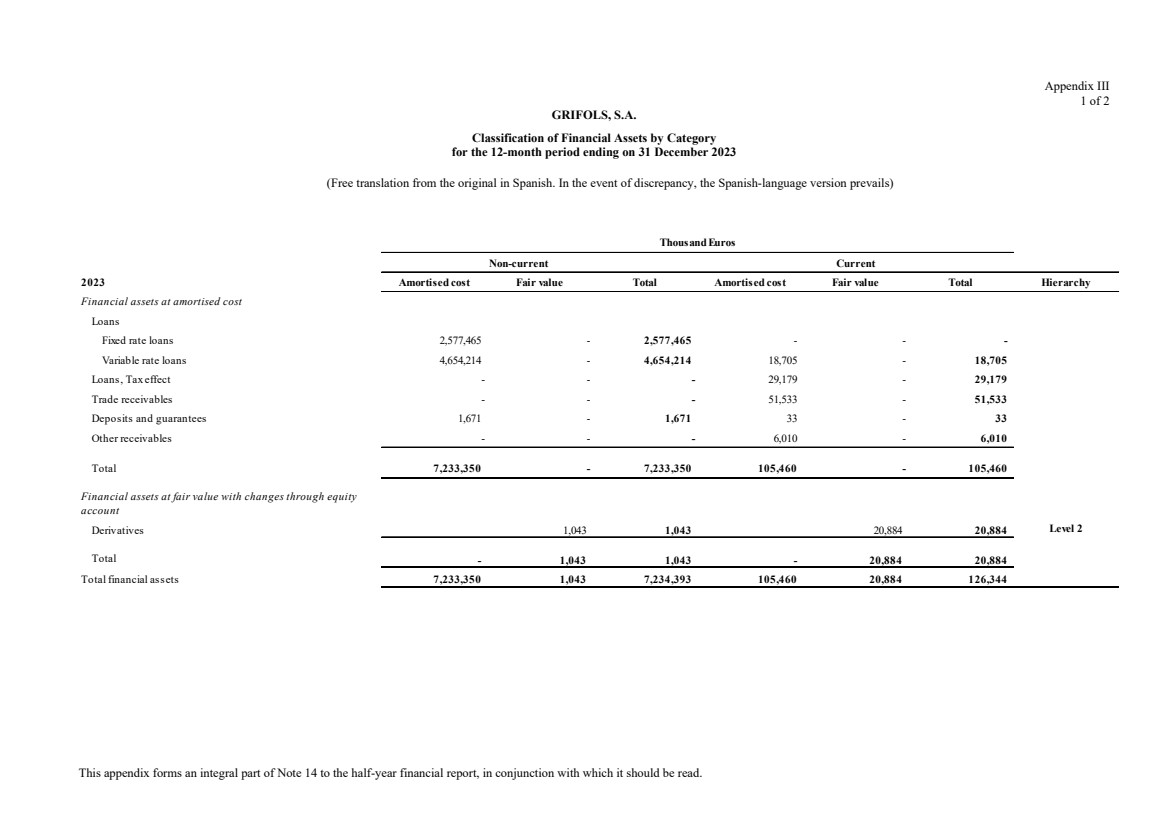
| This appendix forms an integral part of Note 14 to the half-year financial report, in conjunction with which it should be read.
Appendix III
1 of 2
GRIFOLS, S.A.
Classification of Financial Assets by Category
for the 12-month period ending on 31 December 2023
(Free translation from the original in Spanish. In the event of discrepancy, the Spanish-language version prevails)
Non-current Current
2023 Amortised cost Fair value Total Amortised cost Fair value Total Hierarchy
Financial assets at amortised cost
Loans
Fixed rate loans 2,577,465 - 2,577,465 - - -
Variable rate loans 4,654,214 - 4,654,214 18,705 - 18,705
Loans, Tax effect - - - 29,179 - 29,179
Trade receivables - - - 51,533 - 51,533
Deposits and guarantees 1,671 - 1,671 33 - 33
Other receivables - - - 6,010 - 6,010
Total 7,233,350 - 7,233,350 105,460 - 105,460
Financial assets at fair value with changes through equity
account
Derivatives 1,043 1,043 20,884 20,884 Level 2
Total - 1,043 1,043 - 20,884 20,884
Total financial assets 7,233,350 1,043 7,234,393 105,460 20,884 126,344
Thousand Euros |
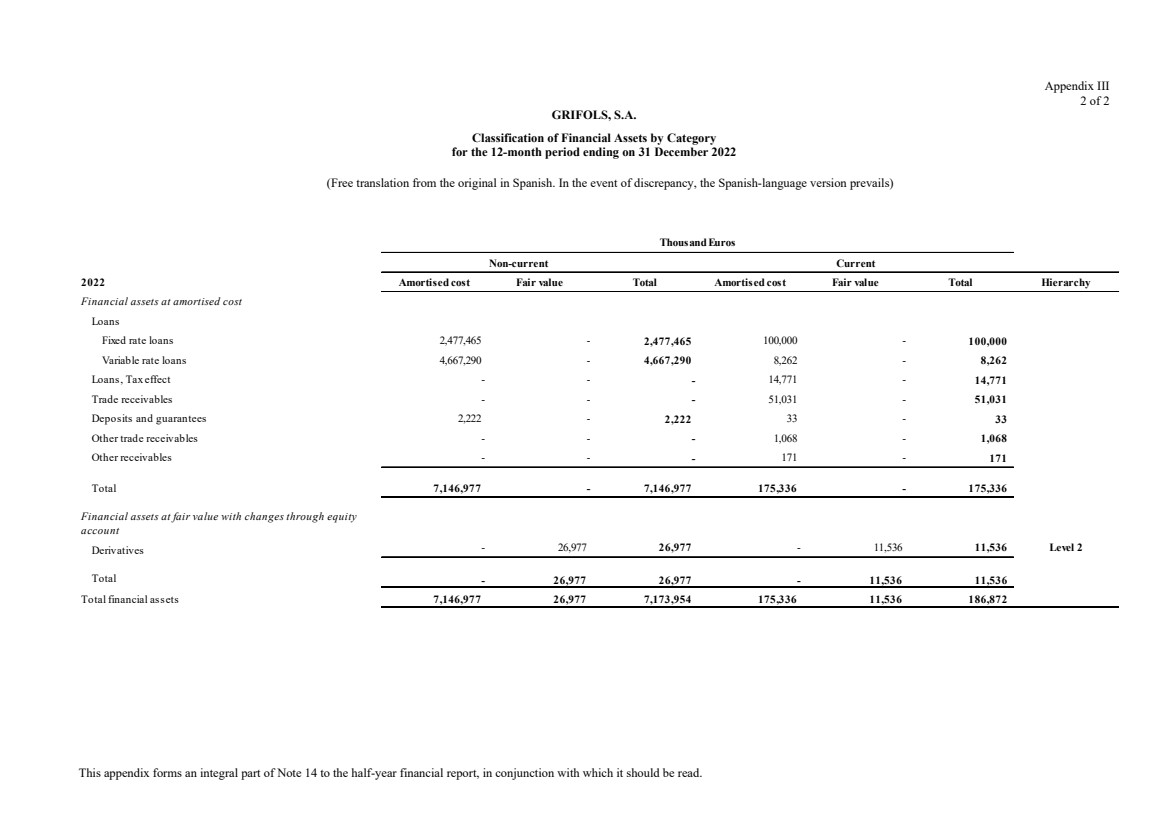
| This appendix forms an integral part of Note 14 to the half-year financial report, in conjunction with which it should be read.
Appendix III
2 of 2
GRIFOLS, S.A.
Classification of Financial Assets by Category
for the 12-month period ending on 31 December 2022
(Free translation from the original in Spanish. In the event of discrepancy, the Spanish-language version prevails)
Non-current Current
2022 Amortised cost Fair value Total Amortised cost Fair value Total Hierarchy
Financial assets at amortised cost
Loans
Fixed rate loans 2,477,465 - 2,477,465 100,000 - 100,000
Variable rate loans 4,667,290 - 4,667,290 8,262 - 8,262
Loans, Tax effect - - - 14,771 - 14,771
Trade receivables - - - 51,031 - 51,031
Deposits and guarantees 2,222 - 2,222 33 - 33
Other trade receivables - - - 1,068 - 1,068
Other receivables - - - 171 - 171
Total 7,146,977 - 7,146,977 175,336 - 175,336
Financial assets at fair value with changes through equity
account
Derivatives - 26,977 26,977 - 11,536 11,536 Level 2
Total - 26,977 26,977 - 11,536 11,536
Total financial assets 7,146,977 26,977 7,173,954 175,336 11,536 186,872
Thousand Euros |
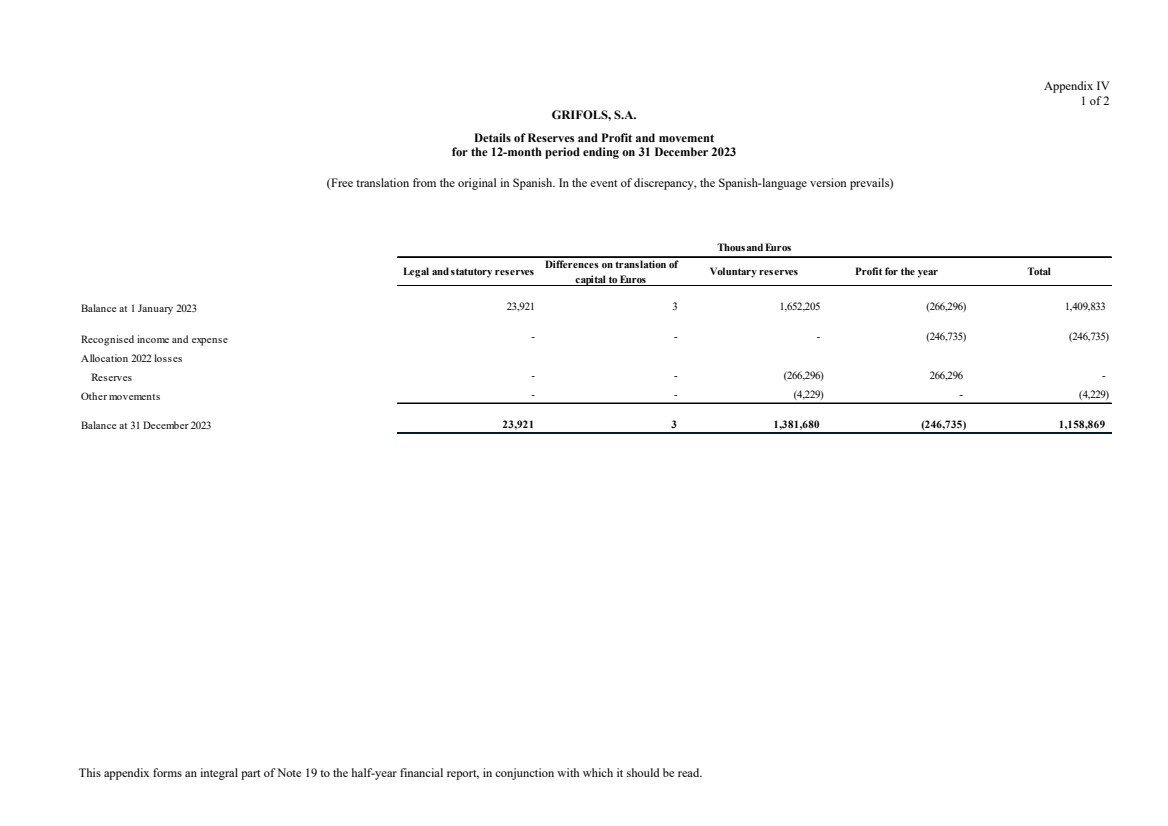
| This appendix forms an integral part of Note 19 to the half-year financial report, in conjunction with which it should be read.
Appendix IV
1 of 2
GRIFOLS, S.A.
Details of Reserves and Profit and movement
for the 12-month period ending on 31 December 2023
(Free translation from the original in Spanish. In the event of discrepancy, the Spanish-language version prevails)
Legal and statutory reserves Differences on translation of capital to Euros Voluntary reserves Profit for the year Total
Balance at 1 January 2023 23,921 3 1,652,205 (266,296) 1,409,833
Recognised income and expense - - - (246,735) (246,735)
Allocation 2022 losses
Reserves - - (266,296) 266,296 -
Other movements - - (4,229) - (4,229)
Balance at 31 December 2023 23,921 3 1,381,680 (246,735) 1,158,869
Thousand Euros |

| This appendix forms an integral part of Note 19 to the half-year financial report, in conjunction with which it should be read.
Appendix IV
2 of 2
GRIFOLS, S.A.
Details of Reserves and Profit and movement
for the 12-month period ending on 31 December 2022
(Free translation from the original in Spanish. In the event of discrepancy, the Spanish-language version prevails)
Legal and statutory reserves Differences on translation of capital to Euros Voluntary reserves Profit for the year Total
Balance at 1 January 2022 23,921 3 1,790,746 (140,728) 1,673,942
Recognised income and expense - - - (266,296) (266,296)
Allocation 2021 losses
Reserves - - (140,728) 140,728 -
Other movements - - 2,187 - 2,187
Balance at 31 December 2022 23,921 3 1,652,205 (266,296) 1,409,833
Thousand Euros |
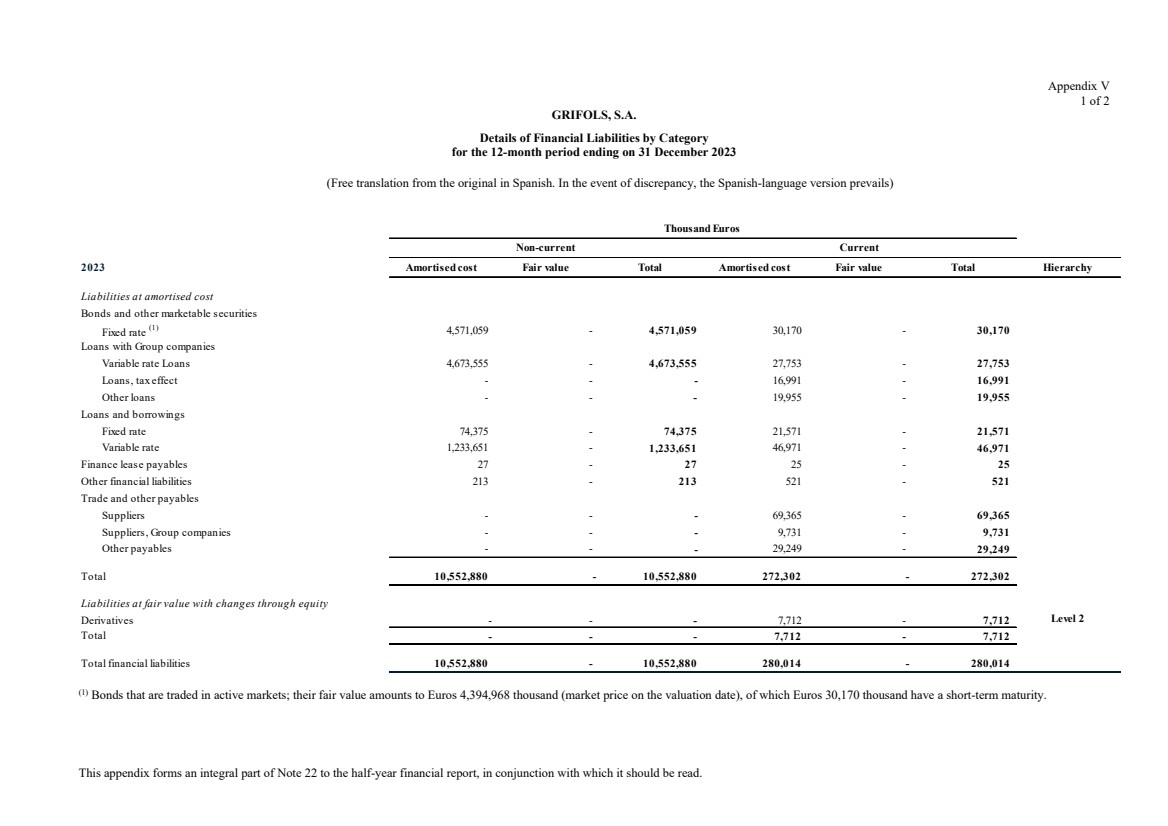
| This appendix forms an integral part of Note 22 to the half-year financial report, in conjunction with which it should be read.
Appendix V
1 of 2
GRIFOLS, S.A.
Details of Financial Liabilities by Category
for the 12-month period ending on 31 December 2023
(Free translation from the original in Spanish. In the event of discrepancy, the Spanish-language version prevails)
2023 Amortised cost Fair value Total Amortised cost Fair value Total Hierarchy
Liabilities at amortised cost
Bonds and other marketable securities
Fixed rate (1) 4,571,059 - 4,571,059 30,170 - 30,170
Loans with Group companies
Variable rate Loans 4,673,555 - 4,673,555 27,753 - 27,753
Loans, tax effect - - - 16,991 - 16,991
Other loans - - - 19,955 - 19,955
Loans and borrowings
Fixed rate 74,375 - 74,375 21,571 - 21,571
Variable rate 1,233,651 - 1,233,651 46,971 - 46,971
Finance lease payables 27 - 27 25 - 25
Other financial liabilities 213 - 213 521 - 521
Trade and other payables
Suppliers - - - 69,365 - 69,365
Suppliers, Group companies - - - 9,731 - 9,731
Other payables - - - 29,249 - 29,249
Total 10,552,880 - 10,552,880 272,302 - 272,302
Liabilities at fair value with changes through equity
Derivatives - - - 7,712 - 7,712 Level 2
Total - - - 7,712 - 7,712
Total financial liabilities 10,552,880 - 10,552,880 280,014 - 280,014
Thousand Euros
Non-current Current
(1) Bonds that are traded in active markets; their fair value amounts to Euros 4,394,968 thousand (market price on the valuation date), of which Euros 30,170 thousand have a short-term maturity. |
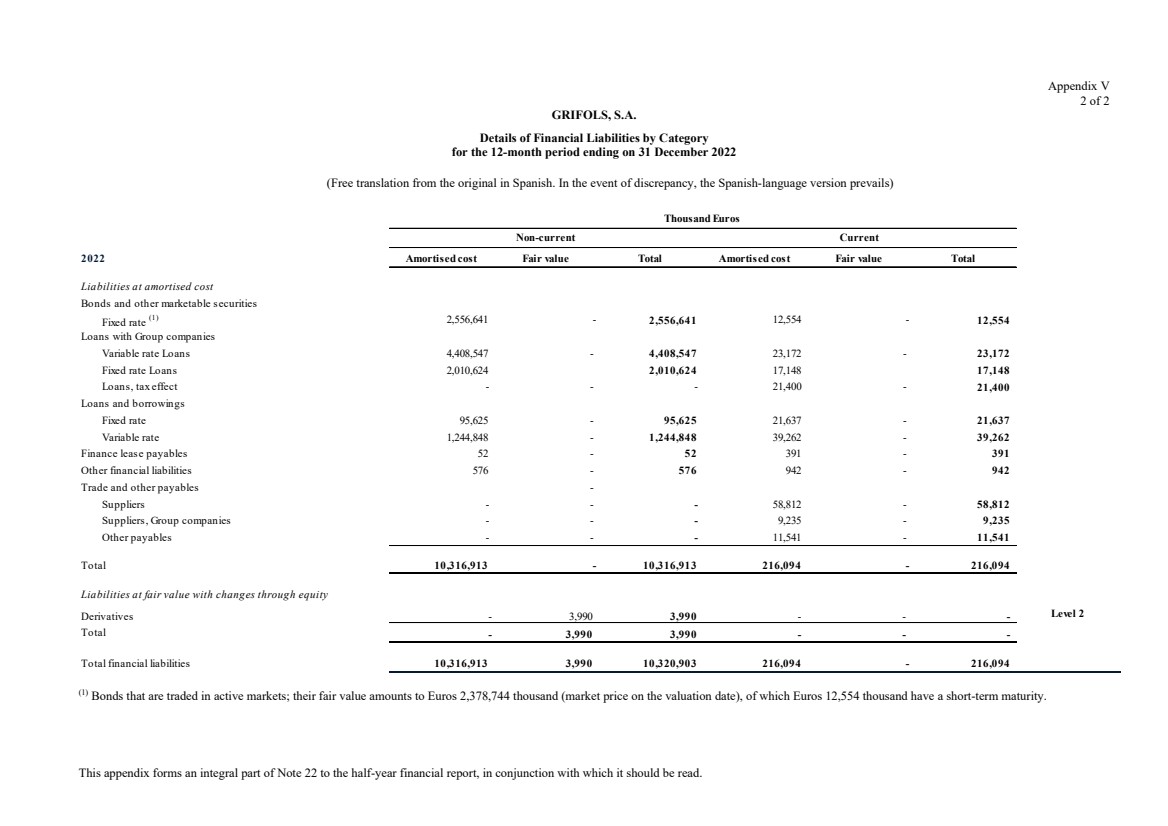
| This appendix forms an integral part of Note 22 to the half-year financial report, in conjunction with which it should be read.
Appendix V
2 of 2
GRIFOLS, S.A.
Details of Financial Liabilities by Category
for the 12-month period ending on 31 December 2022
(Free translation from the original in Spanish. In the event of discrepancy, the Spanish-language version prevails)
2022 Amortised cost Fair value Total Amortised cost Fair value Total
Liabilities at amortised cost
Bonds and other marketable securities
Fixed rate (1) 2,556,641 - 2,556,641 12,554 - 12,554
Loans with Group companies
Variable rate Loans 4,408,547 - 4,408,547 23,172 - 23,172
Fixed rate Loans 2,010,624 2,010,624 17,148 17,148
Loans, tax effect - - - 21,400 - 21,400
Loans and borrowings
Fixed rate 95,625 - 95,625 21,637 - 21,637
Variable rate 1,244,848 - 1,244,848 39,262 - 39,262
Finance lease payables 52 - 52 391 - 391
Other financial liabilities 576 - 576 942 - 942
Trade and other payables -
Suppliers - - - 58,812 - 58,812
Suppliers, Group companies - - - 9,235 - 9,235
Other payables - - - 11,541 - 11,541
Total 10,316,913 - 10,316,913 216,094 - 216,094
Liabilities at fair value with changes through equity
Derivatives - 3,990 3,990 - - - Level 2
Total - 3,990 3,990 - - -
Total financial liabilities 10,316,913 3,990 10,320,903 216,094 - 216,094
Thousand Euros
Non-current Current
(1) Bonds that are traded in active markets; their fair value amounts to Euros 2,378,744 thousand (market price on the valuation date), of which Euros 12,554 thousand have a short-term maturity. |
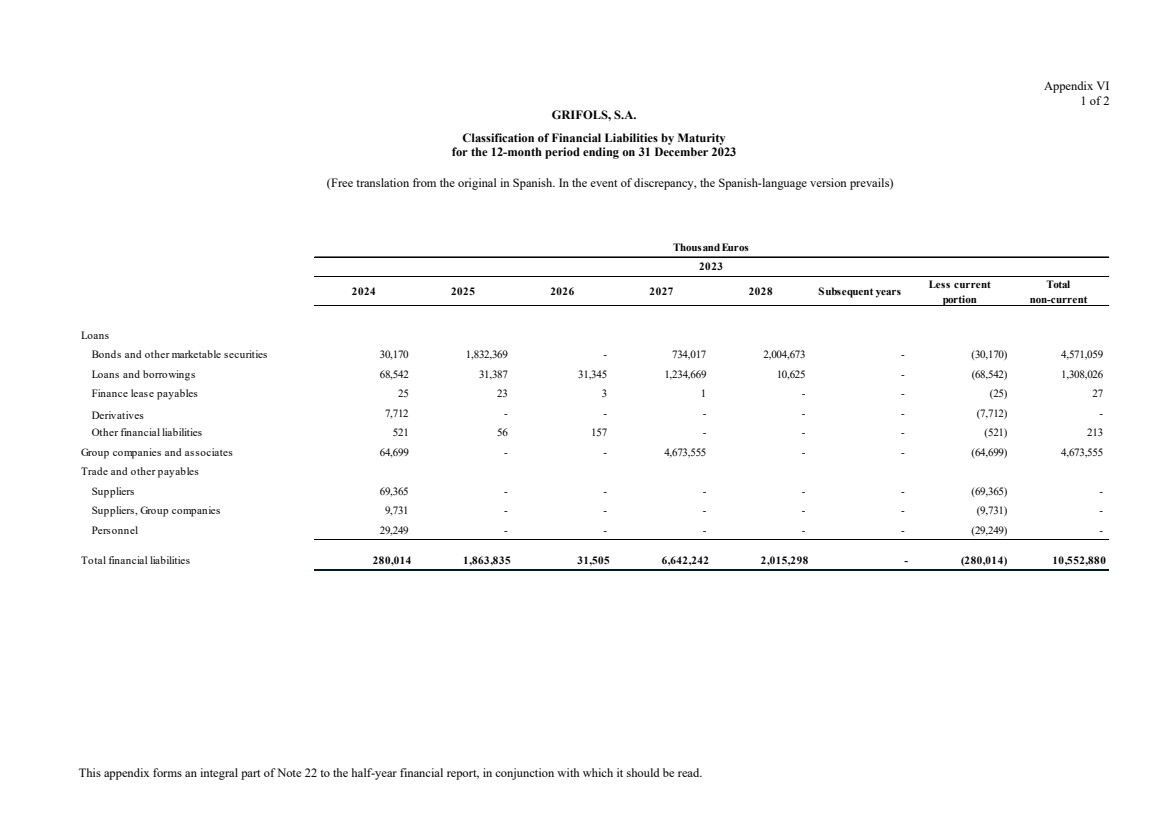
| This appendix forms an integral part of Note 22 to the half-year financial report, in conjunction with which it should be read.
Appendix VI
1 of 2
GRIFOLS, S.A.
Classification of Financial Liabilities by Maturity
for the 12-month period ending on 31 December 2023
(Free translation from the original in Spanish. In the event of discrepancy, the Spanish-language version prevails)
2024 2025 2026 2027 2028 Subsequent years Less current portion Total non-current
Loans
Bonds and other marketable securities 30,170 1,832,369 - 734,017 2,004,673 - (30,170) 4,571,059
Loans and borrowings 68,542 31,387 31,345 1,234,669 10,625 - (68,542) 1,308,026
Finance lease payables 25 23 3 1 - - (25) 27
Derivatives 7,712 - - - - - (7,712) -
Other financial liabilities 521 56 157 - - - (521) 213
Group companies and associates 64,699 - - 4,673,555 - - (64,699) 4,673,555
Trade and other payables
Suppliers 69,365 - - - - - (69,365) -
Suppliers, Group companies 9,731 - - - - - (9,731) -
Personnel 29,249 - - - - - (29,249) -
Total financial liabilities 280,014 1,863,835 31,505 6,642,242 2,015,298 - (280,014) 10,552,880
Thousand Euros
2023 |

| This appendix forms an integral part of Note 22 to the half-year financial report, in conjunction with which it should be read.
Appendix VI
2 of 2
GRIFOLS, S.A.
Classification of Financial Liabilities by Maturity
for the 12-month period ending on 31 December 2022
(Free translation from the original in Spanish. In the event of discrepancy, the Spanish-language version prevails)
2023 2024 2025 2026 2027 Subsequent years Less current portion Total non-current
Loans
Bonds and other marketable securities 12,554 - 1,827,863 - 728,778 - (12,554) 2,556,641
Loans and borrowings 60,899 32,447 31,387 31,345 1,234,669 10,625 (60,899) 1,340,473
Finance lease payables 391 25 24 2 1 - (391) 52
Derivatives - 3,990 - - - - - 3,990
Other financial liabilities 942 521 55 - - - (942) 576
Group companies and associates 61,720 - - - 4,408,547 2,010,624 (61,720) 6,419,171
Trade and other payables
Suppliers 58,812 - - - - - (58,812) -
Suppliers, Group companies 9,235 - - - - - (9,235) -
Personnel 11,541 - - - - - (11,541) -
Total financial liabilities 216,094 36,983 1,859,329 31,347 6,371,995 2,021,249 (216,094) 10,320,903
2022
Thousand Euros |
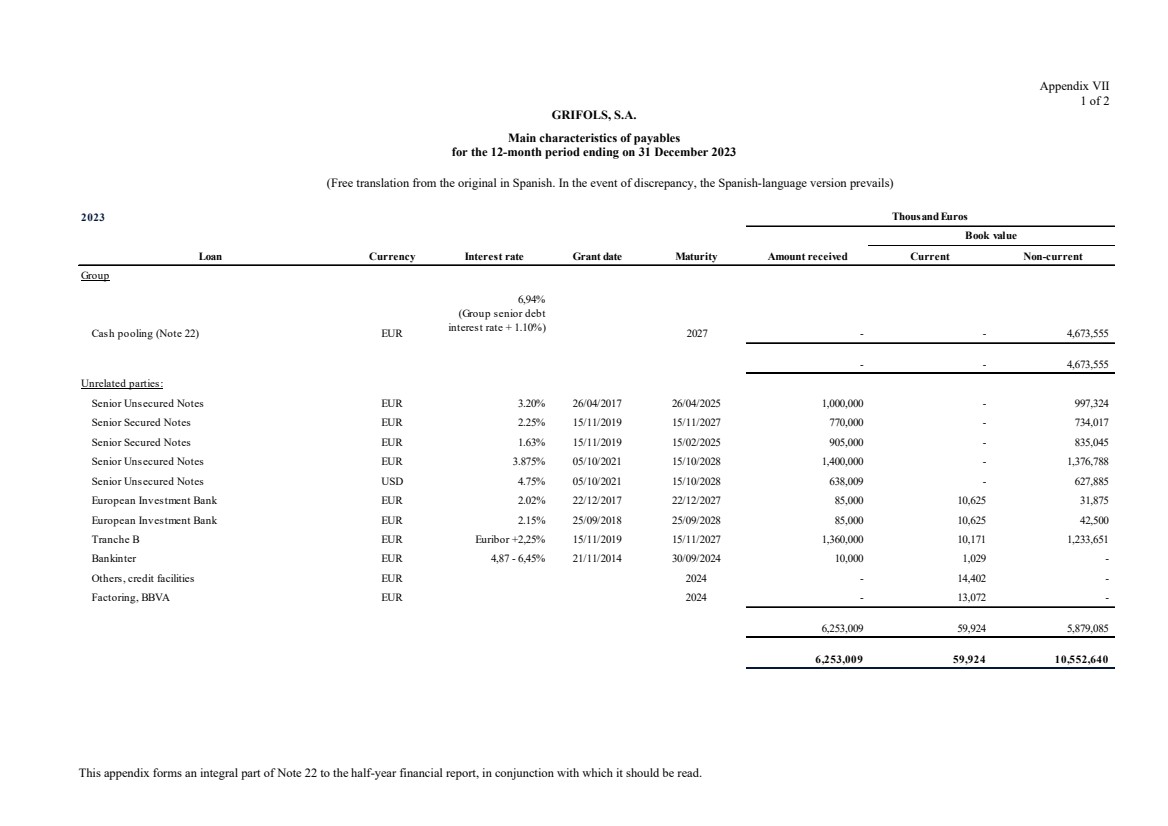
| This appendix forms an integral part of Note 22 to the half-year financial report, in conjunction with which it should be read.
Appendix VII
1 of 2
GRIFOLS, S.A.
Main characteristics of payables
for the 12-month period ending on 31 December 2023
(Free translation from the original in Spanish. In the event of discrepancy, the Spanish-language version prevails)
2023
Loan Currency Interest rate Grant date Maturity Amount received Current Non-current
Group
Cash pooling (Note 22) EUR 2027 - - 4,673,555
- - 4,673,555
Unrelated parties:
Senior Unsecured Notes EUR 3.20% 26/04/2017 26/04/2025 1,000,000 - 997,324
Senior Secured Notes EUR 2.25% 15/11/2019 15/11/2027 770,000 - 734,017
Senior Secured Notes EUR 1.63% 15/11/2019 15/02/2025 905,000 - 835,045
Senior Unsecured Notes EUR 3.875% 05/10/2021 15/10/2028 1,400,000 - 1,376,788
Senior Unsecured Notes USD 4.75% 05/10/2021 15/10/2028 638,009 - 627,885
European Investment Bank EUR 2.02% 22/12/2017 22/12/2027 85,000 10,625 31,875
European Investment Bank EUR 2.15% 25/09/2018 25/09/2028 85,000 10,625 42,500
Tranche B EUR Euribor +2,25% 15/11/2019 15/11/2027 1,360,000 10,171 1,233,651
Bankinter EUR 4,87 - 6,45% 21/11/2014 30/09/2024 10,000 1,029 -
Others, credit facilities EUR 2024 - 14,402 -
Factoring, BBVA EUR 2024 - 13,072 -
6,253,009 59,924 5,879,085
6,253,009 59,924 10,552,640
Thousand Euros
Book value
6,94%
(Group senior debt
interest rate + 1.10%) |

| This appendix forms an integral part of Note 22 to the half-year financial report, in conjunction with which it should be read.
Appendix VII
2 of 2
GRIFOLS, S.A.
Main characteristics of payables
for the 12-month period ending on 31 December 2022
(Free translation from the original in Spanish. In the event of discrepancy, the Spanish-language version prevails)
2022
Loan Currency Interest rate Grant date Maturity Amount received Current Non-current
Group
Cash pooling (Note 22) EUR 2027 - - 4,408,547
Group loan from Grifols Escrow Issuer, S.A. (Note 22) EUR 3.875% 21/04/2022 15/10/2028 1,366,088 - 1,366,088
Group loan from Grifols Escrow Issuer, S.A. (Note 22) USD 4.75% 21/04/2022 15/10/2028 644,536 - 644,536
2,010,624 - 6,419,171
Unrelated parties:
Senior Unsecured Notes EUR 3.20% 26/04/2017 26/04/2025 1,000,000 - 995,301
Senior Secured Notes EUR 2.25% 15/11/2019 15/11/2027 770,000 - 728,778
Senior Secured Notes EUR 1.63% 15/11/2019 15/02/2025 905,000 - 832,562
European Investment Bank EUR 2.02% 22/12/2017 22/12/2027 85,000 10,625 42,500
European Investment Bank EUR 2.15% 25/09/2018 25/09/2028 85,000 10,625 53,125
Tranche B EUR Euribor +2,25% 15/11/2019 15/11/2027 1,360,000 403 1,243,821
Bankinter EUR 1,76% - 4,87% 21/11/2014 30/09/2024 10,000 1,067 1,027
Others, credit facilities EUR 2023 - 13,887 -
Factoring, BBVA EUR 2023 - 14,278 -
4,215,000 50,885 3,897,114
6,225,624 50,885 10,316,285
Thousand Euros
6.16%
(Group senior debt
interest rate + 1.10%)
Book value |

| This appendix forms an integral part of Note 24 to the half-year financial report, in conjunction with which it should be read.
Appendix VIII
1 of 2
GRIFOLS, S.A.
Reconciliation between net income and expense for the year
and the tax loss for the 12-month period ending on 31 December 2023
(Free translation from the original in Spanish. In the event of discrepancy, the Spanish-language version prevails)
2023 Increases Decreases Net Increases Decreases Net Total
Income and expenses for the period (246,735) (18,732) (265,467)
Income tax (83,598) 4,682 (78,916)
Income tax, prior years 12,296 12,296
Other income tax (273) (273)
Losses before income tax (318,310) (14,050) (332,360)
Permanent differences
Individual company 8,783 16,146 (7,363) - - - (7,363)
Tax consolidation adjustments (4,508) - (4,508) - - - (4,508)
Temporary differences
Individual company
Originating in current year 181,702 - 181,702 - - - 181,702
Originating in prior years 117 1,486 (1,369) - - - (1,369)
Tax loss (149,848) (14,050) (163,898)
Thousand Euros
Income statement Income and expense recognised in equity |
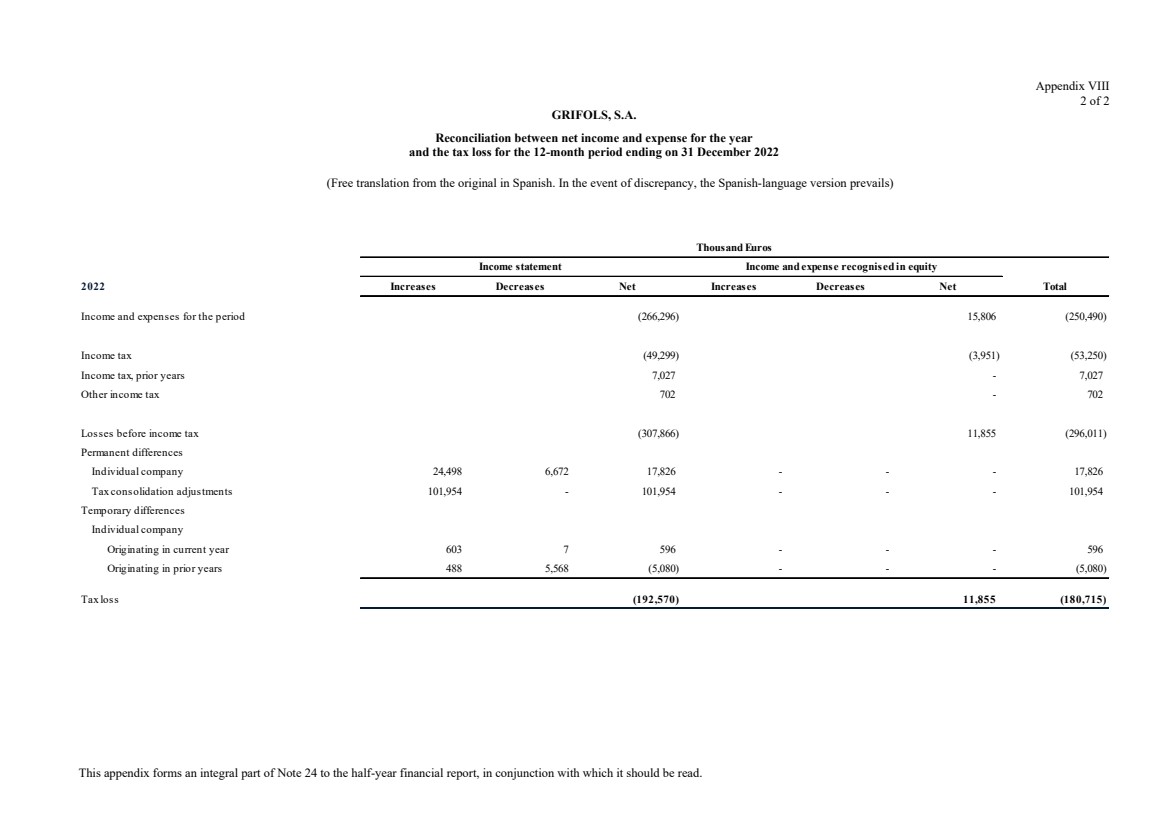
| This appendix forms an integral part of Note 24 to the half-year financial report, in conjunction with which it should be read.
Appendix VIII
2 of 2
GRIFOLS, S.A.
Reconciliation between net income and expense for the year
and the tax loss for the 12-month period ending on 31 December 2022
(Free translation from the original in Spanish. In the event of discrepancy, the Spanish-language version prevails)
2022 Increases Decreases Net Increases Decreases Net Total
Income and expenses for the period (266,296) 15,806 (250,490)
Income tax (49,299) (3,951) (53,250)
Income tax, prior years 7,027 - 7,027
Other income tax 702 - 702
Losses before income tax (307,866) 11,855 (296,011)
Permanent differences
Individual company 24,498 6,672 17,826 - - - 17,826
Tax consolidation adjustments 101,954 - 101,954 - - - 101,954
Temporary differences
Individual company
Originating in current year 603 7 596 - - - 596
Originating in prior years 488 5,568 (5,080) - - - (5,080)
Tax loss (192,570) 11,855 (180,715)
Thousand Euros
Income statement Income and expense recognised in equity |
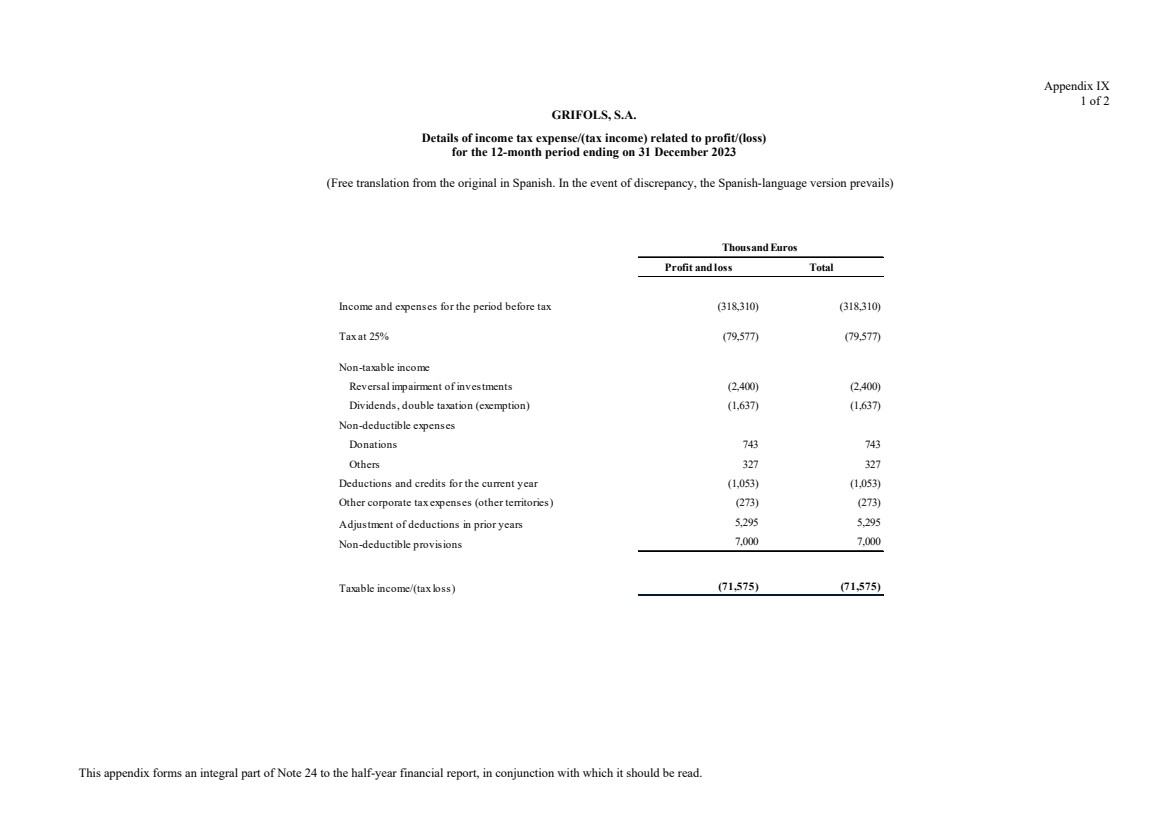
| This appendix forms an integral part of Note 24 to the half-year financial report, in conjunction with which it should be read.
Appendix IX
1 of 2
GRIFOLS, S.A.
Details of income tax expense/(tax income) related to profit/(loss)
for the 12-month period ending on 31 December 2023
(Free translation from the original in Spanish. In the event of discrepancy, the Spanish-language version prevails)
Profit and loss Total
Income and expenses for the period before tax (318,310) (318,310)
Tax at 25% (79,577) (79,577)
Non-taxable income
Reversal impairment of investments (2,400) (2,400)
Dividends, double taxation (exemption) (1,637) (1,637)
Non-deductible expenses
Donations 743 743
Others 327 327
Deductions and credits for the current year (1,053) (1,053)
Other corporate tax expenses (other territories) (273) (273)
Adjustment of deductions in prior years 5,295 5,295
Non-deductible provisions 7,000 7,000
Taxable income/(tax loss) (71,575) (71,575)
Thousand Euros |
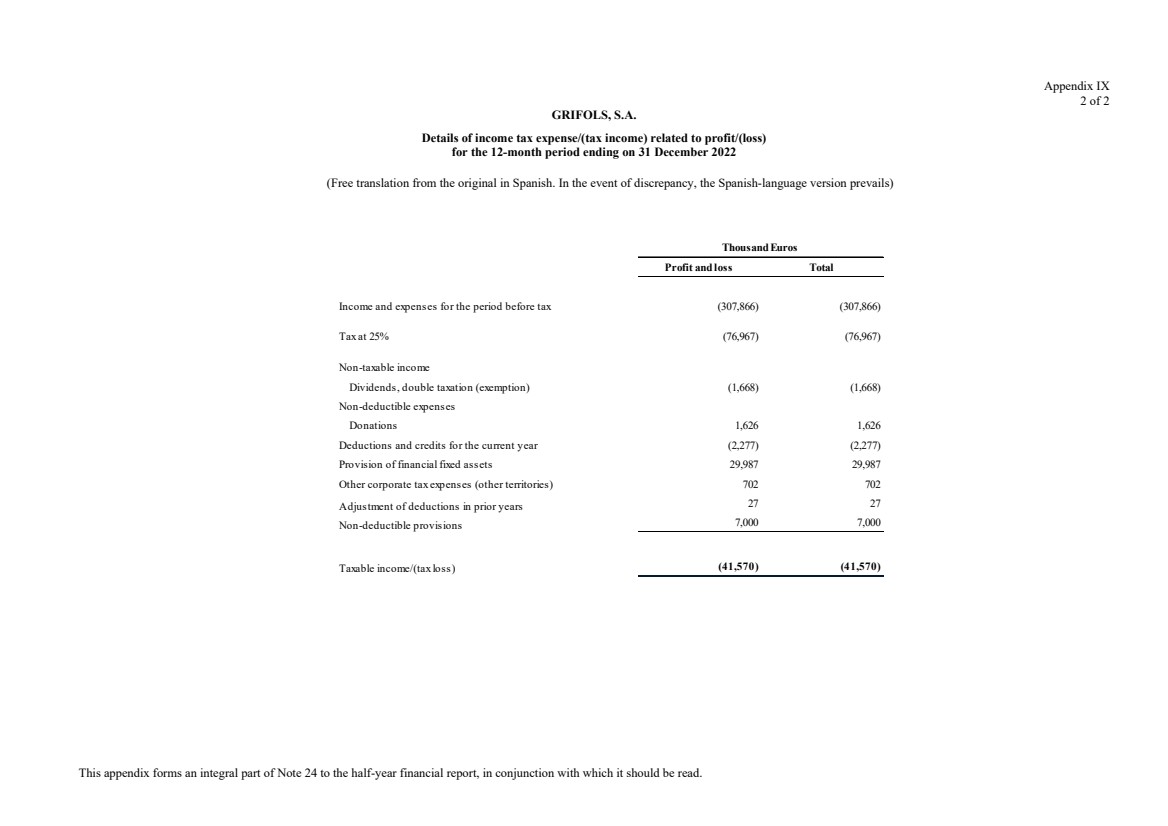
| This appendix forms an integral part of Note 24 to the half-year financial report, in conjunction with which it should be read.
Appendix IX
2 of 2
GRIFOLS, S.A.
Details of income tax expense/(tax income) related to profit/(loss)
for the 12-month period ending on 31 December 2022
(Free translation from the original in Spanish. In the event of discrepancy, the Spanish-language version prevails)
Profit and loss Total
Income and expenses for the period before tax (307,866) (307,866)
Tax at 25% (76,967) (76,967)
Non-taxable income
Dividends, double taxation (exemption) (1,668) (1,668)
Non-deductible expenses
Donations 1,626 1,626
Deductions and credits for the current year (2,277) (2,277)
Provision of financial fixed assets 29,987 29,987
Other corporate tax expenses (other territories) 702 702
Adjustment of deductions in prior years 27 27
Non-deductible provisions 7,000 7,000
Taxable income/(tax loss) (41,570) (41,570)
Thousand Euros |
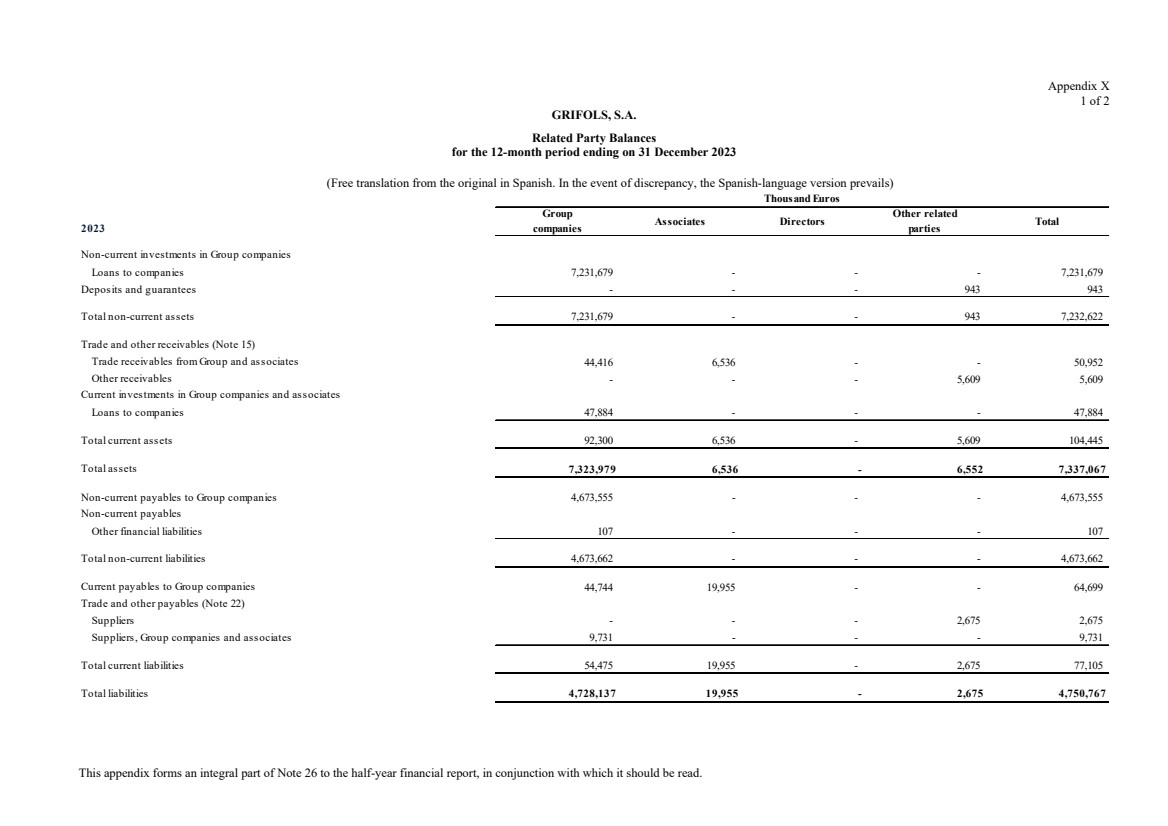
| This appendix forms an integral part of Note 26 to the half-year financial report, in conjunction with which it should be read.
Appendix X
1 of 2
GRIFOLS, S.A.
Related Party Balances
for the 12-month period ending on 31 December 2023
(Free translation from the original in Spanish. In the event of discrepancy, the Spanish-language version prevails)
Group Other related
companies parties
Non-current investments in Group companies
Loans to companies 7,231,679 - - - 7,231,679
Deposits and guarantees - - - 943 943
Total non-current assets 7,231,679 - - 943 7,232,622
Trade and other receivables (Note 15)
Trade receivables from Group and associates 44,416 6,536 - - 50,952
Other receivables - - - 5,609 5,609
Current investments in Group companies and associates
Loans to companies 47,884 - - - 47,884
Total current assets 92,300 6,536 - 5,609 104,445
Total assets 7,323,979 6,536 - 6,552 7,337,067
Non-current payables to Group companies 4,673,555 - - - 4,673,555
Non-current payables
Other financial liabilities 107 - - - 107
Total non-current liabilities 4,673,662 - - - 4,673,662
Current payables to Group companies 44,744 19,955 - - 64,699
Trade and other payables (Note 22)
Suppliers - - - 2,675 2,675
Suppliers, Group companies and associates 9,731 - - - 9,731
Total current liabilities 54,475 19,955 - 2,675 77,105
Total liabilities 4,728,137 19,955 - 2,675 4,750,767
Thousand Euros
2023 Associates Directors Total |
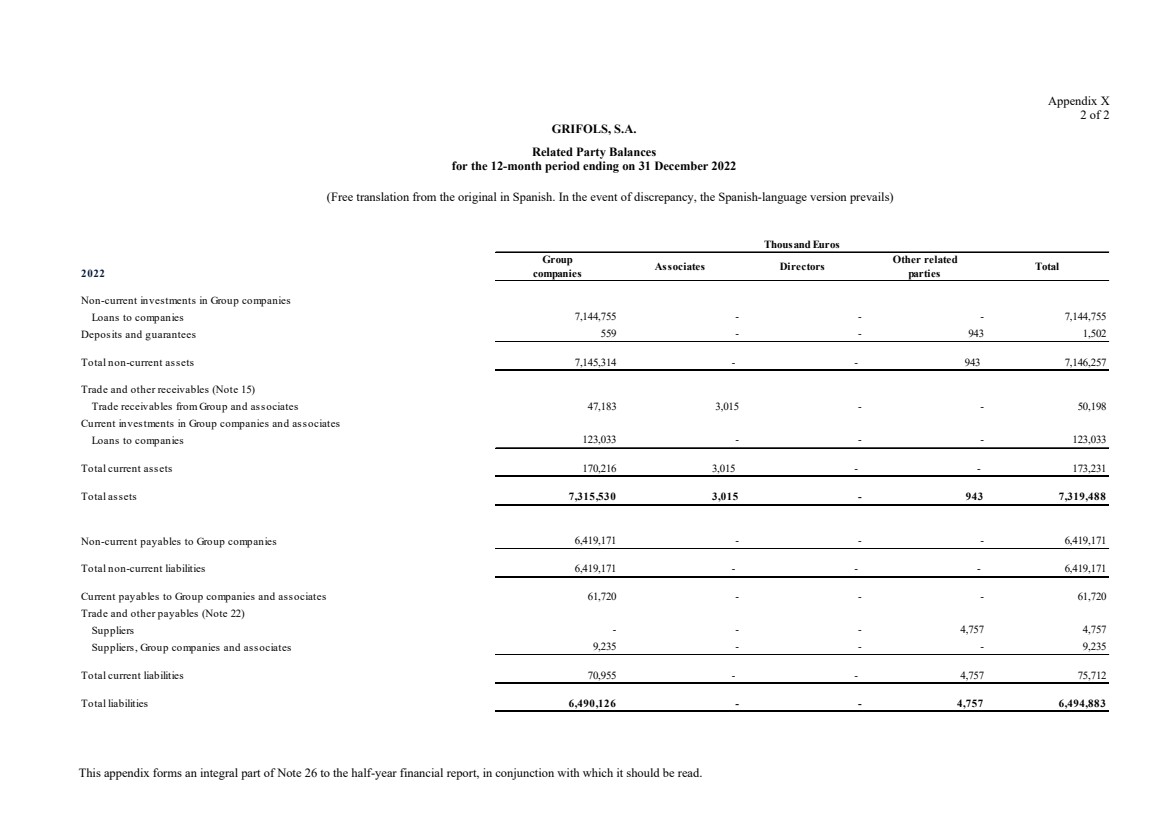
| This appendix forms an integral part of Note 26 to the half-year financial report, in conjunction with which it should be read.
Appendix X
2 of 2
GRIFOLS, S.A.
Related Party Balances
for the 12-month period ending on 31 December 2022
(Free translation from the original in Spanish. In the event of discrepancy, the Spanish-language version prevails)
Group Other related
companies parties
Non-current investments in Group companies
Loans to companies 7,144,755 - - - 7,144,755
Deposits and guarantees 559 - - 943 1,502
Total non-current assets 7,145,314 - - 943 7,146,257
Trade and other receivables (Note 15)
Trade receivables from Group and associates 47,183 3,015 - - 50,198
Current investments in Group companies and associates
Loans to companies 123,033 - - - 123,033
Total current assets 170,216 3,015 - - 173,231
Total assets 7,315,530 3,015 - 943 7,319,488
Non-current payables to Group companies 6,419,171 - - - 6,419,171
Total non-current liabilities 6,419,171 - - - 6,419,171
Current payables to Group companies and associates 61,720 - - - 61,720
Trade and other payables (Note 22)
Suppliers - - - 4,757 4,757
Suppliers, Group companies and associates 9,235 - - - 9,235
Total current liabilities 70,955 - - 4,757 75,712
Total liabilities 6,490,126 - - 4,757 6,494,883
2022 Associates Directors Total
Thousand Euros |

| This appendix forms an integral part of Note 26 to the half-year financial report, in conjunction with which it should be read.
Appendix XI
1 of 2
GRIFOLS, S.A.
Related Party Transactions
for the 12-month period ending on 31 December 2023
(Free translation from the original in Spanish. In the event of discrepancy, the Spanish-language version prevails)
Group Key management Other related
2023 companies personnel parties
Licencing income 35,174 - - - - 35,174
Other services rendered 200,637 6,521 - - 14 207,172
Finance income 369,527 - - - - 369,527
Dividends - 6,891 - - - 6,891
Total income 605,338 13,412 - - 14 618,764
Operating lease expenses - - - - 7,234 7,234
Other services received 10,291 - - - 2,052 12,343
Remunerations - - 17,046 7,118 - 24,164
Financial expenses 302,222 - - - - 302,222
Total expenses 312,513 - 17,046 7,118 9,286 345,963
Cost of assets acquired
Intangibles 324 - - - - 324
Tangibles 403 - - - - 403
Total investments 727 - - - - 727
Thousand Euros
Associates Directors Total |
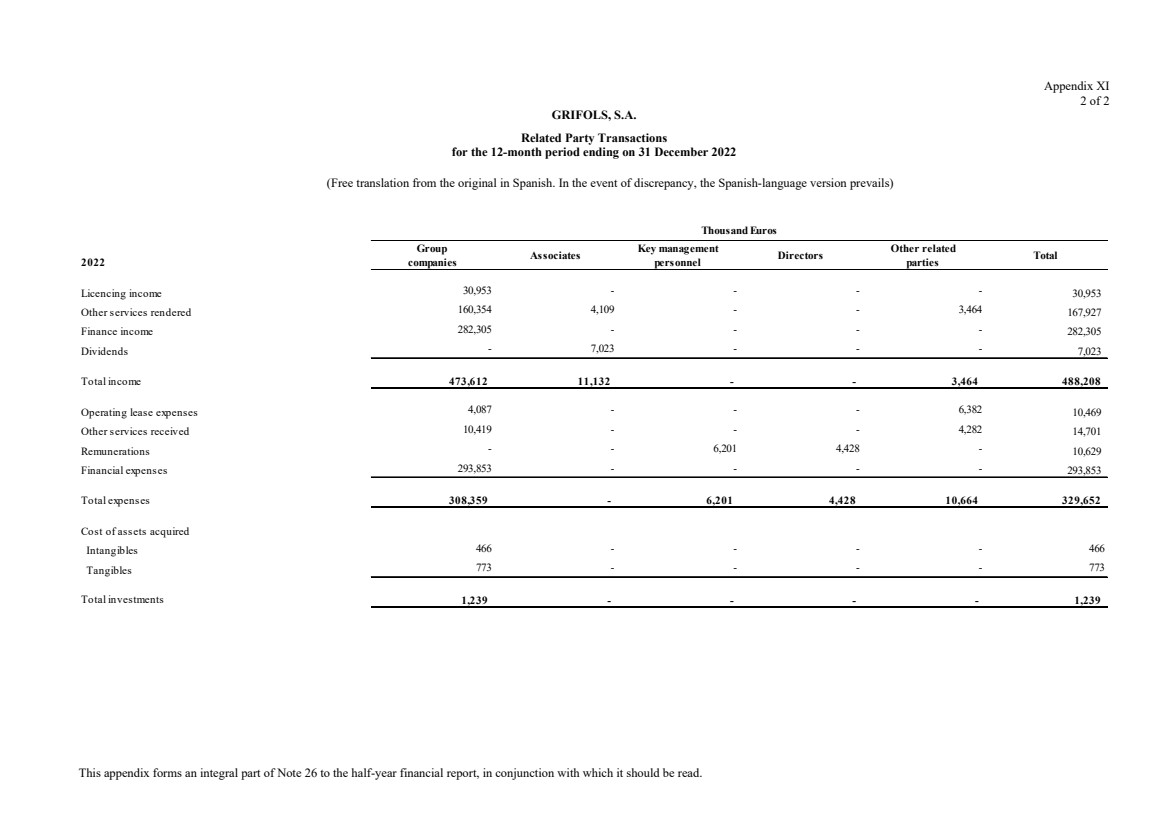
| This appendix forms an integral part of Note 26 to the half-year financial report, in conjunction with which it should be read.
Appendix XI
2 of 2
GRIFOLS, S.A.
Related Party Transactions
for the 12-month period ending on 31 December 2022
(Free translation from the original in Spanish. In the event of discrepancy, the Spanish-language version prevails)
Group Key management Other related
2022 companies personnel parties
Licencing income 30,953 - - - - 30,953
Other services rendered 160,354 4,109 - - 3,464 167,927
Finance income 282,305 - - - - 282,305
Dividends - 7,023 - - - 7,023
Total income 473,612 11,132 - - 3,464 488,208
Operating lease expenses 4,087 - - - 6,382 10,469
Other services received 10,419 - - - 4,282 14,701
Remunerations - - 6,201 4,428 - 10,629
Financial expenses 293,853 - - - - 293,853
Total expenses 308,359 - 6,201 4,428 10,664 329,652
Cost of assets acquired
Intangibles 466 - - - - 466
Tangibles 773 - - - - 773
Total investments 1,239 - - - - 1,239
Associates Directors Total
Thousand Euros |
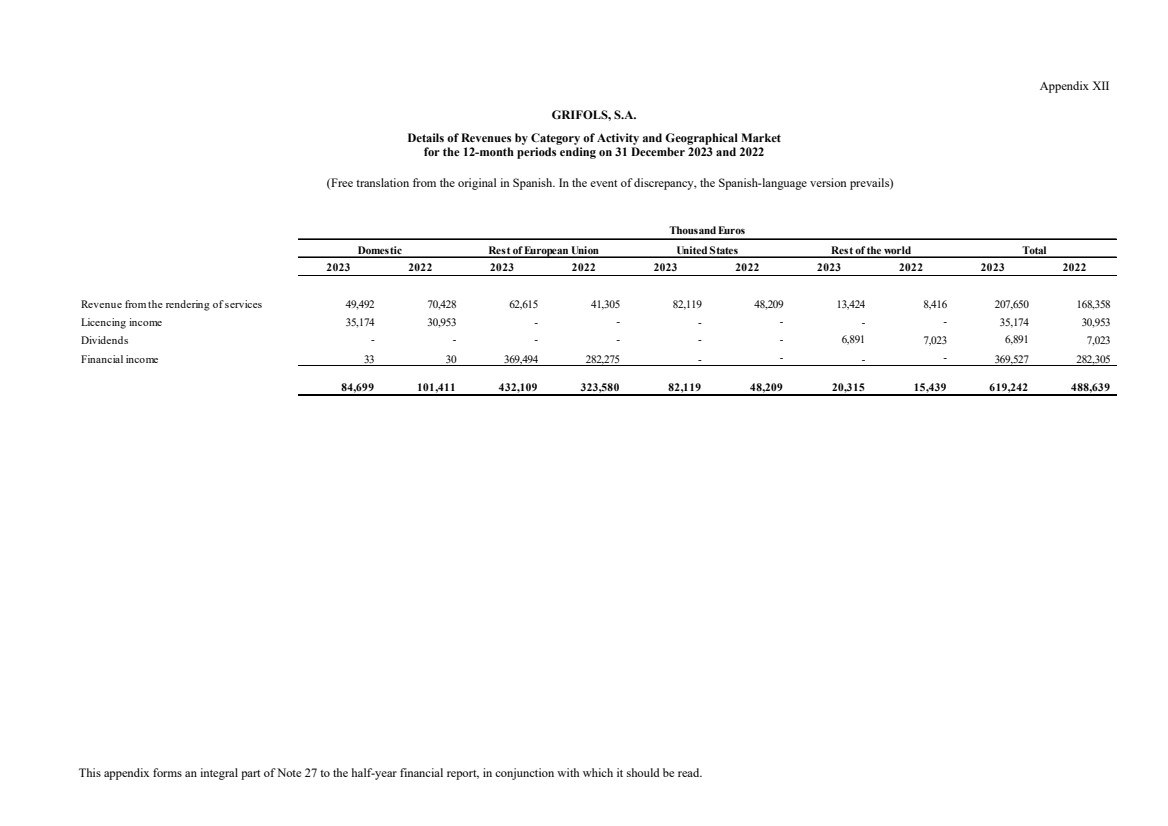
| This appendix forms an integral part of Note 27 to the half-year financial report, in conjunction with which it should be read.
Appendix XII
GRIFOLS, S.A.
Details of Revenues by Category of Activity and Geographical Market
for the 12-month periods ending on 31 December 2023 and 2022
(Free translation from the original in Spanish. In the event of discrepancy, the Spanish-language version prevails)
2023 2022 2023 2022 2023 2022 2023 2022 2023 2022
Revenue from the rendering of services 49,492 70,428 62,615 41,305 82,119 48,209 13,424 8,416 207,650 168,358
Licencing income 35,174 30,953 - - - - - - 35,174 30,953
Dividends - - - - - - 6,891 7,023 6,891 7,023
Financial income 33 30 369,494 282,275 - - - - 369,527 282,305
84,699 101,411 432,109 323,580 82,119 48,209 20,315 15,439 619,242 488,639
Thousand Euros
Domestic Rest of European Union United States Rest of the world Total |
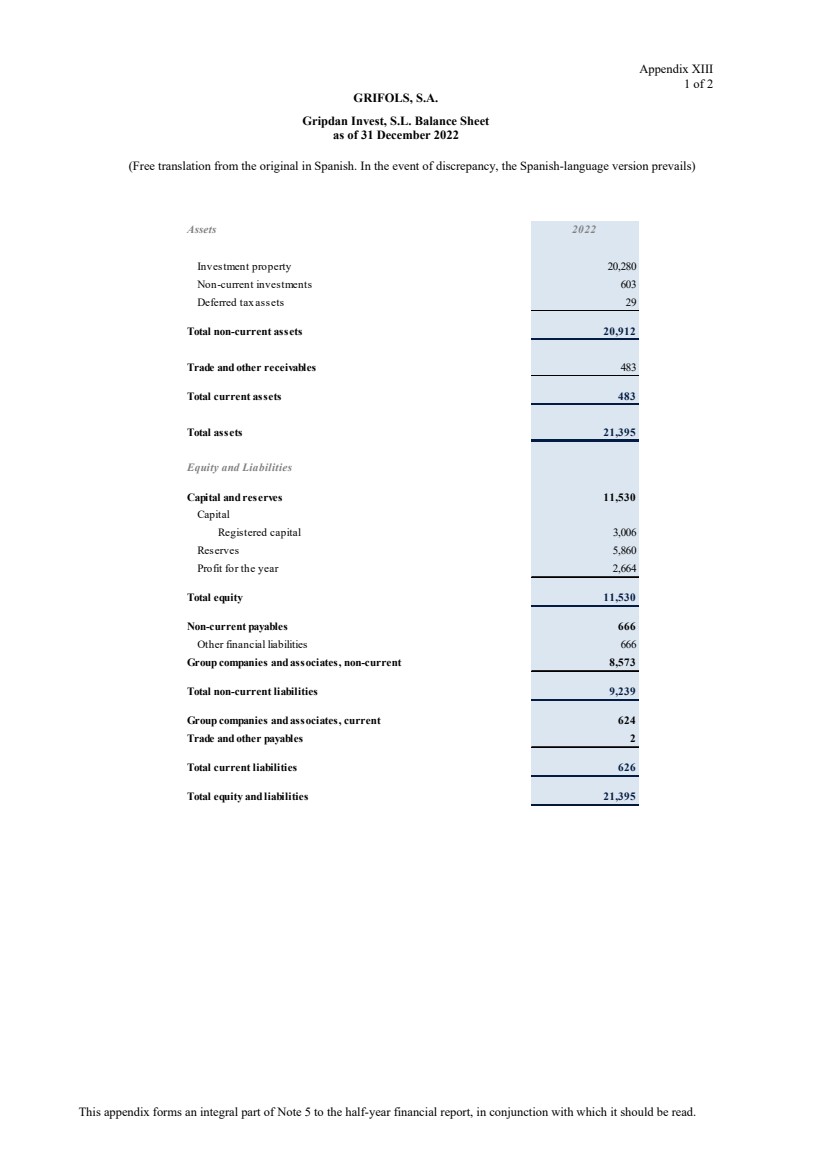
| This appendix forms an integral part of Note 5 to the half-year financial report, in conjunction with which it should be read.
Appendix XIII
1 of 2
GRIFOLS, S.A.
Gripdan Invest, S.L. Balance Sheet
as of 31 December 2022
(Free translation from the original in Spanish. In the event of discrepancy, the Spanish-language version prevails)
Assets 2022
Investment property 20,280
Non-current investments 603
Deferred tax assets 29
Total non-current assets 20,912
Trade and other receivables 483
Total current assets 483
Total assets 21,395
Equity and Liabilities
Capital and reserves 11,530
Capital
Registered capital 3,006
Reserves 5,860
Profit for the year 2,664
Total equity 11,530
Non-current payables 666
Other financial liabilities 666
Group companies and associates, non-current 8,573
Total non-current liabilities 9,239
Group companies and associates, current 624
Trade and other payables 2
Total current liabilities 626
Total equity and liabilities 21,395
|
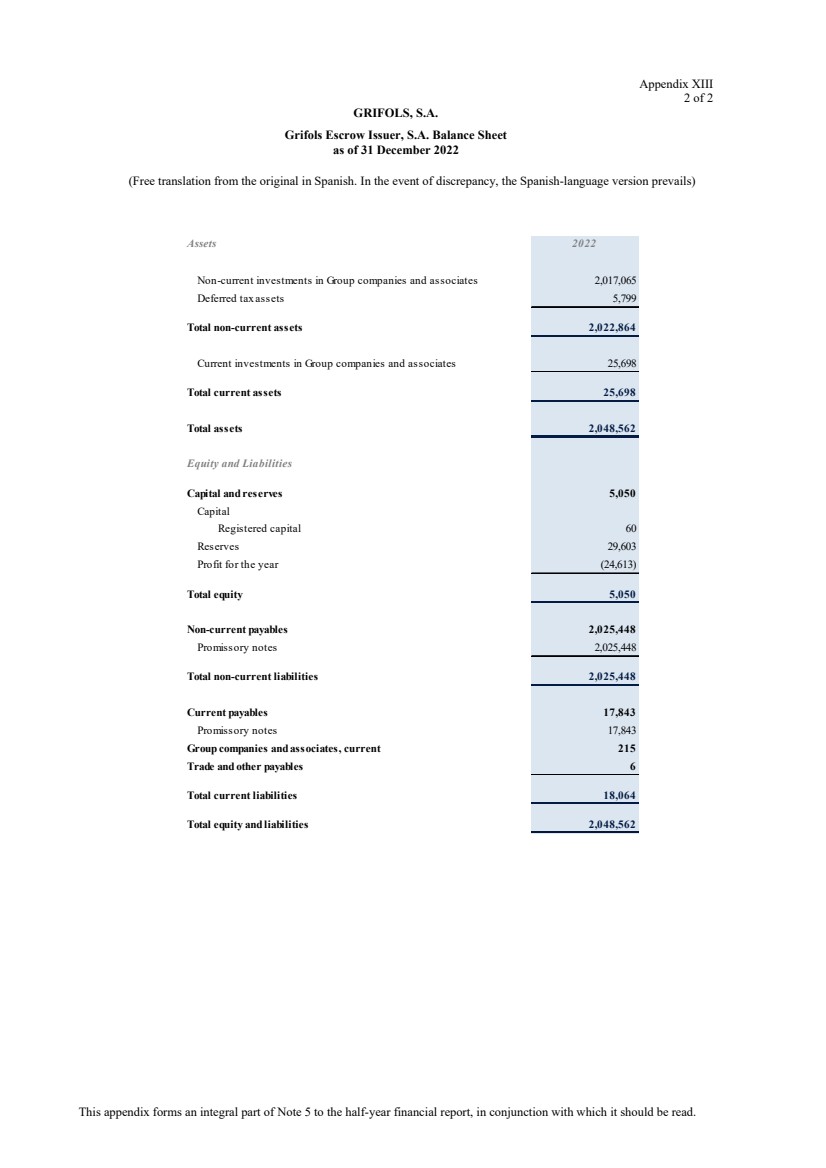
| This appendix forms an integral part of Note 5 to the half-year financial report, in conjunction with which it should be read.
Appendix XIII
2 of 2
GRIFOLS, S.A.
Grifols Escrow Issuer, S.A. Balance Sheet
as of 31 December 2022
(Free translation from the original in Spanish. In the event of discrepancy, the Spanish-language version prevails)
Assets 2022
Non-current investments in Group companies and associates 2,017,065
Deferred tax assets 5,799
Total non-current assets 2,022,864
Current investments in Group companies and associates 25,698
Total current assets 25,698
Total assets 2,048,562
Equity and Liabilities
Capital and reserves 5,050
Capital
Registered capital 60
Reserves 29,603
Profit for the year (24,613)
Total equity 5,050
Non-current payables 2,025,448
Promissory notes 2,025,448
Total non-current liabilities 2,025,448
Current payables 17,843
Promissory notes 17,843
Group companies and associates, current 215
Trade and other payables 6
Total current liabilities 18,064
Total equity and liabilities 2,048,562 |
| GRIFOLS, S.A.
Half-year Directors’ report
To the shareholders:
1. Business performance and position of the Company
Grifols, S.A. is a Spanish holding company specialised in the pharmaceutical-clinical sector. It is the parent company of the Grifols
Group and its principal activities are as follows:
‐ Defining action plans and general procedures for the entire Group.
‐ Planning future investments by entering new markets or through product diversification.
‐ Providing support to the various functional areas in each Group company (products division, technical division, marketing/sales
division, scientific division, financial division and planning and control division).
‐ Leasing owned buildings to Group companies.
‐ Rendering services to subsidiaries such as personnel recruitment and management, communications and corporate image, IT
services and maintenance.
The Company obtains its income from leasing its buildings and rendering services, and through dividends from its subsidiaries.
The Group's treasury budget anticipates meeting all its commitments in the next 12 months. Additionally, the cash generated from the
divestment in Shanghai RAAS (see Note 17) and the improvement in operational cash flow will be directed towards continuing the
reduction of the debt level initiated in previous years. Furthermore, the Group has various additional financing alternatives, such as
negotiations with debt holders, accessing the debt market, or potential divestments in non-strategic assets, to optimize the debt structure
and its financial cost.
2. Forecast
The Company’s profits could be affected by events related to the activities of its subsidiaries, such as a lack of raw materials for product
manufacturing, the arrival of competitor products on the market or regulatory changes in the markets in which it operates.
At the date of authorisation for issue of these half-year financial report, the Company has taken the measures it considers appropriate to
mitigate any possible effects arising from the afore mentioned events.
3. Treasury stock
As of 31 December 2023, the Company has treasury stock of Euros 152,748 thousand, as described in Note 19 of the accompanying half-year financial report. Transactions involving treasury stock in 2023 are described in Note 19 of the accompanying half-year financial
report.
4. Research and development
The Company does not conduct any research and development activities.
5. Management of financial risks
The Company's financial risk management policy is detailed in Note 12 to the accompanying half-year financial report.
6. Deferred payments to suppliers
The average payment period to the Company’s suppliers for 2023 is 61 days, which is above the maximum period of 60 days established
by the transitional arrangement set out in the Spanish Law 15/2010. Regarding the payments made after the regulatory deadline, the
Company is studying the best practices to reduce the average number of days.
7. Financial instruments use
Cross-currency swaps
On 28 June 2022 the Company entered into a fixed-for-fixed currency swap agreement with due date 15 October 2024.
The agreement set the exchange of currency flows EUR-USD under the following terms:
- Grifols, S.A. received a loan in euros for an amount of Euros 194 million with an interest rate of 3.10%.
- Grifols S.A. granted a loan in US dollars for an amount of US Dollars 205 million with an interest rate of 4.75%. |

| GRIFOLS, S.A.
Half-year Directors’ report
On 5 October 2021 the Company entered into a fixed-for-fixed currency swap agreement with some financial entities with
due date 15 October 2024. The agreement set the exchange of currency flows EUR-USD under the following terms:
- Grifols, S.A. received a loan in euros for an amount of Euros 173 million with an interest rate of 3.78%.
- Grifols S.A. granted a loan in US dollars for an amount of US Dollars 200 million with an interest rate of 4.75%.
On 5 October 2021 the Company entered into two fixed-for-fixed currency swap agreements with due date 15 October
2024. The agreement set the exchange of currency flows EUR-USD under the following terms:
- Grifols, S.A. received a loan in euros for an amount of Euros 259 million with an interest rate of 3.59%.
- Grifols S.A. granted a loan in US dollars for an amount of US Dollars 300 million with an interest rate of 4.75%.
Regarding the financial derivative agreement dated on October 5, 2021, it was considered as a hedge instrument on 21 April 2022.
Energy swaps
At the beginning of the 2023, the Company has entered into a hedge for the variation in the price of electricity. This contract has been
entirely used to hedge the purchase price of electric energy against potential market price increases.
8. Subsequent events
On January 9, 2024, a short seller investor issued a report based on speculation and false information regarding Grifols’ accounting and
financial information. Although the company’s fundamentals remain sound and unchanged and all financial information was duly
reported in the audited financial statements, this action had a significant impact on Grifols’ share price and corporate reputation.
The company is currently working to restore the confidence of markets, shareholders and other stakeholders in three key areas:
Communication and collaboration with the Spanish regulator (CNMV).
Transparent communication with all our stakeholders: sharing our clear response to the published report through live
conference calls and multiple official communications on the company’s website and on the CNMV portal.
All press releases are publicly available on Grifols’ website:
(https://www.grifols.com/es/informacion-relevante).
Clear and transparent communication with our teams and employee representatives, including major unions.
Reinforced communication with investors, official communications, direct phone calls, video calls and e-mails.
The company filed a complaint1
in the United States District Court for the Southern District of New York against Daniel
Yu, Gotham City Research LLC, General Industrial Partners LLP, Cyrus de Weck, and their affiliates to claim for the
financial and reputational damages caused to Grifols and their stakeholders as a result of the defendants’ actions.
The company established a dedicated working group comprising senior managers from the legal, communications, finance,
investor relations and management teams, together with external advisors with expertise in communications.
1 Official communication on the lawsuit filed:
https://www.cnmv.es/webservices/verdocumento/ver?t=%7b3498d0f6-c93e-4f95-8add-001b02c1cf28%7d |

| GRIFOLS, S.A.
The members of the Board of Directors of the company Grifols, S.A., gathered on February 28, 2024, in compliance with the requirements
of Royal Decree 1362/2007, of October 19, which develops Law 24/1988, of July 28, on the Securities Market, regarding transparency
requirements related to information about issuers whose securities are admitted to trading on an official secondary market or another
regulated market of the European Union, proceed to formulate the half-year financial report and the half-year Directors’ report for the
12-month period ending on December 31, 2023. The half-year financial report and the half-year Director’s report are comprised of the
attached documents preceding this writing.
Thomas Glanzmann
(signed)
Executive Chairman
Jose Ignacio Abia
(signed)
Board member
Raimon Grifols Roura
(signed)
Board member
Víctor Grifols Deu
(signed)
Board member
Albert Grifols Coma-Cros
(signed)
Board member
Carina Szpilka Lázaro
(signed)
Board member
Tomás Dagà Gelabert
(signed)
Board member
Iñigo Sánchez-Asiaín
Mardones
(signed)
Board member
Enriqueta Felip Font
(signed)
Board member
James Costos (*)
(signed)
Board member
Montserrat Muñoz Abellana
(signed)
Board member
Susana González Rodríguez
(signed)
Board member
Nuria Martin Barnés
(signed)
Secretary to the Board
(*) Absent due to personal reasons. However, he did not express any disconformity nor opposition with the
documentation. |

| FY 2023 Results - 1 -
FY 2023 Results
February 29, 2024
Closing a Record Year
to Accelerate Value
Creation in 2024 |
| FY 2023 Results - 2 -
Legal Disclaimer
Important Information
This presentation does not constitute an offer or invitation to purchase or subscribe shares, in accordance with the provisions of the Regulation (EU) 2017/1129 of the European
Parliament and of the Council of 14 June 2017 on the prospectus to be published when securities are offered to the public or admitted to trading on a regulated market, and repealing
Directive 2003/71/EC, the Spanish Securities Market and Investment Services Law (Law 6/2023, of 17 March, as amended and restated from time to time), Royal Decree 814/2023, of
November 8, and its implementing regulations. In addition, this document does not constitute an offer of purchase, sale or exchange, nor a request for an offer of purchase, sale or
exchange of securities, nor a request for any vote or approval in any other jurisdiction. This information has not been audited.
Forward-Looking Statements
This presentation contains forward-looking information and statements about GRIFOLS based on current assumptions and forecast made by GRIFOLS management, including pro forma
figures, estimates and their underlying assumptions, statements regarding plans, objectives and expectations with respect to capital expenditures, synergies, products and services, and
statements regarding future performance. Forward-looking statements are statements that are not historical facts and are generally identified by the words “expected”, “potential”,
“estimates” and similar expressions.
Although Grifols believes that the expectations reflected in such forward-looking statements are reasonable, various known and unknown risks, uncertainties and other factors could lead
to material differences between the actual future results, financial situation, development or performance of the Company and the estimates given here. These factors include those
discussed in our public reports filed with the Comisión Nacional del Mercado de Valores and the Securities and Exchange Commission, which are accessible to the public. The Company
assumes no liability whatsoever to update these forward-looking statements or conform them to future events or developments. Forward-looking statements are not guarantees of future
performance. They have not been reviewed by the auditors of Grifols.
NON-GAAP Financial Measures
This presentation refers to certain non-GAAP financial measures. The presentation of these financial measures is not intended to be considered in isolation, or as a substitute for, or
superior to, the financial information prepared and presented in accordance with GAAP. Investors are cautioned that there are material limitations associated with the use of non-GAAP
financial measures as an analytical tool. In addition, these measures may be different from non-GAAP financial measures used by other companies, limiting their usefulness for
comparative purposes. We compensate for these limitations by providing specific information regarding GAAP amounts excluded from these non-GAAP financial measures. A
reconciliation of these non-GAAP financial measures to the most directly comparable GAAP financial measures can be found in our Grifols Financial Statements. |

| FY 2023 Results - 3 -
4. Final Remarks
FY 2023 Results - 3 -
1. A Record Year
2. Performance by Business Unit
3. Financial Performance
5. Annex |
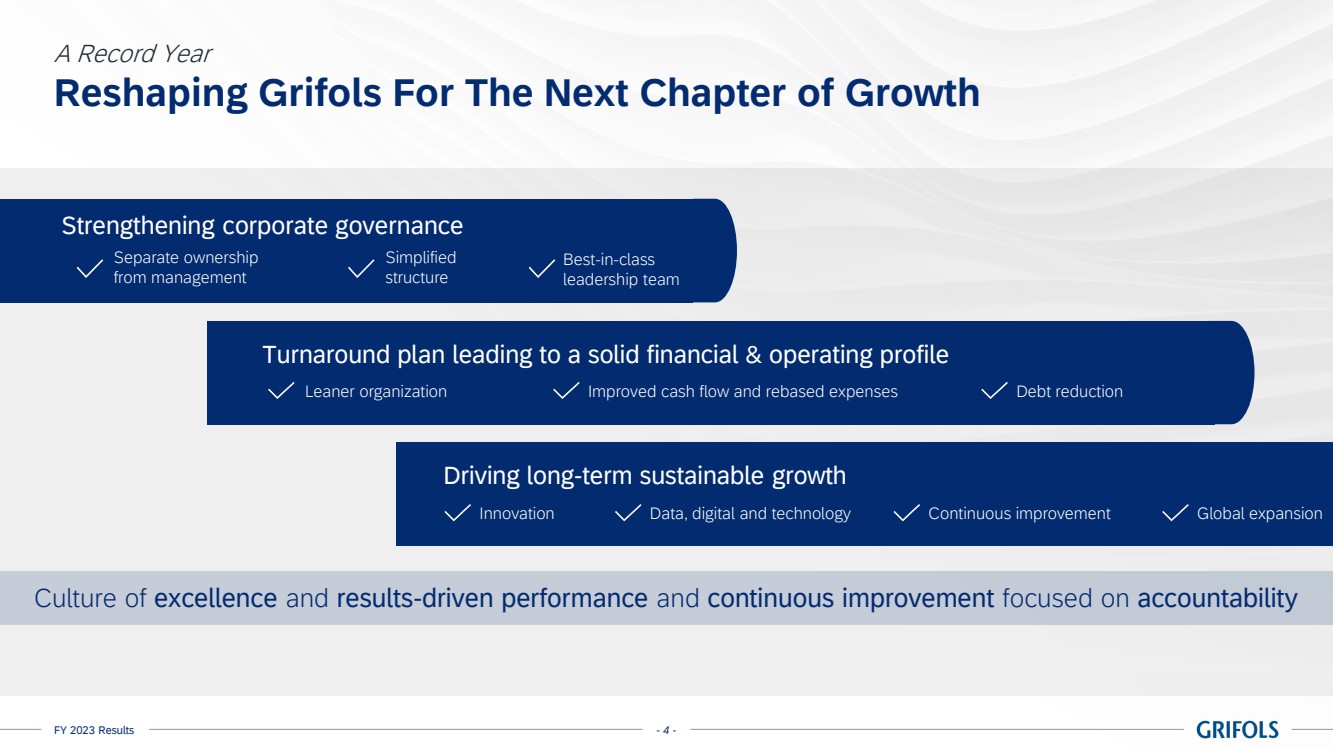
| FY 2023 Results - 4 -
Reshaping Grifols For The Next Chapter of Growth
A Record Year
Culture of excellence and results-driven performance and continuous improvement focused on accountability
Turnaround plan leading to a solid financial & operating profile
Leaner organization Improved cash flow and rebased expenses Debt reduction
Driving long-term sustainable growth
Innovation Data, digital and technology Continuous improvement Global expansion
Strengthening corporate governance
Separate ownership
from management
Best-in-class
leadership team
Simplified
structure |

| FY 2023 Results - 5 -
Committed to Best-in-Class Governance and Leadership Team
A Record Year
Complementing leadership team
Joerg Schuettrumpf
Chief Scientific
Innovation Officer
Miguel Louzan
Chief Digital
Information Officer
Roland Wandeler
President
Biopharma
Camille Alpi
Chief Human Resources
& Talent Officer
Laura Carratalà
Vice President
Bio Supplies
Nacho Abia
Incoming Chief Executive Officer (CEO)
Effective as of April 1, 2024
Separation of ownership and
management
Separation of Executive
Chairman and CEO Strengthened governance Simplify structures
| New appointments in key functions
Reinforced performance culture Flexibility and agility Recognition and reward,
aligned with shareholders Accountability |
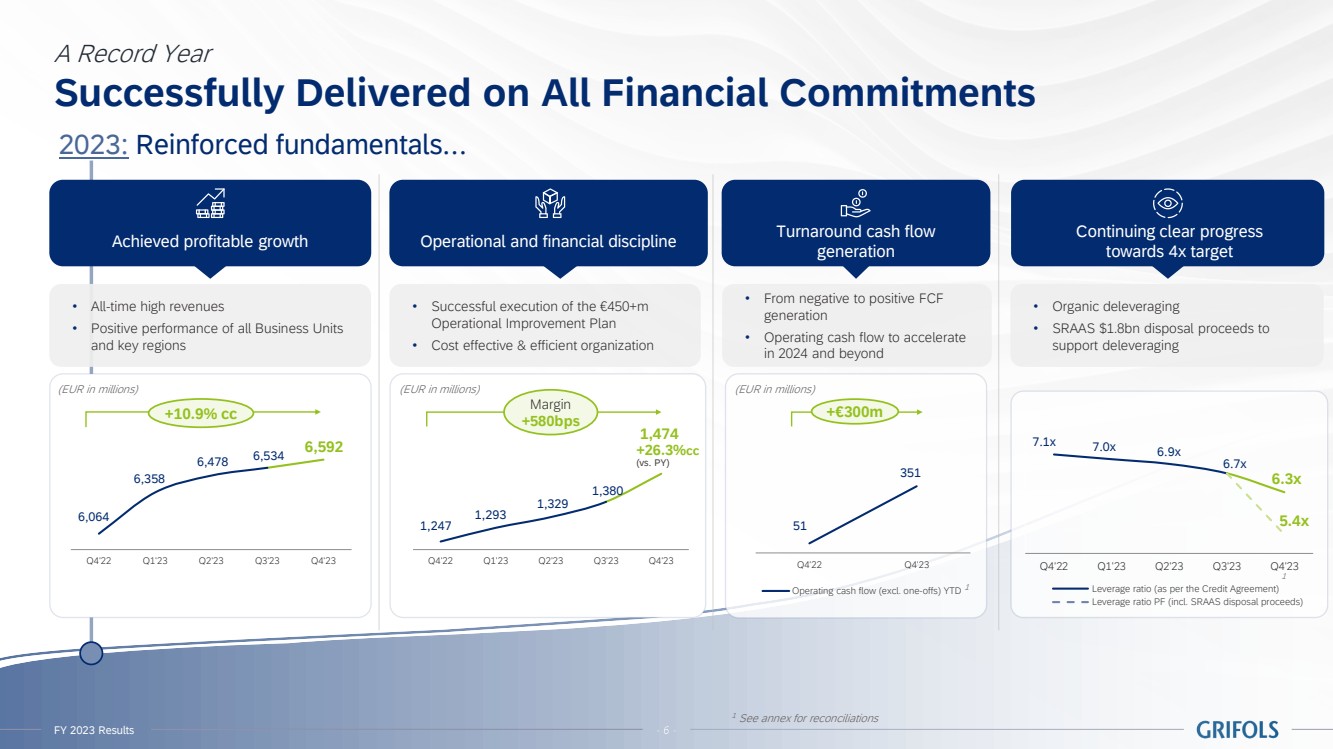
| FY 2023 Results - 6 -
Successfully Delivered on All Financial Commitments
A Record Year
2023: Reinforced fundamentals…
FY 2023 Results - 6 -
Achieved profitable growth Turnaround cash flow
generation Operational and financial discipline Continuing clear progress
towards 4x target
• All-time high revenues
• Positive performance of all Business Units
and key regions
6,064
6,358
6,478 6,534 6,592
5950.0
6050.0
6150.0
6250.0
6350.0
6450.0
6550.0
6650.0
6750.0
Q4'22 Q1'23 Q2'23 Q3'23 Q4'23
• Successful execution of the €450+m
Operational Improvement Plan
• Cost effective & efficient organization
1,247
1,293
1,329
1,380
1,474
1,220
1,270
1,320
1,370
1,420
1,470
1,520
Q4'22 Q1'23 Q2'23 Q3'23 Q4'23
• From negative to positive FCF
generation
• Operating cash flow to accelerate
in 2024 and beyond
• Organic deleveraging
• SRAAS $1.8bn disposal proceeds to
support deleveraging
7.1x
7.0x 6.9x
6.7x
6.3x
5.4x
5
5.5
6
6.5
7
7.5
Q4'22 Q1'23 Q2'23 Q3'23 Q4'23
Leverage ratio (as per the Credit Agreement)
Leverage ratio PF (incl. SRAAS disposal proceeds)
51
351
0
50
100
150
200
250
300
350
400
Q4'22 Q4'23
Operating cash flow (excl. one-offs) YTD
(EUR in millions) (EUR in millions)
1 See annex for reconciliations
1
1
Margin
+580bps +10.9% cc +€300m
(EUR in millions)
+26.3%cc
(vs. PY) |

| FY 2023 Results - 7 -
Focused on Accelerating Value Creation
A Record Year
Accelerating innovation pipeline Achieved all milestones
set by 2023
>30 projects
in pipeline
Developing assets with
long lasting competitive
advantage
Increasing efficiencies Plasma center network
optimized
Increased plasma
centers efficiencies
Cost-effective
organization
Leveraging on data, digital
& technology
Enhancing digitalization
to further personalize
donor experience
Executing on Haier Group strategic
alliance1 while driving global expansion
Albumin up to 20 years
agreement; and expanding
biopharmaceuticals
and diagnostic solutions in China
Capitalizing on Egypt’s
unique position
Supporting Canada’s
self-sufficiency goals
… while enabling long-term sustainable growth for 2024 and onwards
- 7 -
Created an AI
center of excellence
Expanding analytics use
to optimize yields
Compelling Sustainability story
Recognized by the DJSI for the 4th
consecutive year
FY 2023 Results - 7 - |

| FY 2023 Results - 8 -
4. Final Remarks
FY 2023 Results - 8 -
2. Performance by Business Unit
1. A Record Year
3. Financial Performance
5. Annex |
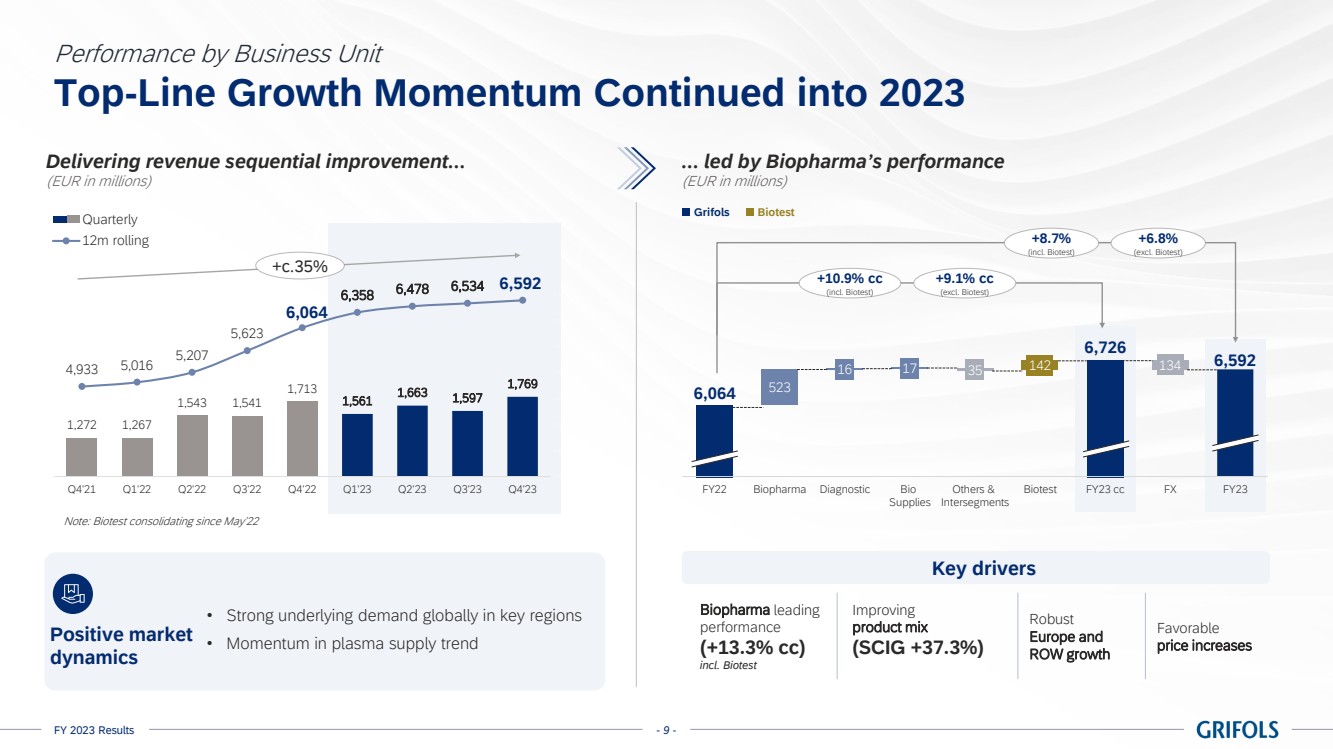
| FY 2023 Results - 9 -
523
16 17 35 142 134
Top-Line Growth Momentum Continued into 2023
Performance by Business Unit
Note: Biotest consolidating since May’22
Delivering revenue sequential improvement…
(EUR in millions)
Positive market
dynamics
+10.9% cc
(incl. Biotest)
+9.1% cc
(excl. Biotest)
+8.7%
(incl. Biotest)
+6.8%
(excl. Biotest)
Grifols Biotest
1,272 1,267
1,543 1,541
1,713
1,561 1,663 1,597
1,769
4,933 5,016
5,207
5,623
6,064
6,358 6,478 6,534 6,592
3,200
3,700
4,200
4,700
5,200
5,700
6,200
6,700
800
1,300
1,800
2,300
2,800
Q4'21 Q1'22 Q2'22 Q3'22 Q4'22 Q1'23 Q2'23 Q3'23 Q4'23
Quarterly
12m rolling
+c.35%
… led by Biopharma’s performance
(EUR in millions)
• Strong underlying demand globally in key regions
• Momentum in plasma supply trend
FY22
6,726
6,064
Biopharma Diagnostic Bio
Supplies
Others &
Intersegments
Biotest FY23 cc FX FY23
6,592
Improving
product mix
(SCIG +37.3%)
incl. Biotest
Robust
Europe and
ROW growth
Favorable
price increases
Biopharma leading
performance
(+13.3% cc)
incl. Biotest
Key drivers |
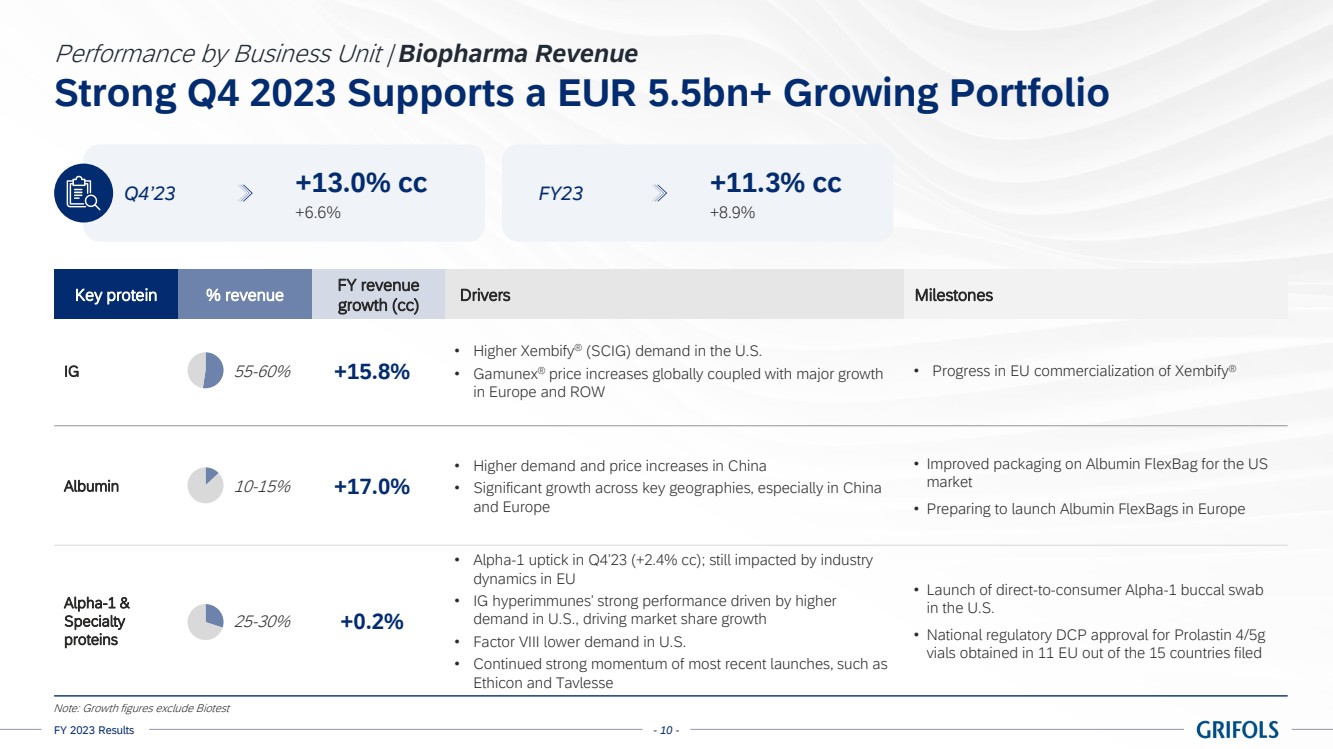
| FY 2023 Results - 10 -
IG 55-60% +15.8%
• Higher Xembify® (SCIG) demand in the U.S.
• Gamunex® price increases globally coupled with major growth
in Europe and ROW
• Progress in EU commercialization of Xembify®
Albumin 10-15% +17.0%
• Higher demand and price increases in China
• Significant growth across key geographies, especially in China
and Europe
• Improved packaging on Albumin FlexBag for the US
market
• Preparing to launch Albumin FlexBags in Europe
Alpha-1 &
Specialty
proteins
25-30% +0.2%
• Alpha-1 uptick in Q4’23 (+2.4% cc); still impacted by industry
dynamics in EU
• IG hyperimmunes’ strong performance driven by higher
demand in U.S., driving market share growth
• Factor VIII lower demand in U.S.
• Continued strong momentum of most recent launches, such as
Ethicon and Tavlesse
• Launch of direct-to-consumer Alpha-1 buccal swab
in the U.S.
• National regulatory DCP approval for Prolastin 4/5g
vials obtained in 11 EU out of the 15 countries filed
Key protein % revenue FY revenue
growth (cc) Drivers Milestones
Strong Q4 2023 Supports a EUR 5.5bn+ Growing Portfolio
Performance by Business Unit | Biopharma Revenue
+6.6%
+13.0% cc Q4’23
+8.9%
+11.3% cc FY23
Note: Growth figures exclude Biotest |
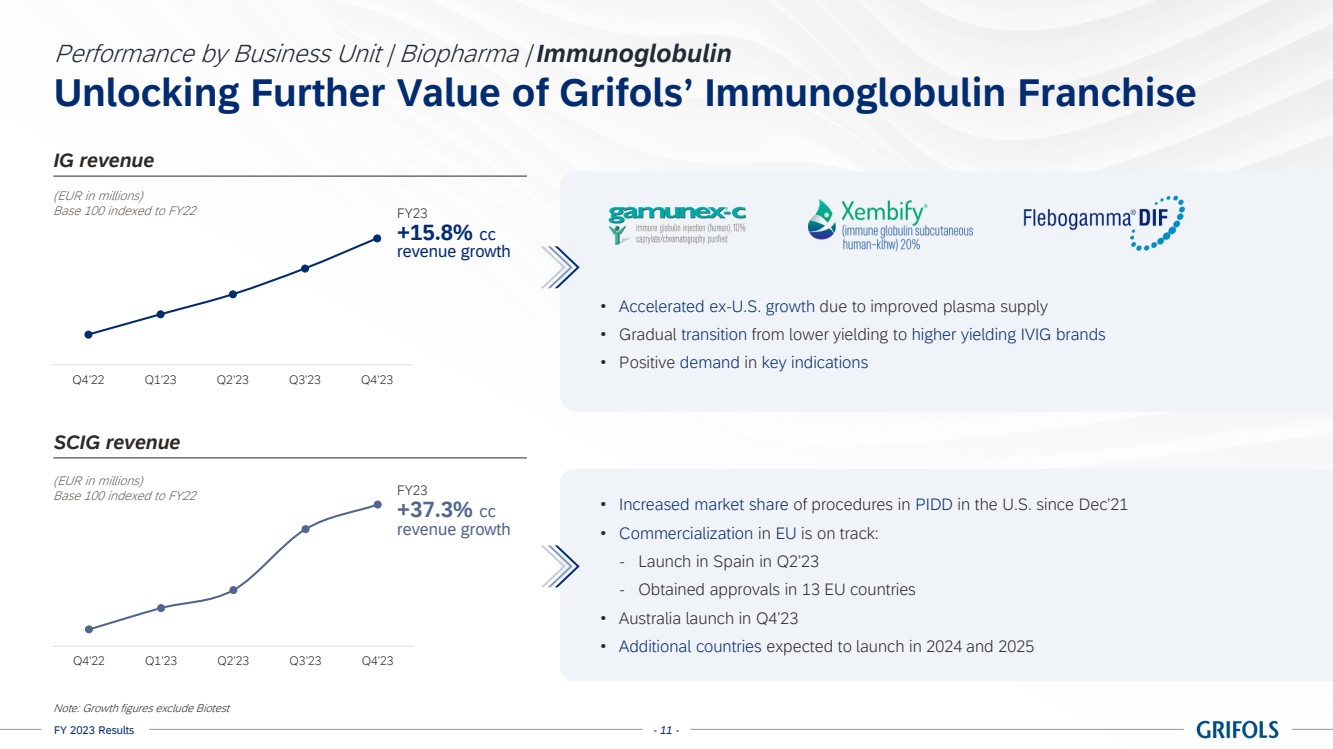
| FY 2023 Results - 11 -
95
100
105
110
115
120
125
130
135
140
Q4'22 Q1'23 Q2'23 Q3'23 Q4'23
+15.8% cc
revenue growth
FY23
• Increased market share of procedures in PIDD in the U.S. since Dec’21
• Commercialization in EU is on track:
‐ Launch in Spain in Q2’23
‐ Obtained approvals in 13 EU countries
• Australia launch in Q4’23
• Additional countries expected to launch in 2024 and 2025
• Accelerated ex-U.S. growth due to improved plasma supply
• Gradual transition from lower yielding to higher yielding IVIG brands
• Positive demand in key indications
Unlocking Further Value of Grifols’ Immunoglobulin Franchise
Performance by Business Unit | Biopharma | Immunoglobulin
95
100
105
110
115
120
Q4'22 Q1'23 Q2'23 Q3'23 Q4'23
SCIG revenue
IG revenue
+37.3% cc
revenue growth
FY23
(EUR in millions)
Base 100 indexed to FY22
(EUR in millions)
Base 100 indexed to FY22
Note: Growth figures exclude Biotest |
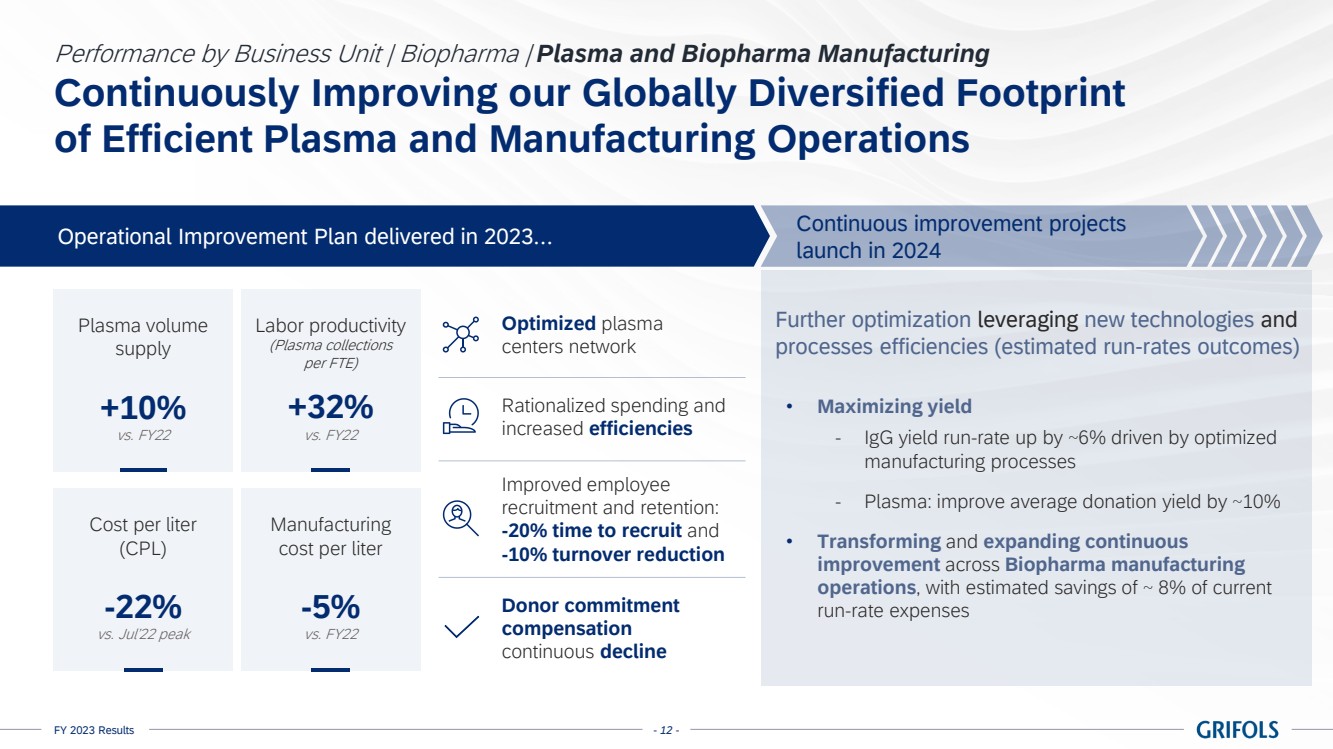
| FY 2023 Results - 12 -
Continuously Improving our Globally Diversified Footprint
of Efficient Plasma and Manufacturing Operations
Performance by Business Unit | Biopharma | Plasma and Biopharma Manufacturing
Labor productivity
(Plasma collections
per FTE)
+32%
vs. FY22
Cost per liter
(CPL)
-22%
vs. Jul’22 peak
Optimized plasma
centers network
Rationalized spending and
increased efficiencies
Improved employee
recruitment and retention:
-20% time to recruit and
-10% turnover reduction
Plasma volume
supply
+10%
vs. FY22
Manufacturing
cost per liter
-5%
vs. FY22
Donor commitment
compensation
continuous decline
Operational Improvement Plan delivered in 2023… Continuous improvement projects
launch in 2024
• Maximizing yield
‐ IgG yield run-rate up by ~6% driven by optimized
manufacturing processes
‐ Plasma: improve average donation yield by ~10%
• Transforming and expanding continuous
improvement across Biopharma manufacturing
operations, with estimated savings of ~ 8% of current
run-rate expenses
Further optimization leveraging new technologies and
processes efficiencies (estimated run-rates outcomes) |

| FY 2023 Results - 13 -
Risk-Value Balanced Pipeline of Blockbuster Opportunities
Performance by Business Unit | Biopharma | Innovation
Others
GRF6019 in Alzheimer Disease (AD)
GRF6021 in Parkinson Disease (PD) with dementia
Aβvac40 in AD2
AKST4290 in PD
AMBAR-Next in AD
GIGA564 Anti-CTLA-4 (mAb Oncology)
GIGA2328 Anti-CTLA-4 (mAb Oncology)
AKST4290 in nAMD & DR
OSIG – Dry Eye Disease
Immunology
recIG in PID
Xembify® in CLL
Xembify® – Bi-weekly dosing – PID
Xembify® – Prefilled syringes
Xembify® – Europe
Yimmugo® (IVIG NextGen) in PID and ITP
Fostamatinib1
in ITP for refractory patients
Gamunex in bags
Infectious
Diseases
GIGA 2339 in HBV
Trimodulin (IgM) in sCAP/CAP
ATIII in Sepsis
Pulmonology
Alpha-1 AT in Non-cystic fibrosis bronchiectasis
Alpha-1 AT 15% (SC) in AATD
SPARTA – Prolastin-C®
Prolastin® 4-5g. vials (EU)
Bleeding
Management
and Acute
Care
PRECIOSA Decompensated Cirrhosis (Albumin-20%)
APACHE Acute on Chronic Liver Disease (Albumin-5%)
FlexBag® (EU)
Fibrinogen in Cong. Deficiency & severe hypofibrinogen
Fibrinogen in Acquired Deficiency
VISTASEAL (fibrin sealant) in Biosurgery pediatric use
1 Licensed rights from Rigel Pharmaceuticals in EU and other countries
2 Project of Araclon (Grifols’ invested company)
Pre-Clinical Phase 1 Phase 2 Phase 3 Ph. 4 / Reg. LCM
2024 Launches: 9 markets
2024 Launches: 7 markets
Expected 2024 US approval |
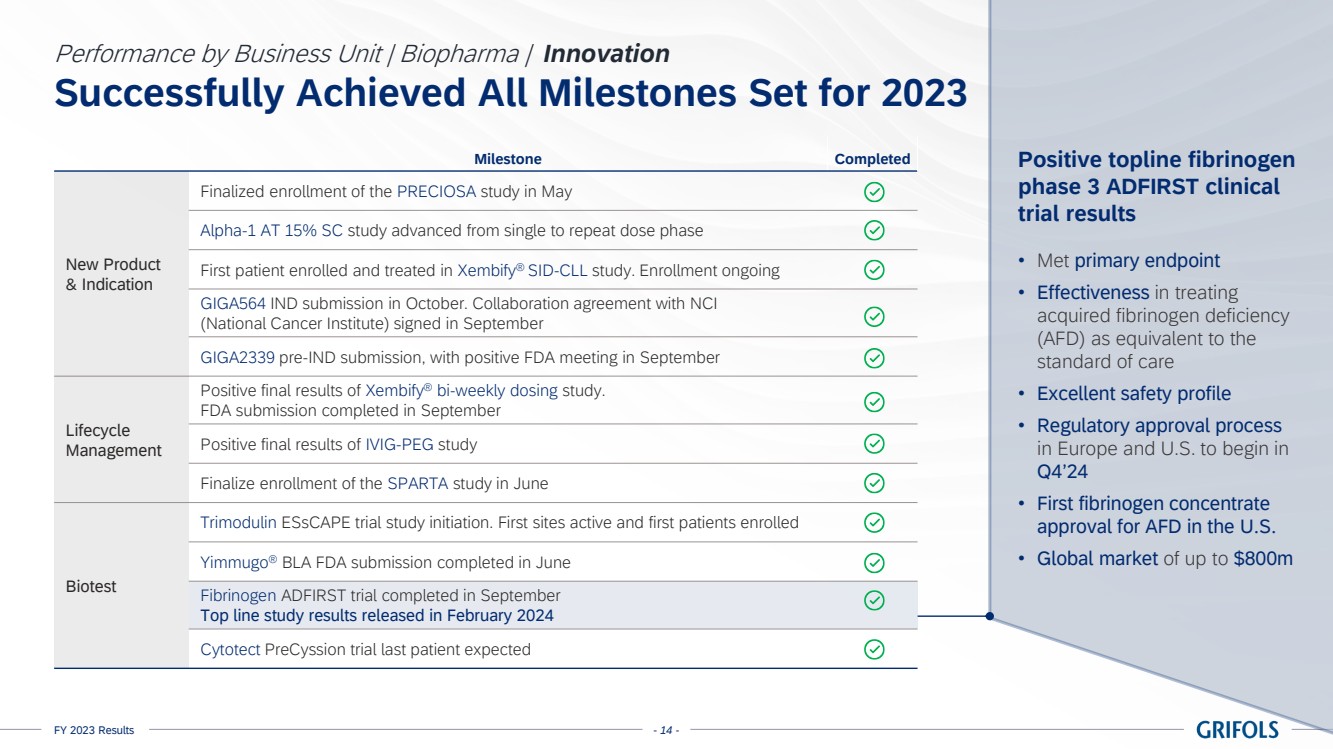
| FY 2023 Results - 14 -
Milestone Completed
New Product
& Indication
Finalized enrollment of the PRECIOSA study in May
Alpha-1 AT 15% SC study advanced from single to repeat dose phase
First patient enrolled and treated in Xembify® SID-CLL study. Enrollment ongoing
GIGA564 IND submission in October. Collaboration agreement with NCI
(National Cancer Institute) signed in September
GIGA2339 pre-IND submission, with positive FDA meeting in September
Lifecycle
Management
Positive final results of Xembify® bi-weekly dosing study.
FDA submission completed in September
Positive final results of IVIG-PEG study
Finalize enrollment of the SPARTA study in June
Biotest
Trimodulin ESsCAPE trial study initiation. First sites active and first patients enrolled
Yimmugo® BLA FDA submission completed in June
Fibrinogen ADFIRST trial completed in September
Top line study results released in February 2024
Cytotect PreCyssion trial last patient expected
Successfully Achieved All Milestones Set for 2023
Performance by Business Unit | Biopharma | Innovation
Positive topline fibrinogen
phase 3 ADFIRST clinical
trial results
• Met primary endpoint
• Effectiveness in treating
acquired fibrinogen deficiency
(AFD) as equivalent to the
standard of care
• Excellent safety profile
• Regulatory approval process
in Europe and U.S. to begin in
Q4’24
• First fibrinogen concentrate
approval for AFD in the U.S.
• Global market of up to $800m |

| FY 2023 Results - 15 -
Sustainable Pipeline Fueled by Internal Research and External
Innovation | Milestones for 2024
Performance by Business Unit | Biopharma | Innovation
Milestone 2024 timing On track Details
Alpha-1 AT 15% SC Phase 1/2 Cohort 2 Tx 1: First patient enrolled H1 First sites active and first patient in screening
PRECIOSA Last Patient Out – LPLV H1 Enrollment completed in 2023
Last patients finalizing treatment phase
OSIG in DED – Start of GLP Preclinical studies H1 Start-up activities on track to start GLP preclinical studies in H1’24
Yimmugo BLA FDA approval H1 FDA submission completed in June’23. Approval expected in June’24
Xembify® bi-weekly dosing FDA approval H2 FDA submission (sBLA) completed in Sept’23. Approval expected in H2’24
GIGA2339 in HBV Phase 1 IND submission H2 Preclinical activities (GMP manufacturing, GLP tox study) progressing on track
to support IND submission for Ph1 study in H2’24
PRECIOSA topline results H2 Last patients finalizing treatment phase. Topline results expected in H2’24
Gamunex in bags Conformance Lots production H2 Progress on track for Conformance Lot production in H2’24
Fibrinogen Congenital & Acquired Deficiency MAA/BLA submission H2 Positive topline study results released in February 2024
Regulatory approval process in Europe and US to begin in Q4’24 |
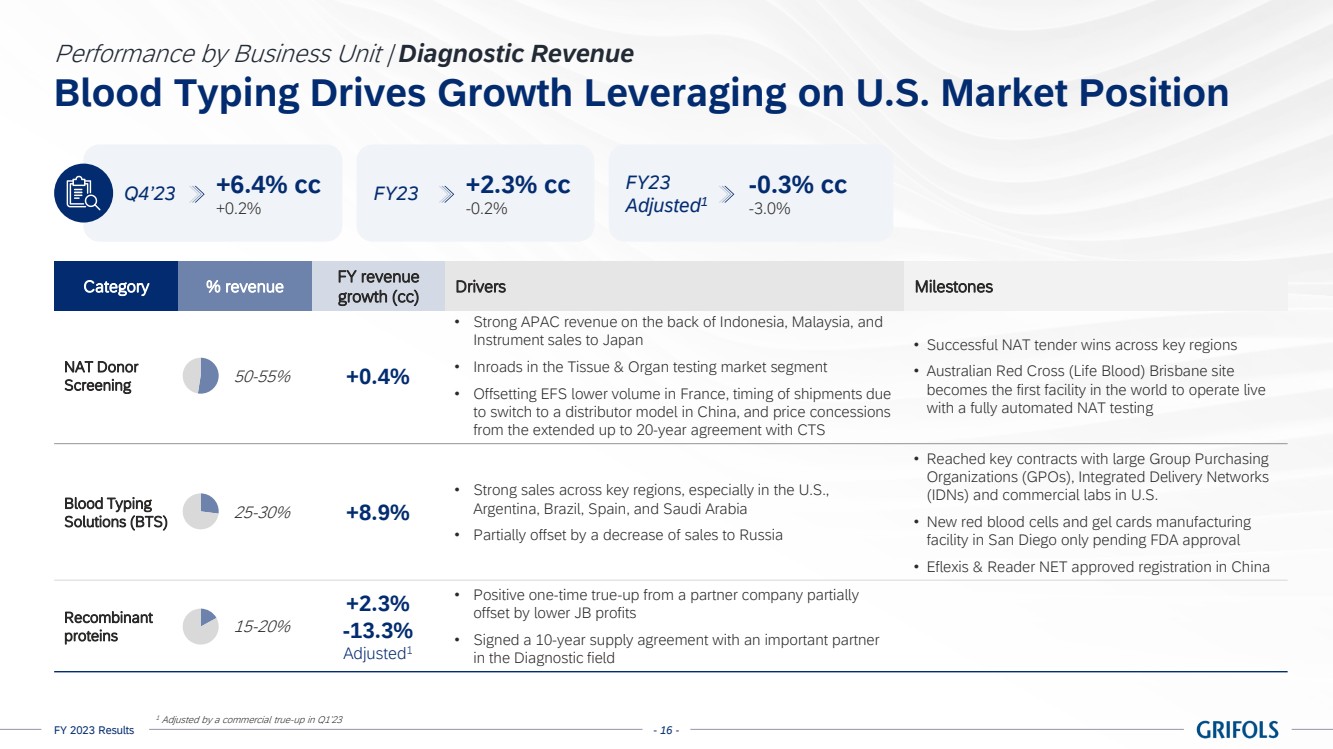
| FY 2023 Results - 16 -
Blood Typing Drives Growth Leveraging on U.S. Market Position
Performance by Business Unit | Diagnostic Revenue
+0.2%
+6.4% cc Q4’23
-0.2%
+2.3% cc FY23
-3.0%
FY23 -0.3% cc
Adjusted1
NAT Donor
Screening 50-55% +0.4%
• Strong APAC revenue on the back of Indonesia, Malaysia, and
Instrument sales to Japan
• Inroads in the Tissue & Organ testing market segment
• Offsetting EFS lower volume in France, timing of shipments due
to switch to a distributor model in China, and price concessions
from the extended up to 20-year agreement with CTS
• Successful NAT tender wins across key regions
• Australian Red Cross (Life Blood) Brisbane site
becomes the first facility in the world to operate live
with a fully automated NAT testing
Blood Typing
Solutions (BTS) 25-30% +8.9%
• Strong sales across key regions, especially in the U.S.,
Argentina, Brazil, Spain, and Saudi Arabia
• Partially offset by a decrease of sales to Russia
• Reached key contracts with large Group Purchasing
Organizations (GPOs), Integrated Delivery Networks
(IDNs) and commercial labs in U.S.
• New red blood cells and gel cards manufacturing
facility in San Diego only pending FDA approval
• Eflexis & Reader NET approved registration in China
Recombinant
proteins 15-20%
+2.3%
-13.3%
Adjusted1
• Positive one-time true-up from a partner company partially
offset by lower JB profits
• Signed a 10-year supply agreement with an important partner
in the Diagnostic field
Category % revenue FY revenue
growth (cc) Drivers Milestones
1 Adjusted by a commercial true-up in Q1’23 |
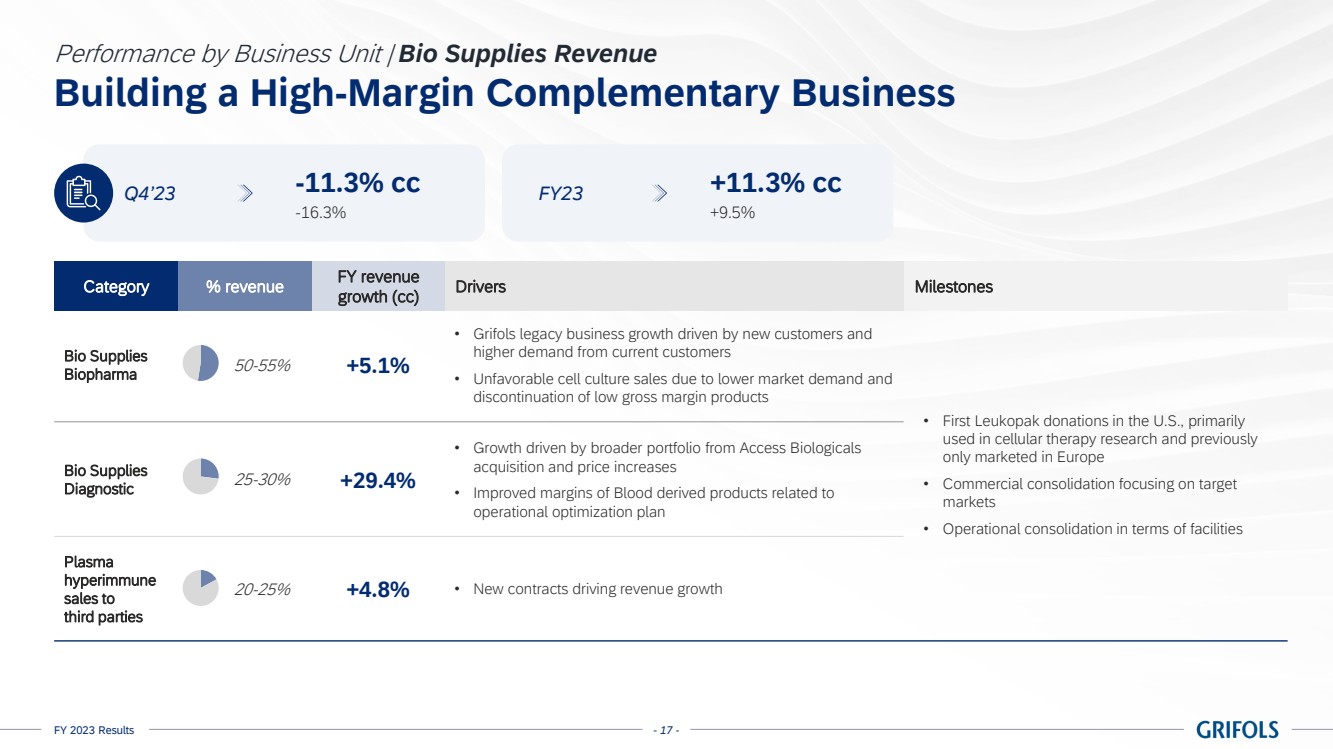
| FY 2023 Results - 17 -
Building a High-Margin Complementary Business
Performance by Business Unit | Bio Supplies Revenue
-16.3%
-11.3% cc Q4’23
+9.5%
+11.3% cc FY23
Bio Supplies
Biopharma 50-55% +5.1%
• Grifols legacy business growth driven by new customers and
higher demand from current customers
• Unfavorable cell culture sales due to lower market demand and
discontinuation of low gross margin products
• First Leukopak donations in the U.S., primarily
used in cellular therapy research and previously
only marketed in Europe
• Commercial consolidation focusing on target
markets
• Operational consolidation in terms of facilities
Bio Supplies
Diagnostic 25-30% +29.4%
• Growth driven by broader portfolio from Access Biologicals
acquisition and price increases
• Improved margins of Blood derived products related to
operational optimization plan
Plasma
hyperimmune
sales to
third parties
20-25% +4.8% • New contracts driving revenue growth
Category % revenue FY revenue
growth (cc) Drivers Milestones |

| FY 2023 Results - 18 -
1. A Record Year
2. Performance by Business Unit
3. Financial Performance
4. Final Remarks
5. Annex
FY 2023 Results |
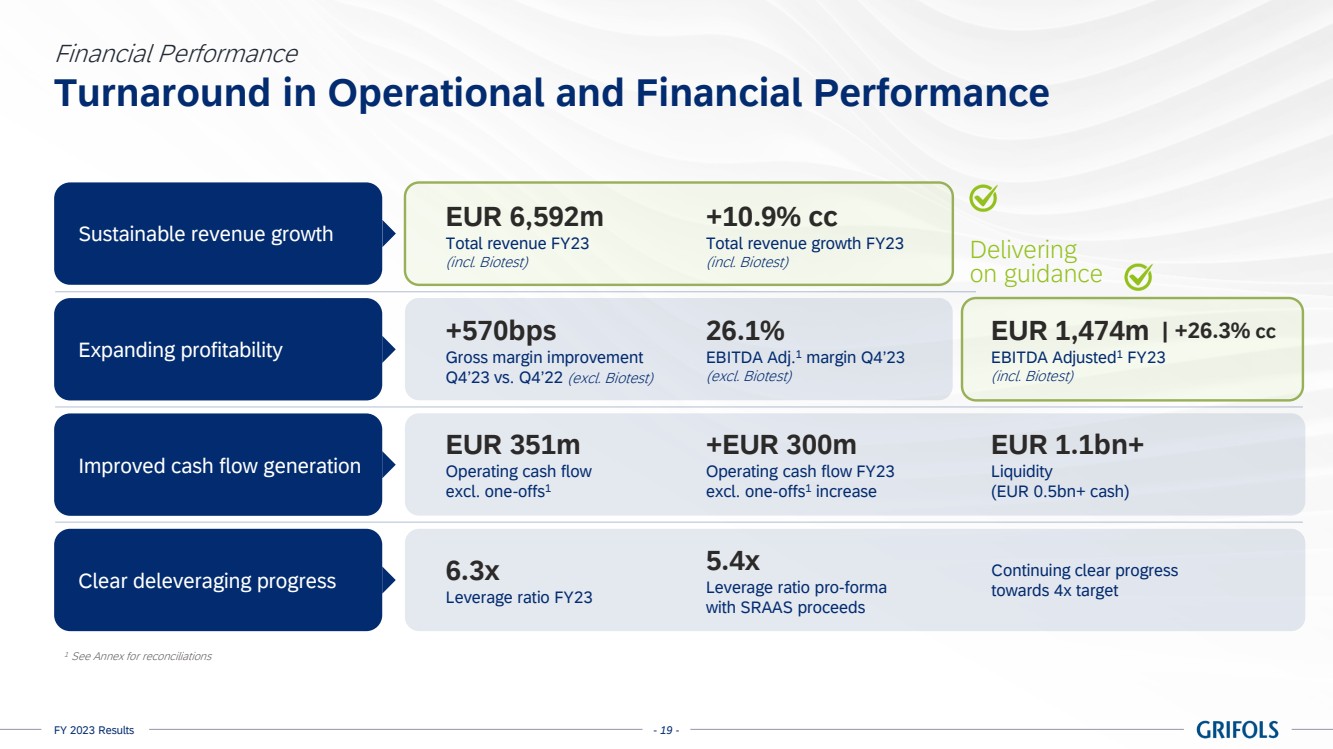
| FY 2023 Results - 19 -
Turnaround in Operational and Financial Performance
Financial Performance
Sustainable revenue growth
Improved cash flow generation
Expanding profitability
Clear deleveraging progress
EUR 6,592m
Total revenue FY23
(incl. Biotest)
+10.9% cc
Total revenue growth FY23
(incl. Biotest)
+570bps
Gross margin improvement
Q4’23 vs. Q4’22 (excl. Biotest)
26.1%
EBITDA Adj.1 margin Q4’23
(excl. Biotest)
EUR 351m
Operating cash flow
excl. one-offs1
+EUR 300m
Operating cash flow FY23
excl. one-offs1
increase
1 See Annex for reconciliations
6.3x
Leverage ratio FY23
5.4x
Leverage ratio pro-forma
with SRAAS proceeds
EUR 1.1bn+
Liquidity
(EUR 0.5bn+ cash)
Continuing clear progress
towards 4x target
Delivering
on guidance
EUR 1,474m
EBITDA Adjusted1 FY23
(incl. Biotest)
| +26.3% cc |
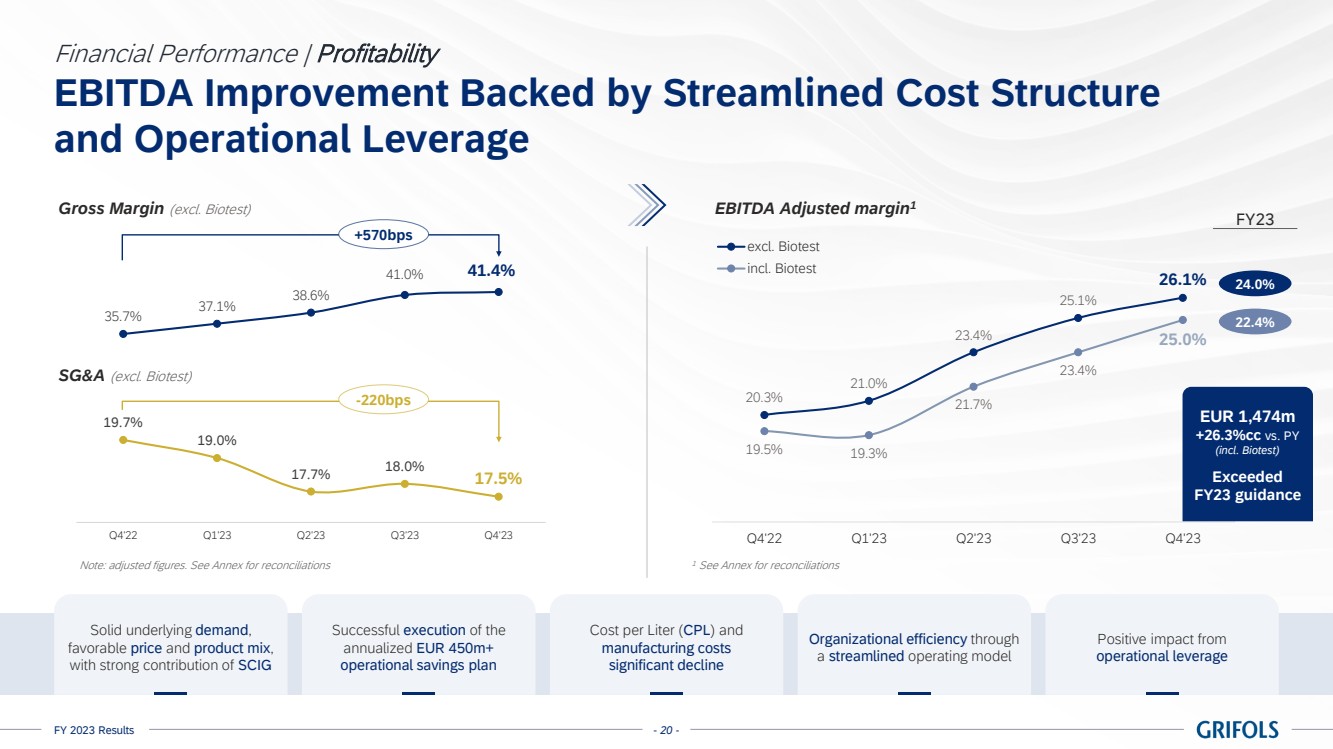
| FY 2023 Results - 20 -
EBITDA Improvement Backed by Streamlined Cost Structure
and Operational Leverage
Financial Performance | Profitability
Gross Margin (excl. Biotest) EBITDA Adjusted margin1
35.7%
37.1%
38.6%
41.0% 41.4%
35.0%
39.0%
Q4'22 Q1'23 Q2'23 Q3'23 Q4'22
SG&A (excl. Biotest)
19.7%
19.0%
17.7% 18.0%
17.5%
16.5%
Q4'22 Q1'23 Q2'23 Q3'23 Q4'23
+570bps
-220bps 20.3%
21.0%
23.4%
25.1%
26.1%
19.5% 19.3%
21.7%
23.4%
25.0%
15.0%
17.0%
19.0%
21.0%
23.0%
25.0%
27.0%
Q4'22 Q1'23 Q2'23 Q3'23 Q4'23
excl. Biotest
incl. Biotest
EUR 1,474m
+26.3%cc vs. PY
(incl. Biotest)
Exceeded
FY23 guidance
Solid underlying demand,
favorable price and product mix,
with strong contribution of SCIG
Successful execution of the
annualized EUR 450m+
operational savings plan
Cost per Liter (CPL) and
manufacturing costs
significant decline
Organizational efficiency through
a streamlined operating model
Positive impact from
operational leverage
Note: adjusted figures. See Annex for reconciliations
1 See Annex for reconciliations
24.0%
22.4%
FY23 |
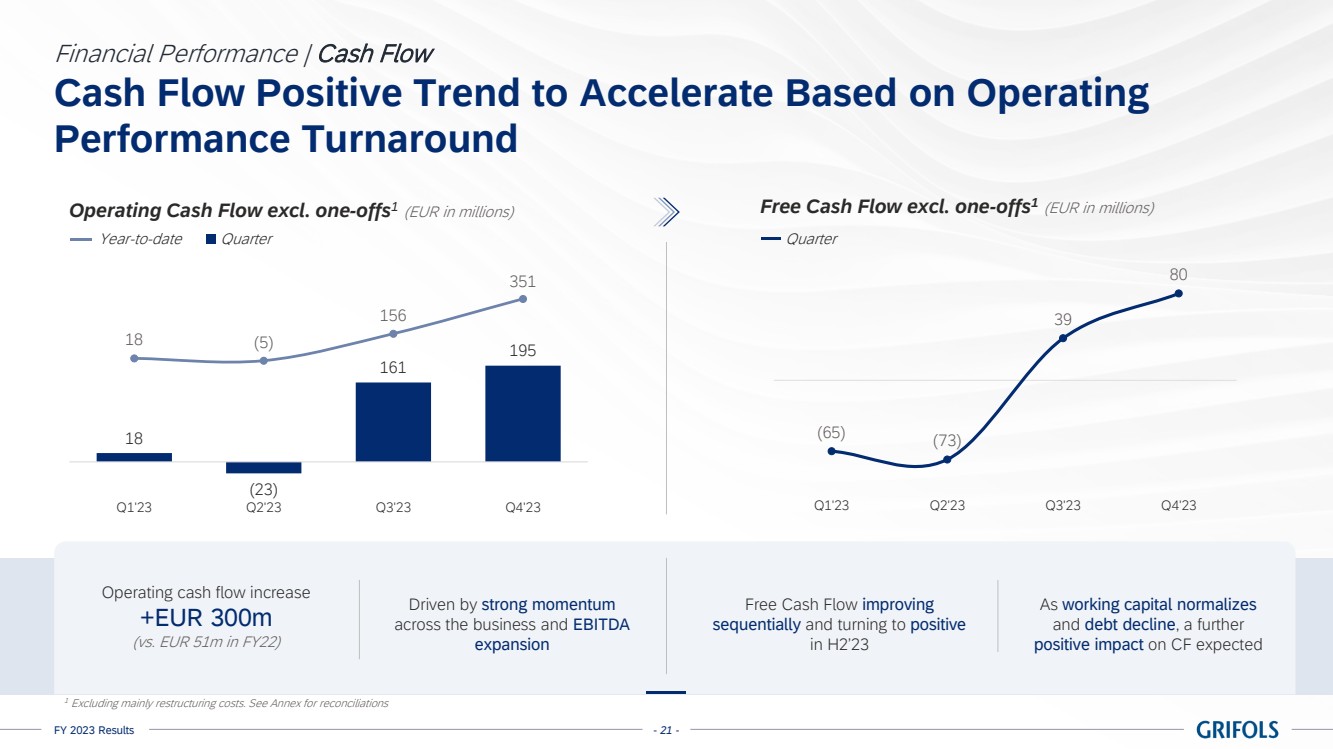
| FY 2023 Results - 21 -
Cash Flow Positive Trend to Accelerate Based on Operating
Performance Turnaround
Financial Performance | Cash Flow
Year-to-date Quarter
18
(23)
161
195
Q1'23 Q2'23 Q3'23 Q4'23
18 (5)
156
351
Operating Cash Flow excl. one-offs1
(EUR in millions) Free Cash Flow excl. one-offs1
(EUR in millions)
Quarter
(65) (73)
39
80
Q1'23 Q2'23 Q3'23 Q4'23
1 Excluding mainly restructuring costs. See Annex for reconciliations
Driven by strong momentum
across the business and EBITDA
expansion
Free Cash Flow improving
sequentially and turning to positive
in H2’23
Operating cash flow increase
+EUR 300m
(vs. EUR 51m in FY22)
As working capital normalizes
and debt decline, a further
positive impact on CF expected |

| FY 2023 Results - 22 -
Continuing Clear Progress Towards 4x Target
Financial Performance | Deleveraging
7.1x
6.3x
5.4x
0.8x
0.9x
LTM Q4'22 EBITDA Improvement LTM Q4'23 SRAAS Proceeds LTM Q4'23
Pro forma
Leverage ratio (as per the Credit Agreement)
Liquidity
EUR 1.1bn+
Cash and cash equivalents
EUR 0.5bn+
• 0.8x organic leverage reduction
based on EBITDA expansion
• Liquidity of EUR 1.1bn+; EUR
0.5bn+ cash and EUR 0.7bn RCF
undrawn credit lines
• Proceeds from the 20% SRAAS disinvestments will be fully utilized in repaying debt and
reducing leverage
• Expecting to address its 2025 maturities in H1 2024 and will seek to do this in an efficient
manner, taking into account both the planned disposal proceeds and the various other
options available to the company, including refinancing these maturities whilst remaining
consistent with its deleveraging objectives
1 See Annex for reconciliations |
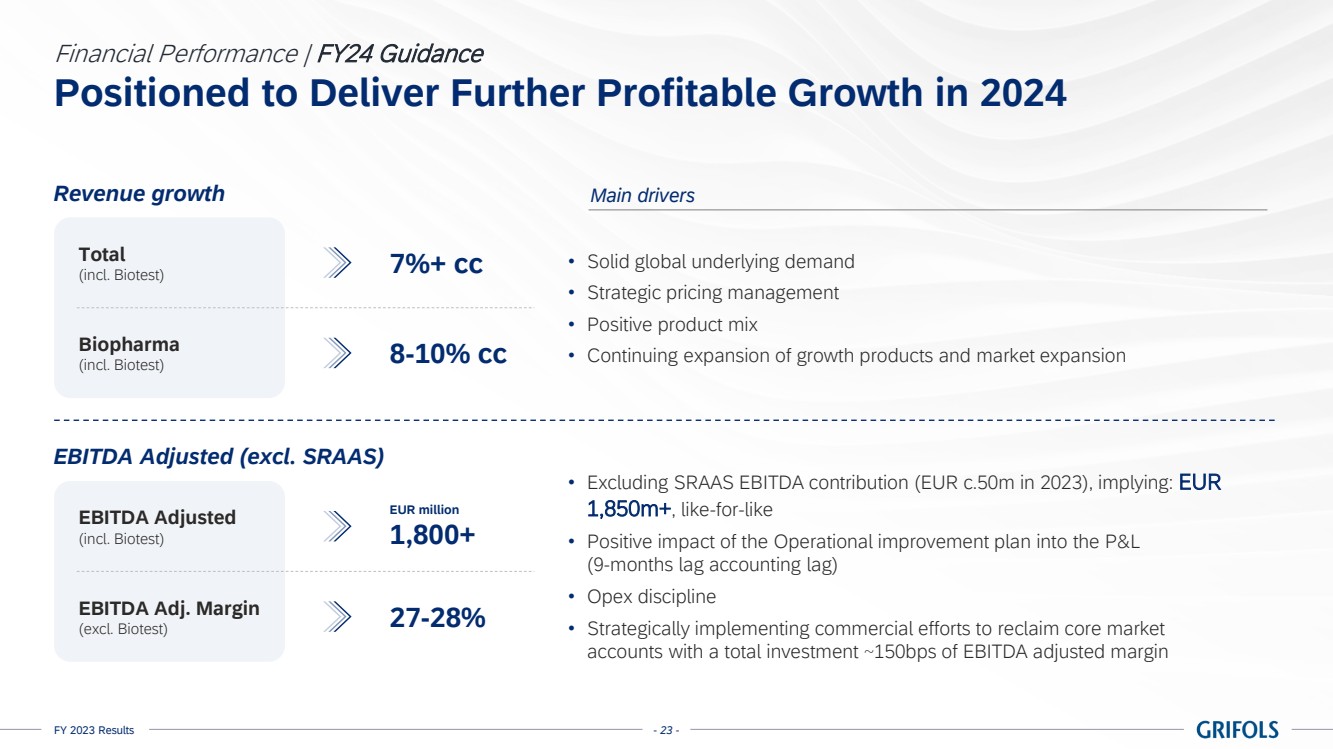
| FY 2023 Results - 23 -
Positioned to Deliver Further Profitable Growth in 2024
Financial Performance | FY24 Guidance
Revenue growth Main drivers
• Solid global underlying demand
• Strategic pricing management
• Positive product mix
• Continuing expansion of growth products and market expansion
Total
(incl. Biotest)
Biopharma
(incl. Biotest)
7%+ cc
8-10% cc
EBITDA Adjusted (excl. SRAAS)
• Excluding SRAAS EBITDA contribution (EUR c.50m in 2023), implying: EUR
1,850m+, like-for-like
• Positive impact of the Operational improvement plan into the P&L
(9-months lag accounting lag)
• Opex discipline
• Strategically implementing commercial efforts to reclaim core market
accounts with a total investment ~150bps of EBITDA adjusted margin
EBITDA Adjusted
(incl. Biotest)
EBITDA Adj. Margin
(excl. Biotest)
EUR million
1,800+
27-28% |

| FY 2023 Results - 24 -
Table of Contents
1. A Record Year
5. Annex
2. Performance by Business Unit
3. Financial Performance
4. Final Remarks
FY 2023 Results - 24 - |
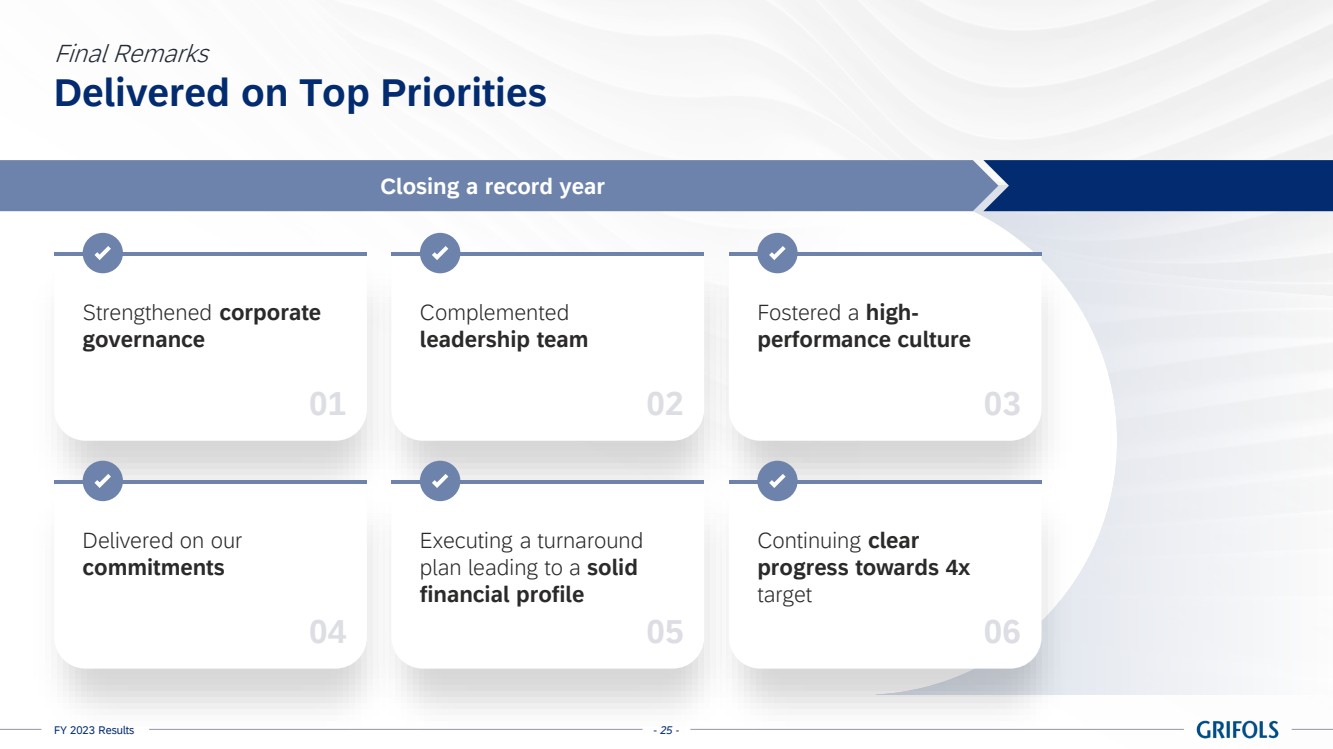
| FY 2023 Results - 25 -
Delivered on Top Priorities
Final Remarks
Closing a record year
Strengthened corporate
governance
Delivered on our
commitments
Complemented
leadership team
Executing a turnaround
plan leading to a solid
financial profile
Fostered a high-performance culture
Continuing clear
progress towards 4x
target
01
04
02
05
03
06 |
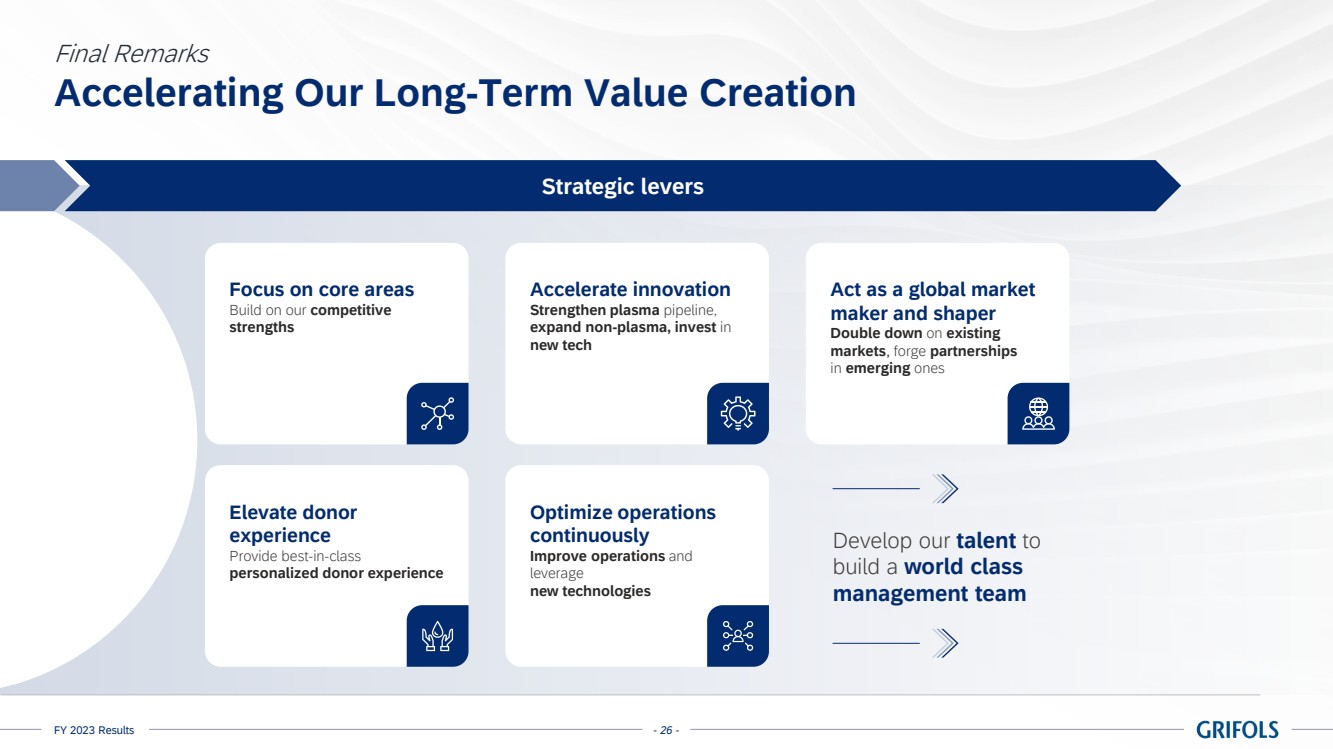
| FY 2023 Results - 26 -
Accelerating Our Long-Term Value Creation
Final Remarks
Strategic levers
Act as a global market
maker and shaper
Double down on existing
markets, forge partnerships
in emerging ones
Accelerate innovation
Strengthen plasma pipeline,
expand non-plasma, invest in
new tech
Focus on core areas
Build on our competitive
strengths
Optimize operations
continuously
Improve operations and
leverage
new technologies
Elevate donor
experience
Provide best-in-class
personalized donor experience
Develop our talent to
build a world class
management team |
| 1. A Record Year
2. Performance by Business Unit
3. Financial Performance
- 27 -
5. Annex
4. Final Remarks
5.1. Sustainability
5.2. Financials
FY 2023 Results |

| FY 2023 Results - 28 -
C
o
mmitment to donors
and patients
Impact on
society
Environment
responsibility
Our people
Ethical Commitment
Innovation
Ambition Setting our Sustainability Roadmap and Commitment with SDGs
Sustainability | Our Sustainability Plan
Healthier and wealthier society by
advancing social progress,
supporting organizations and
actively engaging with local
communities
Ongoing efforts to drive diversity,
continuous development, equal
opportunities, gender equality and
overall employee well-being across
our global talent pool
Solid community where all donors
understand their impact and feel
valued for their commitment beyond
compensation, and where all patients
receive the treatment, they need
Promoting the common good by
fostering healthy environments
where people can live, work and play,
and by raising awareness on the need
to protect the planet
Placing human rights at the core of our practices by integrating the highest ethical
standards throughout the supply chain
Scientific progress that, guided by our pioneering spirit, addresses the needs of
patients and protects the rights, safety and well-being of clinical-trial participants |
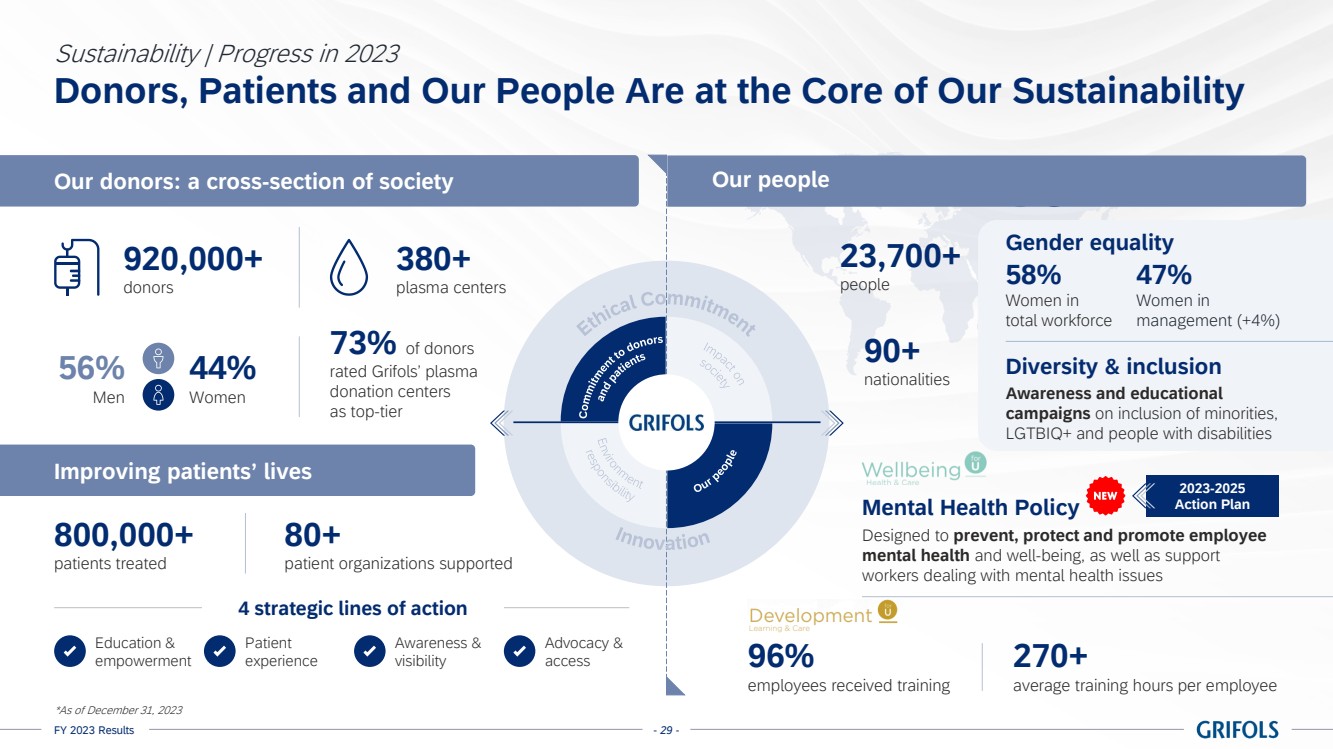
| FY 2023 Results - 29 -
Donors, Patients and Our People Are at the Core of Our Sustainability
Sustainability | Progress in 2023
Ethical Commitment
Innovation
Commitment to donors
and patients
Impact on
society
Environment
responsibility
Our people
23,700+
people
90+
nationalities
58%
Women in
total workforce
47%
Women in
management (+4%)
Gender equality
96%
employees received training
270+
average training hours per employee
2023-2025
Mental Health Policy Action Plan
Designed to prevent, protect and promote employee
mental health and well-being, as well as support
workers dealing with mental health issues
Our donors: a cross-section of society
Improving patients’ lives
920,000+
donors
380+
plasma centers
56%
Men
44%
Women
73% of donors
rated Grifols’ plasma
donation centers
as top-tier
800,000+
patients treated
80+
patient organizations supported
4 strategic lines of action
Education &
empowerment
Awareness &
visibility
Patient
experience
Advocacy &
access
*As of December 31, 2023
Our people
Diversity & inclusion
Awareness and educational
campaigns on inclusion of minorities,
LGTBIQ+ and people with disabilities |
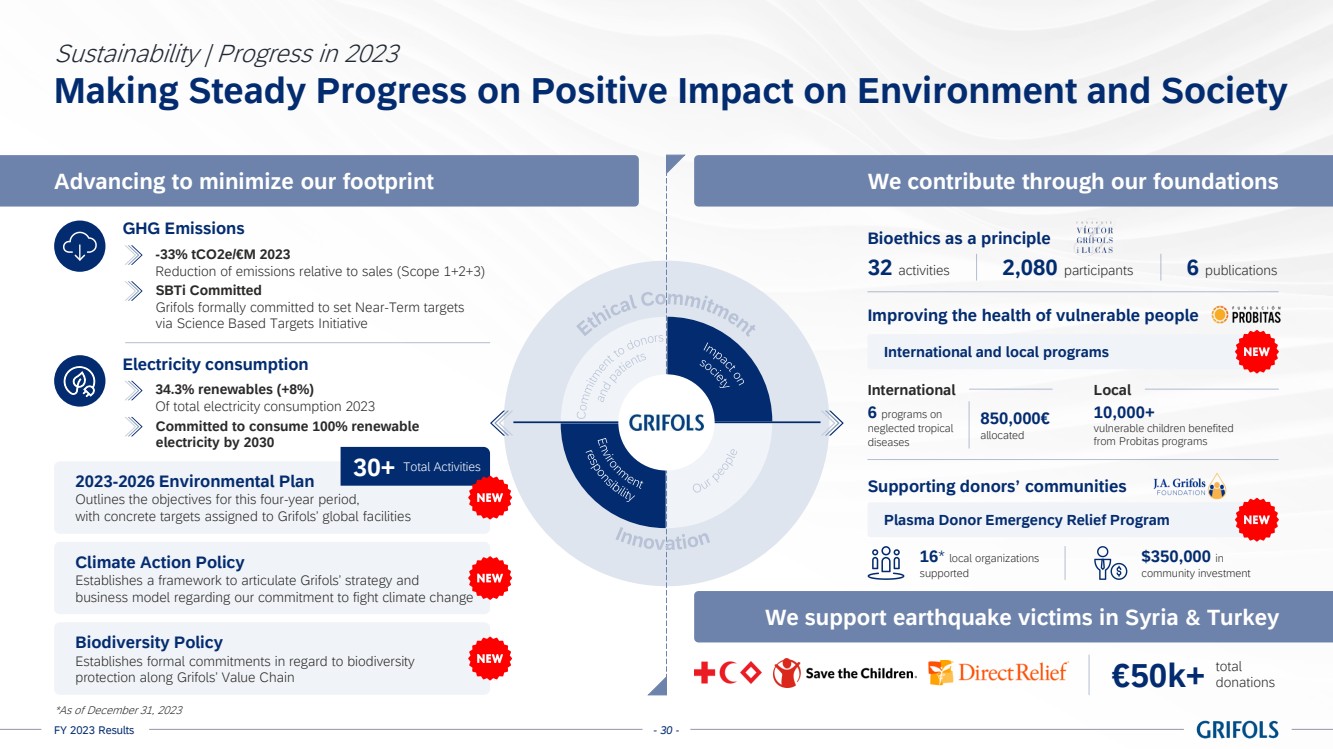
| FY 2023 Results - 30 -
Ethical Commitment
Innovation
C
o
mmitment to donors
and patients
Impact on
society
Environment
responsibility
Our people
Making Steady Progress on Positive Impact on Environment and Society
Sustainability | Progress in 2023
Advancing to minimize our footprint We contribute through our foundations
GHG Emissions
-33% tCO2e/€M 2023
Reduction of emissions relative to sales (Scope 1+2+3)
SBTi Committed
Grifols formally committed to set Near-Term targets
via Science Based Targets Initiative
2023-2026 Environmental Plan
Outlines the objectives for this four-year period,
with concrete targets assigned to Grifols’ global facilities
Climate Action Policy
Establishes a framework to articulate Grifols’ strategy and
business model regarding our commitment to fight climate change
Biodiversity Policy
Establishes formal commitments in regard to biodiversity
protection along Grifols’ Value Chain
30+ Total Activities
Electricity consumption
34.3% renewables (+8%)
Of total electricity consumption 2023
Committed to consume 100% renewable
electricity by 2030
*As of December 31, 2023
€50k+ total
donations
We support earthquake victims in Syria & Turkey
Improving the health of vulnerable people
International and local programs
6 programs on
neglected tropical
diseases
International
10,000+
vulnerable children benefited
from Probitas programs
Local
850,000€
allocated
Supporting donors’ communities
Plasma Donor Emergency Relief Program
16* local organizations
supported
$350,000 in
community investment
Bioethics as a principle
32 activities 2,080 participants 6 publications |
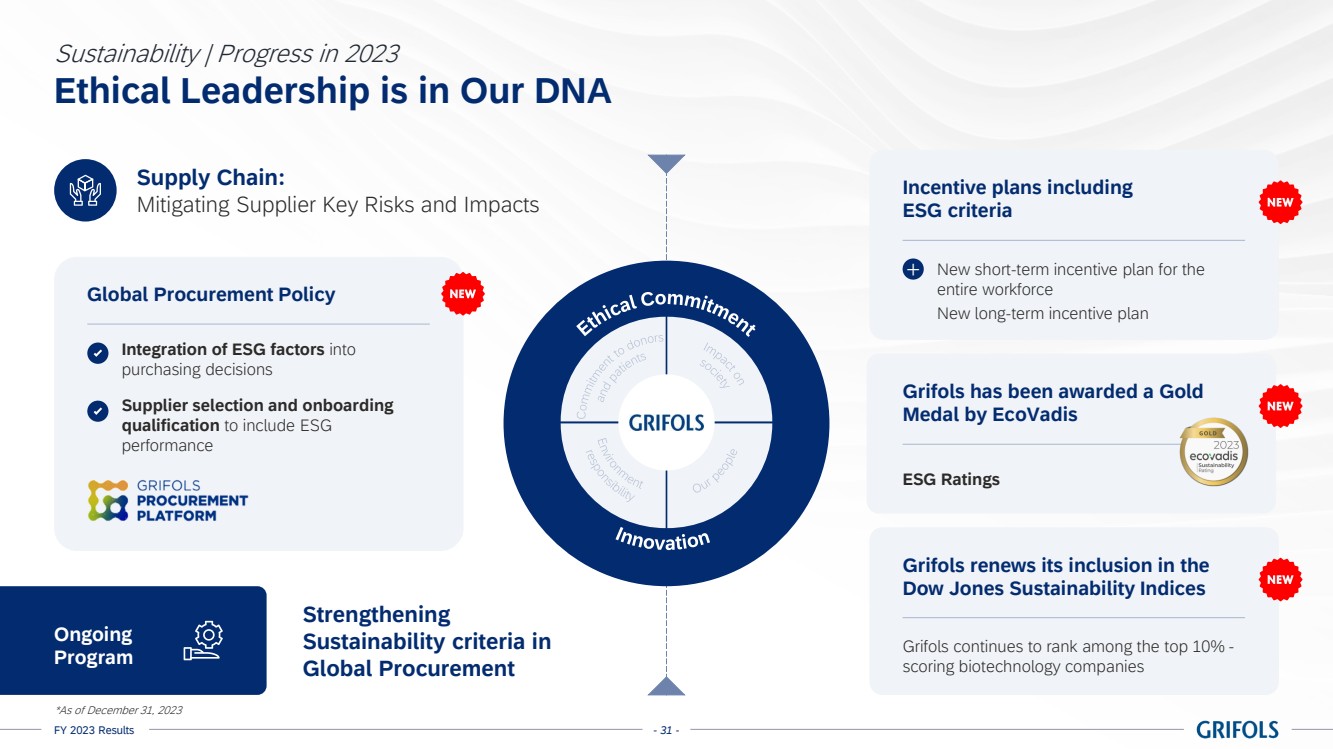
| FY 2023 Results - 31 -
Ethical Leadership is in Our DNA
Sustainability | Progress in 2023
Ethical Commitment
Innovation
C
o
mmitment to donors
and patients
Impact on
society
Environment
responsibility
Our people
Supplier selection and onboarding
qualification to include ESG
performance
Global Procurement Policy
Integration of ESG factors into
purchasing decisions
ESG Ratings
Grifols has been awarded a Gold
Medal by EcoVadis
Incentive plans including
ESG criteria
New short-term incentive plan for the
entire workforce
New long-term incentive plan
+
Grifols renews its inclusion in the
Dow Jones Sustainability Indices
Grifols continues to rank among the top 10% -
scoring biotechnology companies
Ongoing
Program
Strengthening
Sustainability criteria in
Global Procurement
Supply Chain:
Mitigating Supplier Key Risks and Impacts
*As of December 31, 2023 |
| 1. A Record Year
2. Performance by Business Unit
3. Financial Performance
Q4 2023 Results - 32 -
5. Annex
4. Final Remarks
5.1. Sustainability
5.2. Financials |
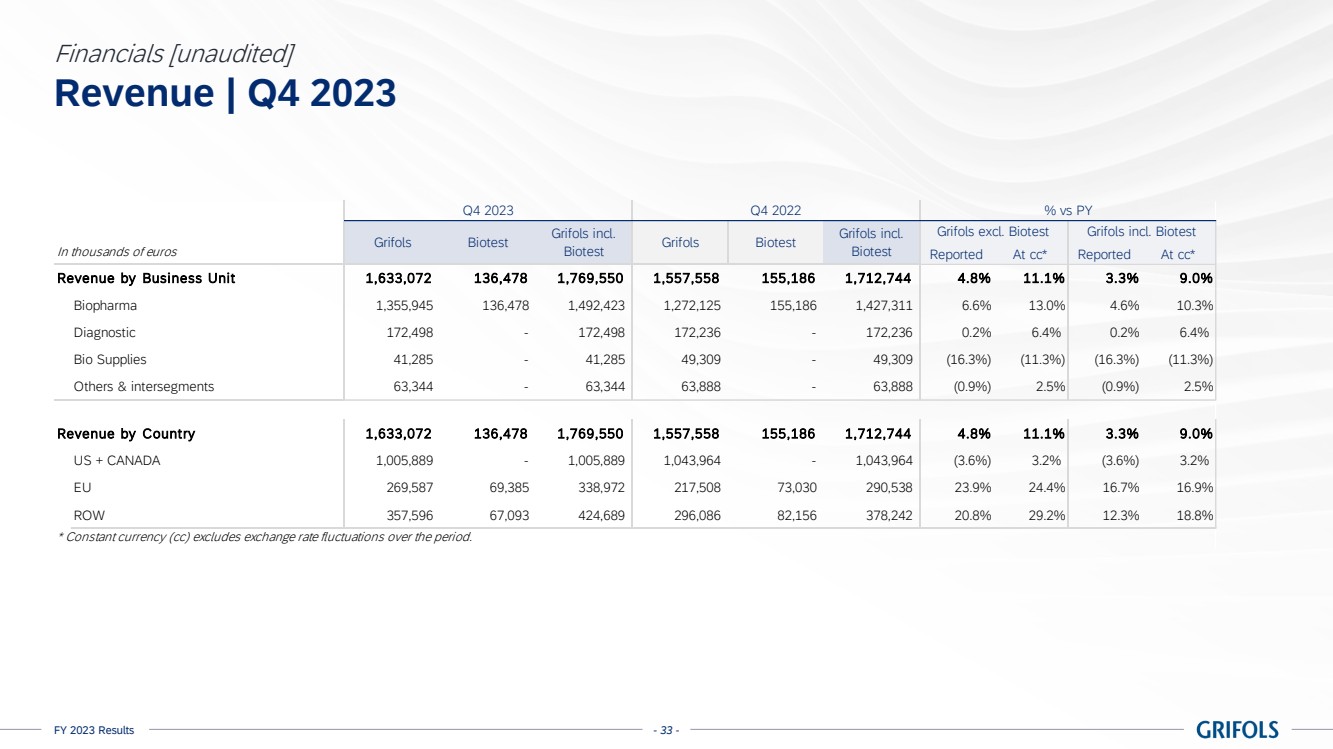
| FY 2023 Results - 33 -
Revenue | Q4 2023
Financials [unaudited]
In thousands of euros Reported At cc* Reported At cc*
Revenue by Business Unit 1,633,072 136,478 1,769,550 1,557,558 155,186 1,712,744 4.8% 11.1% 3.3% 9.0%
Biopharma 1,355,945 136,478 1,492,423 1,272,125 155,186 1,427,311 6.6% 13.0% 4.6% 10.3%
Diagnostic 172,498 - 172,498 172,236 - 172,236 0.2% 6.4% 0.2% 6.4%
Bio Supplies 41,285 - 41,285 49,309 - 49,309 (16.3%) (11.3%) (16.3%) (11.3%)
Others & intersegments 63,344 - 63,344 63,888 - 63,888 (0.9%) 2.5% (0.9%) 2.5%
Revenue by Country 1,633,072 136,478 1,769,550 1,557,558 155,186 1,712,744 4.8% 11.1% 3.3% 9.0%
US + CANADA 1,005,889 - 1,005,889 1,043,964 - 1,043,964 (3.6%) 3.2% (3.6%) 3.2%
E U 269,587 69,385 338,972 217,508 73,030 290,538 23.9% 24.4% 16.7% 16.9%
ROW 357,596 67,093 424,689 296,086 82,156 378,242 20.8% 29.2% 12.3% 18.8%
* Constant currency (cc) excludes exchange rate fluctuations over the period.
Q4 2023 % vs PY
Grifols Biotest Grifols incl.
Biotest
Q4 2022
Grifols Biotest Grifols incl. Grifols excl. Biotest Grifols incl. Biotest
Biotest |
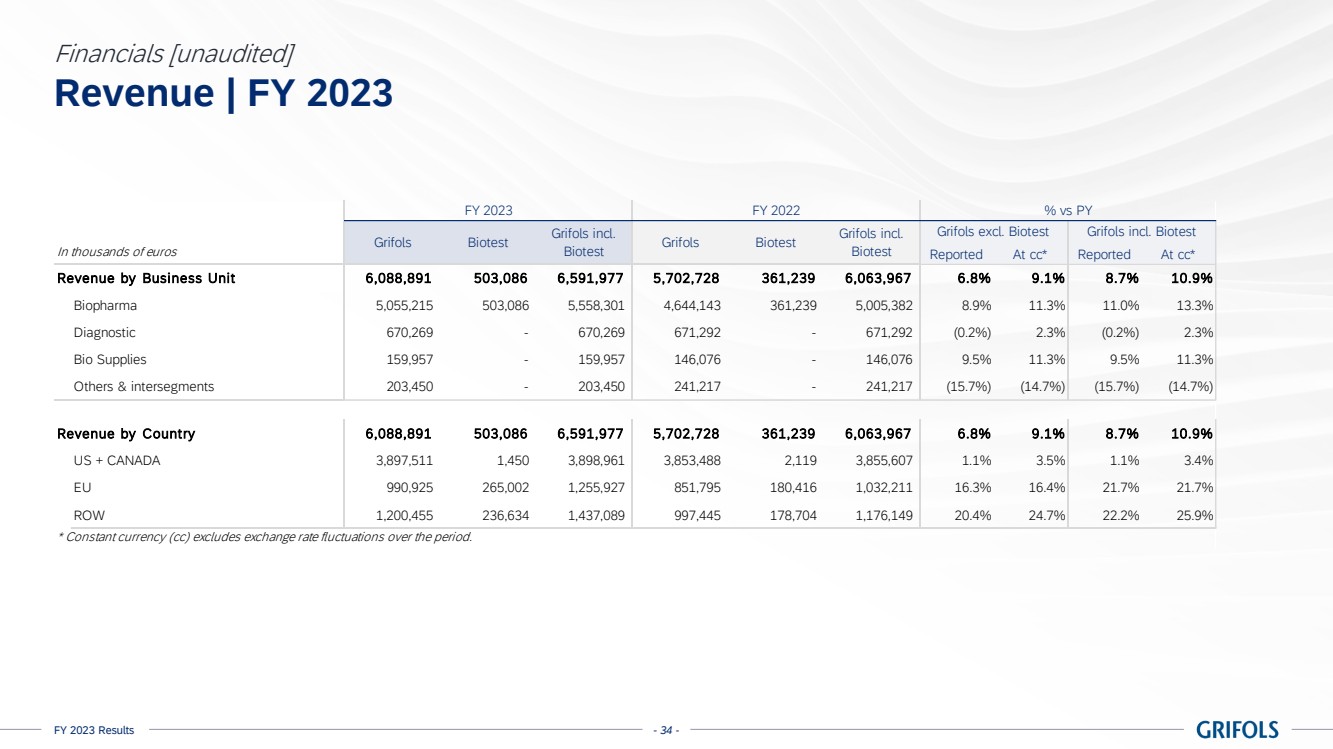
| FY 2023 Results - 34 -
Revenue | FY 2023
In thousands of euros Reported At cc* Reported At cc*
Revenue by Business Unit 6,088,891 503,086 6,591,977 5,702,728 361,239 6,063,967 6.8% 9.1% 8.7% 10.9%
Biopharma 5,055,215 503,086 5,558,301 4,644,143 361,239 5,005,382 8.9% 11.3% 11.0% 13.3%
Diagnostic 670,269 - 670,269 671,292 - 671,292 (0.2%) 2.3% (0.2%) 2.3%
Bio Supplies 159,957 - 159,957 146,076 - 146,076 9.5% 11.3% 9.5% 11.3%
Others & intersegments 203,450 - 203,450 241,217 - 241,217 (15.7%) (14.7%) (15.7%) (14.7%)
Revenue by Country 6,088,891 503,086 6,591,977 5,702,728 361,239 6,063,967 6.8% 9.1% 8.7% 10.9%
US + CANADA 3,897,511 1,450 3,898,961 3,853,488 2,119 3,855,607 1.1% 3.5% 1.1% 3.4%
E U 990,925 265,002 1,255,927 851,795 180,416 1,032,211 16.3% 16.4% 21.7% 21.7%
ROW 1,200,455 236,634 1,437,089 997,445 178,704 1,176,149 20.4% 24.7% 22.2% 25.9%
* Constant currency (cc) excludes exchange rate fluctuations over the period.
FY 2023 FY 2022 % vs PY
Grifols incl.
Biotest
Grifols excl. Biotest Grifols incl. Biotest
Grifols Biotest Grifols incl.
Biotest Grifols Biotest
Financials [unaudited] |
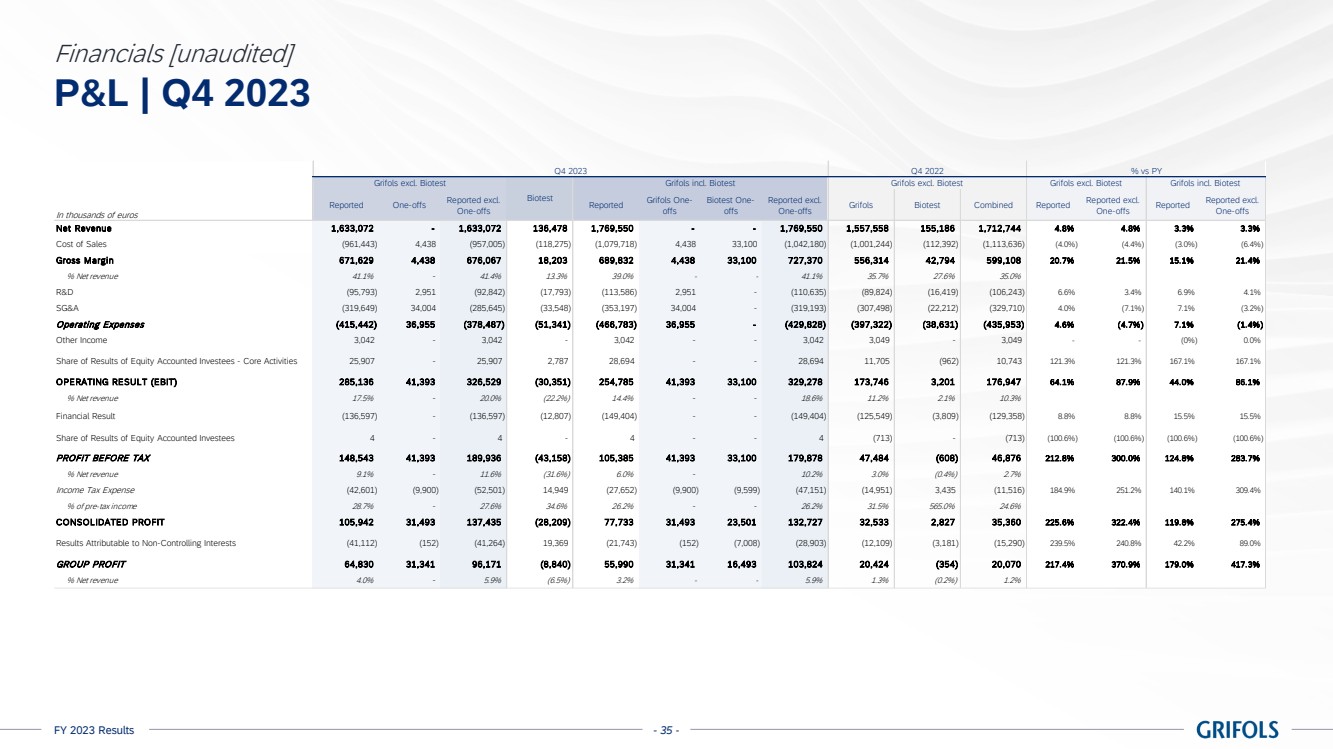
| FY 2023 Results - 35 -
P&L | Q4 2023
Financials [unaudited]
In thousands of euros
Reported One-offs Reported excl.
One-offs Reported Grifols One-offs
Biotest One-offs
Reported excl.
One-offs Grifols Biotest Combined Reported Reported excl.
One-offs Reported Reported excl.
One-offs
Net Revenue 1,633,072 - 1,633,072 136,478 1,769,550 - - 1,769,550 1,557,558 155,186 1,712,744 4.8% 4.8% 3.3% 3.3%
Cost of Sales (961,443) 4,438 (957,005) (118,275) (1,079,718) 4,438 33,100 (1,042,180) (1,001,244) (112,392) (1,113,636) (4.0%) (4.4%) (3.0%) (6.4%)
Gross Margin 671,629 4,438 676,067 18,203 689,832 4,438 33,100 727,370 556,314 42,794 599,108 20.7% 21.5% 15.1% 21.4%
% Net revenue 41.1% - 41.4% 13.3% 39.0% - - 41.1% 35.7% 27.6% 35.0%
R&D (95,793) 2,951 (92,842) (17,793) (113,586) 2,951 - (110,635) (89,824) (16,419) (106,243) 6.6% 3.4% 6.9% 4.1%
SG&A (319,649) 34,004 (285,645) (33,548) (353,197) 34,004 - (319,193) (307,498) (22,212) (329,710) 4.0% (7.1%) 7.1% (3.2%)
Operating Expenses (415,442) 36,955 (378,487) (51,341) (466,783) 36,955 - (429,828) (397,322) (38,631) (435,953) 4.6% (4.7%) 7.1% (1.4%)
Other Income 3,042 - 3,042 - 3,042 - - 3,042 3,049 - 3,049 - - (0%) 0.0%
25,907 - 25,907 2,787 28,694 - - 28,694 11,705 (962) 10,743 121.3% 121.3% 167.1% 167.1%
OPERATING RESULT (EBIT) 285,136 41,393 326,529 (30,351) 254,785 41,393 33,100 329,278 173,746 3,201 176,947 64.1% 87.9% 44.0% 86.1%
% Net revenue 17.5% - 20.0% (22.2%) 14.4% - - 18.6% 11.2% 2.1% 10.3%
Financial Result (136,597) - (136,597) (12,807) (149,404) - - (149,404) (125,549) (3,809) (129,358) 8.8% 8.8% 15.5% 15.5%
4 - 4 - 4 - - 4 (713) - (713) (100.6%) (100.6%) (100.6%) (100.6%)
PROFIT BEFORE TAX 148,543 41,393 189,936 (43,158) 105,385 41,393 33,100 179,878 47,484 (608) 46,876 212.8% 300.0% 124.8% 283.7%
% Net revenue 9.1% - 11.6% (31.6%) 6.0% - 10.2% 3.0% (0.4%) 2.7%
Income Tax Expense (42,601) (9,900) (52,501) 14,949 (27,652) (9,900) (9,599) (47,151) (14,951) 3,435 (11,516) 184.9% 251.2% 140.1% 309.4%
% of pre-tax income 28.7% - 27.6% 34.6% 26.2% - - 26.2% 31.5% 565.0% 24.6%
CONSOLIDATED PROFIT 105,942 31,493 137,435 (28,209) 77,733 31,493 23,501 132,727 32,533 2,827 35,360 225.6% 322.4% 119.8% 275.4%
Results Attributable to Non-Controlling Interests (41,112) (152) (41,264) 19,369 (21,743) (152) (7,008) (28,903) (12,109) (3,181) (15,290) 239.5% 240.8% 42.2% 89.0%
GROUP PROFIT 64,830 31,341 96,171 (8,840) 55,990 31,341 16,493 103,824 20,424 (354) 20,070 217.4% 370.9% 179.0% 417.3%
% Net revenue 4.0% - 5.9% (6.5%) 3.2% - - 5.9% 1.3% (0.2%) 1.2%
Share of Results of Equity Accounted Investees
Share of Results of Equity Accounted Investees - Core Activities
Grifols excl. Biotest Grifols excl. Biotest Grifols incl. Biotest
% vs PY
Grifols incl. Biotest
Q4 2023
Biotest
Grifols excl. Biotest
Q4 2022 |
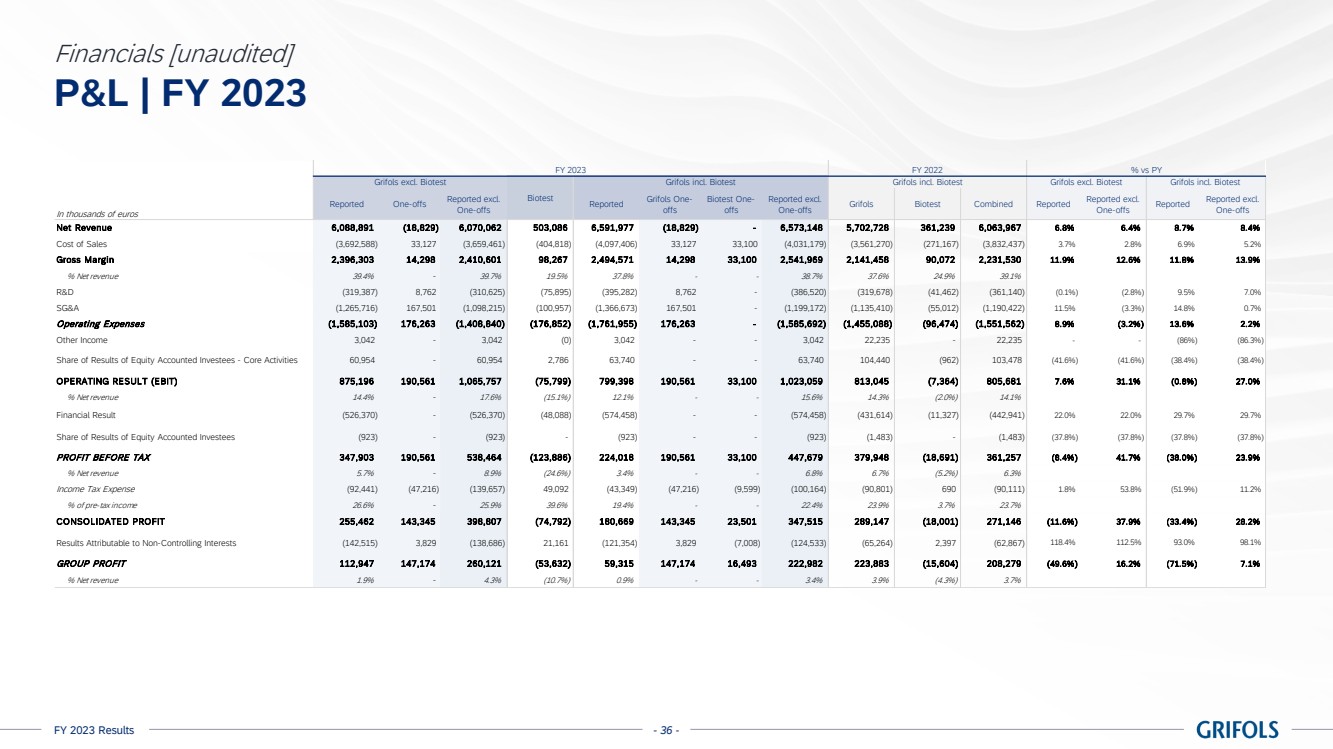
| FY 2023 Results - 36 -
P&L | FY 2023
Financials [unaudited]
In thousands of euros
Reported One-offs Reported excl.
One-offs Reported Grifols One-offs
Biotest One-offs
Reported excl.
One-offs Grifols Biotest Combined Reported Reported excl.
One-offs Reported Reported excl.
One-offs
Net Revenue 6,088,891 (18,829) 6,070,062 503,086 6,591,977 (18,829) - 6,573,148 5,702,728 361,239 6,063,967 6.8% 6.4% 8.7% 8.4%
Cost of Sales (3,692,588) 33,127 (3,659,461) (404,818) (4,097,406) 33,127 33,100 (4,031,179) (3,561,270) (271,167) (3,832,437) 3.7% 2.8% 6.9% 5.2%
Gross Margin 2,396,303 14,298 2,410,601 98,267 2,494,571 14,298 33,100 2,541,969 2,141,458 90,072 2,231,530 11.9% 12.6% 11.8% 13.9%
% Net revenue 39.4% - 39.7% 19.5% 37.8% - - 38.7% 37.6% 24.9% 39.1%
R&D (319,387) 8,762 (310,625) (75,895) (395,282) 8,762 - (386,520) (319,678) (41,462) (361,140) (0.1%) (2.8%) 9.5% 7.0%
SG&A (1,265,716) 167,501 (1,098,215) (100,957) (1,366,673) 167,501 - (1,199,172) (1,135,410) (55,012) (1,190,422) 11.5% (3.3%) 14.8% 0.7%
Operating Expenses (1,585,103) 176,263 (1,408,840) (176,852) (1,761,955) 176,263 - (1,585,692) (1,455,088) (96,474) (1,551,562) 8.9% (3.2%) 13.6% 2.2%
Other Income 3,042 - 3,042 (0) 3,042 - - 3,042 22,235 - 22,235 - - (86%) (86.3%)
60,954 - 60,954 2,786 63,740 - - 63,740 104,440 (962) 103,478 (41.6%) (41.6%) (38.4%) (38.4%)
OPERATING RESULT (EBIT) 875,196 190,561 1,065,757 (75,799) 799,398 190,561 33,100 1,023,059 813,045 (7,364) 805,681 7.6% 31.1% (0.8%) 27.0%
% Net revenue 14.4% - 17.6% (15.1%) 12.1% - - 15.6% 14.3% (2.0%) 14.1%
Financial Result (526,370) - (526,370) (48,088) (574,458) - - (574,458) (431,614) (11,327) (442,941) 22.0% 22.0% 29.7% 29.7%
(923) - (923) - (923) - - (923) (1,483) - (1,483) (37.8%) (37.8%) (37.8%) (37.8%)
PROFIT BEFORE TAX 347,903 190,561 538,464 (123,886) 224,018 190,561 33,100 447,679 379,948 (18,691) 361,257 (8.4%) 41.7% (38.0%) 23.9%
% Net revenue 5.7% - 8.9% (24.6%) 3.4% - - 6.8% 6.7% (5.2%) 6.3%
Income Tax Expense (92,441) (47,216) (139,657) 49,092 (43,349) (47,216) (9,599) (100,164) (90,801) 690 (90,111) 1.8% 53.8% (51.9%) 11.2%
% of pre-tax income 26.6% - 25.9% 39.6% 19.4% - - 22.4% 23.9% 3.7% 23.7%
CONSOLIDATED PROFIT 255,462 143,345 398,807 (74,792) 180,669 143,345 23,501 347,515 289,147 (18,001) 271,146 (11.6%) 37.9% (33.4%) 28.2%
Results Attributable to Non-Controlling Interests (142,515) 3,829 (138,686) 21,161 (121,354) 3,829 (7,008) (124,533) (65,264) 2,397 (62,867) 118.4% 112.5% 93.0% 98.1%
GROUP PROFIT 112,947 147,174 260,121 (53,632) 59,315 147,174 16,493 222,982 223,883 (15,604) 208,279 (49.6%) 16.2% (71.5%) 7.1%
% Net revenue 1.9% - 4.3% (10.7%) 0.9% - - 3.4% 3.9% (4.3%) 3.7%
% vs PY
Grifols excl. Biotest
Biotest
Grifols incl. Biotest Grifols excl. Biotest Grifols incl. Biotest
Share of Results of Equity Accounted Investees - Core Activities
Share of Results of Equity Accounted Investees
Grifols incl. Biotest
FY 2023 FY 2022 |
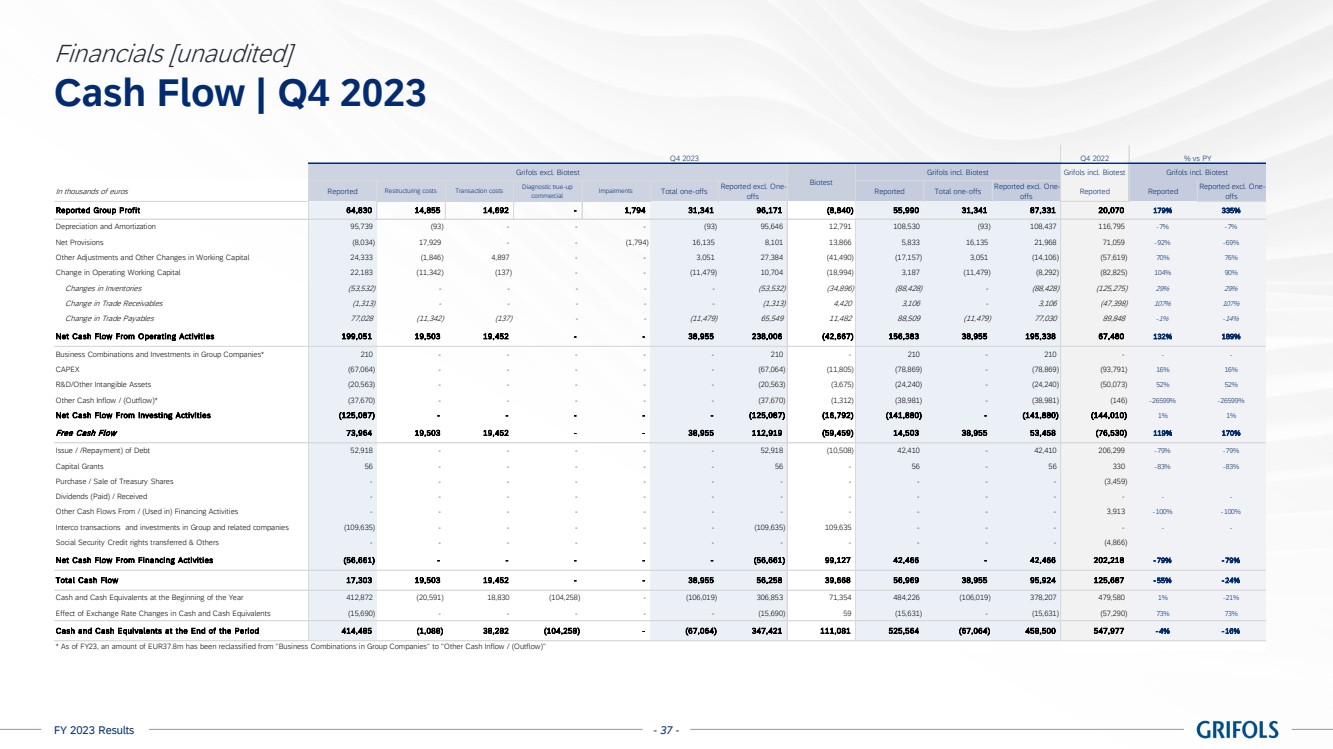
| FY 2023 Results - 37 -
Q4 2022
Grifols incl. Biotest
In thousands of euros Reported Restructuring costs Transaction costs Diagnostic true-up
commercial Impairments Total one-offs Reported excl. One-offs Reported Total one-offs Reported excl. One-offs Reported Reported Reported excl. One-offs
Reported Group Profit 64,830 14,855 14,692 - 1,794 31,341 96,171 (8,840) 55,990 31,341 87,331 20,070 179% 335%
Depreciation and Amortization 95,739 (93) - - - (93) 95,646 12,791 108,530 (93) 108,437 116,795 -7% -7%
Net Provisions (8,034) 17,929 - - (1,794) 16,135 8,101 13,866 5,833 16,135 21,968 71,059 -92% -69%
Other Adjustments and Other Changes in Working Capital 24,333 (1,846) 4,897 - - 3,051 27,384 (41,490) (17,157) 3,051 (14,106) (57,619) 70% 76%
Change in Operating Working Capital 22,183 (11,342) (137) - - (11,479) 10,704 (18,994) 3,187 (11,479) (8,292) (82,825) 104% 90%
Changes in Inventories (53,532) - - - - - (53,532) (34,896) (88,428) - (88,428) (125,275) 29% 29%
Change in Trade Receivables (1,313) - - - - - (1,313) 4,420 3,106 - 3,106 (47,398) 107% 107%
Change in Trade Payables 77,028 (11,342) (137) - - (11,479) 65,549 11,482 88,509 (11,479) 77,030 89,848 -1% -14%
Net Cash Flow From Operating Activities 199,051 19,503 19,452 - - 38,955 238,006 (42,667) 156,383 38,955 195,338 67,480 132% 189%
Business Combinations and Investments in Group Companies* 210 - - - - - 210 - 210 - 210 - - -
CAPEX (67,064) - - - - - (67,064) (11,805) (78,869) - (78,869) (93,791) 16% 16%
R&D/Other Intangible Assets (20,563) - - - - - (20,563) (3,675) (24,240) - (24,240) (50,073) 52% 52%
Other Cash Inflow / (Outflow)* (37,670) - - - - - (37,670) (1,312) (38,981) - (38,981) (146) -26599% -26599%
Net Cash Flow From Investing Activities (125,087) - - - - - (125,087) (16,792) (141,880) - (141,880) (144,010) 1% 1%
Free Cash Flow 73,964 19,503 19,452 - - 38,955 112,919 (59,459) 14,503 38,955 53,458 (76,530) 119% 170%
Issue / /Repayment) of Debt 52,918 - - - - - 52,918 (10,508) 42,410 - 42,410 206,299 -79% -79%
Capital Grants 56 - - - - - 56 - 56 - 56 330 -83% -83%
Purchase / Sale of Treasury Shares - - - - - - - - - - - (3,459)
Dividends (Paid) / Received - - - - - - - - - - - - - -
Other Cash Flows From / (Used in) Financing Activities - - - - - - - - - - - 3,913 -100% -100%
Interco transactions and investments in Group and related companies (109,635) - - - - - (109,635) 109,635 - - - - - -
Social Security Credit rights transferred & Others - - - - - - - - - - - (4,866)
Net Cash Flow From Financing Activities (56,661) - - - - - (56,661) 99,127 42,466 - 42,466 202,218 - 79% - 79%
Total Cash Flow 17,303 19,503 19,452 - - 38,955 56,258 39,668 56,969 38,955 95,924 125,687 - 55% - 24%
Cash and Cash Equivalents at the Beginning of the Year 412,872 (20,591) 18,830 (104,258) - (106,019) 306,853 71,354 484,226 (106,019) 378,207 479,580 1% -21%
Effect of Exchange Rate Changes in Cash and Cash Equivalents (15,690) - - - - - (15,690) 59 (15,631) - (15,631) (57,290) 73% 73%
Cash and Cash Equivalents at the End of the Period 414,485 (1,088) 38,282 (104,258) - (67,064) 347,421 111,081 525,564 (67,064) 458,500 547,977 - 4% - 16%
* As of FY23, an amount of EUR37.8m has been reclassified from "Business Combinations in Group Companies" to "Other Cash Inflow / (Outflow)"
Q4 2023 % vs PY
Grifols excl. Biotest
Biotest
Grifols incl. Biotest Grifols incl. Biotest
Cash Flow | Q4 2023
Financials [unaudited] |

| FY 2023 Results - 38 -
Cash Flow | FY 2023
Financials [unaudited]
FY 2022
Grifols incl. Biotest
In thousands of euros Reported Restructuring costs Transaction costs Diagnostic true-up
commercial Impairments Total one-offs Reported excl. One-offs Reported Total one-offs Reported excl. One-offs Reported Reported Reported excl. One-offs
Reported Group Profit 112,948 118,815 35,994 (9,432) 1,794 147,171 260,119 (53,634) 59,315 147,171 206,486 208,279 - 72% - 1%
Depreciation and Amortization 379,626 (651) - - - (651) 378,975 62,292 441,918 (651) 441,267 407,864 8% 8%
Net Provisions 89,292 - - - (1,794) (1,794) 87,498 11,651 100,943 (1,794) 99,149 69,983 44% 42%
Other Adjustments and Other Changes in Working Capital 74,516 33,788 11,998 (9,398) - 36,388 110,904 (61,293) 13,223 36,388 49,611 (99,844) 113% 150%
Change in Operating Working Capital (305,822) (29,952) (7,949) - - (37,901) (343,723) (101,294) (407,116) (37,901) (445,017) (597,149) 32% 25%
Changes in Inventories (299,039) - - - - - (299,039) (128,056) (427,095) - (427,095) (600,245) 29% 29%
Change in Trade Receivables (46,625) - - - (46,625) 1,173 (45,452) - (45,452) (73,518) 38% 38%
Change in Trade Payables 39,842 (29,952) (7,949) - - (37,901) 1,941 25,589 65,431 (37,901) 27,530 76,614 -15% -64%
Net Cash Flow From Operating Activities 350,560 122,000 40,043 (18,830) - 143,213 493,773 (142,278) 208,283 143,213 351,496 (10,867) 2017% 3335%
Business Combinations and Investments in Group Companies* (29,474) - - - - - (29,474) - (29,474) - (29,474) (1,533,264) 98% 98%
CAPEX (177,073) - - - - - (177,073) (32,465) (209,538) - (209,538) (297,790) 30% 30%
R&D/Other Intangible Assets (68,514) - - - - - (68,514) (17,368) (85,882) - (85,882) (77,770) -10% -10%
Other Cash Inflow / (Outflow)* (84,199) - - - - - (84,199) 11,457 (72,742) - (72,742) (69,999) -4% -4%
Net Cash Flow From Investing Activities (359,260) - - - - - (359,260) (38,376) (397,636) - (397,636) (1,978,823) 80% 80%
Free Cash Flow (8,700) 122,000 40,043 (18,830) - 143,213 134,513 (180,654) (189,353) 143,213 (46,140) (1,989,690) 90% 98%
Issue / /Repayment) of Debt 185,721 - - - - - 185,721 (5,142) 180,579 - 180,579 (192,544) 194% 194%
Capital Grants 1,456 - - - - - 1,456 - 1,456 - 1,456 2,079 -30% -30%
Purchase / Sale of Treasury Shares - - - - - - - - - - - (3,459) - -
Dividends (Paid) / Received - - - - - - - - - - - 10,125 - -
Other Cash Flows From / (Used in) Financing Activities - - - - - - - - - - - 15,172 - -
Interco transactions and investments in Group and related companies (180,142) - - - - - (180,142) 180,142 - - - - - -
Social Security Credit rights transferred & Others - - - - - - - - - - - (4,866)
Net Cash Flow From Financing Activities 7,035 - - - - 7,035 175,000 182,035 - 182,035 (173,492) 205% 205%
Total Cash Flow (1,665) 122,000 40,043 (18,830) - 143,213 141,548 (5,654) (7,318) 143,213 135,895 (2,163,183) 100% 106%
Cash and Cash Equivalents at the Beginning of the Year 431,337 - - - - - 431,337 116,642 547,979 - 547,979 2,675,611 -80% -80%
Effect of Exchange Rate Changes in Cash and Cash Equivalents (15,187) - - - - - (15,187) 93 (15,094) - (15,094) 35,551 -142% -142%
Cash and Cash Equivalents at the End of the Period 414,485 122,000 40,043 (18,830) - 143,213 557,698 111,081 525,567 143,213 668,780 547,979 - 4% 22%
* As of FY23, an amount of EUR37.8m has been reclassified from "Business Combinations in Group Companies" to "Other Cash Inflow / (Outflow)"
FY 2023
Grifols excl. Biotest
Biotest
Grifols incl. Biotest
% vs PY
Grifols incl. Biotest |
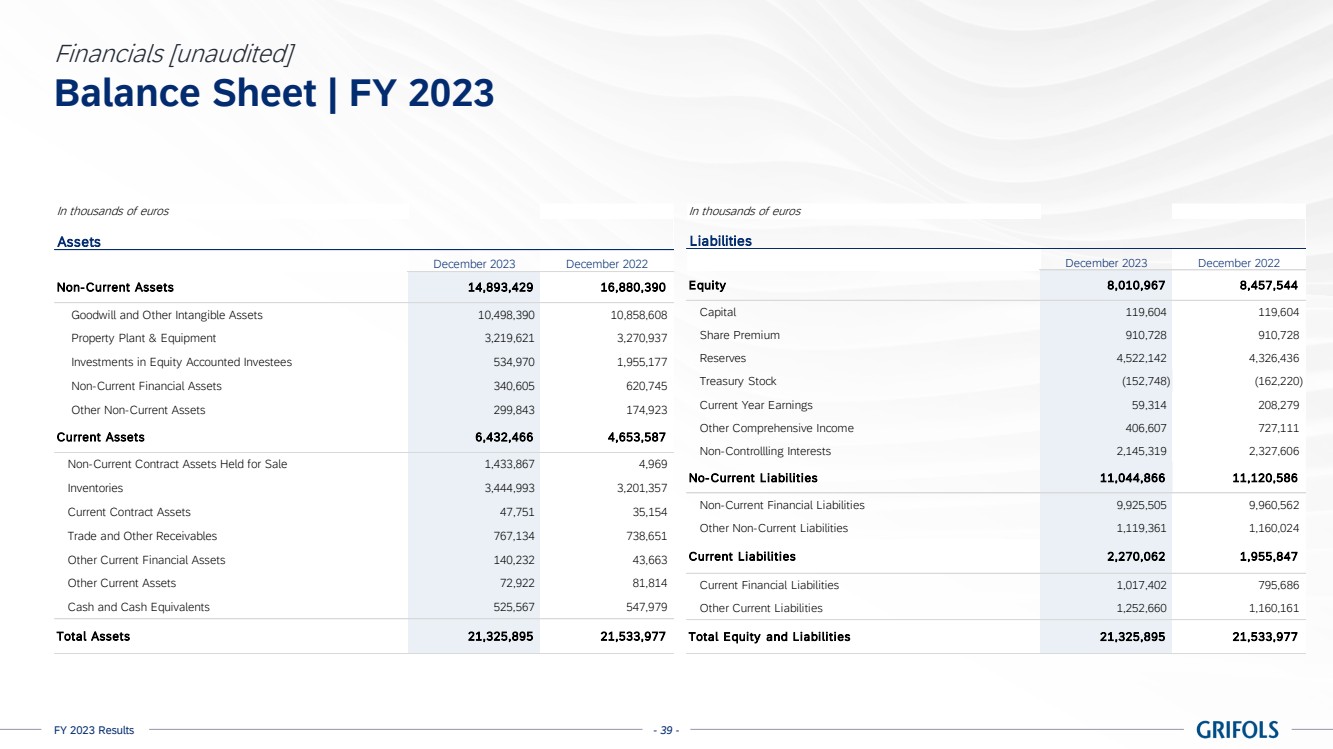
| FY 2023 Results - 39 -
Balance Sheet | FY 2023
Financials [unaudited]
In thousands of euros
December 2023 December 2022
14,893,429 16,880,390
10,498,390 10,858,608
3,219,621 3,270,937
534,970 1,955,177
340,605 620,745
299,843 174,923
6,432,466 4,653,587
1,433,867 4,969
3,444,993 3,201,357
47,751 35,154
767,134 738,651
140,232 43,663
72,922 81,814
525,567 547,979
21,325,895 21,533,977
Assets
Non-Current Assets
Total Assets
Current Assets
Inventories
Current Contract Assets
Other Current Financial Assets
Non-Current Contract Assets Held for Sale
Trade and Other Receivables
Investments in Equity Accounted Investees
Non-Current Financial Assets
Other Non-Current Assets
Other Current Assets
Cash and Cash Equivalents
Goodwill and Other Intangible Assets
Property Plant & Equipment
In thousands of euros
December 2023 December 2022
8,010,967 8,457,544
119,604 119,604
910,728 910,728
4,522,142 4,326,436
Treasury Stock (152,748) (162,220)
59,314 208,279
406,607 727,111
2,145,319 2,327,606
11,044,866 11,120,586
9,925,505 9,960,562
1,119,361 1,160,024
2,270,062 1,955,847
1,017,402 795,686
1,252,660 1,160,161
21,325,895 21,533,977
Equity
Liabilities
Other Current Liabilities
Total Equity and Liabilities
Other Comprehensive Income
Non-Controllling Interests
No-Current Liabilities
Non-Current Financial Liabilities
Other Non-Current Liabilities
Share Premium
Reserves
Current Year Earnings
Current Liabilities
Current Financial Liabilities
Capital |
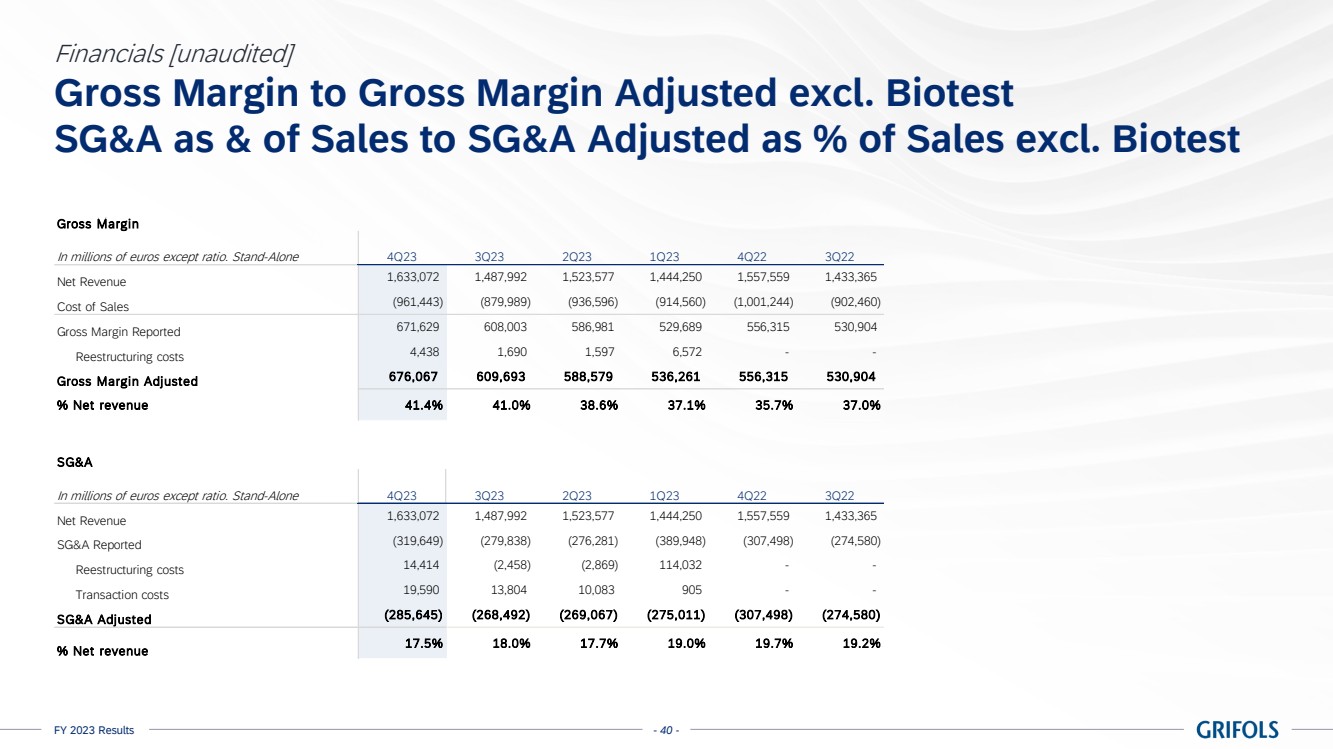
| FY 2023 Results - 40 -
Gross Margin to Gross Margin Adjusted excl. Biotest
SG&A as & of Sales to SG&A Adjusted as % of Sales excl. Biotest
Financials [unaudited]
Gross Margin
In millions of euros except ratio. Stand-Alone 4Q23 3Q23 2Q23 1Q23 4Q22 3Q22
Net Revenue 1,633,072 1,487,992 1,523,577 1,444,250 1,557,559 1,433,365
Cost of Sales (961,443) (879,989) (936,596) (914,560) (1,001,244) (902,460)
Gross Margin Reported 671,629 608,003 586,981 529,689 556,315 530,904
Reestructuring costs 4,438 1,690 1,597 6,572 - -
Gross Margin Adjusted 676,067 609,693 588,579 536,261 556,315 530,904
% Net revenue 41.4% 41.0% 38.6% 37.1% 35.7% 37.0%
SG&A
In millions of euros except ratio. Stand-Alone 4Q23 3Q23 2Q23 1Q23 4Q22 3Q22
Net Revenue 1,633,072 1,487,992 1,523,577 1,444,250 1,557,559 1,433,365
SG&A Reported (319,649) (279,838) (276,281) (389,948) (307,498) (274,580)
Reestructuring costs 14,414 (2,458) (2,869) 114,032 - -
Transaction costs 19,590 13,804 10,083 905 - -
SG&A Adjusted (285,645) (268,492) (269,067) (275,011) (307,498) (274,580)
% Net revenue 17.5% 18.0% 17.7% 19.0% 19.7% 19.2% |
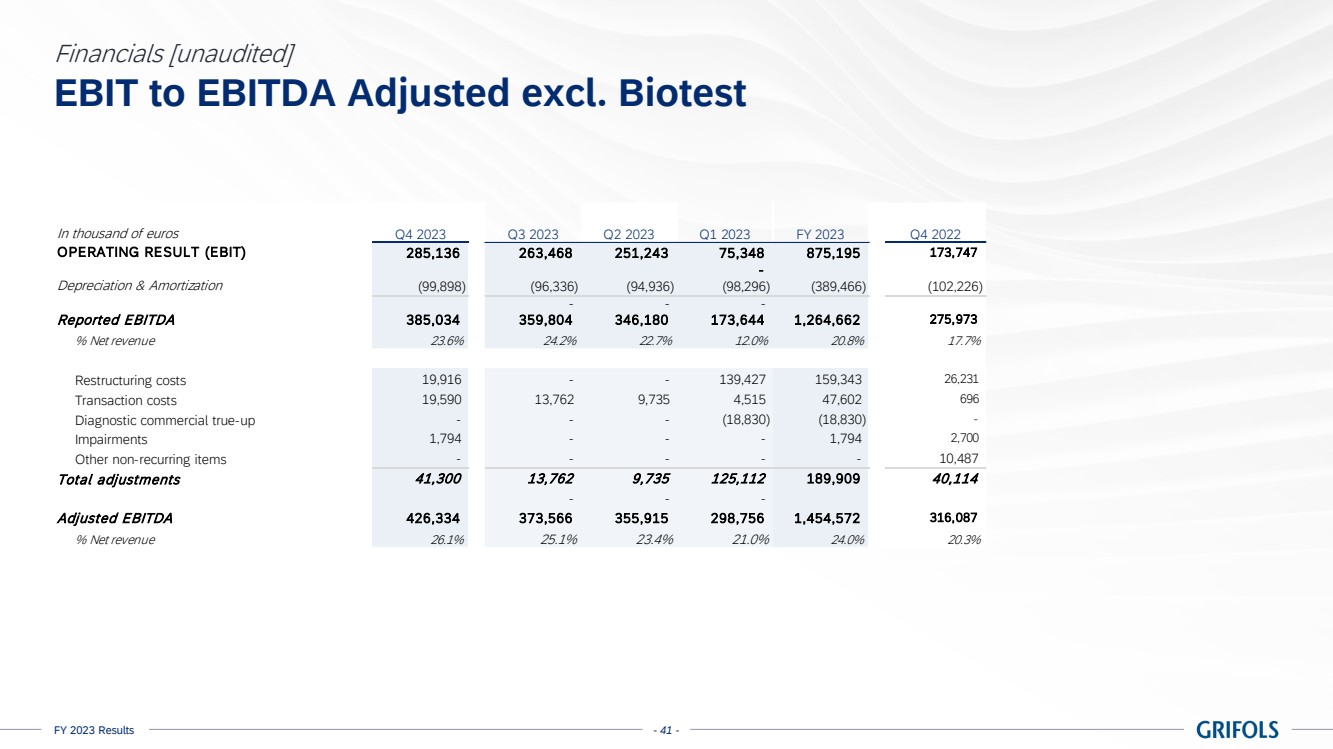
| FY 2023 Results - 41 -
EBIT to EBITDA Adjusted excl. Biotest
Financials [unaudited]
In thousand of euros
285,136 263,468 251,243 75,348 875,195 173,747
-
(99,898) (96,336) (94,936) (98,296) (389,466) (102,226)
- - -
Reported EBITDA 385,034 359,804 346,180 173,644 1,264,662 275,973
% Net revenue 23.6% 24.2% 22.7% 12.0% 20.8% 17.7%
Restructuring costs 19,916 - - 139,427 159,343 26,231
Transaction costs 19,590 13,762 9,735 4,515 47,602 696
Diagnostic commercial true-up - - - (18,830) (18,830) -
Impairments 1,794 - - - 1,794 2,700
Other non-recurring items - - - - - 10,487
Total adjustments 41,300 13,762 9,735 125,112 189,909 40,114
- - -
Adjusted EBITDA 426,334 373,566 355,915 298,756 1,454,572 316,087
% Net revenue 26.1% 25.1% 23.4% 21.0% 24.0% 20.3%
Depreciation & Amortization
Q4 2023 Q4 2022
OPERATING RESULT (EBIT)
Q3 2023 Q2 2023 Q1 2023 FY 2023 |
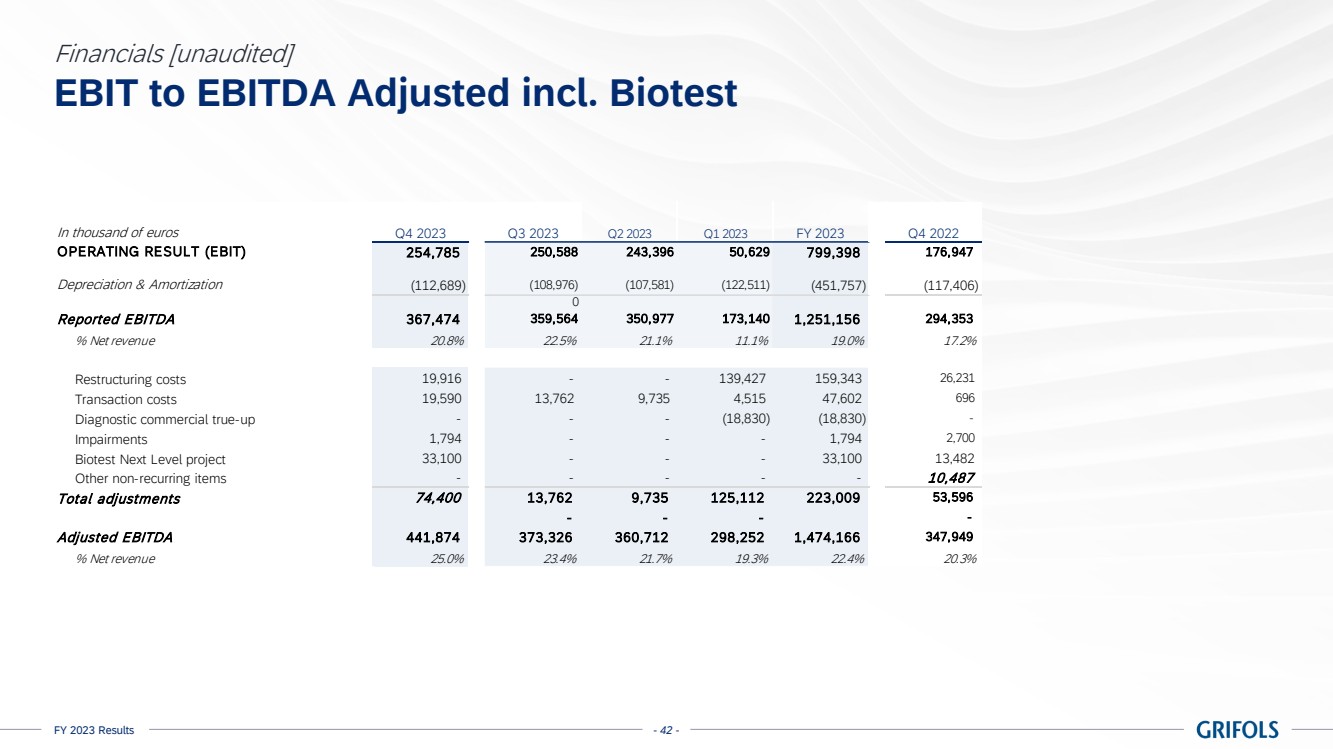
| FY 2023 Results - 42 -
EBIT to EBITDA Adjusted incl. Biotest
Financials [unaudited]
In thousand of euros
254,785 250,588 243,396 50,629 799,398 176,947
(112,689) (108,976) (107,581) (122,511) (451,757) (117,406)
0
Reported EBITDA 367,474 359,564 350,977 173,140 1,251,156 294,353
% Net revenue 20.8% 22.5% 21.1% 11.1% 19.0% 17.2%
Restructuring costs 19,916 - - 139,427 159,343 26,231
Transaction costs 19,590 13,762 9,735 4,515 47,602 696
Diagnostic commercial true-up - - - (18,830) (18,830) -
Impairments 1,794 - - - 1,794 2,700
Biotest Next Level project 33,100 - - - 33,100 13,482
Other non-recurring items - - - - - 10,487
Total adjustments 74,400 13,762 9,735 125,112 223,009 53,596
- - - -
Adjusted EBITDA 441,874 373,326 360,712 298,252 1,474,166 347,949
% Net revenue 25.0% 23.4% 21.7% 19.3% 22.4% 20.3%
Q4 2023 Q3 2023 Q2 2023 Q1 2023 FY 2023 Q4 2022
Depreciation & Amortization
OPERATING RESULT (EBIT) |
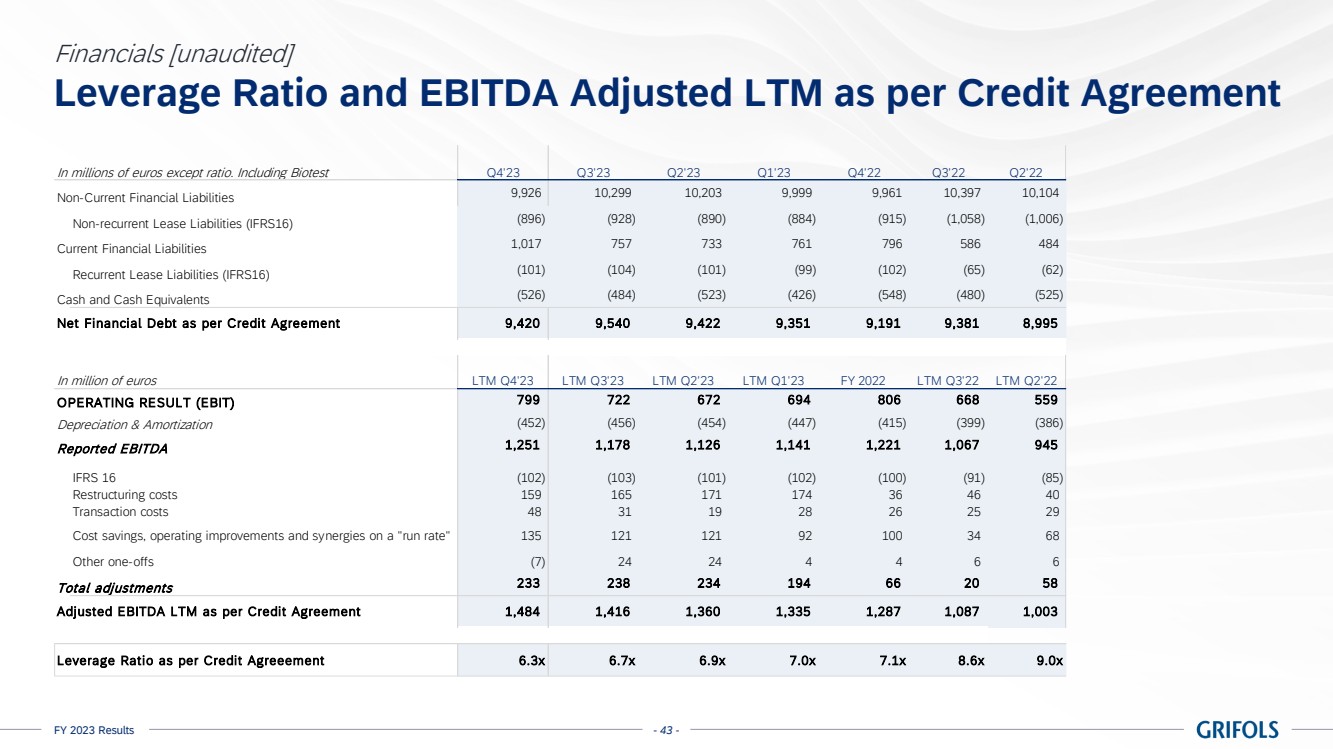
| FY 2023 Results - 43 -
Leverage Ratio and EBITDA Adjusted LTM as per Credit Agreement
Financials [unaudited]
In millions of euros except ratio. Including Biotest Q4'23 Q3'23 Q2'23 Q1'23 Q4'22 Q3'22 Q2'22
Non-Current Financial Liabilities 9,926 10,299 10,203 9,999 9,961 10,397 10,104
Non-recurrent Lease Liabilities (IFRS16) (896) (928) (890) (884) (915) (1,058) (1,006)
Current Financial Liabilities 1,017 757 733 761 796 586 484
Recurrent Lease Liabilities (IFRS16) (101) (104) (101) (99) (102) (65) (62)
Cash and Cash Equivalents (526) (484) (523) (426) (548) (480) (525)
Net Financial Debt as per Credit Agreement 9,420 9,540 9,422 9,351 9,191 9,381 8,995
In million of euros LTM Q4'23 LTM Q3'23 LTM Q2'23 LTM Q1'23 FY 2022 LTM Q3'22 LTM Q2'22
OPERATING RESULT (EBIT) 799 722 672 694 806 668 559
Depreciation & Amortization (452) (456) (454) (447) (415) (399) (386)
Reported EBITDA 1,251 1,178 1,126 1,141 1,221 1,067 945
IFRS 16 (102) (103) (101) (102) (100) (91) (85)
Restructuring costs 159 165 171 174 36 46 40
Transaction costs 48 31 19 28 26 25 29
Cost savings, operating improvements and synergies on a "run rate" 135 121 121 92 100 34 68
Other one-offs (7) 24 24 4 4 6 6
Total adjustments 233 238 234 194 6 6 2 0 5 8
Adjusted EBITDA LTM as per Credit Agreement 1,484 1,416 1,360 1,335 1,287 1,087 1,003
Leverage Ratio as per Credit Agreeement 6.3x 6.7x 6.9x 7.0x 7.1x 8.6x 9.0x |
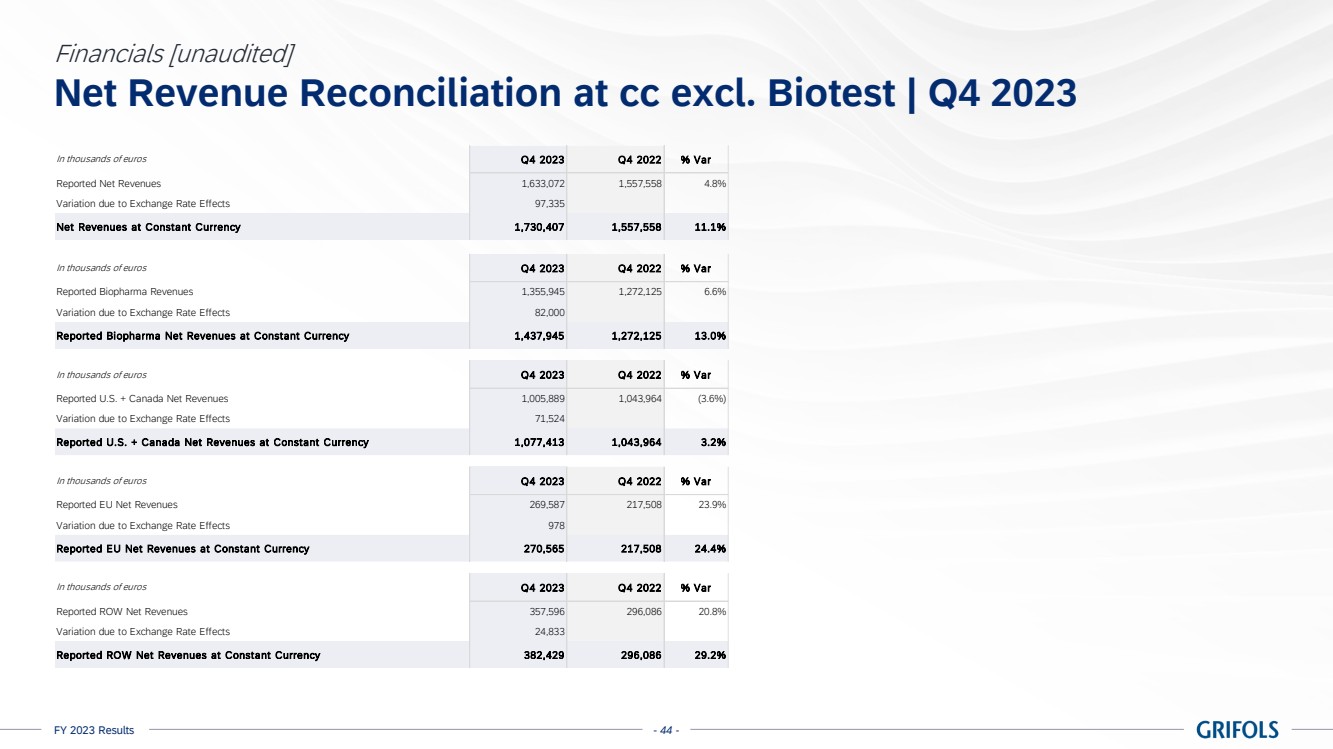
| FY 2023 Results - 44 -
Net Revenue Reconciliation at cc excl. Biotest | Q4 2023
Financials [unaudited]
In thousands of euros Q4 2023 Q4 2022 % Var
Reported Net Revenues 1,633,072 1,557,558 4.8%
Variation due to Exchange Rate Effects 97,335
Net Revenues at Constant Currency 1,730,407 1,557,558 11.1%
In thousands of euros Q4 2023 Q4 2022 % Var
Reported Biopharma Revenues 1,355,945 1,272,125 6.6%
Variation due to Exchange Rate Effects 82,000
Reported Biopharma Net Revenues at Constant Currency 1,437,945 1,272,125 13.0%
In thousands of euros Q4 2023 Q4 2022 % Var
Reported U.S. + Canada Net Revenues 1,005,889 1,043,964 (3.6%)
Variation due to Exchange Rate Effects 71,524
Reported U.S. + Canada Net Revenues at Constant Currency 1,077,413 1,043,964 3.2%
In thousands of euros Q4 2023 Q4 2022 % Var
Reported EU Net Revenues 269,587 217,508 23.9%
Variation due to Exchange Rate Effects 978
Reported EU Net Revenues at Constant Currency 270,565 217,508 24.4%
In thousands of euros Q4 2023 Q4 2022 % Var
Reported ROW Net Revenues 357,596 296,086 20.8%
Variation due to Exchange Rate Effects 24,833
Reported ROW Net Revenues at Constant Currency 382,429 296,086 29.2% |

| FY 2023 Results - 45 -
Net Revenue Reconciliation at cc excl. Biotest | FY 2023
Financials [unaudited]
In thousands of euros 2023 2022 % Var
Reported Net Revenues 6,088,892 5,702,728 6.8%
Variation due to Exchange Rate Effects 133,233
Net Revenues at Constant Currency 6,222,125 5,702,728 9.1%
In thousands of euros 2023 2022 % Var
Reported Biopharma Revenues 5,055,215 4,644,143 8.9%
Variation due to Exchange Rate Effects 111,706
Reported Biopharma Net Revenues at Constant Currency 5,166,921 4,644,143 11.3%
In thousands of euros 2023 2022 % Var
Reported U.S. + Canada Net Revenues 3,897,511 3,853,488 1.1%
Variation due to Exchange Rate Effects 88,993
Reported U.S. + Canada Net Revenues at Constant Currency 3,986,504 3,853,488 3.5%
In thousands of euros 2023 2022 % Var
Reported EU Net Revenues 990,925 851,795 16.3%
Variation due to Exchange Rate Effects 969
Reported EU Net Revenues at Constant Currency 991,894 851,795 16.4%
In thousands of euros 2023 2022 % Var
Reported ROW Net Revenues 1,200,455 997,445 20.4%
Variation due to Exchange Rate Effects 43,271
Reported ROW Net Revenues at Constant Currency 1,243,726 997,445 24.7% |

| FY 2023 Results - 46 -
Net Revenue Reconciliation at cc incl. Biotest | Q4 2023
Financials [unaudited]
In thousands of euros Q4 2023 Q4 2022 % Var
Reported Net Revenues 1,769,550 1,712,744 3.3%
Variation due to Exchange Rate Effects 96,978
Net Revenues at Constant Currency 1,866,528 1,712,744 9.0%
In thousands of euros Q4 2023 Q4 2022 % Var
Reported Biopharma Net Revenues 1,492,423 1,427,311 4.6%
Variation due to Exchange Rate Effects 81,643
Reported Biopharma Net Revenues at Constant Currency 1,574,066 1,427,311 10.3%
In thousands of euros Q4 2023 Q4 2022 % Var
Reported Diagnostic Net Revenues 172,498 172,236 0.2%
Variation due to Exchange Rate Effects 10,731
Reported Diagnostic Net Revenues at Constant Currency 183,229 172,236 6.4%
In thousands of euros Q4 2023 Q4 2022 % Var
Reported Bio Supplies Net Revenues 41,285 49,309 (16.3%)
Variation due to Exchange Rate Effects 2,470
Reported Bio Supplies Net Revenues at Constant Currency 43,755 49,309 (11.3%)
In thousands of euros Q4 2023 Q4 2022 % Var
Reported Others & Intersegments Net Revenues 63,344 63,888 (0.9%)
Variation due to Exchange Rate Effects 2,134
Reported Other & Intersegments Net Revenues at Constant Currency 65,478 63,888 2.5%
In thousands of euros Q4 2023 Q4 2022 % Var
Reported U.S. + Canada Net Revenues 1,005,889 1,043,964 (3.6%)
Variation due to Exchange Rate Effects 71,524
Reported U.S. + Canada Net Revenues at Constant Currency 1,077,413 1,043,964 3.2%
In thousands of euros Q4 2023 Q4 2022 % Var
Reported EU Net Revenues 338,972 290,538 16.7%
Variation due to Exchange Rate Effects 722
Reported EU Net Revenues at Constant Currency 339,694 290,538 16.9%
In thousands of euros Q4 2023 Q4 2022 % Var
Reported ROW Net Revenues 424,689 378,242 12.3%
Variation due to Exchange Rate Effects 24,732
Reported ROW Net Revenues at Constant Currency 449,421 378,242 18.8%
In thousands of euros Q4 2023 Q4 2022 % Var
Reported Net Revenues 1,769,550 1,712,744 3.3%
Variation due to Exchange Rate Effects 96,978
Net Revenues at Constant Currency 1,866,528 1,712,744 9.0%
In thousands of euros Q4 2023 Q4 2022 % Var
Reported Biopharma Net Revenues 1,492,423 1,427,311 4.6%
Variation due to Exchange Rate Effects 81,643
Reported Biopharma Net Revenues at Constant Currency 1,574,066 1,427,311 10.3%
In thousands of euros Q4 2023 Q4 2022 % Var
Reported Diagnostic Net Revenues 172,498 172,236 0.2%
Variation due to Exchange Rate Effects 10,731
Reported Diagnostic Net Revenues at Constant Currency 183,229 172,236 6.4%
In thousands of euros Q4 2023 Q4 2022 % Var
Reported Bio Supplies Net Revenues 41,285 49,309 (16.3%)
Variation due to Exchange Rate Effects 2,470
Reported Bio Supplies Net Revenues at Constant Currency 43,755 49,309 (11.3%)
In thousands of euros Q4 2023 Q4 2022 % Var
Reported Others & Intersegments Net Revenues 63,344 63,888 (0.9%)
Variation due to Exchange Rate Effects 2,134
Reported Other & Intersegments Net Revenues at Constant Currency 65,478 63,888 2.5%
In thousands of euros Q4 2023 Q4 2022 % Var
Reported U.S. + Canada Net Revenues 1,005,889 1,043,964 (3.6%)
Variation due to Exchange Rate Effects 71,524
Reported U.S. + Canada Net Revenues at Constant Currency 1,077,413 1,043,964 3.2%
In thousands of euros Q4 2023 Q4 2022 % Var
Reported EU Net Revenues 338,972 290,538 16.7%
Variation due to Exchange Rate Effects 722
Reported EU Net Revenues at Constant Currency 339,694 290,538 16.9%
In thousands of euros Q4 2023 Q4 2022 % Var
Reported ROW Net Revenues 424,689 378,242 12.3%
Variation due to Exchange Rate Effects 24,732
Reported ROW Net Revenues at Constant Currency 449,421 378,242 18.8% |
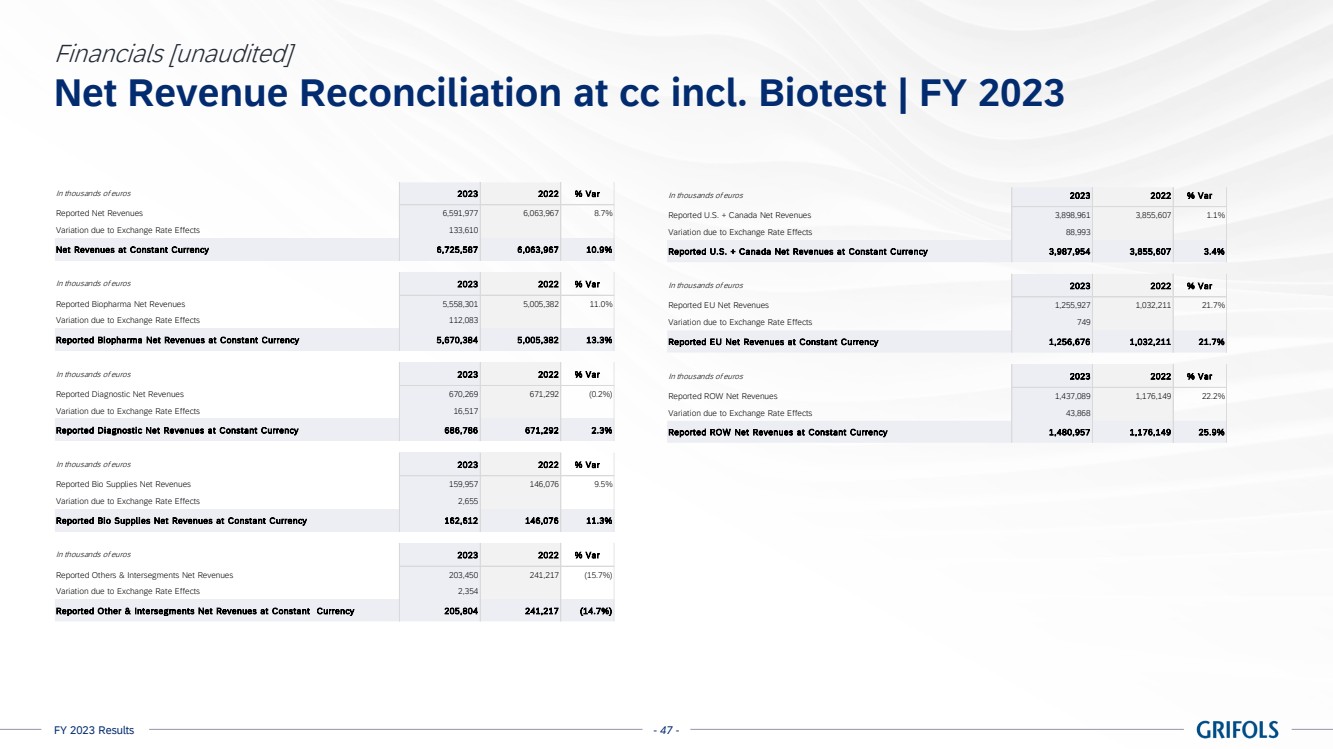
| FY 2023 Results - 47 -
In thousands of euros 2023 2022 % Var
Reported Net Revenues 6,591,977 6,063,967 8.7%
Variation due to Exchange Rate Effects 133,610
Net Revenues at Constant Currency 6,725,587 6,063,967 10.9%
In thousands of euros 2023 2022 % Var
Reported Biopharma Net Revenues 5,558,301 5,005,382 11.0%
Variation due to Exchange Rate Effects 112,083
Reported Biopharma Net Revenues at Constant Currency 5,670,384 5,005,382 13.3%
In thousands of euros 2023 2022 % Var
Reported Diagnostic Net Revenues 670,269 671,292 (0.2%)
Variation due to Exchange Rate Effects 16,517
Reported Diagnostic Net Revenues at Constant Currency 686,786 671,292 2.3%
In thousands of euros 2023 2022 % Var
Reported Bio Supplies Net Revenues 159,957 146,076 9.5%
Variation due to Exchange Rate Effects 2,655
Reported Bio Supplies Net Revenues at Constant Currency 162,612 146,076 11.3%
In thousands of euros 2023 2022 % Var
Reported Others & Intersegments Net Revenues 203,450 241,217 (15.7%)
Variation due to Exchange Rate Effects 2,354
Reported Other & Intersegments Net Revenues at Constant Currency 205,804 241,217 (14.7%)
In thousands of euros 2023 2022 % Var
Reported U.S. + Canada Net Revenues 3,898,961 3,855,607 1.1%
Variation due to Exchange Rate Effects 88,993
Reported U.S. + Canada Net Revenues at Constant Currency 3,987,954 3,855,607 3.4%
In thousands of euros 2023 2022 % Var
Reported EU Net Revenues 1,255,927 1,032,211 21.7%
Variation due to Exchange Rate Effects 749
Reported EU Net Revenues at Constant Currency 1,256,676 1,032,211 21.7%
In thousands of euros 2023 2022 % Var
Reported ROW Net Revenues 1,437,089 1,176,149 22.2%
Variation due to Exchange Rate Effects 43,868
Reported ROW Net Revenues at Constant Currency 1,480,957 1,176,149 25.9%
In thousands of euros 2023 2022 % Var
Reported Net Revenues 6,591,977 6,063,967 8.7%
Variation due to Exchange Rate Effects 133,610
Net Revenues at Constant Currency 6,725,587 6,063,967 10.9%
In thousands of euros 2023 2022 % Var
Reported Biopharma Net Revenues 5,558,301 5,005,382 11.0%
Variation due to Exchange Rate Effects 112,083
Reported Biopharma Net Revenues at Constant Currency 5,670,384 5,005,382 13.3%
In thousands of euros 2023 2022 % Var
Reported Diagnostic Net Revenues 670,269 671,292 (0.2%)
Variation due to Exchange Rate Effects 16,517
Reported Diagnostic Net Revenues at Constant Currency 686,786 671,292 2.3%
In thousands of euros 2023 2022 % Var
Reported Bio Supplies Net Revenues 159,957 146,076 9.5%
Variation due to Exchange Rate Effects 2,655
Reported Bio Supplies Net Revenues at Constant Currency 162,612 146,076 11.3%
In thousands of euros 2023 2022 % Var
Reported Others & Intersegments Net Revenues 203,450 241,217 (15.7%)
Variation due to Exchange Rate Effects 2,354
Reported Other & Intersegments Net Revenues at Constant Currency 205,804 241,217 (14.7%)
In thousands of euros 2023 2022 % Var
Reported U.S. + Canada Net Revenues 3,898,961 3,855,607 1.1%
Variation due to Exchange Rate Effects 88,993
Reported U.S. + Canada Net Revenues at Constant Currency 3,987,954 3,855,607 3.4%
In thousands of euros 2023 2022 % Var
Reported EU Net Revenues 1,255,927 1,032,211 21.7%
Variation due to Exchange Rate Effects 749
Reported EU Net Revenues at Constant Currency 1,256,676 1,032,211 21.7%
In thousands of euros 2023 2022 % Var
Reported ROW Net Revenues 1,437,089 1,176,149 22.2%
Variation due to Exchange Rate Effects 43,868
Reported ROW Net Revenues at Constant Currency 1,480,957 1,176,149 25.9%
Net Revenue Reconciliation at cc incl. Biotest | FY 2023
Financials [unaudited] |

| FY 2023 Results - 48 -
Definition of Non-GAAP Measures and Constant Currency
Annex
• Adjusted EBITDA is defined as EBITDA, excluding one-offs and items related to unique events and are not expected to be repeated periodically and
not, including restructuring and transaction costs. It provides a useful measure for period-to-period comparisons of the business, as it is not indicative of
Grifols’ ongoing operating performance.
• Adjusted EBITDA LTM as per Credit Agreement is defined as net income on a consolidated basis for the Group, plus (i) all financial results, (ii) any
losses on ordinary course hedging obligations, (iii) any foreign currency translation, transaction or exchange losses, (iv) any loss of any equity-accounted investee, (v) tax expense, (vi) depreciation, (vii) amortization, write-offs, write-downs, and other non-cash charges, losses and expenses, (viii)
impairment of intangibles, (ix) non-recurring losses, (x) transactions costs, (xi) extraordinary, unusual, or non-recurring charges and expenses including
transition, restructuring and “carveout” expenses, (xii) any costs and expenses relating to the Issuer’s potential or actual issuance of Equity Interests and
(xiii) the amount of cost savings, adjustments, operating expense reductions, operating improvements and synergies, in each case on a “run rate” basis
and in connection with acquisitions, investments, restructurings, business optimization projects and other operational changes and initiatives; less (i)
interest income, (ii) non-recurring gains, (iii) any income or gains on ordinary course hedging obligations (iv) foreign currency translation, transaction or
exchange gains and (v) any income of any equity-accounted investee, in each case, for the last 12 months.
• Adjusted EBITDA LTM is defined as Adjusted EBITDA related to the last 12 months.
• Adjusted Gross Margin is defined as gross margin, excluding the effect of non-cash expenses and non-recurring items not indicative of our ongoing
operating performance, including restructuring and transaction costs.
• Adjusted Selling general and administrative expenses (SG&A) comprise all direct and indirect selling costs, operational overhead costs, and
administrative expenses unrelated to production excluding the effect of non-cash expenses and non-recurring items not indicative of our ongoing
operating performance, including restructuring and transaction costs. |
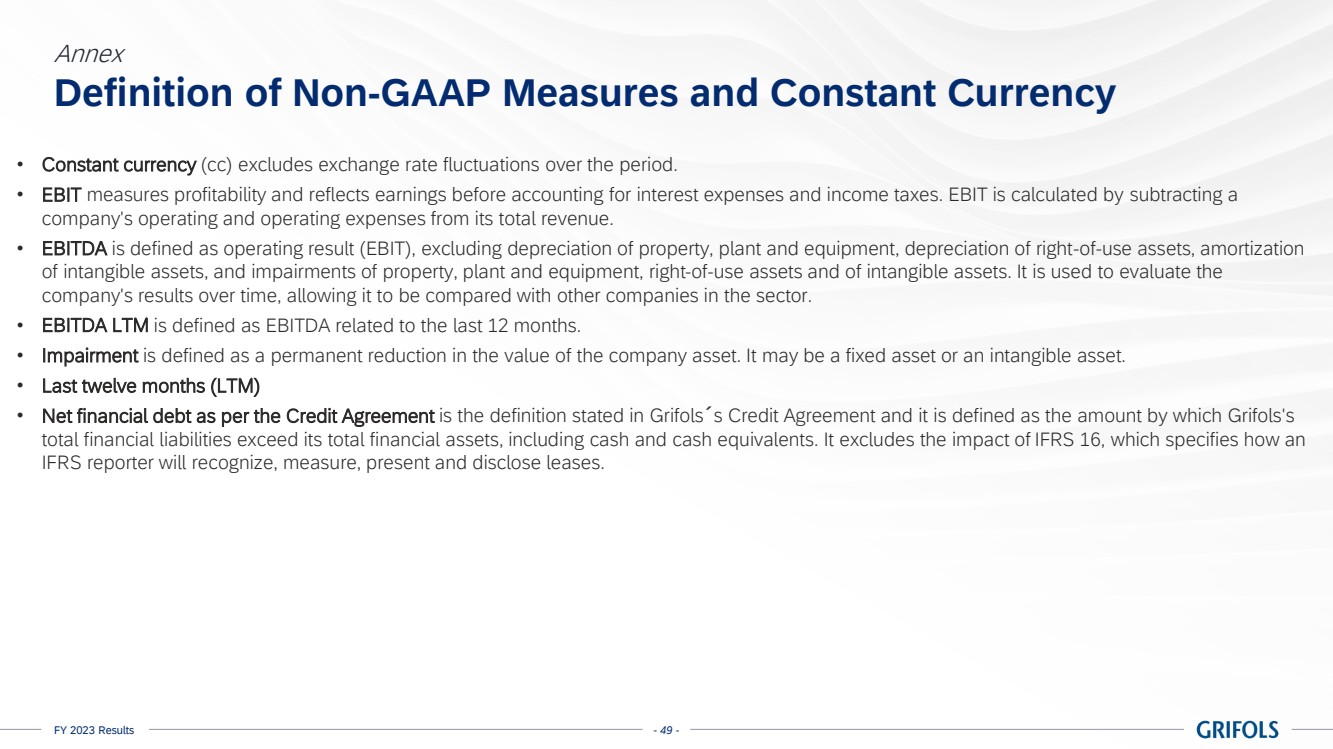
| FY 2023 Results - 49 -
Definition of Non-GAAP Measures and Constant Currency
Annex
• Constant currency (cc) excludes exchange rate fluctuations over the period.
• EBIT measures profitability and reflects earnings before accounting for interest expenses and income taxes. EBIT is calculated by subtracting a
company's operating and operating expenses from its total revenue.
• EBITDA is defined as operating result (EBIT), excluding depreciation of property, plant and equipment, depreciation of right-of-use assets, amortization
of intangible assets, and impairments of property, plant and equipment, right-of-use assets and of intangible assets. It is used to evaluate the
company's results over time, allowing it to be compared with other companies in the sector.
• EBITDA LTM is defined as EBITDA related to the last 12 months.
• Impairment is defined as a permanent reduction in the value of the company asset. It may be a fixed asset or an intangible asset.
• Last twelve months (LTM)
• Net financial debt as per the Credit Agreement is the definition stated in Grifols´s Credit Agreement and it is defined as the amount by which Grifols's
total financial liabilities exceed its total financial assets, including cash and cash equivalents. It excludes the impact of IFRS 16, which specifies how an
IFRS reporter will recognize, measure, present and disclose leases. |
| FY 2023 Results - 50 -
Investor Relations
& Sustainability
+34 93 571 02 21
investors@grifols.com
sustainability@grifols.com
inversores@grifols.com
sostenibilidad@grifols.com |
SIGNATURES
Pursuant to the requirements of the Securities
Exchange Act of 1934, the registrant has duly caused this report to be signed on its behalf by the undersigned, thereto duly authorized.
| |
Grifols, S.A. |
| |
|
|
| |
By: |
/s/ David I. Bell |
| |
|
Name: |
David I. Bell |
| |
|
Title: |
Authorized Signatory |
Date: February 29, 2024
Grifols (PK) (USOTC:GIKLY)
Historical Stock Chart
From May 2024 to Jun 2024
 Charts.")
Grifols (PK) (USOTC:GIKLY)
Historical Stock Chart
From Jun 2023 to Jun 2024
 Charts.")