FTSE USA Large Cap Super... Key Figures
|
FTSE USA Large Cap Super... Balance Sheet| %1$s Balance Sheet | | Sorry No Data Available |
|
 Share Price Performance| Share Price Performance | | Sample Period † | High | Low | | 1 week | 21,469.08 | 20,424.28 |
| 4 weeks | 22,821.39 | 20,424.28 |
| 12 weeks | 22,841.50 | 20,424.28 |
| 1 year | 22,841.50 | 17,632.97 |
Share Price Chart (5 years)| Share Price Chart (5 years) | 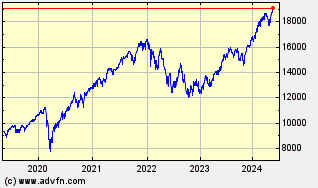 |
|
FTSE USA Large Cap Super... Historic Returns| %1$s Historic Returns | | Period † | Open | Change | % | Open Avg. | Avg. Daily Vol [m] | Total Vol [m] | VWAP | | 1 week | 21,425.91 | -971.80 | -4.54 | 20,424.28 | - | | - |
| 4 weeks | 22,500.97 | -2,046.86 | -9.10 | 20,424.28 | - | | - |
| 12 weeks | 22,666.55 | -2,212.44 | -9.76 | 20,424.28 | - | | - |
| 26 weeks | 19,861.39 | 592.72 | 2.98 | 19,558.57 | - | | - |
| 1 year | 18,183.97 | 2,270.14 | 12.48 | 17,632.97 | - | | - |
| 3 years | 14,518.37 | 5,935.74 | 40.88 | 11,696.55 | - | | - |
| 5 years | 9,644.59 | 10,809.52 | 112.08 | 7,509.44 | - | | - |
| † periods calculated are whole weeks rather than calendar months | |
|
