Total revenues in 3Q24 were $84.0
million
3Q24 GAAP net income was $9.8 million and
adjusted EBITDA1 was $21.1 million
Bioceres Crop Solutions Corp. (Bioceres) (NASDAQ:
BIOX), a leader in the development and commercialization of
productivity solutions designed to regenerate agricultural
ecosystems while making crops more resilient to climate change,
announced financial results for the fiscal third quarter ended
March 31, 2024. Financial results are expressed in U.S. dollars and
are presented in accordance with International Financial Reporting
Standards. All comparisons in this announcement are year-over-year
(YoY), unless otherwise noted.
FINANCIAL & BUSINESS HIGHLIGHTS
- Total revenues in 3Q24 were $84.0 million compared to
$93.6 million in the same quarter last year. Operational growth in
the business was offset by a $15.7 million accrual of the
compensatory payment from Syngenta, in comparison to a $32.9
million accrual in 3Q23.
- Operating profit was $13.2 million with GAAP net income at
$9.8 million.
- Adjusted EBITDA1 for the quarter was $21.1 million,
compared to $35.8 million in the year ago quarter. The decrease was
driven by the lower compensatory payment accrual, partially
softened by improved operational performance.
- Regulatory clearance in Brazil unlocks
bio-insecticidal/bio-nematicidal solutions, expanding Bioceres’
biologicals portfolio in this geography.
- HB4 Soy varieties showed satisfactory performance at
farmer level in Brazil, with an average yield improvement of 7%
against non-HB4 varieties.
____________
1
Adjusted EBITDA is a non-GAAP measure. See
“Use of non-IFRS financial information” for information regarding
our use of Adjusted EBITDA and its reconciliation from the most
comparable financial measure.
MANAGEMENT REVIEW
Mr. Federico Trucco, Bioceres' Chief Executive Officer,
commented: “We are generally satisfied with our third quarter
results, despite some delayed sales in our bio-nutrition segment in
Argentina and Brazil, which we now expect to realize in our fourth
and final fiscal quarter. As anticipated, our third quarter growth
is disfavored when compared to the year before, given the
disproportional weight of the Syngenta distribution agreement,
whose contribution is now more evenly distributed throughout the
year. From a qualitative point of view, we continue to see positive
developments in Brazil, which we expect to translate into
quantitative milestones in one or two seasons. One of these
developments was the first regulatory approval for our inactivated
Burkholderia bio-control solutions, which we announced last week.
This approval creates an immediate opportunity in high value
bio-insecticidal markets as well as in our Generation HB4 channel,
and ― in one or two seasons ― in broader row-crop markets once our
lowest rate formulations are included in the portfolio. Another
positive development in Brazil comes from the performance of our
first two HB4 soy varieties, where we received favorable feedback
from key farmers and expect to increase the current pace of growth.
Looking ahead and despite the industry-wide headwinds persisting
from last year, we are confident on the attractiveness of our value
propositions and the capabilities of our teams to achieve the
double-digit growth we are known to deliver.”
Mr. Enrique Lopez Lecube, Bioceres' Chief Financial Officer,
noted: “This year’s third fiscal quarter was marked by a difficult
comparison against last year´s third quarter, in which the
compensatory payment from the Syngenta agreement drove a
substantial portion of sales and explained our profits almost in
full. In a scenario of slower-than-expected market dynamics for
fertilizers and inoculants in South America and persisting
suboptimal conditions for crop protection in the US and Brazil, we
were still able to partially offset the $17 million year-over-year
difference from the Syngenta agreement by growing the rest of our
business’ top line by roughly $8 million. As we head into the last
quarter of our fiscal year, we are confident that with a normalized
crop nutrition market we will be in good shape to deliver our
annual goals of achieving double-digit growth in EBITDA.”
KEY FINANCIAL METRICS
Table 1: 3Q24 Key Financial Metrics
(In millions of U.S. dollars)
3Q23
3Q24
% Change
Revenue by Segment
Crop Protection
44.3
46.8
6%
Seed and Integrated Products
5.9
8.6
46%
Crop Nutrition
43.4
28.6
(34%)
Total Revenue
93.6
84.0
(10%)
Gross Profit
57.5
42.6
(26%)
Gross Margin
61.4%
50.8%
(1,062 bps)
3Q23
3Q24
% Change
GAAP net income or loss
27.5
9.8
(64%)
Adjusted EBITDA1
35.8
21.1
(41%)
3Q24 Summary: Total revenues were $84.0 million in 3Q24,
compared to $93.6 million for the same quarter last year. The
decline is fully explained by a ~$17 million decrease in the
accrual of the Syngenta compensatory payment, which was $15.7
million this year, compared to $32.9 million in the year-ago
quarter. Excluding these accruals, the business generated $68.3
million in revenues, compared to $60.7 million last year, with
modest growth in Crop Protection and Crop Nutrition, the two main
business segments contributing material sales during the
quarter.
Gross profit for the quarter was $42.6 million, a decline
compared to the $57.5 million in 3Q23. As with revenues, the
reduction was entirely due to the lower accrual of the compensatory
payment this quarter compared to last year. Excluding this, gross
profit increased ― although proportionally less than revenues due
to product mix ― and overall gross margin remained practically
flat.
GAAP net income and adjusted EBITDA1 for the quarter were $9.8
million and $21.1 million, respectively, compared to $27.5 million
and $35.8 million, respectively. The decrease in the compensatory
payment translates directly into the bottom line, partially offset
by an improved underlying business performance.
For a full version of Bioceres’ third quarter fiscal 2024
earnings release, click here.
THIRD QUARTER 2024 EARNINGS CONFERENCE CALL
Management will host a conference call and question-and-answer
session, which will be accompanied by a presentation available
during the webcast or accessed via the investor relations section
of the company’s website.
To access the call, please use the following information:
Date:
Tuesday, May 14, 2024
Time:
8:30 a.m. ET, 5:30 a.m. PT
US Toll Free dial-in number:
1-833-470-1428
International dial-in numbers:
Click here
Conference ID:
391060
Webcast:
Click here
Please dial in 5-10 minutes prior to the start time to register
and join.
The conference call will be broadcast live and available for
replay here and via the investor relations section of the company’s
website here.
A replay of the call will be available through June 6, 2024,
following the conference.
Toll Free Replay Number:
1-866-813-9403
International Replay Number:
+44 204 525 0658
Replay ID:
206193
About Bioceres Crop Solutions Corp.
Bioceres Crop Solutions Corp. (NASDAQ: BIOX) is a leader in the
development and commercialization of productivity solutions
designed to regenerate agricultural ecosystems while making crops
more resilient to climate change. To do this, Bioceres’ solutions
create economic incentives for farmers and other stakeholders to
adopt environmentally friendlier production practices. The company
has a unique biotech platform with high-impact, patented
technologies for seeds and microbial ag-inputs, as well as next
generation Crop Nutrition and Protection solutions. Through its
HB4® program, the company is bringing digital solutions to support
growers’ decisions and provide end-to-end traceability for
production outputs. For more information, visit here.
Forward-Looking Statements
This communication includes “forward-looking statements” within
the meaning of the “safe harbor” provisions of the United States
Private Securities Litigation Reform Act of 1995. Forward-looking
statements may be identified by the use of words such as
“forecast,” “intend,” “seek,” “target,” “anticipate,” “believe,”
“expect,” “estimate,” “plan,” “outlook,” and “project” and other
similar expressions that predict or indicate future events or
trends or that are not statements of historical matters. Such
forward-looking statements include estimated financial data, and
any such forward-looking statements involve risks, assumptions and
uncertainties. These forward-looking statements include, but are
not limited to, whether (i) the health and safety measures
implemented to safeguard employees and assure business continuity
will be successful and (ii) we will be able to coordinate efforts
to ramp up inventories. Such forward-looking statements are based
on management’s reasonable current assumptions, expectations, plans
and forecasts regarding the company’s current or future results and
future business and economic conditions more generally. Such
forward-looking statements involve risks, uncertainties and other
factors, which may cause the actual results, levels of activity,
performance or achievement of the company to be materially
different from any future results expressed or implied by such
forward-looking statements, and there can be no assurance that
actual results will not differ materially from management’s
expectations or could affect the company’s ability to achieve its
strategic goals, including the uncertainties relating to the other
factors that are described in the sections entitled “Risk Factors”
in the company's Securities and Exchange Commission filings updated
from time to time. The preceding list is not intended to be an
exhaustive list of all of our forward-looking statements.
Therefore, you should not rely on any of these forward-looking
statements as predictions of future events. All forward-looking
statements contained in this release are qualified in their
entirety by this cautionary statement. Forward-looking statements
speak only as of the date they are or were made, and the company
does not intend to update or otherwise revise the forward-looking
statements to reflect events or circumstances after the date of
this release or to reflect the occurrence of unanticipated events,
except as required by law.
Unaudited Consolidated Statement of
Comprehensive Income
(Figures in million of U.S. dollars)
Three-month period ended
03/31/2024
Three-month period ended
03/31/2023
Revenues from contracts with customers
84.0
93.0
Initial recognition and changes in the
fair value of biological assets at the point of harvest
(0.1)
0.6
Cost of sales
(41.3)
(36.1)
Gross profit
42.6
57.5
% Gross profit
51%
61%
Operating expenses
(30.7)
(27.9)
Share of profit of JV
0.9
0.4
Change in net realizable value of
agricultural products
0.2
(1.1)
Other income or expenses, net
0.2
1.0
Operating profit
13.2
29.9
Financial result
(4.4)
(7.6)
Profit/(loss) before income tax
8.8
22.3
Income tax
1.0
5.2
Profit/(loss) for the period
9.8
27.5
Other comprehensive profit
0.2
(0.1)
Total comprehensive
profit/(loss)
10.0
27.4
Profit/(loss) for the period
attributable to:
Equity holders of the parent
9.3
28.1
Non-controlling interests
0.5
(0.7)
9.8
27.5
Total comprehensive profit/(loss)
attributable to:
Equity holders of the parent
9.5
28.2
Non-controlling interests
0.5
(0.8)
10.0
27.4
Weighted average number of
shares
Basic
62.8
62.0
Diluted
66.8
63.1
Unaudited Consolidated Statement of
Financial Position
(Figures in million of U.S. dollars)
ASSETS
03/31/2024
06/30/2023
CURRENT ASSETS
Cash and cash equivalents
16.4
48.1
Other financial assets
16.5
12.1
Trade receivables
212.1
158.0
Other receivables
30.7
28.8
Income and minimum presumed recoverable
income taxes
1.4
9.4
Inventories
129.2
140.4
Biological assets
1.9
0.1
Total current assets
408.1
397.1
NON-CURRENT ASSETS
Other financial assets
0.4
0.4
Other receivables
2.1
2.5
Income and minimum presumed recoverable
income taxes
0.0
0.0
Deferred tax assets
9.7
7.3
Investments in joint ventures and
associates
42.3
39.3
Investment properties
0.6
3.6
Property, plant and equipment
74.6
67.9
Intangible assets
174.5
173.8
Goodwill
112.2
112.2
Right-of-use leased asset
12.7
13.9
Total non-current assets
428.9
420.9
Total assets
837.0
818.1
LIABILITIES
CURRENT LIABILITIES
Trade and other payables
167.5
150.8
Borrowings
144.2
107.6
Employee benefits and social security
7.8
9.6
Deferred revenue and advances from
customers
5.5
24.9
Income tax payable
4.0
0.5
Consideration for acquisition
2.9
1.4
Lease liabilities
3.5
3.9
Total current liabilities
335.4
298.7
NON-CURRENT LIABILITIES
Borrowings
18.9
60.7
Deferred revenue and advances from
customers
2.8
2.1
Joint ventures and associates
0.0
0.6
Deferred tax liabilities
39.4
35.8
Provisions
0.8
0.9
Consideration for acquisition
2.7
3.6
Secured notes
79.7
75.2
Lease liabilities
24.4
10.0
Total non-current liabilities
153.0
188.9
Total liabilities
488.5
487.6
EQUITY
Equity attributable to owners of the
parent
313.4
298.6
Non-controlling interests
35.2
31.9
Total equity
348.5
330.5
Total equity and liabilities
837.0
818.1
View source
version on businesswire.com: https://www.businesswire.com/news/home/20240513598564/en/
Bioceres Crop Solutions Paula Savanti Head of Investor Relations
investorrelations@biocerescrops.com
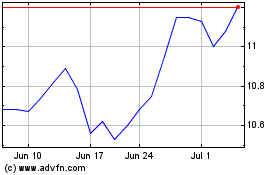
Bioceres Crop Solutions (NASDAQ:BIOX)
Historical Stock Chart
From Dec 2024 to Jan 2025

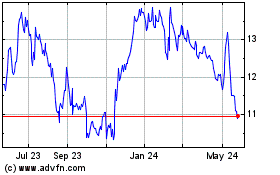
Bioceres Crop Solutions (NASDAQ:BIOX)
Historical Stock Chart
From Jan 2024 to Jan 2025
