0000750577falseDEF 14A00007505772021-01-012021-12-310000750577hwc:IncreaseForFairValueAsOfDecember31OfEachApplicableYearOfAllStockAwardsGrantedDuringThatYearAreOutstandingAndUnvestedAsOfSuchDateMemberecd:PeoMember2022-01-012022-12-310000750577hwc:IncreaseDeductionForChangeInFairValueFromDecember31OfThePriorYearToDecember31OfTheApplicableYearOfAnyAwardsGrantedInAPriorYearThatAreOutstandingAndUnvestedAsOfDecember31OfTheApplicableYearMemberecd:PeoMember2023-01-012023-12-310000750577ecd:NonPeoNeoMemberhwc:IncreaseDeductionForChangeInFairValueFromDecember31OfThePriorYearToDecember31OfTheApplicableYearOfAnyAwardsGrantedInAPriorYearThatAreOutstandingAndUnvestedAsOfDecember31OfTheApplicableYearMember2022-01-012022-12-310000750577ecd:NonPeoNeoMemberhwc:IncreaseDeductionForChangeInFairValueFromDecember31OfThePriorYearToTheVestingDateOfAnyAwardsGrantedInAnyPriorYearAsToWhichAllVestingConditionsWereSatisfiedDuringTheApplicableYearMember2023-01-012023-12-31000075057752023-01-012023-12-310000750577hwc:IncreaseDeductionForChangeInFairValueFromDecember31OfThePriorYearToDecember31OfTheApplicableYearOfAnyAwardsGrantedInAPriorYearThatAreOutstandingAndUnvestedAsOfDecember31OfTheApplicableYearMemberecd:PeoMember2020-01-012020-12-31000075057732023-01-012023-12-310000750577hwc:DeductionForChangesInTheActuarialPresentValueOfAccumulatedPensionBenefitsAndEarningsOnNonQualifiedDeferredCompensationPlansAsReportedMemberecd:PeoMember2021-01-012021-12-310000750577hwc:TotalCompensationAsReportedMemberecd:PeoMember2020-01-012020-12-310000750577hwc:DeductionForChangesInTheActuarialPresentValueOfAccumulatedPensionBenefitsAndEarningsOnNonQualifiedDeferredCompensationPlansAsReportedMemberecd:PeoMember2023-01-012023-12-3100007505772022-01-012022-12-310000750577hwc:IncreaseDeductionForChangeInFairValueFromDecember31OfThePriorYearToTheVestingDateOfAnyAwardsGrantedInAnyPriorYearAsToWhichAllVestingConditionsWereSatisfiedDuringTheApplicableYearMemberecd:PeoMember2020-01-012020-12-310000750577ecd:PeoMember2020-01-012020-12-3100007505772020-01-012020-12-310000750577ecd:NonPeoNeoMemberhwc:TotalCompensationAsReportedMember2023-01-012023-12-31000075057722023-01-012023-12-310000750577hwc:IncreaseForActuariallyDeterminedServiceCostAndPriorServiceCostForServicesRelatedToDefinedBenefitPensionPlansDuringTheApplicableYearMemberecd:PeoMember2022-01-012022-12-310000750577ecd:NonPeoNeoMemberhwc:IncreaseDeductionForChangeInFairValueFromDecember31OfThePriorYearToTheVestingDateOfAnyAwardsGrantedInAnyPriorYearAsToWhichAllVestingConditionsWereSatisfiedDuringTheApplicableYearMember2021-01-012021-12-310000750577ecd:NonPeoNeoMemberhwc:IncreaseDeductionForChangeInFairValueFromDecember31OfThePriorYearToTheVestingDateOfAnyAwardsGrantedInAnyPriorYearAsToWhichAllVestingConditionsWereSatisfiedDuringTheApplicableYearMember2022-01-012022-12-310000750577ecd:NonPeoNeoMemberhwc:IncreaseForActuariallyDeterminedServiceCostAndPriorServiceCostForServicesRelatedToDefinedBenefitPensionPlansDuringTheApplicableYearMember2023-01-012023-12-3100007505772023-01-012023-12-310000750577hwc:DeductionForGrantDateFairValuesOfStockAwardsGrantedInTheYearMemberecd:PeoMember2021-01-012021-12-310000750577ecd:NonPeoNeoMemberhwc:DeductionForGrantDateFairValuesOfStockAwardsGrantedInTheYearMember2021-01-012021-12-310000750577hwc:IncreaseDeductionForChangeInFairValueFromDecember31OfThePriorYearToTheVestingDateOfAnyAwardsGrantedInAnyPriorYearAsToWhichAllVestingConditionsWereSatisfiedDuringTheApplicableYearMemberecd:PeoMember2023-01-012023-12-31000075057742023-01-012023-12-310000750577hwc:IncreaseForActuariallyDeterminedServiceCostAndPriorServiceCostForServicesRelatedToDefinedBenefitPensionPlansDuringTheApplicableYearMemberecd:PeoMember2023-01-012023-12-310000750577hwc:IncreaseForActuariallyDeterminedServiceCostAndPriorServiceCostForServicesRelatedToDefinedBenefitPensionPlansDuringTheApplicableYearMemberecd:PeoMember2021-01-012021-12-310000750577ecd:NonPeoNeoMember2023-01-012023-12-310000750577ecd:NonPeoNeoMemberhwc:IncreaseForFairValueAsOfDecember31OfEachApplicableYearOfAllStockAwardsGrantedDuringThatYearAreOutstandingAndUnvestedAsOfSuchDateMember2023-01-012023-12-310000750577ecd:NonPeoNeoMemberhwc:TotalCompensationAsReportedMember2021-01-012021-12-310000750577ecd:NonPeoNeoMember2021-01-012021-12-310000750577hwc:IncreaseDeductionForChangeInFairValueFromDecember31OfThePriorYearToTheVestingDateOfAnyAwardsGrantedInAnyPriorYearAsToWhichAllVestingConditionsWereSatisfiedDuringTheApplicableYearMemberecd:PeoMember2021-01-012021-12-310000750577hwc:DeductionForGrantDateFairValuesOfStockAwardsGrantedInTheYearMemberecd:PeoMember2023-01-012023-12-310000750577ecd:NonPeoNeoMember2022-01-012022-12-310000750577ecd:NonPeoNeoMemberhwc:IncreaseForFairValueAsOfDecember31OfEachApplicableYearOfAllStockAwardsGrantedDuringThatYearAreOutstandingAndUnvestedAsOfSuchDateMember2022-01-012022-12-310000750577hwc:IncreaseDeductionForChangeInFairValueFromDecember31OfThePriorYearToTheVestingDateOfAnyAwardsGrantedInAnyPriorYearAsToWhichAllVestingConditionsWereSatisfiedDuringTheApplicableYearMemberecd:PeoMember2022-01-012022-12-310000750577hwc:IncreaseDeductionForChangeInFairValueFromDecember31OfThePriorYearToDecember31OfTheApplicableYearOfAnyAwardsGrantedInAPriorYearThatAreOutstandingAndUnvestedAsOfDecember31OfTheApplicableYearMemberecd:PeoMember2021-01-012021-12-310000750577hwc:IncreaseForFairValueAsOfDecember31OfEachApplicableYearOfAllStockAwardsGrantedDuringThatYearAreOutstandingAndUnvestedAsOfSuchDateMemberecd:PeoMember2023-01-012023-12-310000750577ecd:NonPeoNeoMemberhwc:IncreaseDeductionForChangeInFairValueFromDecember31OfThePriorYearToDecember31OfTheApplicableYearOfAnyAwardsGrantedInAPriorYearThatAreOutstandingAndUnvestedAsOfDecember31OfTheApplicableYearMember2021-01-012021-12-310000750577ecd:NonPeoNeoMemberhwc:DeductionForGrantDateFairValuesOfStockAwardsGrantedInTheYearMember2022-01-012022-12-310000750577ecd:NonPeoNeoMemberhwc:DeductionForChangesInTheActuarialPresentValueOfAccumulatedPensionBenefitsAndEarningsOnNonQualifiedDeferredCompensationPlansAsReportedMember2021-01-012021-12-310000750577ecd:NonPeoNeoMemberhwc:DeductionForGrantDateFairValuesOfStockAwardsGrantedInTheYearMember2023-01-012023-12-310000750577hwc:IncreaseForFairValueAsOfDecember31OfEachApplicableYearOfAllStockAwardsGrantedDuringThatYearAreOutstandingAndUnvestedAsOfSuchDateMemberecd:PeoMember2020-01-012020-12-310000750577ecd:PeoMember2023-01-012023-12-310000750577ecd:NonPeoNeoMemberhwc:IncreaseDeductionForChangeInFairValueFromDecember31OfThePriorYearToDecember31OfTheApplicableYearOfAnyAwardsGrantedInAPriorYearThatAreOutstandingAndUnvestedAsOfDecember31OfTheApplicableYearMember2023-01-012023-12-310000750577hwc:TotalCompensationAsReportedMemberecd:PeoMember2021-01-012021-12-310000750577hwc:IncreaseDeductionForChangeInFairValueFromDecember31OfThePriorYearToDecember31OfTheApplicableYearOfAnyAwardsGrantedInAPriorYearThatAreOutstandingAndUnvestedAsOfDecember31OfTheApplicableYearMemberecd:PeoMember2022-01-012022-12-310000750577hwc:TotalCompensationAsReportedMemberecd:PeoMember2023-01-012023-12-310000750577hwc:IncreaseForFairValueAsOfDecember31OfEachApplicableYearOfAllStockAwardsGrantedDuringThatYearAreOutstandingAndUnvestedAsOfSuchDateMemberecd:PeoMember2021-01-012021-12-31000075057712023-01-012023-12-310000750577ecd:NonPeoNeoMemberhwc:TotalCompensationAsReportedMember2022-01-012022-12-310000750577ecd:PeoMember2022-01-012022-12-310000750577ecd:PeoMember2021-01-012021-12-310000750577hwc:IncreaseForActuariallyDeterminedServiceCostAndPriorServiceCostForServicesRelatedToDefinedBenefitPensionPlansDuringTheApplicableYearMemberecd:PeoMember2020-01-012020-12-310000750577hwc:DeductionForGrantDateFairValuesOfStockAwardsGrantedInTheYearMemberecd:PeoMember2020-01-012020-12-310000750577ecd:NonPeoNeoMemberhwc:DeductionForChangesInTheActuarialPresentValueOfAccumulatedPensionBenefitsAndEarningsOnNonQualifiedDeferredCompensationPlansAsReportedMember2023-01-012023-12-310000750577ecd:NonPeoNeoMemberhwc:IncreaseForActuariallyDeterminedServiceCostAndPriorServiceCostForServicesRelatedToDefinedBenefitPensionPlansDuringTheApplicableYearMember2021-01-012021-12-310000750577ecd:NonPeoNeoMemberhwc:IncreaseForActuariallyDeterminedServiceCostAndPriorServiceCostForServicesRelatedToDefinedBenefitPensionPlansDuringTheApplicableYearMember2022-01-012022-12-310000750577hwc:TotalCompensationAsReportedMemberecd:PeoMember2022-01-012022-12-310000750577hwc:DeductionForGrantDateFairValuesOfStockAwardsGrantedInTheYearMemberecd:PeoMember2022-01-012022-12-310000750577ecd:NonPeoNeoMemberhwc:IncreaseForFairValueAsOfDecember31OfEachApplicableYearOfAllStockAwardsGrantedDuringThatYearAreOutstandingAndUnvestedAsOfSuchDateMember2021-01-012021-12-310000750577hwc:DeductionForChangesInTheActuarialPresentValueOfAccumulatedPensionBenefitsAndEarningsOnNonQualifiedDeferredCompensationPlansAsReportedMemberecd:PeoMember2020-01-012020-12-31iso4217:USD
UNITED STATES
SECURITIES AND EXCHANGE COMMISSION
Washington, D.C. 20549
SCHEDULE 14A
Proxy Statement Pursuant to Section 14(a) of the
Securities Exchange Act of 1934
(Amendment No. )
Filed by the Registrant
Filed by a Party other than the Registrant
Check the appropriate box:
|
|
|
|
|
|
|
Preliminary Proxy Statement |
|
|
|
|
Confidential, for Use of the Commission Only (as permitted by Rule 14a-6(e)(2)) |
|
|
|
|
Definitive Proxy Statement |
|
|
|
|
Definitive Additional Materials |
|
|
|
|
Soliciting Material under §240.14a-12 |
|
HANCOCK WHITNEY CORPORATION |
|
(Name of registrant as specified in its charter) |
|
(Name of person(s) filing proxy statement, if other than the registrant) |
|
Payment of Filing Fee (Check all boxes that apply): |
|
|
|
|
No fee required |
|
|
Fee paid previously with preliminary materials |
|
|
Fee computed on table below per Exchange Act Rules 14a-6(i)(1) and 0-11 |
|
|
|
|
|
|
|
|
|
|
|
|
|
|
|
March 11, 2025 |
|
|
To Our Shareholders:
In 2024, Hancock Whitney celebrated the 125th anniversary of the original bank charter our founders established in 1899. We are incredibly proud of our progress over the past one-and-a-quarter century, growing from two smaller banks based in the Gulf South – Hancock Bank in Gulfport, Mississippi, and Whitney Bank in New Orleans – to a regional financial services institution with total assets of $35.1 billion at year end and approximately 3,500 associates serving clients and communities across the five contiguous Gulf Coast states. We believe we are well-positioned to help build a brighter future for our shareholders, clients, associates, and communities we serve for many years to come.
Financial Highlights
The financial results from 2024 reflect a year of improving profitability and strengthening capital. Net income per diluted share (EPS) was $5.28, compared to $4.50 in 2023. Adjusted pre-provision net revenue (PPNR)* totaled $641.0 million in 2024, compared to $635.7 million in 2023.
In 2024, fee income increased 8%, compared to fee income in 2023, adjusted for supplemental disclosure items. Our remarkable associates worked to grow fee income across most categories, and we remain focused on finding opportunities to continue to build these income streams. Expenses, adjusted for supplemental disclosure items, were up less than 1% in 2024, demonstrating our ability to control costs while still making thoughtful reinvestments in the company.
Supplemental disclosure items in 2024 include a net charge of $3.8 million (pre-tax), or $0.03 per share after tax, related to an FDIC special assessment charge. The results in 2023 include a net charge of $75.4 million (pre-tax), or $0.68 per share after tax of miscellaneous supplemental disclosure items.
Net interest margin for 2024 was 3.37%, up 3 bps from 2023, reflecting our ability to earn higher yields on average earning assets that offset higher funding costs in this changing interest rate environment. In 2024, we focused on originating more granular, full-service-relationship loans and reducing our exposure to higher balance, loan-only relationships. Our deposit base is stable and diverse, with a non-interest bearing deposit mix of 36% at year-end 2024, compared to 37% at year-end 2023. Criticized loan levels normalized in 2024, and we ended the year with a robust allowance for credit losses reserve coverage of 1.47%.
We finished 2024 with remarkably strong capital, with another year of growth in all of our capital metrics. We ended 2024 with a tangible common equity (TCE) ratio of 9.47% and common equity tier 1 (CET1) ratio of 14.14%, compared to TCE of 8.37% and CET1 ratio of 12.33% at year-end 2023. Total risk-based capital ratio was 15.93% at year-end 2024, compared to 13.93% at year-end 2023.
In April 2024, the Hancock Whitney Corporation Board of Directors approved an increase of $0.10 per common share, or 33%, on the quarterly dividend payment, which brought total dividends payable to shareholders to $0.40 per common share. In January 2025, the Board of Directors approved a further dividend increase to $0.45 per common share. We are very proud to have paid an uninterrupted quarterly dividend since 1967 and we are delighted we could increase this payment. We are also happy to report improvement in our stock price. We ended 2024 with a closing price of $54.72, up from $48.59 at December 31, 2023, and we achieved a record high closing price of $61.04 on November 25, 2024.
With our de-risked balance sheet, remarkably strong capital, solid deposit base, improved profitability, and solid allowance for credit losses, we believe we are well-positioned to continue to create value for you, our shareholders, for years to come.
Board of Directors
In 2024, Hancock Whitney Corporation appointed Moses H. Feagin Sr. to our Board of Directors. Mr. Feagin will be standing for election at this year’s shareholders’ meeting, along with our newest director nominee, Albert J. Williams. Both nominees bring their respective industry backgrounds and regional knowledge to the Board, as well as solid experience in large companies. One member of our Board will not be standing for re-election, Hardy B. Fowler. We thank him for his 15 years of dedicated service to Hancock Whitney. His expertise and remarkable career have been an invaluable resource to the Board.
Our Board of Directors, executive teams, and associates thank you for your continued confidence in Hancock Whitney.
|
|

|

|
Jerry L. Levens Chairman of the Board |
John M. Hairston President & CEO |
* Non-GAAP measure. Reconciliation included in the following proxy statement.
March 11, 2025
NOTICE OF ANNUAL MEETING OF SHAREHOLDERS
_______________________________
To our Shareholders:
Hancock Whitney Corporation (the Company) will hold its Annual Meeting of Shareholders on Wednesday, April 23, 2025, at 11:00 a.m. Central Time in virtual-only format via audio webcast. To attend the annual meeting, go to www.virtualshareholdermeeting.com/HWC2025 and log in using the control number on your proxy card, voting instruction form or notice. The annual meeting will be held for the following purposes:
1.To elect six directors to serve until the 2028 annual meeting of shareholders;
2.To approve, on an advisory basis, the compensation of our named executive officers;
3.To approve an amendment to the Hancock Whitney Corporation 2020 Long Term Incentive Plan to increase the number of shares available by 1,300,000; and
4.To ratify the selection of PricewaterhouseCoopers LLP as the Company’s independent registered public accounting firm for 2025.
Only holders of record of shares of our common stock at the close of business on February 28, 2025 are entitled to notice of, and to vote at, the meeting or any adjournment thereof. We direct your attention to the attached proxy statement for more complete information regarding the matters to be acted upon at the annual meeting.
Your vote is important, whether or not you expect to attend the meeting. If voting by mail, please mark, date, sign and promptly return the enclosed proxy in the accompanying envelope. No postage is required if mailed in the United States. You may later revoke your proxy and vote during the meeting.
By order of the Board of Directors,
|
|

|

|
Jerry L. Levens Chairman of the Board |
John M. Hairston President & CEO |
|
|
|
|
|
|
|
Important Notice Regarding the Availability of Proxy Materials for the Shareholder Meeting to be held on April 23, 2025: The notice of annual meeting, proxy statement, proxy card and the 2024 annual report for the period ending December 31, 2024, are available at https://materials.proxyvote.com/410120 |
|
|
|
|
Table of Contents
This summary highlights certain information contained elsewhere in this proxy statement. This summary does not contain all of the information you should consider prior to voting. Please read the entire proxy statement carefully before voting.
|
|
|
2025 Annual Meeting Information (see pages 5-9) |
|
|
|
Date: |
|
Wednesday, April 23, 2025 |
|
|
|
Time: |
|
11:00 a.m. Central Time |
|
|
|
Location: |
|
Please visit www.virtualshareholdermeeting.com/HWC2025 |
|
|
|
Record Date: |
|
February 28, 2025 |
|
|
|
Admission: |
|
To attend and participate in the meeting, you will need the control number included on your proxy card or notice if you are a shareholder of record or included in your voting instruction card and voting instructions you received from your broker. Although you may vote online during the virtual Annual Meeting, we encourage you to vote via the Internet, by telephone or by mail prior to the meeting as outlined in the Notice of Internet Availability of Proxy Materials or on your proxy card to ensure that your shares are represented and voted. |
|
|
|
|
|
Items of Business |
|
|
Proposal |
Board Recommendation |
Page Number |
1. |
|
Elect six directors to serve until the 2028 annual meeting of shareholders |
FOR all Nominees |
9 |
|
|
|
|
|
2. |
|
Approve, on an advisory basis, the compensation of our named executive officers |
FOR |
59 |
|
|
|
|
|
3. |
|
Approve an amendment to the Hancock Whitney Corporation 2020 Long Term Incentive Plan to increase the number of shares available by 1,300,000; and |
FOR |
60 |
|
|
|
|
|
4. |
|
Ratify the selection of PricewaterhouseCoopers LLP as the Company's independent registered public accounting firm for 2025 |
FOR |
68 |
|
Fiscal 2024 Company Performance Highlights (see pages 34-35) |
|
Hancock Whitney exhibited solid performance in 2024 and we believe our results reflect our continued strength and stability. Net income for the year ended December 31, 2024 was $460.8 million, or $5.28 per diluted common share, compared to $392.6 million, or $4.50 per diluted common share in 2023. The results for 2024 include a net charge of $3.8 million (pre-tax), or $0.03 per share after tax, related to the FDIC special assessment charge. The results for 2023 include a net charge of $75.4 million (pre-tax), or $0.68 per share after tax, comprised of the following supplemental disclosure items: a $65.4 million loss on restructuring of the securities portfolio; a $26.1 million FDIC special assessment charge; and a $16.1 million gain on the sale of a parking facility. We ended 2024 with strong capital, ample liquidity, a seasoned and diversified deposit base, and a solid allowance for credit losses. The following is an overview of financial results for the year ended December 31, 2024: •Net income of $460.8 million, or $5.28 per diluted common share, in 2024 •Adjusted pre-provision net revenue* totaled $641.0 million in 2024, up $5.3 million from 2023 •Loans at December 31, 2024 were $23.3 billion, compared to $23.9 billion at December 31, 2023; decline reflects a strategic reduction of the shared national credit portfolio as we focus on originating more granular loans •Total assets at December 31, 2024 were $35.1 billion, down $496.8 million, or 1%, compared to December 31, 2023 •Deposits of $29.5 billion at December 31, 2024 decreased $197.2 million, or 1%, from December 31, 2023; noninterest bearing deposits comprised 36% of total deposits at December 31, 2024, compared to 37% at December 31, 2023 |
|
•Total available on and off-balance sheet liquidity exceeded total noncollateralized, uninsured deposits throughout 2024 •Criticized commercial loans and nonaccrual loans normalized in 2024; robust allowance for credit loss to total loans of 1.47% at December 31, 2024 •Capital ratios remain strong and well above regulatory minimums with common equity tier 1 ratio (CET1) of 14.14% at December 31, 2024, up 181 bps from December 31, 2023; tangible common equity ratio was 9.47% at December 31, 2024, up 110 bps from December 31, 2023; remain well-capitalized including all unrealized losses •Net interest margin increased 3 basis points (bps) to 3.37% in 2024, driven by the changing interest rate environment •Efficiency ratio* of 55.36% in 2024, compared to 55.25% in 2023 •In April 2024, the company’s Board of Directors declared a 33% increase in the regular quarterly cash dividend to $0.40 per share, reflecting our strong regulatory ratios allowing for improved shareholder returns * For more information and for a reconciliation of this and other non-GAAP financial measures, refer to Appendix A to this proxy statement. |
|
Corporate Governance Highlights |
|
|
Independent Oversight •Independent director, Jerry L. Levens, serves as the chairman of our Board. His responsibilities and duties promote our Board’s independent functioning. •With the exception of Mr. Hairston, who is our only employee director, all of our directors are independent under the listing standards of The NASDAQ Stock Market, LLC. •Our independent directors meet regularly in executive session without members of management present. •With the exception of our Executive Committee, which includes Mr. Hairston, our Board committees and committee leadership are comprised entirely of independent directors. Shareholder Engagement •We strive to maintain open and transparent communications with our shareholders and aim to optimize opportunities for engagement. •We utilize various channels to engage with shareholders and analysts including face-to-face and virtual meetings, conferences, road shows, investor calls, quarterly earnings calls, and annual shareholder meetings, as well as distributing regular communications through our quarterly shareholder letter and annual proxy statement. •In 2024, we communicated with approximately 315 current and potential analysts and investors at 51 different investor conferences or industry sponsored calls, and in individual management calls. Additionally, we held annual review meetings with the rating agencies S&P Global and Moody’s Investor Services. •We maintain ongoing responsiveness to institutional and retail shareholders who directly contact us, and we remain committed to timely follow-up. Diversifying and Refreshing the Board’s Perspective •Our Board seeks out independent, highly qualified candidates who also reflect a breadth of experience, skills, perspective, background, and geography, encouraging cognitive diversity and aiding in effective, independent oversight on behalf of all shareholders and stakeholders. •Our Board values fresh perspectives and 27% of our directors have been added since 2019. •Half of the directors added to our Board since 2019 are women and one-third of our current directors are women, with four of the five women on our Board serving in leadership roles. •Our ongoing director training program provides continuing education on various issues of importance to the Company. •We have a mandatory retirement policy for directors that prohibits re-election after their 72nd birthday. •Our Board has established an ongoing Board succession planning process to ensure our Board continues to have the depth and breadth of experience and perspective needed for a strong financial institution. |
|
Good Governance Practices •Our Corporate Governance and Nominating Committee is responsible for overseeing the Company’s corporate governance strategies and initiatives. •Our Compensation Committee is responsible for overseeing the Company’s human capital strategies. •We have established a Sustainability Committee chaired by our Chief Risk Officer and comprised of senior executives. This management committee is responsible for assisting with the development and implementation of strategies and initiatives relating to overall corporate responsibility and environmental governance. |
|
•Each member of our Audit Committee has banking or related financial management expertise and all four members are “financial experts” as defined by the Securities and Exchange Commission (SEC). •Our Insider Trading Policy prohibits directors, officers and other associates from hedging Hancock Whitney stock. •During 2024, none of our directors held shares of Company stock that were pledged. •We have stock ownership and retention guidelines for directors and executive officers. •During 2024, each of the incumbent directors attended at least 75% of the aggregate number of meetings of the Board and the committees of the Board on which he or she served and all directors attended our 2024 annual meeting of shareholders. •Our directors perform an annual evaluation of the Board to satisfy its obligation to represent the long-term interests of our shareholders, clients, communities and associates. •Our Corporate Governance Guidelines prohibit our directors from serving on more than three other public company boards in addition to our Board. |
Executive Compensation Best Practices (see pages 36-37) |
•Significant percentage of executive target compensation is performance-based •Majority of long-term incentives awarded to executives are performance-based •No excise tax gross-up provisions in change in control agreements •Compensation recoupment policy compliant with applicable listing standards of Nasdaq and Rule 10D-1 under the Exchange Act including mandatory and discretionary recoupment •Stock ownership requirements |
|
|
|
|
|
|
Current Directors and Director Nominees |
Name |
2025
Nominee |
Director Since |
Independent |
Position |
Current
Committee Memberships |
Moses H. Feagin Sr. |
ü |
2024 |
ü |
Executive Vice President, Treasurer and Chief Financial Officer of Alabama Power |
Audit
Board Risk |
Randall W. Hanna |
ü |
2009 |
ü |
Dean of Florida State University Panama City and Florida State University College of Applied Studies |
Board Risk
Executive |
H. Merritt Lane, III |
ü |
2021 |
ü |
Chairman, President and Chief Executive of Canal Barge Company, Inc. |
Board Risk
Compensation |
Sonya C. Little |
ü |
2016 |
ü |
Former Chief Administrative Officer of Strategic Property Partners |
Audit (Vice Chair)
Corporate Governance & Nominating |
Sonia A. Pérez |
ü |
2021 |
ü |
Retired President of Southeast States, AT&T Inc. |
Board Risk |
Albert J. Williams |
ü |
Nominee |
ü |
Vice President and Senior Advisor, Corporate Affairs for Chevron Corporation |
|
Frank E. Bertucci |
|
2000 |
ü |
President of F.E.B. Distributing Co., Inc. and Chief Executive Officer of Capital City Beverage |
Board Risk (Chair)
Executive |
Hardy B. Fowler |
|
2011 |
ü |
Managing Member of Hardy B. Fowler L.L.C. |
Audit
Compensation (Chair)
Board Risk
Executive |
John M. Hairston |
|
2006 |
|
President of the Company and Chief Executive Officer of the Company and the Bank |
Executive |
Suzette K. Kent |
|
2020 |
ü |
CEO of Kent Advisory Services, LLC and Former Federal Chief Information Officer of the United States |
Corporate Governance &
Nominating (Vice Chair) |
Jerry L. Levens
(Chairman of the Board) |
|
2009 |
ü |
Retired Partner of CPA firm of Alexander, Van Loon, Sloan, Levens & Favre, PLLC |
Audit
Compensation
Executive (Chair) |
Constantine S. Liollio |
|
2016 |
ü |
Senior Vice President, Special Projects, Plains All American |
Compensation (Vice Chair)
Corporate Governance &
Nominating
Executive |
Thomas H. Olinde |
|
2009 |
ü |
President of Olinde Hardware and Supply Co., Inc. and Managing Member and Director of B. Olinde and Sons Co., LLC |
Compensation
Corporate Governance &
Nominating (Chair)
Executive |
Christine L. Pickering |
|
2000 |
ü |
Owner of Christy Pickering, CPA |
Audit (Chair)
Corporate Governance &
Nominating
Executive |
Joan C. Teofilo |
|
2016 |
ü |
President and Chief Executive Officer of The Energy Authority |
Board Risk (Vice Chair) |
C. Richard Wilkins |
|
2016 |
ü |
Sole Member, C. Richard Wilkins, Attorney at Law, PLLC |
Board Risk |
|
INFORMATION ABOUT THE ANNUAL MEETING AND VOTING |
Why am I receiving these proxy materials?
You are receiving these materials because you owned shares of our common stock at the close of business on February 28, 2025, the record date for the meeting, and are entitled to vote those shares at the meeting. All materials for the 2025 annual meeting are available to you online at https://materials.proxyvote.com/410120 beginning on March 11, 2025 and, in some cases, we have delivered printed proxy materials to you. This proxy statement summarizes information you should consider in connection with the matters that will be voted on at the annual meeting. You do not need to attend the annual meeting to vote your shares.
When and where is the annual meeting?
We will hold the annual meeting on Wednesday April 23, 2025, at 11:00 a.m. Central Time in a virtual-only format via audio webcast. Shareholders will be able to attend the annual meeting by visiting www.virtualshareholdermeeting.com/HWC2025. There will be no physical, in-person meeting. See “How can I attend the annual meeting?” below regarding how to attend the meeting.
How can I attend the annual meeting?
If you are a shareholder of record or beneficial owner of common stock holding shares on February 28, 2025, the record date, you may attend the meeting by visiting www.virtualshareholdermeeting.com/HWC2025 and logging in by entering the control number found on your proxy card, voting instruction form or notice, as applicable.
Shareholders who cannot locate their control number and whose shares are (i) held of record (directly with our transfer agent) or (ii) credited to their associate account in the Hancock Whitney Corporation 401(k) Savings Plan, may contact our Investor Relations team at InvestorRelations@hancockwhitney.com to receive a duplicate control number. Shareholders who cannot locate their control number and whose shares are held in street name (through a broker, bank or other nominee) should contact their broker or nominee to receive a duplicate control number.
Why did I receive a notice of internet availability of proxy materials instead of a full set of proxy materials?
In accordance with the rules of the SEC, we are permitted to furnish proxy materials, including this proxy statement and our 2024 annual report, to shareholders by providing access to these documents online instead of mailing printed copies. Most shareholders will not receive printed copies of the proxy materials unless requested. Instead, most shareholders will only receive a notice that provides instructions on how to access and review our proxy materials online. We have elected electronic access to our proxy materials to save the Company the cost of producing and mailing these documents. We believe this expedites shareholder receipt of proxy materials, lowers the costs incurred by us and conserves natural resources. The notice also provides instructions on how to submit your proxy and vote online or by phone. If you would like to receive a printed copy or emailed copy of our proxy materials free of charge, please follow the instructions set forth in the notice to request the materials.
Who is soliciting my proxy?
Our Board is soliciting a proxy to vote the shares that you are entitled to vote at our 2025 annual meeting, whether or not you attend the meeting. By completing, signing, dating and returning the proxy card or voting instruction card, or submitting your proxy online or by phone with your voting instructions, you are authorizing the proxy holders to vote your shares at our annual meeting in accordance with your instructions.
Who may vote at the annual meeting?
You may vote at the annual meeting if you owned Company common stock at the close of business on February 28, 2025, the record date for the meeting. You are entitled to one vote for each share of our common stock held by you on the record date, including shares:
|
•held directly in your name with our transfer agent (with respect to such shares you are referred to as the “shareholder of record”); |
•held for you in an account with a broker, bank or other nominee (such shares are considered to be held in “street name”); and |
•credited to your associate account in the Hancock Whitney Corporation 401(k) Savings Plan (the Hancock Whitney 401(k) Plan). |
How many shares must be present to hold the annual meeting?
A majority of the outstanding shares of our common stock as of the record date must be present at the annual meeting to convene the meeting and conduct business. This is called a quorum. On the record date, there were 86,127,857 shares of our common stock outstanding and entitled to vote. Accordingly, 43,063,929 shares of our common stock constitute a
quorum. If you are a street name holder and you do not instruct your broker or nominee how to vote your shares on any of the proposals, and your broker or nominee submits a proxy with respect to your shares on a matter with respect to which discretionary voting is permitted, your shares will be counted as present at the annual meeting for purposes of determining whether a quorum exists. In addition, shareholders of record who are present at the annual meeting virtually (see “How can I attend the annual meeting” above for information on how to attend virtually) or by proxy will be counted as present at the annual meeting for purposes of determining whether a quorum exists, whether or not such holder abstains from voting on any or all of the proposals.
What proposals are scheduled for a vote at the annual meeting?
There are four proposals scheduled for a shareholder vote at the annual meeting:
|
|
|
1. |
|
To elect six directors to serve until the 2028 annual meeting of shareholders; |
2. |
|
To approve, on an advisory basis, the compensation of our named executive officers (say-on-pay proposal); |
3. |
|
To approve an amendment to the Hancock Whitney Corporation 2020 Long Term Incentive Plan to increase the number of shares available by 1,300,000; and |
4. |
|
To ratify the selection of PricewaterhouseCoopers LLP as the Company’s independent registered public accounting firm for 2025. |
How do I vote my shares and ask questions during the annual meeting?
Shareholders may vote and submit questions during the annual meeting by following the instructions available on the virtual meeting website. Technical assistance will be available for those attending the meeting. See “How can I attend the annual meeting?” above regarding how to attend the meeting.
Shareholders may also submit questions in advance of the meeting at www.proxyvote.com by entering the control number found on their proxy card, voting instruction form or notice, as applicable, and following the instructions on that site. We encourage shareholders who wish to submit a question to read our rules and procedures for the conduct of the annual meeting appearing on the proxy vote and virtual shareholder meeting websites.
Even if you plan to attend the annual meeting, we encourage you to submit your voting instructions and proxy online, by phone or by mail (as described below) so your shares will be counted as present and voted if you later decide not to attend.
How do I vote my shares without attending the annual meeting?
Whether you hold shares in your own name, in street name or through the Hancock Whitney 401(k) Plan, you may vote your shares without attending the annual meeting.
Shareholders of Record and Shareholders through the Hancock Whitney 401(k) Plan: You may submit a proxy to vote your shares in any of the following ways:
•Online – You may submit your proxy and voting instructions online by following the instructions on the notice or proxy card prior to the deadline for online submissions. If you submit your proxy and voting instructions online, you do not need to return a proxy card. The online submission procedures will authenticate your identity as a shareholder, allow you to give your voting instructions and submit your proxy and confirm that your instructions have been properly received. The deadline for online submissions is 11:59 p.m. Eastern Time (10:59 p.m. Central Time) on April 22, 2025.
•By Phone – You may submit your proxy and voting instructions by using any touch-tone telephone and following the instructions on the notice or proxy card prior to the deadline for telephone submissions. If you submit your proxy and voting instructions by telephone, you do not need to return a proxy card. The telephone submission procedures will authenticate your identity as a shareholder, allow you to give your voting instructions and submit your proxy and confirm that your instructions have been properly received. The deadline for phone submissions is 11:59 p.m. Eastern Time (10:59 p.m. Central Time) on April 22, 2025.
•By Mail – If you received or requested printed materials, you may submit your proxy and voting instructions by mail by completing, signing, dating, and returning your proxy card in the postage prepaid envelope provided. You should sign your name exactly as it appears on the proxy card. If you are signing in a representative capacity (for example as guardian, executor, trustee, custodian, attorney, or officer of a corporation), you should indicate your name and your title or capacity. The Corporate Secretary must receive your proxy card by 9:00 a.m. Central Time on April 23, 2025 in order for your shares to be voted.
Street Name Shareholders: For shares held in street name, you should follow the voting directions provided by your broker or nominee. You may complete and mail a voting instruction card to your broker or nominee or, if permitted by your broker or nominee, submit voting instructions online. If you provide specific voting instructions, your broker or nominee will vote your shares as you direct.
What happens if I submit a proxy without complete instructions or if I do not vote at all? On which proposals may my shares be voted without receiving voting instructions from me?
If you properly complete, sign, date, and return a proxy or voting instruction card, or submit your proxy online, your stock will be voted as you specify.
If you do not submit a proxy or voting instruction card, or if you submit a properly executed proxy with incomplete voting instructions, whether your shares may be voted depends upon two factors – whether you are a shareholder of record or a street name shareholder and, if you are a street name shareholder, whether the proposal is considered routine or non-routine under New York Stock Exchange rules that apply to securities intermediaries (such as brokers, banks, and other nominees).
Shareholders of Record and Shareholders through the Hancock Whitney 401(k) Plan: If you do not provide voting instructions on any matter (either by not returning a proxy card or not voting online or due to incomplete voting instructions) and you do not vote during the meeting, your shares will not be voted on the matter for which instructions are not received. If you do not submit a proxy at all and do not vote during the annual meeting, your shares will not be voted on any matter. However, if you submit a properly executed proxy card but do not provide voting instructions, your proxy will vote as recommended by the Board of Directors, which will be as follows at the 2025 Annual Meeting: FOR all six nominees under Proposal 1, FOR Proposal 2, FOR Proposal 3, FOR Proposal 4, and as the proxies decide on any matter properly brought before the meeting.
Street Name Shareholders: If you hold shares in street name and you do not provide voting instructions to your broker, bank, or other nominee, your broker, bank, or other nominee only has discretionary authority to vote your shares on routine matters. The proposal to ratify the Board’s selection of the independent registered public accounting firm is considered a routine matter. However, the proposal to elect directors, the say-on-pay proposal and the proposal to amend our 2020 Long Term Incentive Plan are each considered non-routine matters and if you do not provide voting instructions on those non-routine proposals your shares will not be voted on those proposals.
A broker non-vote occurs when a broker holding shares for you in street name submits a proxy that votes your shares on one or more matters, but does not vote (the broker non-vote) on non-routine matters with respect to which you have not given voting instructions.
What are my voting options for each proposal? How does the Board of Directors recommend that I vote? How many votes are required to approve each proposal? How are the votes counted?
The following chart explains what your voting options are with regard to each matter proposed in this proxy statement, how the Board of Directors recommends that you vote on each proposal, what vote is required for each proposal to be approved, and how abstentions, withheld votes, and broker non-votes will affect the outcome of each proposal.
|
|
|
|
|
|
|
|
|
Proposal |
|
Election of
Directors |
|
Say-on-Pay
(advisory) |
|
Amendment of the
2020 Long Term
Incentive Plan |
|
Ratification of Selection
of Auditors for 2025 |
Your Voting Options |
|
You may vote “FOR” each nominee or choose to “WITHHOLD” your vote for one or more of the six nominees. |
|
You may vote “FOR” or “AGAINST” this proposal or you may “ABSTAIN” from voting. |
|
You may vote “FOR” or “AGAINST” this proposal or you may “ABSTAIN” from voting. |
|
You may vote “FOR” or “AGAINST” this proposal or you may “ABSTAIN” from voting. |
|
|
|
|
|
|
|
|
|
Recommendation of the Board of Directors |
|
The Board recommends you vote “FOR” each of the six nominees. |
|
The Board recommends that you vote “FOR” the approval, on an advisory basis, of the compensation of our named executive officers as disclosed in this proxy statement. |
|
The Board recommends that you vote “FOR” the approval of the amendment of the 2020 Long Term Incentive Plan. |
|
The Board recommends that you vote “FOR” ratification of our selection of PricewaterhouseCoopers LLP as the Company's independent registered public accounting firm for 2025. |
|
|
|
|
|
|
|
|
|
Vote Required for Approval |
|
Plurality of the votes cast* |
|
Majority of the votes cast |
|
Majority of the votes cast |
|
Majority of the votes cast |
|
|
|
|
|
|
|
|
|
Effect of Withheld Vote or Abstention |
|
No effect |
|
No effect |
|
No effect |
|
No effect |
|
|
|
|
|
|
|
|
|
Effect of Broker Non-vote |
|
No effect |
|
No effect |
|
No effect |
|
Not applicable |
* A plurality vote means that the six nominees who receive the six highest numbers of votes cast in the election of directors will be elected as directors, even if less than a majority.
What does it mean if I receive more than one set of proxy materials?
If you receive more than one notice, proxy card or voting instruction card, it means you hold shares registered in more than one name, or through multiple street name accounts. To ensure that all of your shares are represented at the meeting and voted, complete, sign, date and return each proxy card or voting instruction card, or if you submit your proxy and voting instructions online or by phone, do so for each notice, proxy card and voting instruction card you receive. If you plan to vote during the annual meeting, please refer to “How do I vote my shares and ask questions during the annual meeting?” above for additional information.
May I change my vote?
Yes. Your proxy may be revoked or changed at any time before it is voted by providing notice of revocation in writing to our Corporate Secretary, by our timely receipt of another proxy with a later date, by a later-dated online vote, or by voting during the annual meeting. Written notice should be provided to Juanita P. Kuhner, our Corporate Secretary, at or before the annual meeting. Ms. Kuhner’s office is located in Hancock Whitney Plaza, 2510 14th Street, Gulfport, Mississippi 39501. The notice must be received prior to the exercise of the proxy. Your attendance alone at the annual meeting will not be enough to revoke your proxy.
If you hold shares in street name, you must follow your broker’s instructions to change your vote.
Who pays for soliciting proxies?
The Company pays all costs of soliciting proxies. In addition, directors, officers and regular associates of the Company and its banking subsidiary, Hancock Whitney Bank (the Bank), may solicit proxies by mail, telephone, email or personal interview, but will not receive additional compensation for such solicitations.
Could other matters be considered and voted upon at the annual meeting?
Our Board does not expect to bring any other matter before the annual meeting, and it is not aware of any other matter that may be considered at the annual meeting. In addition, pursuant to our Bylaws, the deadline has expired for any shareholder to properly bring a matter before the annual meeting. However, if any other matter does properly come before the annual meeting, each of the proxy holders will vote in his discretion on such matter.
What happens if the annual meeting is postponed or adjourned?
Unless a new record date is fixed, your proxy will still be valid and may be voted at the postponed or adjourned annual meeting. You will still be able to change or revoke your proxy until it is used to vote your shares of our common stock.
How do I obtain additional copies of SEC filings?
Copies of all of our filings with the SEC may be obtained free of charge by clicking on “SEC Filings” on our Investor Relations website at investors.hancockwhitney.com.
If you would like to receive a printed copy of our reports on Forms 10-K and 10-Q as filed with the SEC, you may request these by contacting Kathryn Shrout Mistich, Manager, Investor Relations, Hancock Whitney Corporation, by mail at P.O. Box 4019, Gulfport, Mississippi 39502; or by phone at (504) 539-7836 or toll free (800) 522-6542; or by sending an e-mail to the following address: InvestorRelations@hancockwhitney.com. We will provide printed copies of our Forms 10-K and 10-Q to you free of charge (including any financial statements and financial statement schedules), but delivery of any other exhibits to those filings will require advance payment of a fee.
|
PROPOSAL NO. 1 ELECTION OF DIRECTORS |
|
Our Articles of Incorporation authorize the Board to determine how many directors the Company will have, provided that the Company must at all times have at least nine directors, divided into three classes. As of the record date, we had 15 directors, 14 of whom are independent and six of whom have terms expiring at the annual meeting.
Director Election Requirements
Directors are elected by a plurality of the votes cast, which means that the six director nominees who receive the highest number of shares voted “for” their election are elected to the Board. Our Board has adopted a director resignation policy, which provides that if a director standing for election receives a greater number of “withheld” votes than “for” votes, the director will promptly tender his or her resignation. The Corporate Governance and Nominating Committee (the Corporate Governance Committee) will recommend to the Board whether to accept or reject the resignation and otherwise address any noted shareholder concerns. The Board will act on the Corporate Governance Committee’s recommendation within 90 days of the annual meeting, and the Company will disclose the Board’s decision and any other material information on a current report on Form 8-K filed with the SEC.
In the unexpected event that, prior to the date of the annual meeting, any nominee becomes unwilling or unable to serve, it is intended that the proxy holders will vote for the election of any replacement nominee recommended by the Board.
Nominations for election to the Board may be made as set forth under the heading “Board of Directors and Corporate Governance – Corporate Governance and Nominating Committee” on page 30 of this proxy statement.
Nominees for Election as Directors
Five of the six directors described below have terms expiring at the annual meeting and have been nominated for re-election. One is a new nominee for election to the Board.
|
|
|
|
|
Director Nominees |
Name |
2025
Nominee |
Director Since |
Position |
Current
Committee Memberships |
Moses H. Feagin Sr.
Independent |
ü |
2024 |
Executive Vice President, Treasurer and Chief Financial Officer of Alabama Power |
Audit
Board Risk |
Randall W. Hanna
Independent |
ü |
2009 |
Dean of Florida State University Panama City and Florida State University College of Applied Studies |
Board Risk
Executive |
H. Merritt Lane, III
Independent |
ü |
2021 |
Chairman, President and Chief Executive of Canal Barge Company, Inc. |
Board Risk
Compensation |
Sonya C. Little
Independent |
ü |
2016 |
Former Chief Administrative Officer of Strategic Property Partners |
Audit (Vice Chair)
Corporate Governance & Nominating |
Sonia A. Pérez
Independent |
ü |
2021 |
Retired President of Southeast States, AT&T Inc. |
Board Risk |
Albert J. Williams
Independent |
ü |
Nominee |
Vice President and Senior Advisor, Corporate Affairs for Chevron Corporation |
|
The Corporate Governance Committee met in February 2025 to evaluate each of the nominees standing for re-election and election, as applicable, to the Board. Based on the Corporate Governance Committee’s evaluation and unanimous recommendation, the Board has nominated each of these nominees for election as directors for a three-year term expiring at the Company’s 2028 annual meeting of shareholders. Each of these individuals, except Mr. Williams, is currently serving
as a director of our Company. Mr. Williams has an extensive and diverse mix of experience including expertise in finance, operations, strategy and corporate affairs. Our Board believes he will be a significant contributor to the Board.
Composition Highlights
As a whole, our Board has a wide range of skills and expertise including those listed in the director biographies below, and is comprised of five women and ten men, two individuals who self-identify as African American and one individual who self-identifies as Latina. In addition, our non-incumbent director nominee self-identifies as African American. This year’s nominees demonstrate the following areas of skill and expertise, among others.1
|
|
- Federal and state government regulation - Knowledge of Gulf Coast markets - Mergers and acquisitions - Risk management - Strategic planning - Corporate governance - Regulated utility industry experience - Bank regulation |
- Business operations management - Public company leadership - Technology and digital product delivery - Management of national and international business operations - Executive leadership - Cybersecurity and financial crimes experience - Accounting and audit expertise |
These areas of skill and expertise are in addition to the qualifications, qualities and skills we look for in all of our directors, as described under the heading “Board of Directors and Corporate Governance – Corporate Governance and Nominating Committee” on page 30 of this proxy statement, all of which are more fully described in the nominees' respective biographies below.
The Corporate Governance Committee regularly assesses the composition of the Board and the qualifications and skills of each director. In recommending candidates for nomination, the Corporate Governance Committee takes into consideration a number of factors, including the expertise, qualifications, qualities and skills described above. The Corporate Governance Committee and the Board believe that each nominee is well qualified to be a Hancock Whitney director.
THE BOARD RECOMMENDS THAT SHAREHOLDERS VOTE “FOR” ALL SIX DIRECTOR NOMINEES.
_______________________
[1] On a self-reported basis.
|
INFORMATION ABOUT OUR DIRECTORS |
The following sets forth self-reported biographical information we have obtained from the director nominees and continuing directors, including each director’s age on the record date, tenure, business experience and current director positions with other public companies. The following also sets forth the director’s particular experience, qualifications, attributes, or skills that, when considered in the aggregate, led the Board to conclude that the person should serve as a director of the Company.
Nominees for Election at the Annual Meeting with Terms Expiring in 2028
|
|
|
 |
Moses H. Feagin Sr. Age: 60 Director since 2024 Independent |
Position Executive Vice President, Treasurer and Chief Financial Officer, Alabama Power Committee Membership Audit │ Board Risk |
Background Mr. Feagin serves as Alabama Power’s (a subsidiary of Southern Company (NYSE: SO)) executive vice president, treasurer and chief financial officer, where he oversees the Finance, Accounting and Treasury departments, as well as Regulatory Affairs. He brings more than 35 years of experience to the role. Previously, he served as senior vice president, treasurer, chief financial officer and chief diversity officer for Mississippi Power. Mr. Feagin began his Southern Company career at Alabama Power in 1987 as a junior accountant. He moved through positions of increasing responsibility and leadership, and by 1999, he was Alabama Power’s Accounting Operations manager. In 2000, Feagin moved to Southern Company Services as Generation Accounting manager, where he led the effort to establish the accounting and budget organization for Southern Power Company. He was elected comptroller of Mississippi Power in 2005 and vice president and comptroller of Alabama Power in 2008. A native of Montgomery, Alabama, he holds a bachelor’s degree in accounting from the University of Alabama. Mr. Feagin, a Certified Management Accountant, completed the Executive Finance and Accounting Program at the Wharton School at the University of Pennsylvania. Expertise Highlights Accounting and audit expertise; audit committee financial expert Regulated utility industry experience Executive leadership Knowledge of Alabama, Florida and Mississippi markets Risk management Mr. Feagin’s community ties in markets served by the Company, his finance and accounting experience with fluency in Generally Accepted Accounting Principles, risk management experience, and knowledge of our Company and Bank operations make him well qualified to serve as a director of our Company. Community Service Highlights Mr. Feagin has served on nonprofit boards local to the broader community Hancock Whitney serves, including the Gulf Coast Community Foundation and United Way. He has also served on the advisory board for the Gulf Coast Restoration Council, is a graduate of Leadership Birmingham and Leadership Gulf Coast; is a member of the University of Alabama Alumni Association; and is a member of the Institute of Management of Accountants and 100 Black Men of America. |
|
|
|

|
Randall W. Hanna Age: 66 Director since 2009 Independent |
Position Dean of Florida State University Panama City and Florida State University College of Applied Studies Committee Membership Board Risk │ Executive |
Background Mr. Hanna has served as Dean of Florida State University Panama City and Florida State University College of Applied Studies since 2016. From 2015 to 2016, he served as a faculty member at Florida State University and was a practicing attorney. From 2011 to 2015, he served as Chancellor of the Florida College System, which is the primary access point for higher education in Florida and serves approximately 800,000 higher education students through 28 institutions. Mr. Hanna has also served as a member of the governing boards of three institutions of higher education. Prior to his 2011 appointment as Chancellor, Mr. Hanna served as Chairman and Managing Shareholder of Bryant Miller Olive, a law firm with offices in Florida, Washington, D.C. and Atlanta. He practiced law with the firm from 1984 to 2011 and from 2015 to 2016. Under his leadership, the firm grew to become one of the leading firms in Florida in the areas of public finance and public private partnerships. During his legal career, Mr. Hanna worked on complex financial and economic development transactions throughout the State of Florida and served as special counsel to a United States Senator. Prior to joining our Board, he served as a director of Hancock Bank of Florida from 2007 to 2010. In addition to his current committee service, Mr. Hanna has previously served on our Audit Committee and Compensation Committee. Expertise Highlights Corporate governance Government regulation Legal experience Executive leadership Strategic planning As Dean of a regional campus of a major public research university, Mr. Hanna understands the management, budgeting and regulatory concerns created by varied interests and business units organized as a system in a public domain. His current career experience, coupled with his legal skills and substantial knowledge of the Florida market and its key industries, make him well qualified to serve as a director of our Company. Community Service Highlights Mr. Hanna has served on the boards of numerous nonprofit and professional organizations, including in leadership positions, and currently serves on the boards of the Bay County Chamber of Commerce and Alignment Bay County, both nonprofit organizations. |
|
|
|

|
H. Merritt Lane, III Age: 63 Director since 2021 Independent |
Position Chairman, President and Chief Executive Officer of Canal Barge Company, Inc. Committee Membership Board Risk │ Compensation |
Background Mr. Lane has served as the Chairman, President and Chief Executive Officer of Canal Barge Company, Inc., a New Orleans based marine transport, services, and liquid storage company, since 1994. He joined Canal Barge Company in 1986 and held several marketing and executive positions prior to his appointment as President in 1994. Mr. Lane currently serves on the board of directors of Pontchartrain Materials Corporation, L.L.C., a privately held construction aggregate supplier, where he has been a director since 2001. He also served as Chairman of the Bureau of Governmental Research. Mr. Lane has previously served on the boards of directors of several additional companies, including International Shipholding Corp., a publicly traded marine transportation company, from 2004 to 2015 and Hibernia Homestead Bancorp., Inc., a publicly traded community bank holding company, from 2008 to 2018. Prior to joining Canal Barge Company, he was an investment banker with PaineWebber Inc. from 1983 to 1986. Mr. Lane holds a Bachelor of Science degree in Finance from the University of Virginia. Expertise Highlights Marine transportation experience Extensive knowledge of our Louisiana markets Public company board experience Executive leadership Strategic planning Mr. Lane’s prior board service, including service as a director of a public company and a bank holding company, coupled with his deep knowledge of marine transportation and storage industries and our New Orleans market, make him well qualified to serve as a director of our Company. Community Service Highlights Mr. Lane has been active in leadership positions with a number of civic, educational and philanthropic organizations, including the National World War II Museum, the Nature Conservancy of Louisiana and the Water Institute of the Gulf, among others. Mr. Lane has received numerous honors for his civic and business leadership. |
|
|
|
 |
Sonya C. Little Age: 59 Director since 2016 Independent |
Position Former Executive Vice President and Chief Administrative Officer of Strategic Property Partners Committee Membership Audit (Vice Chair)│ Corporate Governance |
Background Ms. Little served as the Executive Vice President and Chief Administrative Officer of Strategic Property Partners, a full-service commercial real estate development firm, from 2019 to 2024. In this role, she was responsible for overseeing corporate operations, which included financial reporting, accounting, risk management, human resources, information technology, and governmental affairs. From 2011 to 2019, Ms. Little was the Chief Financial Officer for the City of Tampa, where she was responsible for the city’s comprehensive financial strategy, annual operating budget exceeding $1.2 billion, credit ratings, and debt portfolio. Prior to her role as CFO, she was a Managing Director with Public Resources Advisory Group and an investment banker with RBC Capital Markets (formerly William R. Hough & Co.) for over 14 years. Additionally, she held financial positions with the State of Florida’s Division of Bond Finance, Barnett Bank, and Florida National Bank. Currently, Ms. Little serves on The Mosaic Company (NYSE: MOS) Board of Directors, where she is a member of the Audit Committee, and Turner Construction Board of Directors, a privately held company. She previously served on the Municipal Securities Rulemaking Board (MSRB) as a Task Force Member and Subject Matter Expert, helping to develop an educational curriculum for municipal bond issuers. Additionally, she was on the State of Florida Partnership for Public Facilities and Infrastructure Act Task Force, advising on legislative guidelines for public-private partnerships. She holds a Bachelor of Science in Business from the University of South Florida and has also held NASD Series 7 and 63 licenses. Expertise Highlights Strategic planning Finance and accounting; audit committee financial expert Government regulation Investment banking services Risk management Ms. Little’s substantial, extensive and diverse mix of experience in finance, accounting, investment banking, operations, risk management, and regulatory matters make her well qualified to serve as a director of our Company. Community Service Highlights Ms. Little has served on the boards of numerous nonprofit and governmental organizations, including the Tampa General Employees’ Retirement Fund, BayCare Health System Board Clinical Excellence Committee, Zoo Tampa, and Tampa Museum of Art. |
|
|
|

|
Sonia A. Pérez Age: 68 Director since 2021 Independent |
Position Former President, Southeast States, AT&T Inc. Committee Membership Board Risk |
Background Ms. Pérez served as the President, Southeast States, for AT&T Inc. from 2018 to 2022. In this capacity, Ms. Pérez was responsible for the development of the company’s overall strategic plan in the Southeast region, which included responsibility for leading a workforce of more than 9,600 employees, overseeing operations including technology deployment and infrastructure investment and directing teams responsible for implementing public policy, legislative, regulatory and philanthropic initiatives. Ms. Pérez joined AT&T in 2005 and previously served as President, AT&T Louisiana from 2010 to 2018 and Vice President, AT&T Texas, from 2005 to 2010. Prior to 2005, Ms. Pérez was employed at SBC (formerly Southwestern Bell) from 1979 until SBC’s 2005 acquisition of AT&T, at which time SBC adopted the AT&T name. Ms. Pérez served on the board of directors of Sanderson Farms, Inc., a publicly traded Mississippi-based poultry processing company from 2019 to its sale in 2022. Ms. Pérez holds a Bachelor of Journalism degree from the University of Texas. During her career, Ms. Pérez has served in various organizational leadership roles and has developed a well-respected reputation for leadership. Ms. Pérez has also been selected by elected officials to serve in a number of special project advisory roles, including appointment as a member of the Resilient Louisiana Commission and appointment as chair of the Louisiana Economic Development Transition Team for Governor John Bel Edwards. Expertise Highlights Nationwide business experience Public company board experience Executive leadership Technology infrastructure Government regulation Ms. Pérez’ experience as a director of a public company, commitment to public service, and leadership in and professional experience working with communities in our Texas and Louisiana markets make her well qualified to serve as a director of our Company. Community Service Highlights Ms. Pérez is a current and former director of a number of industry and philanthropic organizations, including current service for the National World War II Museum and the University of Texas Foundation. She has received numerous awards and recognition for community service and leadership. |
|
|
|

|
Albert J. Williams Age: 56 2025 Nominee Independent |
Position Vice President and Senior Advisor Corporate Affairs, Chevron Corporation Committee Membership Board Risk (effective after election) |
Background Mr. Williams has served at Chevron Corporation for more than 30 years in various capacities, most recently as corporate officer and Vice President of Corporate Affairs from March 2021 through February 2025. In this role, he oversaw government affairs, public affairs, reputation, and social investment performance. Previously, Mr. Williams served as Managing Director of Chevron Australia with responsibility for Chevron’s interests and activities in Australia and New Zealand from 2019 to 2021, a position in which he had oversight of Chevron’s financial and operational investment and performance, along with government, partner, and community relations. Mr. Williams also served in several other key U.S. and international positions, including as President, Chevron Pipeline Company; Vice President, Chevron Indonesia Heavy Oil Operations; Asset Manager, Chevron Thailand; and General Manager Finance, Chevron Africa and Latin America Exploration and Production Company. After joining Chevron in 1991, Mr. Williams served as an engineer in New Orleans, Louisiana, later as a Finance Manager for Chevron’s Pascagoula, Mississippi refinery, and also held various roles in the Houston, Texas area during his tenure. Mr. Williams holds a Bachelor of Science degree in electrical engineering from the Mississippi State University and a master’s degree in business administration from Tulane University, New Orleans, Louisiana. Expertise Highlights Management of international business operations Energy industry experience Environmental risk assessment Executive leadership and executive compensation Commercial and industrial experience Mr. Williams is a seasoned executive leader with deep global and national experience in finance, operations, strategy and corporate affairs. While his career experience has been notably international, he also brings a depth of knowledge of the Gulf Coast market. His extensive leadership experience both domestically and internationally make him well qualified to serve as a director of our Company. Community Service Highlights Mr. Williams serves on the Board of Directors for the United States Energy Association, the Board of Advisors for University of Southern California Viterbi School of Engineering, the Mississippi State University Bagley College of Engineering Advisory Board, and the Board Executive Committee of the Atlantic Council. He previously served on the Mississippi State University Foundation Board. |
Incumbent Directors with Terms Expiring in 2026
|
|
|

|
Frank E. Bertucci Age: 68 Director since 2000 Independent |
Position President of F.E.B. Distributing Co., Inc. and Chief Executive Officer of Capital City Beverage Committee Membership Board Risk (Chair) │ Executive |
Background Mr. Bertucci has been employed with F.E.B. Distributing Co., Inc., a regional beverage wholesaler, since 1978, serving as its President since 1990, and has served as Chief Executive Officer of Capital City Beverage, a beverage distributorship since 2001. His companies are present throughout Mississippi, including the two largest markets in the state, one of which is the Gulf Coast region. He has been actively involved in risk management and strategic planning of his companies, including acquisitions. Prior to joining our Board, he served as a director of Hancock Bank from 1995 to 2000. In addition to his current committee service, Mr. Bertucci has previously served on our Audit Committee and Compensation Committee. Mr. Bertucci is a director of the Mississippi Beer Distributors Association in Jackson, Mississippi, and a director of Fullhouse Venture Company L.P. of Gulfport, Mississippi, a limited partnership engaged in the business of real estate holdings. He is also a member of the Gulf Coast Business Council. Expertise Highlights Federal and state government regulation Knowledge of Mississippi Gulf Coast markets Mergers and acquisitions Risk management Strategic planning Mr. Bertucci’s substantial experience in business, strategic planning, risk management and mergers and acquisitions, coupled with his extensive knowledge of our Mississippi market, make him an effective director of our Company. Community Service Highlights Mr. Bertucci has been involved in numerous civic and nonprofit organizations throughout the Mississippi Gulf Coast market and currently serves on the board of the Mississippi Gulf Resort Classic Foundation, a nonprofit organization. |
|
|
|

|
Constantine S. Liollio Age: 66 Director since 2016 Independent |
Position Senior Vice President, Special Projects of Plains All American Committee Membership Compensation (Vice Chair) │ Corporate Governance │ Executive |
Background Mr. Liollio served as President of Plains Midstream Canada ULC (PMC) from February 2020 to June 2024. PMC, which is headquartered in Calgary, Alberta, owns and operates midstream energy infrastructure and provides logistics services primarily for crude oil, natural gas liquids and natural gas customers in Canada and parts of the United States. PMC is a subsidiary of Plains All American Pipeline, L.P. (NYSE: PAA), a Houston-based publicly traded partnership. From 2008 through January 31, 2020, Mr. Liollio served as President of PAA Natural Gas Storage, LLC (PNG), a natural gas storage business based in Houston, Texas that was a subsidiary of PAA. PNG was a publicly traded entity controlled by PAA from May 2010 through December 2013, during which time Mr. Liollio also served on PNG’s Board of Directors. Mr. Liollio is responsible for developing and executing strategy, overseeing day-to-day operations, coordinating all disciplines within PMC and identifying areas for future expansion. Prior to joining PAA, he served for two years as President, Chief Executive Officer and Director of Energy South, Inc., a publicly traded natural gas storage and utility business headquartered in Mobile, Alabama. He has deep expertise in midstream energy and substantial knowledge of and experience in natural gas storage operations in the Gulf Coast markets of Texas, Louisiana, Mississippi, Alabama and Florida. Mr. Liollio has been involved in numerous professional organizations and currently serves on the boards of the GPA Midstream Association and is a member of the Engineering Advisory council of Texas A&M University. Expertise Highlights Corporate governance Energy industry experience Mergers and acquisitions Public company leadership Strategic planning Mr. Liollio’s valuable public company experience, substantial experience in the energy industry and knowledge of the Gulf Coast markets that we serve make him an effective director of our Company. |
Community Service Highlights Mr. Liollio has been involved in numerous civic organizations and has also served as a director on the boards of various nonprofits and gas industry organizations, including in leadership positions. |
|
|
|

|
Thomas H. Olinde Age: 69 Director since 2009 Independent |
Position President of Olinde Hardware & Supply Co., LLC. and Managing Member and Director of B. Olinde and Sons Co., LLC Committee Membership Compensation │ Corporate Governance (Chair) │ Executive |
Background Mr. Olinde has served as President of Olinde Hardware and Supply Co., LLC since 1997 and is also a managing member and director of B. Olinde & Sons Co., LLC. Although Mr. Olinde sold, through an asset sale, a majority interest of the business operated through Olinde Hardware and Supply Co., LLC in January 2019, he continues to manage the enterprise as its President as the company winds down its operations. Through these companies, he has operated and managed a network of retail furniture stores operating in most of the central and south Louisiana markets where the Bank has a presence. In addition to general operations, Mr. Olinde has been largely responsible for strategic planning for the retail store operations and has been regularly involved in business risk management. Previously, Mr. Olinde worked as a credit manager gaining valuable experience in retail credit extension and collections. Prior to joining our Board, he served as a director of Hancock Bank of Louisiana from 2006 to 2014. In addition to his current committee service, Mr. Olinde has previously served on our Audit Committee and Board Risk Committee. Mr. Olinde has served as a director and in leadership positions of numerous professional and other organizations, including recently being elected to the Board of the Pennington Biomedical Research Center in Baton Rouge, Louisiana. Expertise Highlights Commercial experience Executive leadership Knowledge of Louisiana markets Management of business operations Strategic planning Mr. Olinde’s substantial experience in leading and managing a large regional business, as well as his extensive community ties in markets our Company serves, make him an effective director of our Company. Community Service Highlights Mr. Olinde has served on the boards of various nonprofit and civic organizations, including in leadership positions, and previously served on the boards of the Baton Rouge Symphony Orchestra and the Volunteer Services Council of the Louisiana School for the Visually Impaired, Inc., both nonprofit organizations. He has received the Volunteer Activist Award in the greater Baton Rouge area, one of our markets. |
|
|
|

|
Joan C. Teofilo Age: 61 Director since 2016 Independent |
Position President & CEO of The Energy Authority Committee Membership Board Risk (Vice Chair) |
Background Ms. Teofilo has served as President and Chief Executive Officer of The Energy Authority (TEA), the nation’s largest nonprofit energy trading company, since 2010, is a member of its Risk Management Committee, and is actively involved in strategic planning for TEA. She was a member of TEA’s founding launch team in 1997 and served as the Director of Risk Management and Financial Trading and the Chief Risk Officer before assuming her current role. TEA provides strategic energy solutions to community-owned utilities across the U.S. through access to advanced resources and technology systems. From its headquarters in Jacksonville, Florida, and West Coast office in Bellevue, Washington, TEA serves over 60 public power utilities and represents over 30,000 megawatts of power generation. Prior to joining TEA, Ms. Teofilo worked as a project engineer in construction management at Santee Cooper, the largest public power utility in South Carolina, and as a mechanical engineer at the American Samoa Power Authority. She has been invited to present and speak at industry events across the country. Expertise Highlights Wholesale electric utility and natural gas experience Executive leadership Nationwide business experience Risk management and environmental risk assessment Strategic planning Ms. Teofilo’s business leadership, substantial experience in managing a large national trading organization, extensive knowledge of the southeastern market, and regulatory, organizational, risk and strategic expertise make her an effective director of our Company. Community Service Highlights Ms. Teofilo has been involved in numerous community, civic and business organizations, including in Jacksonville, Florida, one of our markets. She has also been involved in various industry organizations and currently serves on the board of the Association of Women in Energy, a nonprofit organization. |
|
|
|

|
C. Richard Wilkins Age: 61 Director since 2016 Independent |
Position Sole Member C. Richard Wilkins, Attorney At Law, PLLC Committee Membership Board Risk |
Background Mr. Wilkins began practicing law in 1990 with the law firm of Vickers, Riis, Murray and Curran, L.L.C. (Vickers Riis) becoming a Partner in 1993. He joined the Mobile, Alabama, office of the Maynard, Cooper & Gale law firm through its acquisition of the Vickers Riis firm in 2015. In 2020, Mr. Wilkins established his current firm. Mr. Wilkins practices primarily in the areas of commercial litigation, commercial transactions, banking, admiralty and maritime law, real estate and wills and estates. He advises clients of legal risks and risk mitigation strategies. Over the course of his professional career, Mr. Wilkins has represented a wide array of entities in varying sectors, including telecommunication service providers, land-based and marine fuel distribution and transportation companies, commercial vessel operators and offshore energy exploration support service providers. Prior to joining Vickers Riis, he served as a law clerk for the Honorable William Brevard Hand, Chief Judge of the United States District Court for the Southern District of Alabama from 1988 to 1990. Mr. Wilkins has served on the Market Advisory Board of the Bank since 2014 and, prior to joining our Board, served as a director of Hancock Bank from 2011 to 2014. He also served as Director and Chairman of Hancock Bank of Alabama from 2007 to 2011. Expertise Highlights Commercial experience Regulated industry experience Knowledge of Alabama, Florida and Mississippi markets Legal experience Risk management Mr. Wilkins’ extensive community ties in markets served by the Company, legal skills, broad business experience, and knowledge of our Company and Bank operations through his extensive board and committee service make him an effective director of our Company. Community Service Highlights Mr. Wilkins has been involved in numerous civic organizations and has served on the boards of various nonprofits, including in leadership positions. He currently serves as Chairman of the Board of Goodwill Industries of the Gulf Coast, Inc., a nonprofit organization. |
Incumbent Directors with Terms Expiring in 2027
|
|
|

|
John M. Hairston Age: 61 Director since 2006 |
Position President and CEO of Hancock Whitney Corporation and CEO of Hancock Whitney Bank Committee Membership Executive |
Background Mr. Hairston has served as Chief Executive Officer of the Company and the Bank since 2008, and President of the Company since 2014. Prior to becoming President of the Company, he served as its Chief Operating Officer from 2008 to 2014. Mr. Hairston served on the Board of Directors and was a faculty member of the Graduate School of Banking at Louisiana State University in Baton Rouge, Louisiana, and at the Georgia Banking School in Athens, Georgia. He also currently serves on the Boards of Directors of the Gulf Coast Business Council, New Orleans Business Council, Mississippi Economic Council, and The National WWII Museum. Expertise Highlights Bank regulation Corporate governance Mergers and acquisitions Public company leadership Strategic planning Mr. Hairston’s significant banking experience makes him an asset to our Board. In addition, the business, leadership, and management skills he has developed as our President and Chief Executive Officer and formerly as Chief Operating Officer give him a unique insight into our Company’s operations and challenges, and combine to make him an effective director of our Company. Community Service Highlights Mr. Hairston has served on the boards of numerous professional and civic organizations and universities, and as a commissioner and former chair for the State of Mississippi Gaming Commission and the State of Mississippi Information Technology Services Commission, including holding various leadership positions. He currently serves as Trustee and Secretary of the Executive Committee of the National World War II Museum, as well as Trustee of the World War II Theatre, Inc. and the WWII Pavilions, Inc., nonprofit organizations in New Orleans, Louisiana. Mr. Hairston was previously honored as a Louisiana Appleseed Good Apple, by Louisiana Appleseed, a public interest advocacy group, for his support of civil legal aid programs that assist in the removal of legal barriers to homeownership. |
|
|
|

|
Suzette K. Kent Age: 57 Director since 2020 Independent |
Position CEO of Kent Advisory Services, LLC Former Federal Chief Information Officer of the United States Committee Membership Corporate Governance (Vice Chair) |
Background Ms. Kent has served as CEO of Kent Advisory Services since 2020. She served as the Federal Chief Information Officer of the United States from February 2017 until July 2020. During her service, Ms. Kent was responsible for leading technology policy and administration transformation initiatives across the Executive Branch agencies of the federal government. Prior to that, Ms. Kent was a financial services business transformation Principal at Ernst & Young (EY) from November 2015 until February 2017, where she led practice teams across banking and capital markets to deliver transformational change for technology, business process, regulatory compliance and product innovation to clients across the globe. Prior to her position at EY, Ms. Kent was a Managing Director at J.P. Morgan from August 2008 until August 2015, where she served first as Global Project Management Executive –Treasury & Securities Solutions and then as Client Solutions Executive – Commercial Banking. In these roles, Ms. Kent led teams managing projects to deliver enhanced domestic and global solutions for commercial clients for cash management, trade, online solutions, liquidity and commercial card and supporting client sales, solution delivery and operations for treasury, payments and card solutions for J.P. Morgan’s commercial bank and business bank. Prior to her time at J. P. Morgan, Ms. Kent was EVP & President of Global Payments Consulting at Carreker Corporation (now part of FiServ) and a Partner in Accenture’s Financial Services Practice. Ms. Kent has a Bachelor of Arts degree in Journalism from Louisiana State University. Expertise Highlights Technology and digital product delivery Management of national and international business operations Cybersecurity and financial crimes experience Mergers and acquisitions Government regulation Ms. Kent’s background as an industry leader in large-scale technology transformation in complex and highly regulated environments adds significant technology expertise to our Board. This, coupled with Ms. Kent’s proven leadership skills and substantial experience with financial institutions, including bank operations, payment strategies and risk management, make her an effective director of our Company. Community Service Highlights Ms. Kent has also been active in various professional, community and civic activities, including her appointment to the LSU Foundation Board, her previous service on nonprofit boards, such as Frisco Family Services and her ongoing involvement with a variety of initiatives to develop diversity and technical capability in the emerging workforce. |
|
|
|

|
Jerry L. Levens Chairman of the Board Age: 68 Director since 2009 Independent |
Position Retired partner of CPA firm of Alexander, Van Loon, Sloan, Levens & Favre, PLLC and retired partner of registered investment advisory firm of AVL Wealthcare, LLC Committee Membership Audit │ Compensation │ Executive (Chair) |
Background Mr. Levens has worked in the accounting profession since 1978, providing accounting, audit, assurance and strategic planning services. In 2019 he retired from Alexander, Van Loon, Sloan, Levens & Favre, PLLC, a regional CPA firm based on the Mississippi Gulf Coast, after serving as a partner for 27 years and as the partner in charge of the firm’s audit and assurance engagements for 25 years. Mr. Levens was also a manager of a financial planning and investment advisory services firm for 19 years. He has substantial academic and professional credentials, including a Business Administration degree in Accounting from the University of Mississippi, a Mississippi Certified Public Accountant license, and is a Certified Fraud Examiner-Retired and a Chartered Global Management Accountant-Retired. Prior to joining our Board, Mr. Levens served as a director of Hancock Bank from 2008 to 2009. In addition to his current committee service, Mr. Levens has previously served on our Board Risk Committee and Corporate Governance Committee. Mr. Levens has served on the boards of numerous certified public accountancy professional organizations, including in leadership positions, and currently is a member of the Mississippi Society of CPAs, the American Institute of CPAs, the Association of Certified Fraud Examiners, and on the University of Mississippi’s E.H. Patterson School of Accountancy Professional Advisory Council. He is also a member of the National Association of Corporate Directors, a nonprofit organization, earning the designation as a Board Leadership Fellow. Expertise Highlights Accounting and audit expertise; audit committee financial expert Corporate governance Experienced financial services company executive Risk management Strategic planning |
Mr. Levens’ substantial experience in finance, accounting, auditing, risk management and business makes him an effective director of our Company. Community Service Highlights Mr. Levens has served on the boards of numerous nonprofit and governmental organizations, including in leadership positions, and currently serves on the advisory board of the Gulf Coast Restoration Fund. He has received numerous awards and commendations for his professional, civic, and business activities. |
|
|
|

|
Christine L. Pickering Age: 64 Director since 2000 Independent |
Position Owner of Christy Pickering, CPA Committee Membership Audit (Chair)│ Corporate Governance │ Executive |
Background Ms. Pickering, a licensed Certified Public Accountant for more than 30 years, has worked in the accounting field since 1983 and has owned Christy Pickering, CPA since 1991, where she has provided auditing and assurance, tax preparation and litigation support services, including investigation of financial crimes. Her work in the area of litigation support and as an expert witness led to her limited appointment by the court as a Special Master. Ms. Pickering served as a director of Mississippi Power Company, Gulfport, Mississippi, a public company subsidiary from 2007 to 2020 and served as the Chair of the Controls and Compliance Committee from 2009 to 2013, which oversees the finance and risk areas for the company. In addition to her current committee service, Ms. Pickering has previously served on our Compensation Committee. Ms. Pickering is a member of the American Institute of Certified Public Accountants. She is also a published author and has been asked to participate in speaking engagements throughout the Company footprint in that capacity. Expertise Highlights Accounting and audit expertise; audit committee financial expert Business operations management Regulated utility industry experience Financial crimes experience Risk management Ms. Pickering’s varied wealth of financial and accounting expertise, combined with her experience in the regulated utility industry and risk management, and her extensive knowledge of the Gulf Coast market make her an effective director of our Company. Community Service Highlights Ms. Pickering has served on the boards of numerous nonprofit and governmental organizations, as well as a state college board, including holding leadership positions. She has received numerous awards and recognition for community service and leadership. |
|
SECURITY OWNERSHIP OF CERTAIN BENEFICIAL OWNERS AND MANAGEMENT |
|
The following table shows the number of shares of our common stock that were beneficially owned as of December 31, 2024 by persons known by us to beneficially own more than 5% of the outstanding shares of our common stock. Where indicated, the information in the table is based on our review of filings with the SEC, and is determined under Rule 13d-1 of the Securities Exchange Act of 1934, as amended (the Exchange Act). Each person listed below has sole voting and investment power with respect to the shares beneficially owned unless otherwise stated.
|
|
|
|
|
|
Name and Address
of Beneficial Owner |
|
Amount and Nature of Beneficial
Ownership of Common Stock |
|
|
Percent of
Class (1) |
BlackRock, Inc.
55 East 52nd Street
New York, NY 10055 |
|
12,182,387 |
(2) |
|
14.2% |
|
|
|
|
|
|
The Vanguard Group
100 Vanguard Blvd.
Malvern, PA 19355 |
|
10,097,563 |
(3) |
|
11.7% |
|
|
|
|
|
|
Dimensional Fund Advisors LP
6300 Bee Cave Road, Building One
Austin, TX 68746 |
|
4,937,174 |
(4) |
|
5.7% |
|
|
|
|
|
|
State Street Corp.
1 Congress Street, Suite 1
Boston, MA 02114 |
|
4,701,204 |
(5) |
|
5.5% |
(1)Based on 86,018,870 shares of our common stock outstanding as of February 28, 2025.
(2)Based on information contained in a Form 13F-HR filed with the SEC on February 7, 2025 by BlackRock, Inc. (BlackRock) as of December 31, 2024. BlackRock, and certain of its subsidiaries, report that it has sole voting power with respect to 11,792,953 shares and sole dispositive power with respect to 12,182,387 shares.
(3)Based on information contained in the Schedule 13G/A filed with the SEC on January 30, 2025 by The Vanguard Group (Vanguard) as of December 31, 2024. Vanguard, and certain of its subsidiaries, report shared voting power with respect to 79,865 shares, sole dispositive power with respect to 9,916,406 shares and shared dispositive power with respect to 181,157 shares.
(4)Based on information contained in a Form 13F-HR filed with the SEC on February 13, 2025, Dimensional Fund Advisors LP (Dimensional) as of December 31, 2024. Dimensional, and certain of its subsidiaries, report that it has sole voting power with respect to 4,612,749 shares, sole dispositive power with respect to 4,733,416 shares, shared voting power with respect to 201,160 shares, and shared dispositive power with respect to 203,758 shares.
(5)Based on information contained in the 13G filed with the SEC on February 4, 2025 by State Street Corp. as of December 31, 2024. State Street, and certain of its subsidiaries, report having shared dispositive power with respect to 4,701,204 shares.
The following table shows the number of shares of our common stock beneficially owned as of February 28, 2025 by (i) our directors, (ii) our named executive officers, as defined below in the “Compensation Discussion and Analysis,” and (iii) all of our directors and executive officers as a group. The information in the table is based on our review of filings with the SEC and information provided by the individuals. Each person listed below has sole voting and investment power with respect to the shares beneficially owned unless otherwise stated.
|
|
|
|
Directors |
Amount and Nature of Beneficial Ownership of Common Stock (1) |
Percent of
Class (2) |
Frank E. Bertucci |
24,393 |
(3) |
* |
Moses H. Feagin |
100 |
|
* |
Hardy B. Fowler |
28,075 |
(4) |
* |
John M. Hairston |
256,842 |
(5) |
* |
Randall W. Hanna |
26,309 |
(6) |
* |
Suzette K. Kent |
6,767 |
(7) |
* |
H. Merritt Lane |
9,397 |
(8) |
* |
Jerry L. Levens |
40,330 |
(9) |
* |
Constantine S. Liollio |
31,329 |
(10) |
* |
Sonya C. Little |
15,936 |
(11) |
* |
Thomas H. Olinde |
41,648 |
(12) |
* |
Sonia A. Pérez |
10,192 |
(13) |
* |
Christine L. Pickering |
24,125 |
(14) |
* |
Joan C. Teofilo |
16,824 |
(15) |
* |
C. Richard Wilkins |
17,744 |
(16) |
* |
Albert J. Williams |
0 |
|
* |
Named Executive Officers |
|
|
|
Michael M. Achary |
54,104 |
(17) |
* |
D. Shane Loper |
96,102 |
(18) |
* |
Michael Otero |
27,210 |
(19) |
* |
Christopher S. Ziluca |
34,844 |
(20) |
* |
|
|
|
|
Directors and executive officers as a group (21) (22 persons) |
780,914 |
|
* |
* Less than 1% of the outstanding common stock.
(1)Includes shares owned directly and indirectly. Except as otherwise noted and subject to applicable community property laws, each shareholder has sole investment and voting power with respect to such shares.
(2)Based on 86,126,857 shares of our common stock outstanding and entitled to vote as of February 28, 2025.
(3)Includes 1,445 shares held for the account of Mr. Bertucci’s spouse in the Company’s Dividend Reinvestment Plan and 12,770 shares held for the account of Mr. Bertucci in the Company’s Non-Qualified Deferred Compensation (NQDC) Plan.
(4)Includes 1,030 shares held by Mr. Fowler’s spouse in an IRA, as to which he disclaims beneficial ownership, and 5,597 shares held for the account of Mr. Fowler in the Company’s NQDC plan.
(5)Includes 136,784 shares held for the account of Mr. Hairston in the Company’s NQDC Plan and 4,481 restricted stock units (RSUs) that would convert to shares upon Mr. Hairston’s retirement (based on age and time of service).
(6)Includes 14,514 shares held for the account of Mr. Hanna in the Company’s NQDC Plan and 6,565 shares held jointly with his spouse.
(8)Includes 4,104 shares held for the account of Mr. Lane in the Company's NQDC Plan and 1,630 RSAs.
(9)Includes 22,235 shares held for the account of Mr. Levens in the Company’s NQDC Plan and also includes 18,095 shares held jointly with his spouse in a family limited partnership as to which he disclaims beneficial ownership.
(10)Includes 26,128 shares held for the account of Mr. Liollio in the Company’s NQDC Plan.
(11)Includes 10,650 shares held for the account of Ms. Little in the Company’s NQDC Plan.
(12)Includes 25,729 shares held for the account of Mr. Olinde in the Company’s NQDC Plan.
(13)Includes 7,356 shares held for the account of Ms. Pérez in the Company’s NQDC Plan.
(14)Includes 331 shares held by Ms. Pickering’s spouse. Also includes 1,630 RSAs and 12,338 shares held for the account of Ms. Pickering in the Company’s NQDC Plan.
(15)Includes 15,284 shares held for the account of Ms. Teofilo in the Company’s NQDC Plan.
(16)Includes 4,927 shares held for the account of Mr. Wilkins in the Company's NQDC Plan. Also includes 1,177 shares held by his spouse and 600 shares held in trusts for his three children with his spouse as trustee as to which he disclaims beneficial ownership.
(17)Includes 11,005 shares held for the account of Mr. Achary in the Company’s NQDC Plan and 1,598 RSUs that would convert to shares upon Mr. Achary’s retirement (based on age and time of service).
(18)Includes 229 shares held by Mr. Loper's spouse in the Company’s Dividend Reinvestment Plan and 2,337 shares held for the account of Mr. Loper in the Company’s NQDC Plan. Also includes 2,066 RSUs that would convert to shares upon Mr. Loper's retirement (based on age and time of service).
(19)Includes 1,644 shares held for the account of Mr. Otero in the Company's NQDC Plan.
(20)Includes 4,464 shares held for the account of Mr. Ziluca in the Company's NQDC Plan.
(21)Includes 317,872 shares held in the Company’s NQDC Plan and 5,134 RSAs. Also includes 9,301 RSUs that would convert to shares upon members of the group’s retirement (based on age and time of service).
|
DELINQUENT SECTION 16(a) REPORTS |
O |
Section 16(a) of the Exchange Act requires our executive officers and directors to file initial reports of ownership of the Company’s common stock, as well as reports of changes in ownership with the SEC. Based solely on a review of Forms 3, 4 and 5, any amendments to those Forms, and written representations from executive officers and directors to the Company, all required filings by such persons were timely made during 2024, except that, due to an administrative error, one late Form 4 reporting one transaction was filed on behalf of Moses Feagin.
|
BOARD OF DIRECTORS AND CORPORATE GOVERNANCE |
|
Board of Directors
The Board currently consists of 15 directors. The Board has the power to expand or reduce its size at any time, subject to the requirement in our Articles of Incorporation and Bylaws that the Company have a minimum of nine directors. In February 2025, the Board voted to maintain its size at 15 directors, effective as of the annual meeting. Mr. Fowler, whose term expires at the annual meeting, is not eligible to stand for re-election per our Corporate Governance Guidelines.
The Board currently has one employee director, John M. Hairston. The Board has determined that all non-employee directors – Frank E. Bertucci, Moses H. Feagin Sr., Hardy B. Fowler, Randall W. Hanna, Suzette K. Kent, H. Merritt Lane, III, Jerry L. Levens, Constantine S. Liollio, Sonya C. Little, Thomas H. Olinde, Sonia A. Pérez, Christine L. Pickering, Joan C. Teofilo, and C. Richard Wilkins – are independent under the applicable rules of The NASDAQ Stock Market, LLC (NASDAQ), on which our common stock trades. In addition, the Board has determined that Mr. Williams, a director nominee for election at the annual meeting, is independent under the applicable rules of NASDAQ.
Under our Corporate Governance Guidelines, our independent directors are required to meet in executive session at least two times each year. During 2024, the Company’s independent directors continued their longstanding practice of convening executive sessions after regular board meetings as they deemed necessary, convening seven such sessions during 2024. Neither the Chief Executive Officer nor any other Company associates were present during these executive sessions.
The Board held ten meetings in 2024. During 2024, each of the incumbent directors attended at least 75% of the aggregate number of meetings of the Board and the committees of the Board on which he or she served. The Board has adopted Corporate Governance Guidelines that encourage our directors to attend each annual meeting of shareholders. All of our directors attended the Company’s 2024 annual meeting, which was held virtually.
Board and Management Leadership Structure
In connection with its election of the Chairman of the Board, the Board solicits input and nominations from its members and elects one of its members as Chairman. The Chairman or the President of the Company presides over each Board meeting and performs such other duties as may be incidental to the office. Although our Bylaws and Corporate Governance Guidelines provide the Board with the flexibility to appoint one individual to serve as both Chief Executive Officer and
Chairman of the Board, it is the current policy of the Board to separate these offices. We believe that this separation allows the Chairman to maintain an independent role in management oversight.
Board Committees
The committees established by the Board include an Executive Committee, an Audit Committee, a Compensation Committee, a Corporate Governance and Nominating Committee, and a Board Risk Committee. The Board and each committee have the authority to consult with and retain independent legal, financial or other outside advisors, as each deems necessary and appropriate, without seeking the approval of management.
The current members of each Board committee are identified in the following table, which also indicates the number of meetings each committee held in fiscal 2024.
|
|
|
|
|
|
Name |
Executive |
Audit |
Compensation |
Corporate Governance
& Nominating |
Board Risk |
Frank E. Bertucci |
X |
|
|
|
Chair |
Moses H. Feagin |
|
X |
|
|
X |
Hardy B. Fowler |
X |
X |
Chair |
|
X |
John M. Hairston |
X |
|
|
|
|
Randall W. Hanna |
X |
|
|
|
X |
Suzette K. Kent |
|
|
|
Vice Chair |
|
H. Merritt Lane |
|
|
X |
|
X |
Jerry L. Levens † |
Chair |
X |
X |
|
|
Constantine S. Liollio |
X |
|
Vice Chair |
X |
|
Sonya C. Little |
|
Vice Chair |
|
X |
|
Thomas H. Olinde |
X |
|
X |
Chair |
|
Sonia A. Pérez |
|
|
|
|
X |
Christine L. Pickering |
X |
Chair |
|
X |
|
Joan C. Teofilo |
|
|
|
|
Vice Chair |
C. Richard Wilkins |
|
|
|
|
X |
Number of Meetings in 2024 |
3 |
9 |
6 |
6 |
4 |
† Chairman of the Board
Executive Committee
The Executive Committee is currently comprised of Messrs. Levens (Chair), Bertucci, Fowler, Hairston, Hanna, Liollio, Olinde and Ms. Pickering. The Executive Committee’s purpose is to provide a means of considering matters that may require Board attention in the intervals between scheduled meetings of the full Board. The Executive Committee is empowered to exercise all of the powers and authority of the Board except as limited by the Company’s Articles of Incorporation or Bylaws or by applicable law. All actions of the Executive Committee are deemed to be done under the authority of the Board, with the same force and effect as if the full Board had acted, and any such actions are reported to the full Board. The Executive Committee is governed by a written charter, a copy of which is on the Company's Investor Relations website at investors.hancockwhitney.com under Corporate Overview - Committee Charting.
Audit Committee
The Audit Committee is currently comprised of Ms. Pickering (Chair), Ms. Little (Vice Chair) and Messrs. Feagin, Fowler and Levens. The Board has determined that the Audit Committee members each meet the additional independence criteria of the SEC and NASDAQ for service on the Audit Committee and the Board has further determined that each qualifies as a financially sophisticated audit committee member under NASDAQ rules. Additionally, the Board has classified Ms. Pickering, Ms. Little and Messrs. Feagin, Fowler and Levens as “audit committee financial experts” as defined in applicable SEC regulations.
The Audit Committee is governed by a written charter, a copy of which is on the Company’s Investor Relations website at investors.hancockwhitney.com under Corporate Overview Committee Charting. Information regarding the functions of the Audit Committee is set forth in the “Audit Committee Report,” included on page 67 of this proxy statement.
Compensation Committee
The Compensation Committee is currently comprised of Messrs. Fowler (Chair), Lane, Levens, Liollio (Vice Chair), and Olinde. The Board has determined that the Compensation Committee members each meet the NASDAQ and SEC’s additional independence criteria for service on the Compensation Committee.
The primary purpose of the Compensation Committee is to aid the Board in discharging its responsibilities relating to the compensation of the Company’s directors, the Chief Executive Officer, and any executive officer within the meaning of Section 16 of the Exchange Act. The Compensation Committee has overall responsibility for developing, evaluating and
approving the Company’s compensation plans, policies, and programs and overseeing the Company’s strategies relating to its human capital management. The Compensation Committee also oversees the preparation of and approves the annual report on executive compensation, the narrative disclosure of the Company’s risk assessment of compensation policies and practices for inclusion in the Company’s proxy statement as well as the narrative disclosure of the Company’s human capital resources included in its Annual Report on Form 10-K.
Our long-term incentive plans permit the Compensation Committee to delegate all or any of its responsibilities and powers under the plans to individual officers or associates of the Company or a subsidiary, except its authority or responsibility with regard to awards to persons subject to Section 16 of the Exchange Act. The Compensation Committee has delegated limited authority to the Company’s Chief Executive Officer to make grants outside of the annual long term incentive program, such as grants to new hires and special retention related grants, individually valued in excess of $100,000, and to the Company’s Chief Human Resources Officer to make such grants individually valued up to $100,000. Neither officer is permitted to grant awards to persons subject to Section 16 of the Exchange Act.
The Compensation Committee is governed by a written charter, which further sets forth the Compensation Committee’s responsibilities and duties, a copy of which appears on the Company’s Investor Relations website at investors.hancockwhitney.com under Corporate Overview – Committee Charting. The Compensation Committee reviews and reassesses the adequacy of the Compensation Committee Charter on an annual basis. Additional information regarding the functions and role of the Compensation Committee, including its processes and procedures for the consideration and determination of executive compensation, is set forth under “Compensation Discussion and Analysis – Role of the Compensation Committee” on page 38.
Corporate Governance and Nominating Committee
The Corporate Governance and Nominating Committee (the Corporate Governance Committee) is currently comprised of Messrs. Olinde (Chair), Liollio, Ms. Kent (Vice Chair), Ms. Little, and Ms. Pickering. The Board has determined that Messrs. Olinde and Liollio, Ms. Kent, Ms. Little, and Ms. Pickering are each independent under applicable NASDAQ rules. The Corporate Governance Committee oversees a broad range of issues surrounding the composition and operation of the Board and its committees. The Corporate Governance Committee’s charter is available on the Company’s Investor Relations website at investors.hancockwhitney.com under Corporate Overview – Committee Charting.
Director Qualifications, Qualities, and Skills. The Corporate Governance Committee has adopted criteria that it uses when it recommends individuals to be nominated for election to the Board. First, a prospective candidate must meet any eligibility and qualification requirements set forth in any Company, Board or Committee governing documents, as applicable. In addition, the Corporate Governance Committee believes that directors must demonstrate a variety of personal traits, leadership qualities, and individual competencies. The Corporate Governance Committee considers the following criteria in evaluating nominees: integrity, honesty and reputation; financial, regulatory and business experience; familiarity with and participation in one or more communities served by the Bank; dedication to the Company and its shareholders; and independence. For individuals considered for Board leadership roles, the following skill sets are also required: communication skills, facilitation skills, crisis management skills, and relationship building and networking skills. In considering candidates for director, the Corporate Governance Committee reviews these criteria and skills in light of the composition and needs of the current Board and its various committees.
Diversity Considerations. The Company is committed to creating a highly qualified board with diversity of experience, skills, perspective, background and geography and the Corporate Governance Committee includes, and has any search firm that it engages include, such diverse candidates in the pool from which it selects director candidates. In practice, the Corporate Governance Committee has viewed diversity as the collective range of experiences, skills, perspectives, background, and geography that all nominees would bring to the Board. Moreover, the Corporate Governance Committee considers whether the Board, as a whole, reflects the diverse regions, lines of business of our markets, and clients and communities we serve.
Identification of New Directors. The Corporate Governance Committee may identify potential directors in a number of ways. The Corporate Governance Committee may consider recommendations made by current or former directors and members of executive management and, where appropriate, the Company may retain a search firm to identify candidates. In addition, the Corporate Governance Committee will consider director candidates recommended by our shareholders. The Committee will evaluate candidates recommended by a shareholder in the same manner as candidates identified by the Committee or recommended by others. The Corporate Governance Committee may choose not to consider an unsolicited recommendation if no vacancy exists on the Board and the Corporate Governance Committee does not perceive a need to increase the size of the Board.
For the Corporate Governance Committee to consider a director candidate for nomination submitted by a shareholder, the shareholder must submit the recommendation in writing to the Corporate Secretary at our principal executive offices. Each submission must include the same information that would be required for a director directly nominated by a shareholder as specified in our Bylaws. See “Shareholder Proposals for the 2026 Annual Meeting” on page 69. For purposes of the 2026 Annual Meeting, any director recommendation by a shareholder must be received by the Corporate Secretary not later than November 11, 2025.
Board Risk Committee
The Board Risk Committee is currently comprised of Messrs. Bertucci (Chair), Feagin, Fowler, Hanna, Lane, Wilkins, Ms. Pérez, and Ms. Teofilo (Vice Chair). The Board Risk Committee reviews the Company’s processes for identifying, assessing, monitoring, and managing credit risk, liquidity risk, market risk, legal risk, operational risk (including cybersecurity risk), reputational risk, and strategic risk. The Board Risk Committee assesses the operational processes associated with the Company’s potential risk, including among others, those related to business recovery, compliance, corporate insurance, and legal. The Board Risk Committee may solicit and receive information from other committees as appropriate to fulfill its enterprise-wide risk management oversight function. The Board Risk Committee acts pursuant to a written charter, a copy of which is available on the Company’s Investor Relations website at investors.hancockwhitney.com under Corporate Overview – Committee Charting.
Board’s Role in Risk Oversight
Our Board is responsible for overseeing the Company's business and affairs, including risk management. The Board recognizes that risk management is an enterprise-wide responsibility. The Board oversees the Company’s corporate risk governance processes primarily through its committees. The Board (or the appropriate committee in the case of risks that are under the purview of a particular committee) receives reports from the appropriate risk executive within the Company to enable it to understand the Company's risk identification, risk management and risk mitigation procedures. The Board Risk Committee, and its subcommittee, the Credit Risk Management Subcommittee, assist the Board in the assessment and management of the Company’s policies, procedures and practices relating to credit risk, liquidity risk, market risk, legal risk, operational risk (including cybersecurity risk), reputational risk, and strategic risk. For more information about our Board's oversight of cybersecurity risk, please see "Cybersecurity – Cybersecurity Governance" in our Annual Report on Form 10-K for the fiscal year ended December 31, 2024. The Audit Committee reviews the Company’s control systems to manage and monitor financial risk with management and the internal audit group. The Compensation Committee evaluates and manages any risks posed by compensation programs. In addition, the Board and executive management have appointed a Chief Credit Officer, who is a member of management, to focus on credit risk, as well as a Chief Risk Officer, who is a member of management, to support the risk oversight responsibilities of the Board and its committees and to involve the appropriate personnel in risk management by establishing committees responsible for oversight of the many risks faced by the Company. The Chief Risk Officer reports to the Board Risk Committee each quarter on the Company’s enterprise-wide risk management systems and the Chief Credit Officer reports to the Credit Risk Management Subcommittee on credit risks.
|
COMPENSATION OF DIRECTORS |
|
Director Compensation Program
The Compensation Committee is responsible for the oversight and administration of the director compensation program. The Compensation Committee annually reviews the director compensation program to ensure pay for directors is appropriate for their role as an advisor to the Company and competitive among peers to allow us to attract and retain qualified directors. The Compensation Committee annually engages Aon’s Human Capital Solutions practice, a division of Aon plc (“Aon”) (otherwise known as McLagan), as its independent compensation consultant, to perform a review of our director compensation program, including a comparison of our program against the programs of the bank and bank holding companies in our Compensation Peer Group (see description of this group in the Compensation Discussion and Analysis) as well as other market practices.
Cash Compensation
Under its 2024 director compensation program, the Company paid its non-employee directors an annual Board cash retainer of $50,000. In addition:
•Audit Committee members (including the Chair) receive an additional annual cash retainer of $15,000, and the Chair receives a further additional annual cash retainer of $16,000;
•Board Risk Committee and Credit Risk Subcommittee of the Board Risk Committee members (including the Chairs) receive an additional annual cash retainer of $10,000, and the Chairs receive a further additional annual cash retainer of $15,000;
•Compensation Committee members (including the Chair) receive an additional annual cash retainer of $10,000, and the Chair receives a further additional annual cash retainer of $10,500;
•Corporate Governance & Nominating Committee members (including the Chair) receive an additional annual cash retainer of $7,500, and the Chair receives a further additional annual cash retainer of $10,250;
•Executive Committee members (including the Chair) receive an additional annual cash retainer of $7,500, and the Chair receives a further additional annual cash retainer of $10,500;
•Merger & Acquisition Committee and Hancock Whitney Bank’s Director Trust Committee members (including the Chairs) receive an additional annual cash retainer of $5,000; and
•Chairman of the Board receives an additional annual cash retainer of $65,000.
The Bank’s board of directors is composed of the same individuals who serve as members of the Company’s Board. Company directors do not receive any additional fees for service on the Bank board.
The annual cash retainer service period is the calendar year, with members of the Board compensated each quarter for their service on the Board. All of the annual cash retainers are prorated for partial year of service on the Board or committees, as applicable.
Each non-employee director may elect to receive payment of their annual cash retainer in the form of cash or shares of Company common stock granted under the 2020 Long Term Incentive Plan (not to exceed $100,000 in Company common stock per year with the remainder paid in cash); or they may elect to defer all or any portion of their fees under the Company’s Nonqualified Deferred Compensation Plan.
Equity Compensation
Non-employee directors receive an annual equity grant with a value approximately equal to $75,000, which is intended to create stock ownership in the Company and focus directors on the long-term performance of the Company's common stock. This grant is issued in the form of restricted stock with a one-year service-based vesting condition. The annual equity grant is awarded on or about the date of the annual meeting of shareholders. The number of shares granted under each award is based on the closing price of the Company’s common stock on the last trading day prior to the grant date, rounded to the nearest whole share. Upon appointment to the Board, a one-time award of 100 fully-vested shares of the Company’s common stock is provided to each new director to ensure compliance with a Mississippi state statute requiring bank holding company directors to have stock ownership.
Each non-employee director may elect to defer all or any portion of their equity awards under the Company’s Nonqualified Deferred Compensation Plan.
Director Stock Ownership Guidelines
Pursuant to our stock ownership guidelines as most recently amended, effective January 1, 2022, directors are expected to accumulate and maintain Company stock worth five times their annual Board cash retainer. The value of the director’s stock holdings and satisfaction of the ownership guidelines are measured as of January 1 each year by reference to the closing price of a share of Company common stock on the last trading day of the immediately preceding calendar year. The directors are expected to make continuous progress toward their respective ownership requirements and satisfy the applicable ownership guidelines within five years following the effective date of the amended guidelines or such later date that the director becomes subject to the guidelines based on the date initially appointed to the Board as a director. Until the director has satisfied the stock ownership guidelines, the director must retain one-half of any shares acquired from the Company. Once the guidelines have been satisfied, any future sales of stock are only permitted to the extent that the director continues to meet the guidelines immediately following such sale.
The following table sets forth the cash and other compensation that we paid to our non-employee directors for their services during 2024.
|
|
|
|
2024 DIRECTOR COMPENSATION |
Name |
Fees Earned or
Paid in Cash (1) |
Stock Awards (2) |
Total |
Frank E. Bertucci |
$100,000 |
$74,980 |
$174,980 |
Moses H. Feagin Sr.(3) |
14,168 |
5,941 |
20,109 |
Hardy B. Fowler |
104,667 |
74,980 |
179,647 |
Randall W. Hanna |
97,500 |
74,980 |
172,480 |
James H. Horne (4) |
33,417 |
― |
33,417 |
Suzette K. Kent |
78,333 |
74,980 |
153,313 |
H. Merritt Lane |
70,000 |
74,980 |
144,980 |
Jerry L. Levens |
163,000 |
74,980 |
237,980 |
Constantine S. Liollio |
85,833 |
74,980 |
160,813 |
Sonya C. Little |
84,167 |
74,980 |
159,147 |
Thomas H. Olinde |
82,667 |
74,980 |
157,647 |
Sonia A. Pérez |
73,333 |
74,980 |
148,313 |
Christine L. Pickering |
106,000 |
74,980 |
180,980 |
Joan C. Teofilo |
70,000 |
74,980 |
144,980 |
C. Richard Wilkins |
77,500 |
74,980 |
152,480 |
(1)Reflects the annual cash retainer plus any additional committee or committee chair cash retainers paid in 2024, including amounts deferred under the NQDC Plan.
(2)Reflects the grant date fair value of 1,630 shares of common stock granted to all non-employee directors on April 26, 2024 (other than Messrs. Horne and Feagin who were not serving as directors on such date), whether or not those awards were deferred under the NQDC Plan. The number of shares of restricted stock held by each director as of December 31, 2024 was 1,630 shares.
(3)Mr. Feagin was appointed to the Board on November 15, 2024. In connection with his appointment to the Board, Mr. Feagin was granted 100 shares of common stock, which were fully vested upon issuance to ensure compliance with the Mississippi state statute requiring bank holding company directors to have stock ownership. The grant date for value was November 15, 2024.
(4)Mr. Horne did not stand for re-election at the 2024 annual meeting. Amounts presented reflect the cash retainer paid for his service to the Board from January 1, 2024 through the end of his term on April 24, 2024.
|
COMPENSATION COMMITTEE INTERLOCKS AND INSIDER PARTICIPATION |
|
The Compensation Committee is currently comprised of Messrs. Fowler (Chair), Lane, Levens, Liollio (Vice Chair), and Olinde. None of the members of our Compensation Committee (i) has been an officer or associate of our Company or any of our subsidiaries or (ii) had, during the last completed fiscal year, any relationship requiring disclosure by the Company under any paragraph of Item 404 of SEC Regulation S-K. In addition, in the last fiscal year, no executive officer of our Company served as a director or member of the compensation committee (or its equivalent) of the board of directors of another entity whose executive officer(s) served on our Board or our Compensation Committee.
|
COMPENSATION DISCUSSION AND ANALYSIS |
|
The following Compensation Discussion and Analysis ("CD&A") describes and analyzes our executive compensation philosophy and program in the context of the compensation paid during our 2024 fiscal year to our Chief Executive Officer, Chief Financial Officer and our three other most highly-compensated executive officers who were serving as executive officers at the end of the fiscal year (who are referred to herein as our named executive officers, or NEOs). Our fiscal year 2024 NEOs are:
|
|
Name |
Title |
John M. Hairston |
President and CEO |
Michael M. Achary |
Chief Financial Officer |
D. Shane Loper |
Chief Operating Officer |
Christopher S. Ziluca |
Chief Credit Officer |
Michael Otero |
Chief Risk Officer |
Later in this proxy statement under the heading “Executive Compensation,” we have included tables containing specific information about the compensation earned by or paid to our NEOs in 2024. The discussion below is intended to summarize and explain the detailed information provided in those tables and to put that information into the context of our overall compensation program.
We refer to the non-GAAP financial measures Adjusted Revenue, Adjusted Pre-Provision Net Revenue and Adjusted Earnings per Share (Adjusted EPS) throughout this proxy statement because payouts under our annual cash incentives and long-term incentives are based on achievement of performance goals related to these key financial metrics. For a reconciliation of these non-GAAP measures to GAAP measures, refer to Appendix A to this proxy statement. For more information about our business, please see “Business” and “Management’s Discussion and Analysis of Financial Condition and Results of Operations” in our Annual Report on Form 10-K for the fiscal year ended December 31, 2024.
Executive Summary
Overview of Company Performance in Fiscal 2024
Reported earnings per diluted common share were $5.28 in 2024, compared to $4.50 per diluted common share in 2023. The results for 2024 include a net charge of $3.8 million (pre-tax), or $0.03 per share after tax, related to the FDIC special assessment charge. The results for 2023 include a net charge of $75.4 million (pre-tax), or $0.68 per share after tax, comprised of the following supplemental disclosure items: a $65.4 million loss on restructuring of the securities portfolio, a $26.1 million FDIC special assessment charge and a $16.1 million gain on the sale of a parking facility.
Adjusted pre-provision net revenue* totaled $641.0 million in 2024, up $5.3 million from 2023. Our fee income expanded and adjusted noninterest expense increased only modestly. Strong earnings facilitated growth in our capital ratios. We ended 2024 with a common equity tier 1 capital ratio of 14.14%, up 181 bps from 2023 and tangible common equity ratio of 9.47%, up 110 bps from 2023.
Total loans at December 31, 2024 were $23.3 billion, compared to $23.9 billion at December 31, 2023, down $622.5 million, or 3%. The decrease is reflective of the strategic reduction of the shared national credit portfolio as we focus on originating more granular loans. Though credit metrics normalized compared to the earlier post-pandemic environment, we have not seen signs of significant weakening in any particular industry, sector or geographic segment, beyond what we believe has been experienced by the banking industry as a whole, and we continue to maintain a robust allowance for credit loss coverage of 1.47% in light of the current credit and economic environment.
Total deposits were $29.5 billion at December 31, 2024, down $197.2 million or 1% from December 31, 2023. Deposit levels and composition were influenced by a decline in brokered deposits, elevated interest rates, and a continued shift to and growth in interest-bearing products.
Net interest margin increased 3 bps to 3.37% in 2024, driven by higher earning asset yields and higher deposit costs attributable to the continued shift in the mix of deposits, partially offset by lower cost of borrowings. Our efficiency ratio was 55.36% in 2024, up from 55.25% in 2023.
*For more information and for a reconciliation of this and other non-GAAP financial measures, refer to Appendix A to this proxy statement.
Highlights of 2024 Financial Results
•Net income for the year ended December 31, 2024 was $460.8 million, or $5.28 per diluted common share, compared to $392.6 million, or $4.50 per diluted common share in 2023
•Adjusted pre-provision net revenue (PPNR)* totaled $641.0 million in 2024, up $5.3 million from 2023, with an increase in total adjusted revenue (te) of $10.7 million coupled with an increase in adjusted noninterest expense of $5.4 million. There were total supplemental disclosure items of a net charge of $3.8 million (pre-tax) in 2023, compared to $75.4 million (pre-tax) in 2023
•Net interest margin (NIM) expanded 3 bps to 3.37% in 2024
•Loans of $23.3 billion, down $622.5 million; reflects a $307.6 million strategic reduction of the shared national credit portfolio
•Deposits of $29.5 billion, down $197.2 million; reflects organic growth offset by a decline of $582.9 million in brokered deposits
•Criticized commercial loans and nonperforming loans continue to normalize following the recent benign credit environment
•Capital ratios strong with common equity tier 1 ratio (CET1) of 14.14% at December 31, 2024, compared to 12.33% at December 31, 2023; remain well-capitalized including all unrealized losses in capital ratios
•Dividends increased 33%, or $0.10 per share, in April of 2024, to a regular quarterly dividend of $0.40 per share
We are exceptionally proud of the Hancock Whitney team and the Company’s overall performance in this operating environment. In 2024, we focused on optimizing the balance sheet, controlling costs, growing fee income, and building capital. We believe we are well positioned to continue to enhance shareholder value.
*For more information and for a reconciliation of this and other non-GAAP financial measures, refer to Appendix A to this proxy statement.
Overview of our Compensation Programs
Our compensation programs are designed to provide executives with a balance of competitive fixed base salaries as well as variable incentive compensation opportunities that align with short- and long-term Company performance and incorporate compensation best practices that promote sound corporate governance. The Compensation Committee believes executive base salaries and compensation targets should generally align with the median (50th percentile) of the Compensation Peer Group (as discussed below) with payouts of variable compensation dependent on actual performance. As described further below, with the exception of base salary and time-based restricted stock awards (which represent a minority of our annual equity awards), all direct compensation is performance-based. Executives are also subject to stock ownership guidelines as well as post-vest holding periods on equity awards further aligning their interests with those of our shareholders.
Our annual cash incentive plan rewards our executives for achievement of short-term Company performance goals, which are further discussed below under “Annual Cash Incentive.” Our long-term incentive plan rewards our executives for achievement of long-term goals measured over a multi-year period through “performance stock awards” consisting of performance-based restricted stock units (PSUs) and provides retention value through “restricted stock awards” consisting of time-based restricted stock units (RSUs) and time-based restricted stock (RSAs). To the extent earned, performance stock awards vest based on performance during the performance period after actual performance results for the performance period are certified and the service period is satisfied, and are then subject to a two-year post-vest holding period. RSUs and RSAs vest in annual installments on the first day of the month of each of the first three anniversaries of the grant date and are also subject to a two-year post-vest holding period. The value of the long-term incentive awards increases or decreases as our share price increases or decreases, thereby aligning the interests of our executives with those of our shareholders. Awards under our long-term incentive plan for fiscal 2024 are further discussed below under “Long-Term Incentives.”
Together, these plans support our operating strategy to provide clients with the financial sophistication and range of products of a regional bank, while successfully retaining the commercial appeal and level of service of a community bank. The Company’s size and scale and associated compensation program enable us to attract, motivate, and retain high quality executives who are focused on executing this strategy.
Impact of Performance on 2024 Compensation
The following results and key decisions by our Compensation Committee support our pay for performance philosophy and also highlight the Compensation Committee’s focus on protecting our shareholders’ interests.
•Base Salaries Aligned with Market. The Compensation Committee believes that executives’ base salaries should generally align with the 50th percentile of the Compensation Peer Group. After reviewing the Compensation Peer Group compensation study (discussed below) and acknowledging that base salaries were within the market median, the Compensation Committee approved base salary increases for NEOs effective April 1, 2024, based on individual and Company performance, aligning each of the NEOs within approximately 5% of market median.
•Annual Cash Incentives Earned. Consistent with prior years, the Compensation Committee set the 2024 performance goals for annual cash incentives based on Board-approved budget and other goals related to our strategic priorities (see "Annual Cash Incentive" below). After reviewing our overall financial performance compared to performance goals as well as regional and top performing peers and our internal corporate strategic objectives, the Compensation Committee determined that the 2024 annual cash incentive awards to our executive officers had been earned and approved payout at 143.49% of target levels based on actual achievement of performance goals with no Compensation Committee discretion or adjustment applied to the calculated results.
•Long-Term Incentives Awarded. In 2024, the Compensation Committee continued its practice of using grants of both performance-based stock awards and time-based restricted stock unit awards to align executive and shareholder interests. 70% of the annual long-term incentive award for Mr. Hairston and 60% for non-CEO NEOs was comprised of PSUs, which were bifurcated into two equally weighted parts, one using a three-year relative Total Shareholder return (TSR) performance metric and the other a two-year EPS metric, with a three-year service requirement. Based on actual performance, the PSUs could payout between 0% and 200% of target shares. The remainder of the award was comprised of RSUs which vest based on continued service in annual increments over a three-year period. All awards granted to NEOs in 2024 include a two-year post-vest holding period applicable to the net shares issued upon vesting of the award and payment of withholding taxes. See “Long-Term Incentives” below for further details regarding the 2024 equity grants.
•Vesting of 2022 Performance Stock Awards. Performance stock awards granted in 2022 with a service-vesting period ending on February 1, 2025 vested collectively at 119.91% of target shares based on our achievement of TSR compared to our peers over a 3-year performance period ending December 31, 2024 and adjusted EPS compared to target over a 2-year performance period ending December 31, 2023. Collectively, our NEOs vested performance awards were valued at $3,913,806, calculated using the closing stock price of our common stock on January 31, 2025, the trading day prior to the distribution of the shares. Net shares issued upon vesting of the award and payment of withholding taxes are subject to an additional two-year post-vest holding period. See "Long-Term Incentives" below for further details regarding the vesting of the 2022 awards.
We believe that the compensation provided to each NEO in 2024 was fair, reasonable and aligned with our performance and strategic objectives.
Objectives of the Company’s Compensation Program
Our compensation program is designed to achieve the following objectives:
•drive performance in support of the Company’s financial goals, balancing short-term and intermediate operational objectives and performance with long-term strategic goals;
•align executives’ long-term rewards with the interests of our shareholders;
•provide increased compensation opportunities for exceptional individual performance, which can result in differentiated compensation among executives who are otherwise of comparable rank; and
•place at risk a significant portion of total compensation, making it contingent on Company performance, but in a manner consistent with our risk management policies.
Sound Compensation and Governance Practices
Our executive compensation program is designed to create an appropriate linkage between executive pay, Company performance, and the return on shareholder investment. The Compensation Committee works with its independent compensation consultant to evaluate the program and maintain alignment with shareholders’ interests and to incorporate strong governance standards within our compensation program, as outlined below and further discussed in this CD&A.
•A Significant Percentage of Executive Target Compensation is Performance-Based. Approximately 75% of Mr. Hairston's total target direct compensation (base salary, target annual incentive, and target long-term incentive
awards) and approximately 65% of the total target direct compensation of our other NEOs is either at risk and must be earned on the basis of attainment of corporate performance goals (in the case of annual cash incentive awards and performance stock awards) or its future value is contingent upon the future performance of the Company's common stock (in the case of our performance stock awards and time-based restricted stock unit awards).
•Majority of Long-Term Incentives Based on Stock Performance. As CEO, Mr. Hairston receives 70% of his target long-term incentive in performance-based awards, and the other NEOs receive 60% of their target long-term incentive in performance-based awards. The Compensation Committee believes that the higher weighting of performance-based awards provides better alignment of the executives’ compensation with our shareholders' interests.
•Mandated Post-Vest Holding Periods. Long-term incentive awards granted to our executive officers include a mandatory two-year post-vest holding requirement. This holding requirement supports alignment between our executives and our shareholders, focuses the executives on long-term sustained performance, and reduces the grant date fair value of the award for accounting purposes, thus reducing the expense of the equity program to the Company. These post-vest holding periods are in addition to meaningful executive stock ownership requirements.
•No Excise Tax Gross-Up Provisions. None of the change in control agreements in place for our NEOs or other executives provide for excise tax gross-ups. Instead, these agreements provide for a “best of net” approach to address any potential excise tax payments that might be triggered by a change in control. (See “Elements of Our Compensation Program – Employment Contracts and Change in Control Agreements” herein.)
•Compensation Recoupment Policy. The Compensation Committee has adopted a compensation recoupment policy compliant with applicable listing standards of Nasdaq and Rule 10D-1 under the Exchange Act, including a mandatory recoupment which requires the Company to recover the amount of all Erroneously Awarded Performance-Based Incentive Compensation Received by a person in the event that the Company is required to prepare an accounting restatement. The policy also provides the Compensation Committee with discretion to apply the mandatory recoupment to additional employees and/or seek to recover service-based equity awards in addition to performance awards when mandatory recoupment is triggered. Additionally, the policy provides the Compensation Committee with discretion to recover from any employee where an accounting restatement has not occurred, but the misconduct of a person causes material harm to the Company.
•Limited Perquisites. We generally provide only limited perquisites to our executives, consistent with our goal of aligning our executives’ interests with the interests of our shareholders.
•Executive Stock Ownership Requirements. Under our stock ownership guidelines as amended, effective January 1, 2022, our CEO must own Company common stock worth five times his base salary, and our other executive officers must own Company common stock worth three times their base salary. Until an executive officer has satisfied the stock ownership guidelines, he or she must retain one-half of any shares acquired from the Company (net of any tax withholdings). Once the guidelines have been satisfied, any future sales of stock are only permitted to the extent that the guidelines continue to be met immediately following such sale.
•Prohibition on Hedging Transactions. The Company’s Insider Trading Policy prohibits all of our directors, officers and associates (and their respective immediate family members) from engaging in hedging or monetization strategies involving exchange funds, prepaid variable forward contracts, equity swaps, puts, calls, collars, forwards and other derivative instruments, including short sale transactions, or otherwise engaging in transactions that hedge or offset or are designed to hedge or offset any decrease in the market value of the Company’s securities.
Results of 2024 Advisory Shareholder Vote on Executive Compensation
•At our 2024 annual meeting of shareholders, 96% of the votes cast approved the compensation of our named executive officers, as discussed in the 2024 proxy statement. The Board and the Compensation Committee appreciate and value the views of our shareholders. In considering the results of this advisory vote on executive compensation, the Compensation Committee concluded that the compensation paid to our NEOs and the Company's overall pay practices have strong shareholder support.
•In light of the strong shareholder support of the compensation paid to our NEOs as evidenced by the results of this advisory vote, the Compensation Committee decided to retain our general approach to executive compensation for 2024 and 2025. Future annual advisory votes on executive compensation will serve as an
additional tool to guide the Compensation Committee in evaluating the alignment of the Company's executive compensation programs with the interests of the Company and its shareholders.
•In Proposal No. 2, shareholders are being asked to approve, on an advisory basis, the compensation of our NEOs for 2024 as disclosed in the proxy statement.
Compensation Review Process
Role of the Compensation Committee
The Compensation Committee is responsible for annually assessing the performance of our NEOs and for determining both their annual salary and incentive (short- and long-term) compensation opportunities. Each of the members of our Compensation Committee is independent as defined under SEC and NASDAQ listing standards. The Committee may form and delegate responsibility to subcommittees of the Compensation Committee as necessary or appropriate. The Compensation Committee from time to time retains independent compensation consultants to assist in evaluating the compensation practices of the Company and to provide advice and ongoing recommendations regarding executive compensation practices consistent with our business goals and pay philosophy.
Role of the Compensation Consultant
In 2023, the Compensation Committee engaged Aon to provide advisory service to the Compensation Committee, which the Committee considered in connection with setting executive compensation for 2024. The scope of Aon’s executive compensation consulting assignments included a comparison of our current levels of base salary, annual cash incentive opportunity and equity-based compensation to those paid by bank and bank holding companies in the Compensation Peer Group (listed below). The Compensation Committee considered data developed by Aon in its assessment of whether each element of the executives’ compensation package was competitive with the market and to determine whether any adjustments were appropriate. This information was also used to establish the parameters of long-term incentives granted to the NEOs.
The Compensation Committee assessed the independence of Aon under the applicable SEC and NASDAQ rules and concluded that Aon’s engagement presented no conflicts of interest.
Role of Executives in Compensation Committee Deliberations
The Compensation Committee works closely with the Chief Human Resources Officer, Director of Total Rewards, and other members of the Company’s human resources team, who provide administrative support to the Compensation Committee, as requested. Executives may attend a Compensation Committee meeting to discuss Company and individual performance or to provide pertinent financial, tax, accounting, or operational information. Executives in attendance may provide their insights and suggestions, but only the independent Compensation Committee members have the right to vote on decisions regarding executive compensation.
For each executive officer other than himself, the Chief Executive Officer makes recommendations to the Compensation Committee regarding compensation. The Compensation Committee reviews recommendations made by our Chief Executive Officer and information from the Aon executive compensation review in determining compensation levels and program designs. The Compensation Committee’s decisions for all executives including the CEO are based on a variety of factors, including short- and long-term Company performance, the officer’s level of responsibility, an assessment of individual performance and competitive market data. The Chief Executive Officer is excused from the meeting before decisions are made on his compensation.
Review of Competitive Market Data
The Compensation Committee periodically reviews and analyzes market data provided by Aon in an effort to ensure that our executive officer compensation is competitive. Such a review was conducted in 2023, which served as a guide to the Committee in setting our 2024 executive compensation levels. As part of this review, the Compensation Committee compared compensation paid to our executive officers with compensation paid to the named executive officers in similar positions at banks of comparable size (which we refer to as the Compensation Peer Group). The Compensation Committee used the market information compiled as well as additional information regarding the ongoing movement of executive compensation in the banking industry to test the reasonableness of the compensation decisions we made for 2024. Aon conducted another review of executive compensation in October 2024, which was used to make compensation decisions for 2025.
The 2023 Compensation Peer Group used in connection with 2024 compensation decisions consisted of a peer group of 26 banks and bank holding companies aligned with the Company’s business profile and external environment, and positioned the Company close to the peer group median in terms of asset size. The 2023 Compensation Peer Group was comprised of peers with total assets ranging from $24 billion to $100 billion respectively at the time of selection. The median total assets for the 2023 Compensation Peer Group was $39 billion, which positioned the Company at the 43rd percentile of the peer group at the time of selection. We referred to the 2023 Compensation Peer Group in establishing compensation levels and program design features for 2024.
The Company’s 2023 Peer Bank Group consists of the following 26 banks and bank holding companies.
|
|
COMPANY NAME |
TICKER |
Ameris Bancorp |
ABCB |
Associated Banc-Corp |
ASB |
BankUnited Inc. |
BKU |
BOK Financial Corp. |
BOKF |
Cadence Bank |
CADE |
Columbia Banking System Inc. |
COLB |
Comerica Inc. |
CMA |
Commerce Bancshares Inc. |
CBSH |
Cullen/Frost Bankers Inc. |
CFR |
F.N.B. Corp. |
FNB |
First Interstate BancSystem |
FIBK |
Fulton Financial Corp. |
FULT |
Glacier Bancorp Inc. |
GBCI |
Old National Bancorp |
ONB |
Pinnacle Financial Partners |
PNFP |
Prosperity Bancshares Inc. |
PB |
Simmons First National Corp. |
SFNC |
SouthState Corp. |
SSB |
Synovus Financial Corp. |
SNV |
Texas Capital Bancshares Inc. |
TCBI |
UMB Financial Corp. |
UMBF |
United Bankshares Inc. |
UBSI |
United Community Banks Inc. |
UCBI |
Valley National Bancorp |
VLY |
Webster Financial Corp. |
WBS |
Wintrust Financial Corp. |
WTFC |
|
|
Assessment and Determination of Executive Compensation
We believe that the total compensation package available to our executives should provide the opportunity for enhanced levels of financial reward for achievement of higher levels of performance, recognize and reward both short- and long-term performance, and be competitive with our peers to attract, motivate, and retain talented and skilled executives. After careful consideration and analysis of market survey data provided by the Compensation Committee’s independent compensation consultant, executive officer compensation is set at levels we believe to be competitive with the Company’s Compensation Peer Group and compatible with our internal business plans. While the Compensation Committee considers many factors in setting executive compensation, generally the Compensation Committee strives to achieve a market position for an executive’s total compensation at approximately the median of the Compensation Peer Group assuming the Company’s performance is consistent with the group.
Elements of Our Compensation Program
In 2024, our executive officer compensation program consisted of the following elements: base salary, annual cash incentives, long-term equity incentives, retirement benefits, change in control protections, and other benefits including limited perquisites.
Base Salary
We pay base salaries to our executive officers as compensation for performing their day-to-day responsibilities. Base salaries are set based on a variety of factors, including scope of the job, experience, market comparable positions, internal pay equity and alignment, and an overall assessment of Company and individual performance. We rely substantially on industry and Compensation Peer Group compensation data provided by the Compensation Committee’s independent compensation consultant to evaluate whether the base salaries of our executives are competitive in the marketplace and also evaluate the actual performance of each executive to determine if base salary increases are warranted.
The Compensation Committee believes that executives’ base salaries should generally align with the market 50th percentile of the Compensation Peer Group. The Compensation Committee may, however, set an executive’s salary above the Compensation Peer Group median if it determines that specific performance, needs, or other circumstances justify a base salary at a higher level.
After reviewing the 2023 Compensation Peer Group compensation study, provided by its independent compensation consultant, the Compensation Committee determined that the base salaries of our NEOs were within the competitive range for peer executives. In early 2024, the Compensation Committee, in consultation with its independent compensation consultant, approved the following base salary increases for each of our NEOs, effective April 1, 2024, in recognition of individual and Company performance, which positioned the base salary of the NEOs within approximately 5% of the median of the Compensation Peer Group.
|
|
|
|
|
NEO |
2023 Salary |
Increase
Effective 2024 |
2024 Salary |
Percentage
Increase |
John M. Hairston |
$1,179,000 |
$23,580 |
$1,202,580 |
2.00% |
Michael M. Achary |
$575,000 |
$25,000 |
$600,000 |
4.35% |
D. Shane Loper |
$705,000 |
$30,000 |
$735,000 |
4.26% |
Christopher S. Ziluca |
$520,000 |
$20,000 |
$540,000 |
3.85% |
Michael Otero |
$450,000 |
$25,000 |
$475,000 |
5.56% |
Annual Cash Incentive
The Company uses annual cash incentives to focus attention on current strategic priorities and drive achievement of short-term corporate strategic objectives. Each NEO has a target annual incentive opportunity that may be earned between 0% and 200% based on corporate performance.
For purposes of the annual cash incentive, the Compensation Committee measures corporate performance based on actual performance compared to pre-established performance goals as a base completion percentage. The Compensation Committee may also review the Company’s performance compared to the performance of certain regional and top quartile peers, together with the Company’s progress with respect to certain corporate strategic objectives to further assess overall corporate performance. The Compensation Committee has the discretion to increase or decrease the amount of annual cash incentive earned based on these factors.
For 2024, the annual cash incentive plan used four key performance measurement metrics: adjusted EPS, adjusted pre-provision net revenue, and two credit quality metrics. The credit quality metrics compare the percentage of total commercial loans classified as criticized as of September 30, 2024 and the percentage of total loans classified as non-performing as of September 30, 2024. The Compensation Committee may also approve adjustments as it deems appropriate as discussed below based on its overall assessment of Company performance against the performance of regional and top quartile peers and consideration of other corporate strategic objectives.
The financial performance goals for the annual cash incentive and actual results for 2024 are set forth below:
|
|
|
|
|
|
Corporate
Performance Goal |
% of Plan
Component |
2024
Threshold |
2024
Target |
2024
Maximum |
2024 Actual
Results |
Adjusted EPS |
50% |
$3.96 |
$4.95 |
$5.94 |
$5.31 |
Adjusted Pre-Provision Net Revenue ($ in millions) |
30% |
$494.4 |
$618.0 |
$741.6 |
$641.0 |
9/30 Commercial Criticized Loans / Total Commercial Loans (1) |
10% |
5.87% |
4.57% |
2.81% |
2.81% |
9/30 Non-Performing Loans / Total Loans (1) |
10% |
0.60% |
0.40% |
0.35% |
0.35% |
(1) End of Period
For 2024, comparing actual corporate performance to the 2024 corporate performance goal targets, the resulting completion percentage was driven by above target performance for two of the four corporate performance goal metrics and maximum performance for the two credit quality metrics. After considering these results and reviewing our overall financial performance compared to regional and top quartile peers and relative impact to annual plan in comparison to peers, the Compensation Committee determined that annual cash incentive awards to our executive officers were earned based on the actual aggregate completion percentage of 143.49%. No modifications or discretion were utilized by the Compensation Committee.
In addition to awards made under our annual cash incentive plan for corporate performance, the plan also allows for the Compensation Committee (for all officers) and the CEO (for officers other than himself) to recommend adjustments based on results of near-term performance related to one-time initiatives, specific development efforts, or short-term projects. For 2024, no such adjustments were recommended. For the year ended December 31, 2024, the following cash bonuses were awarded:
|
|
|
|
|
Named
Executive Officer |
Target Value as a % of Base Salary |
Corporate Performance
Completion |
Corporate Performance Award |
Total Cash
Incentive |
John M. Hairston |
120% |
143.49% |
$2,060,589 |
$2,060,589 |
Michael M. Achary |
100% |
143.49% |
$852,015 |
$852,015 |
D. Shane Loper |
100% |
143.49% |
$1,043,941 |
$1,043,941 |
Christopher S. Ziluca |
65% |
143.49% |
$499,008 |
$499,008 |
Michael Otero |
65% |
143.49% |
$437,225 |
$437,225 |
For 2025, the annual cash incentive plan will use the following three performance measurement metrics: adjusted EPS, adjusted pre-provision net revenue and net charge-offs. The adjusted EPS and the adjusted pre-provision net revenue performance measures will each weight at 40% of the plan component and the net charge-offs will weight at 20% of the plan component. We believe these performance metrics provide a direct alignment of executive and shareholder interests.
Long-Term Incentives
The purpose of our long-term incentive program is to ensure that our executives focus not only on short-term returns but also on achieving long-term Company goals, growth and creation of shareholder value. We further believe that equity ownership by our executive officers aligns executives’ interests with those of our shareholders. In 2024, the Compensation Committee used both performance-based stock unit awards (PSUs) and time-based restricted stock unit awards (RSUs) for long-term incentive compensation, with a higher percentage of the total award value being delivered to our NEOs in the form of PSUs. The relative weighting of the award values strengthens the alignment of the executive and shareholder interests. The PSUs only provide value to the executive if threshold achievement is met, as described below. We used RSUs as a portion of our long-term awards because we believe they provide an effective retention incentive for the executives and align the interests of our executives with those of our shareholders.
The Compensation Committee sets the target value of the equity awards granted as a percentage of each executive’s base salary, with the target percentage based upon the executive’s position. We believe using a percentage of base salary as the target provides us greater control and consistency relative to the value of equity awards we grant each year. For 2024, the long-term incentive allocations for the NEOs were set as follows:
|
|
|
|
|
Named
Executive Officer |
Target Value of LTI as
a % of Base Salary |
LTI Target Value |
% Delivered in
Performance Awards |
% Delivered in
Restricted Stock Units |
John M. Hairston |
220% |
$2,645,676 |
70% |
30% |
Michael M. Achary |
140% |
$840,000 |
60% |
40% |
D. Shane Loper |
150% |
$1,102,500 |
60% |
40% |
Christopher S. Ziluca |
100% |
$540,000 |
60% |
40% |
Michael Otero |
65% |
$308,750 |
60% |
40% |
The RSUs approved and granted in 2024 vest based on continued service, with the awards vesting in annual increments over a three-year period. Cash dividend equivalents based on the amount of any dividends paid by the Company on its common stock during the vesting period are accrued and accumulated interest-free on each of the RSUs and paid only if and when the underlying unit(s) become vested.
For the PSUs approved and granted in 2024, the Company bifurcated the grant into two equally weighted performance measures, one using a three-year relative TSR performance metric and the other a two-year EPS metric, both of which vest after a three-year service period based upon actual certified results. We believe these performance metrics provide a direct alignment of executive and shareholder interests.
•TSR Performance Metric – The payout level of the TSR performance metric is determined based on the relative rank of the Company’s TSR among a published company peer group index (the KBW Regional Bank Index). The portion of the PSUs based on relative TSR over the three-year performance period will pay 0% of target for performance below the peer group’s 25th percentile, 50% of target for performance at the peer group’s 25th percentile (threshold), 100% of target for performance at the peer group’s 50th percentile (target), and 200% of target for performance at the peer group’s 75th percentile (maximum).
•Adjusted EPS Performance Metric – The adjusted EPS performance metric has a two-year performance measurement period and three-year service period. The target award will be earned between 0% and 200% based upon the level of collective adjusted EPS achieved over the performance period as compared to the target level, with 80% of target adjusted EPS (threshold) earning 50% payout and 120% of target adjusted EPS (maximum) earning 200% payout. The two-year EPS goals have been approved by the Compensation Committee and reflect our strategic plan as well as projected growth targets. The Compensation Committee believes that the growth targets represent appropriately challenging performance that will lead to increased shareholder value if achieved.
For all PSUs granted, results that fall in-between the “maximum,” “target” and “threshold” levels of the applicable performance criteria will be paid out on a sliding scale.
All awards granted to NEOs in 2024 include a two-year post-vest holding period applicable to the net shares issued upon vesting of the award and after payment of withholding taxes.
NEOs received the following long-term incentive awards for fiscal year 2024:
|
|
|
|
|
|
Named
Executive Officer |
RSUs |
Value of RSU
Awards (1) |
PSUs |
Value of
PSU Awards (1) |
Total Award
Value |
John M. Hairston |
17,726 |
$789,871 |
41,360 |
$1,843,002 |
$2,632,873 |
Michael M. Achary |
7,463 |
$332,551 |
11,194 |
$498,805 |
$831,356 |
D. Shane Loper |
9,797 |
$436,554 |
14,696 |
$654,854 |
$1,091,408 |
Christopher S. Ziluca |
4,803 |
$214,022 |
7,204 |
$321,010 |
$535,032 |
Michael Otero |
2,736 |
$121,916 |
4,104 |
$182,874 |
$304,790 |
(1)For purposes of determining the number of RSUs and PSUs to be granted, the Compensation Committee values each award based on the closing price of our common stock on the day prior to the grant date, which values are reflected in the table above. For purposes of determining the grant date fair value of the awards to be reported in the “Summary Compensation Table,” the awards are valued in accordance with FASB ASC Topic 718 as required by SEC rules. The PSUs subject to the EPS metric are valued as of the grant date based on the expected probability of achieving the goals, and the PSUs subject to the TSR metric are valued as of the date of grant based on the grant date fair value of the PSUs determined using a Monte Carlo simulation method, as set forth in Note 18 to the Consolidated Financial Statements included in our Annual Report on Form 10-K for the year ended December 31, 2024.
PSUs granted in 2022 with a three-year service-vesting period ending February 1, 2025 vested on February 1, 2025, after certification of performance results by the Compensation Committee on January 29, 2025. One-half of these PSUs could be earned based on the Company’s TSR relative to a peer group for the three-year performance period. The Company’s relative TSR compared to the applicable peer group was above the 50th percentile, which resulted in our executive officers vesting at 117.39% of the target awards. The other half of these PSUs could be earned based upon achievement of collective EPS relative to a two-year performance goal. The Company’s collective EPS was above target performance, which resulted in our executive officers vesting at 122.43% of the target awards. In the aggregate, our NEOs vested in 119.91% of the targeted shares equaling 65,514 shares valued at $3,913,806 calculated using the closing price of our common stock on January 31, 2025, the day prior to the vesting. Net shares issued upon vesting of the award and after payment of withholding taxes are subject to an additional two-year post-vest holding period.
For the 2025 long term incentive plan, the Company approved splitting into three performance measures: one using a relative three-year TSR performance metric weighted at 34%, one using a relative three-year average operating ROAA weighted at 33% and one using relative three-year average ROATCE weighted at 33%, all of which vest after a three-year service period based upon actual certified results with no post vest hold. We believe these performance metrics provide a direct alignment of executive and shareholder interests.
Retirement Benefits
Retirement benefits also play an important role within our overall executive compensation strategy because providing our executives with financial security at retirement means they are incentivized to remain long-term associates of our Company. Based on information provided by the Compensation Committee’s consultant, we believe that our retirement program, including the benefits that are earned based on service, is comparable to programs offered by the companies in our Compensation Peer Group. Our retirement program continues to be an essential component to ensure that our executive compensation program remains competitive.
During 2024, the Company maintained the following two retirement plans available to all eligible associates:
•Hancock Whitney Corporation Pension Plan
•Hancock Whitney Corporation 401(k) Savings Plan
The Hancock Whitney Corporation Nonqualified Deferred Compensation Plan was also available to our NEOs. These plans are described in more detail under “Executive Compensation – Pension Benefits” and “Executive Compensation – Nonqualified Deferred Compensation” herein.
Perquisites and Other Benefits
We seek to maintain a cost conscious culture in connection with the benefits we provide to our executive officers, consistent with our objective to tie a significant portion of executive compensation to Company performance. Our NEOs receive limited perquisites, such as club dues, professional organization dues, Company paid parking, Company provided auto allowances, executive physicals, and housing allowances for certain executives who do not reside permanently in the New Orleans, LA area, but have extensive business-related job responsibilities in the market. We also provide our executive officers long-term disability insurance coverage that provides tax-free benefits. Based on information provided by the Compensation Committee’s consultant, we believe the perquisites provided to our NEOs are reasonable in light of industry practices and perquisites available to executive officers of the companies in our Compensation Peer Group. We review the perquisites provided to our executive officers periodically to ensure that our benefits are consistent with our overall compensation objective of providing competitive compensation to our executive officers.
Employment Contracts and Change in Control Agreements
We do not have employment contracts with the NEOs. However, each NEO has a change in control agreement that protects the executive’s employment for two years following a change in control of the Company. The occurrence or potential occurrence of a change in control would create uncertainty regarding whether the employment of our executive officers whom we consider to be key employees would be continued. In the Compensation Committee’s view, providing these change in control protections better enables the executive officers to focus on the Company’s business and serve the shareholders’ interests, particularly during periods of consolidation or merger and acquisition activity within the banking industry.
Under the agreements, if the executive’s employment is terminated by the Company without cause during the two-year period following a change in control, then the executive is entitled to a severance payment equal to a multiple of two or three times the executive's base salary plus the average bonus paid to the executive for the three fiscal years preceding the termination, and continued medical coverage of 24 or 36 months, depending on the executive’s position. The executive is also entitled to this severance payment if the executive resigns due to disability during the protected period or because of a material reduction in the executive's base salary or duties, or the executive's relocation during the protected period after notice and an opportunity to cure is provided to the Company. Under these agreements, the NEOs are responsible for any excise tax payments due. The agreements also bind the executives to certain non-solicitation, non-disparagement and confidentiality covenants. These agreements are described in more detail under “Executive Compensation – Potential Payments Upon Termination or Change in Control” herein.
Tax and Accounting Considerations
The Compensation Committee considers the tax and accounting implications in the design of its compensation programs. For example, in the selection of long-term incentive instruments, the Compensation Committee reviews the projected expense amounts and expense timing associated with alternative types of awards. The grant-date fair value of share-based awards that are settled in stock, such as RSAs, RSUs and PSUs, is expensed over the service period or vesting period of the grant. For those grants with a two-year post-vest holding requirement, the grant-date fair value is reduced by a liquidity discount to reflect the holding period requirement.
Stock Ownership Guidelines
We believe that the executive officers of our Company should maintain equity interests in the Company to ensure that they have a meaningful economic stake in the Company and that the interests of our executives and our shareholders are aligned. Effective January 1, 2009 and most recently amended, effective January 1, 2022, we adopted stock ownership guidelines that require our executive officers to own directly or indirectly a minimum level of Company common stock, depending upon the executive’s position. The executive may satisfy their ownership guidelines with common stock owned directly; beneficially owned in a trust, by a spouse and/or minor child; held in an IRA or 401(k); held in the Automatic Dividend Reinvestment and Direct Stock Purchase Plan; or held in the Nonqualified Deferred Compensation Plan; as well as time-vesting restricted stock and restricted stock units.
Under the guidelines, our Chief Executive Officer is required to maintain ownership of Company common stock worth five times his base salary. Each of our other executive officers is required to maintain ownership of Company common stock worth three times his or her base salary. The value of the executive’s stock holdings and satisfaction of the ownership guidelines are measured as of January 1 each year by reference to the closing price of a share of common stock of the Company on the last trading day of the immediately preceding calendar year. The executives are expected to make continuous progress toward their respective ownership requirements and satisfy the applicable ownership guidelines within five years following the effective date of the amended guidelines or such later date that the executive becomes subject to the guidelines based on the date initially designated by the Board as an executive officer. Until the executive officer has satisfied the stock ownership guidelines, the executive officer must retain one-half of any shares acquired from the Company (net of any tax withholdings). Once the guidelines have been satisfied, any future sales of stock are only permitted to the extent that the guidelines continue to be met immediately following such sale.
Risk Assessment of Compensation Policies and Practices
In connection with the Compensation Committee’s evaluation and review of the Company’s policies and practices of compensating its associates, including executives and non-executive associates, as such policies and practices relate to risk management practices and risk-taking, the Compensation Committee has determined that its compensation plans and practices are not likely to have a material adverse effect on the Company.
|
COMPENSATION COMMITTEE REPORT |
|
The Compensation Committee is currently comprised of Messrs. Fowler (Chair), Lane, Levens, Liollio (Vice Chair), and Olinde. The Compensation Committee has reviewed and discussed the Compensation Discussion and Analysis (CD&A) required by Item 402(b) of Regulation S-K with executive management. Based on such review and discussion the Compensation Committee recommended to the Board of Directors that the 2024 CD&A be included in this proxy statement and in its Annual Report on Form 10-K for such fiscal year.
Respectfully submitted by the members of the Compensation Committee of the Board of Directors:
Hardy B. Fowler (Chair)
H. Merritt Lane, III
Jerry L. Levens
Constantine S. Liollio (Vice Chair)
Thomas H. Olinde
The following table sets forth the cash and other compensation that we paid to our NEOs or that was otherwise earned by our NEOs for their services in all capacities during 2024, 2023, and 2022.
|
|
|
|
|
|
|
|
|
|
SUMMARY COMPENSATION TABLE |
Name and
Principal Position |
Year |
Salary
($)(1) |
Stock
Awards
($)(2) |
|
Non-Equity
Incentive Plan
Compensation
($)(3) |
Change in Pension
Value and Nonqualified
Deferred Compensation
Earnings ($)(4) |
|
All Other
Compensation
($)(5) |
Total ($) |
John M. Hairston, |
2024 |
1,196,717 |
2,339,746 |
|
2,060,589 |
42,779 |
|
129,495 |
5,769,326 |
President and CEO |
2023 |
1,165,685 |
2,428,302 |
|
1,291,253 |
150,460 |
|
529,568 |
5,565,268 |
|
2022 |
1,091,712 |
2,327,705 |
|
2,616,572 |
― |
|
624,321 |
6,660,311 |
|
|
|
|
|
|
|
|
|
|
Michael M. Achary, |
2024 |
593,784 |
737,922 |
|
852,015 |
89,240 |
|
44,035 |
2,316,996 |
Chief Financial Officer |
2023 |
567,603 |
641,988 |
|
471,559 |
153,973 |
|
43,205 |
1,878,328 |
|
2022 |
536,370 |
615,505 |
|
964,162 |
― |
|
86,894 |
2,202,931 |
|
|
|
|
|
|
|
|
|
|
D. Shane Loper, |
2024 |
727,541 |
968,747 |
|
1,043,941 |
2,493 |
|
101,444 |
2,844,166 |
Chief Operating Officer |
2023 |
697,603 |
789,030 |
|
579,561 |
153,914 |
|
479,314 |
2,699,422 |
|
2022 |
647,877 |
743,142 |
|
1,164,604 |
― |
|
557,588 |
3,113,212 |
|
|
|
|
|
|
|
|
|
|
Christopher S. Ziluca, |
2024 |
535,027 |
474,901 |
(6) |
499,008 |
― |
|
24,578 |
1,533,514 |
Chief Credit Officer |
|
|
|
|
|
|
|
|
― |
|
|
|
|
|
|
|
|
|
― |
|
|
|
|
|
|
|
|
|
|
Michael Otero, |
2024 |
468,784 |
270,536 |
|
437,225 |
28,224 |
|
15,270 |
1,220,039 |
Chief Risk Officer |
|
|
|
|
|
|
|
|
― |
|
|
|
|
|
|
|
|
|
― |
|
|
|
|
|
|
|
|
|
|
(1)Amounts reflect the annual base salaries earned for the applicable year.
(2)Amounts reflect the grant date fair value of restricted stock units (RSUs) and performance stock units (PSUs) granted during the year, calculated in accordance with FASB Topic 718. The grant date fair value of the RSAs and RSUs is based on the closing price of our common stock on the grant date, as adjusted for an illiquidity discount related to the post-vest holding requirement. The grant date fair value of PSUs earned based on achievement of EPS goals is determined based on the expected probability of achieving the goals, and the grant date fair value of PSUs earned based on relative TSR is determined using a Monte Carlo simulation method, as set forth in Note 18 to the Consolidated Financial Statements included in our Annual Report on Form 10-K for the year ended December 31, 2024.
With respect to PSUs, amounts included in the table are based on the probable outcome of the performance conditions for the year, assuming achievement of the performance conditions at “target” levels. The grant date value of the PSUs, assuming achievement of performance conditions at the highest level, would be as follows:
|
|
|
|
NEO |
2024 |
2023 |
2022 |
John M. Hairston |
$2,998,600 |
$3,290,914 |
$2,951,096 |
Michael M. Achary |
$811,565 |
$749,175 |
$678,006 |
D. Shane Loper |
$1,065,460 |
$920,768 |
$818,570 |
Christopher S. Ziluca |
$522,290 |
|
|
Michael Otero |
$297,540 |
|
|
(3)Amounts reflect the annual cash incentives earned by each NEO for the applicable year, as described in the Compensation Discussion and Analysis above.
(4)The Change in Pension Value and Nonqualified Deferred Compensation Earnings column reflects the aggregate increase in actuarial present value of each of the NEO’s accumulated benefits under the Hancock Whitney Corporation Pension Plan. Mr. Ziluca is not eligible to participate in the pension plan as the plan was amended on June 17, 2017 to exclude any individual hired after that date.
(5)All Other Compensation includes the value of certain perquisites and benefits the Company makes available to its executive officers as shown below.
|
|
|
|
|
Name |
Total
Perquisites (i) |
Company Plan
Contributions (ii) |
Dividends (iii) |
Total |
John M. Hairston |
$101,238 |
$12,075 |
$16,182 |
$129,495 |
Michael M. Achary |
26,198 |
12,075 |
5,762 |
44,035 |
D. Shane Loper |
82,365 |
12,075 |
7,004 |
101,444 |
Christopher S. Ziluca |
3,043 |
18,975 |
2,560 |
24,578 |
Michael Otero |
548 |
11,850 |
2,872 |
15,270 |
(i)Total perquisites include Company provided auto allowances, professional organization dues, executive physicals, parking, and supplemental long-term disability insurance as well as a housing allowance of $84,000 for Mr. Hairston and $60,000 for Mr. Loper.
(ii)Company plan contributions include amounts contributed to the Company’s Nonqualified Deferred Compensation Plan and the Hancock Whitney 401(k) Plan.
(iii)Dividends reflect dividends paid on RSAs and dividend equivalents paid on RSUs.
(6)The Company permits its executives to elect to defer awards received under our long-term incentive program into our Nonqualified Deferred Compensation Plan. The value of stock awards includes the value of units so deferred and credited under the Nonqualified Deferred Compensation Plan. The grant date fair value of the long-term incentive awards deferred by Mr. Ziluca for 2024 was $474,501.
The following table below sets forth the individual grants of plan-based awards made to each of our NEOs during 2024.
|
|
|
|
|
|
|
|
|
|
|
|
|
2024 GRANTS OF PLAN-BASED AWARDS |
|
|
|
|
|
Estimated Future Payouts
Under Non-Equity Incentive
Plan Awards (3) |
Estimated Future Payouts
Under Equity Incentive
Plan Awards (4) |
|
|
Name |
Award
Type |
Approval Date |
Grant
Date |
Thres-
hold ($) |
Target
($) |
Maxi-
mum ($) |
Thres-
hold (#) |
Target
(#) |
Maxi-
mum
(#) |
All Other
Stock
Awards:
Number
of Shares
of Stock
or Units
(#) |
Grant Date
Fair Value
of
Stock and
Option
Awards
($)(5) |
John M. Hairston |
Annual Cash |
|
|
|
718,030 |
1,436,061 |
2,872,121 |
|
|
|
|
|
|
PSU |
1/24/2024 |
2/16/2024 |
(1) |
|
|
|
20,680 |
41,360 |
82,720 |
|
1,643,646 |
|
RSU |
1/24/2024 |
2/16/2024 |
(2) |
|
|
|
|
|
|
17,726 |
696,100 |
Michael M. Achary |
Annual Cash |
|
|
|
296,892 |
593,784 |
1,187,568 |
|
|
|
|
|
|
PSU |
1/24/2024 |
2/16/2024 |
(1) |
|
|
|
5,597 |
11,194 |
22,388 |
|
444,850 |
|
RSU |
1/24/2024 |
2/16/2024 |
(2) |
|
|
|
|
|
|
7,463 |
293,072 |
D. Shane Loper |
Annual Cash |
|
|
|
363,770 |
727,541 |
1,455,082 |
|
|
|
|
|
|
PSU |
1/24/2024 |
2/16/2024 |
(1) |
|
|
|
7,348 |
14,696 |
29,392 |
|
584,019 |
|
RSU |
1/24/2024 |
2/16/2024 |
(2) |
|
|
|
|
|
|
9,797 |
384,728 |
Christopher S. Ziluca |
Annual Cash |
|
|
|
173,884 |
347,768 |
695,536 |
|
|
|
|
|
|
PSU |
1/24/2024 |
2/16/2024 |
(1) |
|
|
|
3,602 |
7,204 |
14,408 |
|
286,287 |
|
RSU |
1/24/2024 |
2/16/2024 |
(2) |
|
|
|
|
|
|
4,803 |
188,614 |
Michael Otero |
Annual Cash |
|
|
|
152,355 |
304,710 |
609,419 |
|
|
|
|
|
|
PSU |
1/24/2024 |
2/16/2024 |
(1) |
|
|
|
2,052 |
4,104 |
8,208 |
|
163,093 |
|
RSU |
1/24/2024 |
2/16/2024 |
(2) |
|
|
|
|
|
|
2,736 |
107,443 |
(1)PSUs were approved by the Compensation Committee on January 24, 2024, with a grant date of February 16, 2024. PSUs will vest after a three-year service period based upon actual certified results of Adjusted EPS over a two-year performance period beginning January 1, 2024, ending December 31, 2025 and relative TSR over a three-year performance period beginning January 1, 2024, ending December 31, 2026. The net shares issued upon vesting of the award and after payment of withholding taxes will be subject to an additional two-year post-vest holding period.
(2)RSUs were approved by the Compensation Committee on January 24, 2024, with a grant date of February 16, 2024. The RSUs vest incrementally over three years with an additional two-year post-vest holding period applicable to the net shares issued upon vesting of the award and after payment of withholding taxes.
(3)Reflects threshold, target and maximum payout levels under our annual cash incentive program for 2024. The actual amount of incentive bonus earned by each named executive officer is reported under the Non-Equity Incentive Plan
Compensation column in the Summary Compensation Table. Additional information regarding the design of the annual cash incentive program is included in the Compensation Discussion and Analysis section above.
(4)Represents threshold, target and maximum payout levels under performance share awards granted in 2024. The number of actual shares earned under the PSUs will be based on the achievement of performance goals relating to adjusted EPS over a two-year performance period and relative TSR over a three-year performance period, as described in the Compensation Discussion and Analysis section above.
(5)Amounts reflect the grant date fair value of stock awards granted during the year, calculated in accordance with FASB ASC Topic 718.
The following table provides information regarding equity awards that are outstanding as of December 31, 2024 for each of our NEOs.
|
|
|
|
|
|
OUTSTANDING EQUITY AWARDS AT DECEMBER 31, 2024 |
Stock Awards |
Name |
Grant Date |
Number of Units
That Have Not
Vested (#)(1) |
Market Value of
Units That Have
Not Vested ($)(2) |
Equity Incentive Plan
Awards: Number of
Unearned Units That
Have Not Vested (#)(3) |
Equity Incentive Plan
Awards: Market or Payout
Value of Unearned Units
That Have Not Vested ($)(2) |
John M. Hairston |
2/16/2024 |
17,726 |
969,967 |
|
|
|
2/16/2024 |
|
|
82,720 |
4,526,438 |
|
2/17/2023 |
10,061 |
550,538 |
|
|
|
2/17/2023 |
|
|
35,212 |
1,926,801 |
|
2/18/2022 |
4,451 |
243,559 |
|
|
|
2/18/2022 |
|
|
37,359 |
2,044,284 |
Michael M. Achary |
2/16/2024 |
7,463 |
408,375 |
|
|
|
2/16/2024 |
|
|
22,388 |
1,225,071 |
|
2/17/2023 |
3,563 |
194,967 |
|
|
|
2/17/2023 |
|
|
8,016 |
438,636 |
|
2/18/2022 |
1,591 |
87,060 |
|
|
|
2/18/2022 |
|
|
8,583 |
469,662 |
D. Shane Loper |
2/16/2024 |
9,797 |
536,092 |
|
|
|
2/16/2024 |
|
|
29,392 |
1,608,330 |
|
2/17/2023 |
4,379 |
239,619 |
|
|
|
2/17/2023 |
|
|
9,852 |
539,101 |
|
2/18/2022 |
1,921 |
105,117 |
|
|
|
2/18/2022 |
|
|
10,382 |
568,103 |
Christopher S. Ziluca |
2/16/2024 |
4,803 |
262,820 |
|
|
|
2/16/2024 |
|
|
14,408 |
788,406 |
|
2/17/2023 |
2,648 |
144,899 |
|
|
|
2/17/2023 |
|
|
5,958 |
326,022 |
|
2/18/2022 |
1,122 |
61,396 |
|
|
|
2/18/2022 |
|
|
6,058 |
331,494 |
Michael Otero |
2/16/2024 |
2,736 |
149,714 |
|
|
|
2/16/2024 |
|
|
8,208 |
449,142 |
|
2/17/2023 |
1,468 |
80,329 |
|
|
|
2/17/2023 |
|
|
3,302 |
180,685 |
|
2/18/2022 |
584 |
31,956 |
|
|
|
2/18/2022 |
|
|
3,152 |
172,477 |
(1)The RSUs have a three-year service requirement and vest 33.3% per year. The awards are subject to a two-year post-vest holding period.
(2)Market value is calculated based on the closing price of our common stock on December 31, 2024, the last market day of the fiscal year, of $54.72.
(3)The PSUs have either a two-year performance period (for PSUs earned based on the EPS metric) or a three-year performance period (for PSUs earned based on the relative TSR metric) and three-year service requirement (all shares earned for the award to vest after three years of service if applicable threshold levels of performance are met). After vesting, these awards are subject to a two-year post-vest holding period. The executives earn between 0% and 200% of the target PSU award based on the Company’s achievement of performance criteria over the performance period.
The amounts reported for the February 16, 2024 grants of PSUs are reflected as 200% of target performance shares assuming target performance is achieved based on performance as of December 31, 2024 (the last completed fiscal year over which performance is measured; full performance has not yet been achieved as performance period ends December 31, 2026). The amounts reported for the February 17, 2023 grants of PSUs are reflected as 100% of target performance shares assuming target performance is achieved based on performance as of December 31, 2024 (the
last completed fiscal year over which performance is measured; full performance has not yet been achieved as performance period ends December 31, 2025). The amounts reported for the February 18, 2022 grants of PSUs reflect 119.91% of target performance shares based on actual performance criteria achieved as of the close of the performance period on December 31, 2024, which was certified by the Compensation Committee on January 29, 2025 and vested on February 1, 2025.
The following table provides information regarding the vesting of restricted and performance stock awards and the exercise of stock options held by our NEOs in 2024.
|
|
|
|
|
2024 Option Exercises And Stock Vested |
|
Option Awards |
Stock Awards |
Name |
Number of Shares
Acquired on Exercise (#) |
Value Realized
on Exercise ($) |
Number of Shares
Acquired on Vesting (#) |
Value Realized
on Vesting ($)(1) |
John M. Hairston |
― |
― |
113,439 |
5,117,233 |
Michael M. Achary |
― |
― |
31,931 |
1,440,407 |
D. Shane Loper |
― |
― |
35,753 |
1,612,818 |
Christopher S. Ziluca |
― |
― |
22,251 |
1,003,743 |
Michael Otero |
― |
― |
9,523 |
433,765 |
(1)Reflects the fair market value of the shares as of the vesting date, which is defined in our long-term incentive plan as the closing price of our common stock on the day prior to vesting. Shares vested in 2024 are subject to a 2-year post-vest holding period.
The following table provides information regarding our Pension Plan and Retirement Restoration Plan, which provide for payment or other benefits at, following, or in connection with retirement.
|
|
|
|
|
2024 Pension Benefits |
Name |
Plan Name |
Number of Years of Credited Service (#) |
Present Value of
Accumulated
Benefit ($)(1) |
Payments During
2024 ($) |
John M. Hairston |
Hancock Whitney Corporation
Pension Plan |
30 |
1,074,982 |
― |
Michael M. Achary |
Hancock Whitney Corporation
Pension Plan |
24 |
1,106,052 |
― |
D. Shane Loper |
Hancock Whitney Corporation
Pension Plan |
34 |
1,097,918 |
― |
Christopher S. Ziluca |
Hancock Whitney Corporation
Pension Plan |
― |
― |
― |
Michael Otero |
Hancock Whitney Corporation
Pension Plan |
10 |
302,582 |
― |
(1)Based on Accounting Standards Codification 715-20 assumptions used for disclosure as of December 31, 2024. The present value of the accumulated benefit obligation is determined using the following assumptions: Interest rate 5.63% per annum and the Pre-Commencement: RP-2014 Employee Life Mortality Table (Bottom Quartile) (adjusted for MP-2021) Fully Generational Projection using Scale MP-2021 and Post-Commencement: RP-2014 Annuitant Life Mortality Table (Bottom Quartile) (adjusted for MP-2021) Fully Generational Projection using Scale MP-2021. Assumes the benefit will be paid in the normal form on the later of age 65 and the valuation date.
____________________________
The Hancock Whitney Corporation Pension Plan covers certain eligible associates of the Company upon the completion of one year of service and the attainment of age 21. In 2017, the plan was amended to exclude any individual hired or rehired by the Company after June 30, 2017 from eligibility to participate. Additionally, the amendment provides that the accrual of benefits of each participant whose combined age plus years of service as of January 1, 2018 totals less than 55 will be frozen. Benefits under the plan are determined as the sum of 1% of compensation multiplied by years of service and 0.5% of compensation in excess of a 35-year average of the social security wage base multiplied by years of service. The benefits are determined using base pay, but excluding bonuses and other items of extraordinary compensation. The Internal Revenue Service limits compensation that may be considered for purposes of calculating plan benefits. In 2023, this limit was $330,000. Benefits are payable in the form of actuarially-equivalent annuities, following separation from service and attainment of the normal (age 65) or early (age 55 and 10 years of service) retirement age. Early retirement benefits are subject to actuarial reduction.
The following table provides information regarding our Nonqualified Deferred Compensation Plan, which provides for the deferral of compensation on a basis that is not tax-qualified.
|
|
|
|
|
|
2024 NONQUALIFIED DEFERRED COMPENSATION |
Name |
Executive
Contributions in
2024 ($)(1) |
Registrant Contributions in 2024 ($)(1) |
Aggregate Earnings
in 2024 ($)(2) |
Aggregate
Withdrawals/
Distributions ($) |
Aggregate Balance at December 31, 2024 ($)(3) |
John M. Hairston |
― |
― |
2,255,484 |
― |
18,377,373 |
Michael M. Achary |
237,308 |
― |
465,795 |
― |
5,253,267 |
D. Shane Loper |
― |
― |
1,151,187 |
― |
8,202,436 |
Christopher S. Ziluca |
119,714 |
― |
50,844 |
― |
736,664 |
Michael Otero |
23,414 |
― |
23,751 |
― |
240,542 |
(1)The amounts included in the Executive Contributions in 2024 and Registrant Contributions in 2024 are also reported as 2024 compensation in the Summary Compensation Table with the exception of Executive Contributions for Mr. Ziluca of $66,252, which would have been reported as compensation in the Summary Compensation Table for years prior to 2024 if Mr. Ziluca was an NEO prior to 2024.
(2)Contributions are treated as if invested in one or more investment vehicles selected by the participant. The annual rate of return for each of these funds for fiscal year 2024 was as follows:
|
|
Fund |
One Year Total Return |
Model Portfolio – Conservative |
4.13% |
Model Portfolio – Moderate/Conservative |
6.74% |
Model Portfolio – Moderate |
9.08% |
Model Portfolio – Moderate/Aggressive |
11.22% |
Model Portfolio – Aggressive |
13.47% |
Fidelity VIP Government Money Mkt Svc |
4.98% |
T. Rowe Price Limited-Term Bond |
4.96% |
Fidelity VIP Investment Grade Bond Svc |
1.62% |
American Century VP II Inflation Protection I |
1.82% |
PIMCO Global Bond Opportunities (Unhedged) Admin |
-0.50% |
Brighthouse II MFS Value A |
11.91% |
Fidelity VIP Index 500 Initial |
24.90% |
Brighthouse II Jennison Growth A |
30.28% |
LVIP American Century Mid Cap Value Std II |
8.73% |
Empower T. Rowe Price Mid Cap Growth Inv |
9.05% |
Macquarie VIP Small Cap Value Series Std |
11.32% |
Vanguard VIF Small Company Growth |
11.38% |
Empower International Value Inv |
5.46% |
Invesco VI EQV International Equity I |
0.62% |
Hancock Whitney Corporation Common Stock |
16.09% |
(3)The following amounts included in the Aggregate Balance at December 31, 2024 were previously reported as compensation to the NEOs in the Summary Compensation Table for years prior to 2023: Mr. Hairston, $9,662,444; Mr. Achary, $3,235,134; Mr. Loper, $4,048,792; Mr. Otero, $118,103 (had he been an NEO prior to 2024); and Mr. Ziluca, $539,937 (had he been an NEO prior to 2024).
_____________________________
Under our Nonqualified Deferred Compensation Plan, participants may elect a maximum deferral of 80% of base salary, 80% of annual incentive bonus, and 100% of annual long-term incentive awards (in the form of performance stock units and restricted stock units). The minimum deferral for base salary and annual incentive bonus amounts is $3,000 in the aggregate and 25% for long-term incentive awards.
Company contributions are made to the Nonqualified Deferred Compensation Plan at the discretion of the Compensation Committee. Each year, a 401(k) restoration matching contribution may be made to participant accounts. Unless otherwise provided by the Compensation Committee, a participant shall be vested in his Company restoration matching account at the time or times and in the amounts determined in accordance with the provisions of the Hancock Whitney 401(k) Plan. The Nonqualified Deferred Compensation Plan also allows for supplemental contributions to be made to participants at the discretion of the Compensation Committee (referred to as SERP contributions). The factors taken into consideration for these contributions are current total cash compensation and a reasonable estimate of final pay at retirement, years of
service while eligible for supplemental contributions, remaining with the Company until age 65, a reasonable estimate of growth in the value of the supplemental contribution account investments over the years prior to retirement, and the growth of the supplemental contribution account based on actual investment opportunities deemed to be credited to the supplemental contribution account. The participant will vest in the supplemental contribution account on a 10-year graded vesting schedule beginning at age 51 and ending at age 60. Each participant will be 100% vested at age 60.
Participants elect the investment options in which their deferrals are deemed to be invested from a group of measurement funds made available under the plan by the Compensation Committee. The participants may allocate and reallocate the investments of their deferral accounts among such investment options on a daily basis subject to certain limitations. Earnings or losses are allocated to the participant’s accounts under the plan on a daily basis based on the performance, positive or negative, of each specific measurement fund in which the participant’s accounts are deemed to be invested. In the event no investment election is made by a participant, the participant’s accounts under the plan are deemed to be invested in the lowest-risk measurement fund available under the plan and credited or debited with the earnings of such fund, until the participant elects otherwise. Only deferrals of a participant’s bonus may be deemed invested in the common stock measurement fund available under the plan. Any amounts deemed invested in the common stock measurement fund and any deferrals of restricted units or performance units may not be reallocated to any other investment measurement fund under the plan. Incentive units (excluding unvested performance units) and amounts deemed invested in the common stock measurement fund are credited with dividend equivalent units as of each dividend payment date and deemed reinvested in additional common stock units based on the fair market value of the Company’s stock on the dividend payment date. If service and performance conditions related to restricted or performance units are not met, the unit credits will be reversed.
Payments from the plan are payable upon the earlier of retirement, termination of employment, disability, death, or scheduled distribution (payment during a specified year elected by the participant). Distributions due to retirement may begin immediately or up to five years after retirement and may be made in a lump sum or in annual installments from two to 15 years. The time and method of retirement distributions are elected by each participant and, effective for 2015 and thereafter, may be separately elected on an annual basis with respect to amounts deferred and/or contributed on behalf of the participant for such year. Distributions due to termination of employment of all amounts deferred or contributed to the plan on behalf of the participant prior to 2015 shall be distributed in a lump sum. Effective 2015 and thereafter, each participant may separately elect on an annual basis the method in which amounts deferred or contributed on such participant’s behalf for such year will be distributed in the event of a termination of employment. Such distributions may be made in a lump sum or in annual installments over a period not to exceed three years.
Distributions due to death or disability and scheduled distributions may only be made in a lump sum. Scheduled distributions may not be made with respect to any long-term awards deferred under the plan. Distributions of incentive units and of funds held in the common stock measurement fund may only be made in common stock of the Company.
|
POTENTIAL PAYMENTS UPON TERMINATION OR CHANGE IN CONTROL |
|
The following table sets forth the amounts that would have been payable to each of our NEOs under the various scenarios for termination of employment or a change in control (CIC) in the Company had such scenarios occurred on December 31, 2024. The price per share of Company stock that is used for purposes of the table is $54.72, the closing market price as of December 31, 2024. The actual amounts to be paid can only be determined at the time of such executive’s separation from the Company or the change in control. In addition to the amounts reflected in the table, upon termination of employment each of the NEOs would also receive benefits under the Hancock Whitney Corporation Pension Plan, as described above, as well as benefits under the Hancock Whitney 401(k) Plan. Finally, the receipt of many of the payments and benefits listed in the table below are contingent upon the executive complying with certain covenants, which are described below.
|
|
|
|
|
|
|
|
|
|
|
Executive Benefits and
Payments Upon Termination |
Voluntary or Involuntary Without Cause |
For
Cause |
CIC Only |
Involuntary or
For Good
Reason Following
CIC |
Death or Disability |
John M. Hairston,
President and Chief Executive Officer |
|
|
|
|
|
|
|
|
|
|
Severance Benefit |
― |
|
― |
|
― |
|
9,495,565 |
(3) |
― |
|
Vesting of Long Term Incentives: RSUs and PSUs |
5,321,297 |
(1) |
― |
|
3,275,296 |
(2) |
5,109,938 |
(4) |
5,877,510 |
(5) |
Vesting of Nonqualified Deferred Compensation (5) |
― |
|
― |
|
― |
|
― |
|
― |
|
Medical Insurance |
― |
|
― |
|
― |
|
39,312 |
|
― |
|
TOTAL |
5,321,297 |
|
― |
|
3,275,296 |
|
14,644,815 |
|
5,877,510 |
|
Michael M. Achary,
Chief Financial Officer |
|
|
|
|
|
|
|
|
|
|
Severance Benefit |
― |
|
― |
|
― |
|
2,667,147 |
(3) |
― |
|
Vesting of Long Term Incentives: RSUs and PSUs |
1,387,214 |
(1) |
― |
|
749,901 |
(2) |
1,467,132 |
(4) |
1,701,340 |
(5) |
Vesting of Nonqualified Deferred Compensation (5) |
― |
|
― |
|
― |
|
― |
|
― |
|
Medical Insurance |
― |
|
― |
|
― |
|
12,624 |
|
― |
|
TOTAL |
1,387,214 |
|
― |
|
749,901 |
|
4,146,903 |
|
1,701,340 |
|
D. Shane Loper,
Chief Operating Officer |
|
|
|
|
|
|
|
|
|
|
Severance Benefit |
― |
|
― |
|
― |
|
3,197,777 |
(3) |
― |
|
Vesting of Long Term Incentives: RSUs and PSUs |
1,736,322 |
(1) |
― |
|
912,529 |
(2) |
1,827,137 |
(4) |
2,146,358 |
(5) |
Vesting of Nonqualified Deferred Compensation (5) |
― |
|
― |
|
971,724 |
(6) |
971,724 |
|
971,724 |
|
Medical Insurance |
― |
|
― |
|
― |
|
26,208 |
|
― |
|
TOTAL |
1,736,322 |
|
― |
|
1,884,253 |
|
6,022,846 |
|
3,118,082 |
|
Christopher S. Ziluca,
Chief Credit Officer |
|
|
|
|
|
|
|
|
|
|
Severance Benefit |
― |
|
― |
|
― |
|
2,043,391 |
(3) |
― |
|
Vesting of Long Term Incentives: RSUs and PSUs |
― |
|
― |
|
539,785 |
(2) |
1,027,495 |
(4) |
1,164,251 |
(5) |
Vesting of Nonqualified Deferred Compensation (5) |
― |
|
― |
|
― |
|
― |
|
― |
|
Medical Insurance |
― |
|
― |
|
― |
|
35,760 |
|
― |
|
TOTAL |
― |
|
― |
|
539,785 |
|
3,106,646 |
|
1,164,251 |
|
Michael Otero,
Chief Risk Officer |
|
|
|
|
|
|
|
|
|
|
Severance Benefit |
― |
|
― |
|
― |
|
1,654,751 |
(3) |
― |
|
Vesting of Long Term Incentives: RSUs and PSUs |
524,435 |
(1) |
― |
|
287,915 |
(2) |
560,190 |
(4) |
639,709 |
(5) |
Vesting of Nonqualified Deferred Compensation (5) |
― |
|
― |
|
― |
|
― |
|
― |
|
Medical Insurance |
― |
|
― |
|
― |
|
36,840 |
|
― |
|
TOTAL |
524,435 |
|
― |
|
287,915 |
|
2,251,781 |
|
639,709 |
|
(1)Messrs. Hairston, Achary, Loper, and Otero meet all of the conditions of retirement as of December 31, 2024 for the RSUs and PSUs granted in 2022, 2023 and 2024. Amounts presented include a pro rata payout assuming maximum performance is achieved for PSUs granted in 2024 resulting in 200% of target shares awarded, target performance is achieved for PSUs granted in 2023 resulting in 100% of target shares awarded, and actual performance is achieved for PSUs granted in 2022 resulting in 119.91% of target shares awarded and a pro rata vesting of the RSUs granted in 2024, 2023 and 2022 and related cash dividend equivalents accrued on those RSUs that otherwise would vest on February 1, 2025 assuming continued service through the vesting date.
(2)Amounts reported reflect a pro rata payout assuming the target performance is achieved for PSUs granted in 2023 (if units are not assumed by the surviving entity or otherwise equitably converted or substituted) and actual performance of 119.91 % is achieved for PSUs granted in 2022.
(3)Reflects a lump-sum payment equal to three (in the case of Mr. Hairston) or two (in the case of Messrs. Achary, Loper, Ziluca, and Otero) times base salary and average annual bonus for the three most recent fiscal years.
(4)Amounts reported reflect a pro rata payout assuming the target performance is achieved for PSUs granted in 2023 and actual performance of 119.91% is achieved for PSUs granted in 2022 and immediate vesting of all outstanding RSAs and RSUs including cash dividend equivalents accrued on those RSUs.
(5)Amounts reported reflect a pro rata payout assuming the maximum number of PSUs granted in 2024 and the target number of PSUs granted in 2023 will be earned during the performance period or paid out upon disability within the performance period and above target performance is achieved for PSUs granted in 2022 resulting in 119.91% of target shares awarded and immediate vesting of all outstanding RSUs including related cash dividend equivalents accrued on those RSUs.
(6)The total balance under the Nonqualified Deferred Compensation Plan as of December 31, 2024 is shown in the Nonqualified Deferred Compensation Table. This table includes only the unvested amount that would become vested upon the occurrence of the specified event under the terms of the plan.
The following summarizes the payment and benefits the NEOs would be entitled to under the various termination and change in control scenarios, which are reflected in the table above.
Voluntary Termination (Including Retirement) & Involuntary Termination without Cause
In the event of a voluntary termination (including retirement) and involuntary termination without cause of an NEO, such executive would be entitled to receive any unpaid amounts previously earned during his term of employment.
In the event an NEO meets all conditions for retirement as set forth within the terms of the respective award agreement at the time of termination, he would also be entitled to the following:
•Vesting of a percentage of the PSUs granted in 2023 and 2024 that are actually earned based on Company performance pro-rated for the portion of the vesting period worked by the executive prior to termination. Eleven-thirty sixths of the 2024 PSUs will vest as the executive has worked 11 months of the 36-month vesting period as of December 31, 2024. Twenty three-thirty sixths of the 2023 PSUs will vest as the executive has worked 23 months of the 36-month vesting period as of December 31, 2024. A portion of the 2022 PSUs will vest at 119.91% as the executive has completed the performance period as of December 31, 2024; and
•Vesting of a percentage of outstanding RSUs granted in 2022, 2023 and 2024 based on the number of months elapsed since the most recent vesting date or grant date if granted within the last 12 months. Any cash dividend equivalents accrued on the outstanding RSUs will be paid in cash upon vesting of the related shares.
For Cause Termination
In the event of a for cause termination of a NEO, such executive would only be entitled to receive any unpaid amounts previously earned during his term of employment.
Change in Control Only
In the event of a change in control (defined below) only, NEOs would be entitled to the following:
•RSUs vest only if the Board of Directors exercises its discretion to vest such awards as a result of the post-transaction surviving entity choosing not to assume any obligations relating to such awards and choosing not to convert such awards into equivalent rights with respect to equity in the post-transaction surviving entity. If these awards were to be vested, the amounts reported would be as follows: Hairston ($1,764,063), Achary ($690,402), Loper ($880,828); Ziluca ($409,115); and Otero ($261,999); and
•A pro-rata portion of the PSUs granted in 2023 would vest under the assumption that the units are not assumed by the surviving entity or otherwise equitable converted or substituted; and
•Immediate vesting of any unvested amounts under the Nonqualified Deferred Compensation Plan, but only to the extent such vesting does not cause the excise tax provisions of Code Section 4999 to be effective with respect to the executive.
One or more of the benefits listed above will be reduced to the extent necessary to avoid excise taxes under Code Section 4999 if such reduction results in higher after-tax benefits to the executives than if such benefits are not reduced.
Involuntary Termination or Termination for Good Reason following Change in Control
In the event of an involuntary termination (including disability), or a termination for good reason (defined below) of a NEO within two years following a change in control (defined below), in addition to any unpaid amounts previously earned during the NEO's term of employment, the NEO would be entitled to the following:
•Immediate vesting (at the time of the change in control) of amounts indicated above under Change in Control Only, with subsequent vesting (at the time of the executive’s disability or termination of employment) of any RSUs that did not vest at the time of the change in control;
•Vesting of a percentage of the PSUs granted in 2023 and 2022 that are actually earned based on Company performance. The 2023 PSUs have a three-year vesting period with half of the award based on achievement of adjusted EPS over a two-year performance period and half of the awards based on relative TSR over a three-year performance period. If the CIC occurs during the performance period (at least one year after the start of the performance period), the vested percentage is based on the actual performance results for the portion of the performance period ending on the date of the CIC pro-rated based on the number of whole months elapsed between the grant date and the CIC and the denominator of which is 36. 119.91% of the 2022 PSUs will vest as the performance period is complete with above target performance achieved as of December 31, 2024;
•Mr. Hairston would be entitled to a lump-sum payment equal to three times his base salary and average annual bonus (for the three most recent fiscal years); and Messrs. Achary, Loper, Ziluca, and Otero would be entitled to a lump-sum payment equal to two times their base salary and average annual bonus (for the three most recent fiscal years); and
•Mr. Hairston would be entitled to up to 36 months of medical insurance continuation. Messrs. Achary, Loper, Ziluca, and Otero would be entitled to up to 24 months of medical insurance continuation. Coverage would be provided at the same level of benefits as in effect at the time of the executive’s disability or termination of employment, and on the same cost sharing basis as in effect for active executives in comparable positions. Coverage would cease upon the executive becoming eligible for similar coverage provided by another employer.
One or more of the benefits listed above will be reduced to the extent necessary to avoid excise taxes under Code Section 4999 if such reduction results in higher after-tax benefits to the executives than if such benefits are not reduced.
Death or Disability
In the event of the death or disability of a NEO, in addition to any unpaid amounts previously earned during the NEO's term of employment, the NEO would be entitled to the following:
•Vesting of the PSUs granted in 2022 that are actually earned based on Company performance and a percentage of the target number of PSUs granted in 2024 and 2023. For the 2024, 2023 and 2022 PSUs, the vested percentage is based on the portion of the vesting period worked by the executive prior to death or becoming disabled. Eleven-thirty sixths of the 2024 PSUs will vest as the executive has worked 11 months of the 36-month vesting period as of December 31, 2024. Thirty-five-thirty sixths of the 2022 PSUs will vest at actual performance of 119.91% as the executive has worked 35 months of the 36-month vesting period as of December 31, 2023;
•Immediate vesting of all RSAs and RSUs including accrued cash dividends;
•Immediate vesting of any unvested amounts under the Nonqualified Deferred Compensation Plan;
•Upon disability, a monthly disability benefit of $7,500 for Messrs. Hairston, Achary and Loper to be paid by the contracted insurance carrier rather than by the Company; and
•Upon death, beneficiaries of the deceased executive would be entitled to a $25,000 death benefit to be paid by the contracted insurance carrier rather than by the Company.
Definition of Change in Control
Generally, a change in control shall be deemed to have occurred upon the happening of any of the following events as to the Company:
•The acquisition by any one person, or by more than one person acting as a group, of ownership of stock that, together with stock held by such person or group, constitutes more than 50% of the total fair market value or total voting power of the stock of the Company;
•The acquisition by any one person, or by more than one person acting as a group, during the 12-month period ending on the date of the most recent acquisition, of ownership of stock possessing 50% or more of the total voting power of the stock of the Company;
•The replacement during any 12-month period of a majority of the members of the Board of the Company by directors whose appointment or election is not endorsed by a majority of the members of such Board before the date of such appointment or election; or
•The acquisition by any one person, or by more than one person acting as a group, during the 12-month period ending on the date of the most recent acquisition, of assets of the Company having a total gross fair market value of more than 50% of the total gross fair market value of all of the assets of the Company immediately prior to such acquisition or acquisitions.
For purposes of the above, “persons acting as a group” shall have the meaning as in Treasury Regulations Section 1.409A-3(i)(5)(v)(B).
Definition of Good Reason
“Good Reason” shall generally mean any of the following occurring without the executive’s consent:
•a material diminution in the executive’s position, authority, duties or responsibilities from those which the executive held immediately prior to the effective date of the change in control;
•requiring the executive to be based at any office which is a material change from the geographic location of the office at which the executive was employed immediately prior to the change in control;
•a material diminution in the budget over which the executive retains authority;
•a material diminution in the executive’s annual base salary; or
•any other action or inaction that constitutes a material breach by the Company of any agreement pursuant to which the executive performs services for the Company.
Notwithstanding the preceding, however, none of such actions shall constitute “Good Reason” unless (1) the executive provides the Company with notice of the existence of such condition within 90 days of the initial existence thereof and a period of at least 30 days following such notice within which to remedy such condition, and (2) the executive terminates employment within two years of the initial existence of such condition.
Conditions Applicable to Receipt of Payments and Benefits
All payments and benefits to or on behalf of the NEOs (other than accelerated vesting of Long-Term Incentives and Nonqualified Deferred Compensation) in the event of disability, involuntary termination or termination for good reason upon a change in control are contingent upon such executives complying with confidentiality, non-solicitation and non-disparagement covenants during their terms of employment and for two years thereafter.
CEO Pay Ratio
We believe executive pay must be internally consistent and equitable to motivate our associates to create shareholder value. Our CEO to median associate pay ratio is calculated in accordance with SEC requirements pursuant to Item 402(u) of Regulation S-K. We identified the median associate by examining the 2024 W-2 Box 5 Wages (Medicare Wages and Tips) for all individuals, excluding our CEO, who were employed by us on December 31, 2024, the last day of our payroll year. We included all associates, whether employed on a full-time, part-time, or on call basis. We did not make any assumptions, adjustments, or estimates with respect to W-2 Box 5 Wages, and we did not annualize the compensation for any associates that were not employed by us for all of 2024. We believe the use of W-2 Box 5 Wages for all associates is a consistently applied compensation measure.
After identifying the median associate, we calculated annual total compensation for such associate using the same methodology we use for our named executive officers as set forth in the 2024 Summary Compensation Table above. The total annual compensation of our median associate was $75,443. The total annual compensation of our CEO was $5,769,326. Accordingly, the ratio of CEO pay to median associate pay was approximately 76:1.
Pay Versus Performance
Background
Item 402(v) of the SEC’s Regulation S-K, which was mandated by the Dodd-Frank Wall Street Reform and Consumer Protection Act of 2010, requires disclosure of information that demonstrates the relationship between executive compensation actually paid (referred to herein as “CAP”) and the financial performance of the issuer.
|
|
|
|
|
|
|
|
|
PAY VERSUS PERFORMANCE |
|
|
|
|
|
Value of Initial Fixed
$100 Investment Based on: |
|
|
Year |
Summary
Compensation
Table Total for
CEO ($) |
Compensation
Actually Paid to
CEO ($) (2)(3) |
Average Summary
Compensation
Table Total for Non-
CEO NEOs ($) (1) |
Average Summary
Compensation
Actually Paid to Non-CEO NEOs ($) (2)(3) |
Total
Shareholder
Return |
Peer Group
Total
Shareholder
Return (4) |
Net
Income
(in thousands) |
Adjusted EPS (5) |
(a) |
(b) |
(c) |
(d) |
(e) |
(f) |
(g) |
(h) |
(i) |
2024 |
$5,769,326 |
$8,481,165 |
$1,978,679 |
$2,589,125 |
$143.82 |
$130.90 |
$460,815 |
$5.31 |
2023 |
$5,565,268 |
$5,097,193 |
$1,950,896 |
$1,839,444 |
$123.90 |
$115.63 |
$392,602 |
$5.18 |
2022 |
$6,660,310 |
$8,160,975 |
$2,291,358 |
$2,727,056 |
$120.08 |
$116.10 |
$524,089 |
$5.98 |
2021 |
$5,938,806 |
$9,101,298 |
$2,210,600 |
$3,127,514 |
$121.57 |
$124.74 |
$463,215 |
$5.53 |
2020 |
$3,599,933 |
$932,265 |
$1,529,794 |
$595,913 |
$80.75 |
$91.29 |
$(45,174) |
$(0.54) |
(1)Non-CEO NEOs included Mr. Achary, Mr. Loper, Mr. Ziluca, and Mr. Otero for 2024 and Mr. Achary, Mr. Loper, Mr. Exnicios, and Mr. Knight for 2023, 2022, 2021, and 2020.
(2)The dollar amounts reported in columns (c) and (e) represent the amount of “compensation actually paid,” or CAP, to the CEO and Other Non-CEO NEOs, respectively, as computed in accordance with Item 402(v) of Regulation S-K. The dollar amounts do not reflect the actual amount of compensation earned by or paid to the CEO or other NEOs, respectively, during the applicable year.
(3)The table below sets forth the calculation of CAP.
|
|
|
|
|
|
|
|
|
|
|
|
CEO |
Average of Non-CEO NEOs |
|
2024 |
2023 |
2022 |
2021 |
2020 |
2024 |
2023 |
2022 |
2021 |
2020 |
Total Compensation as Reported in the “Total” column of the SCT |
$5,769,326 |
$5,565,268 |
$6,660,310 |
$5,938,806 |
$3,599,933 |
$1,978,679 |
$1,950,896 |
$2,291,358 |
$2,210,600 |
$1,529,794 |
Deduction for Grant Date Fair Values of Stock Awards Granted in the Year as Reported in the “Stock Awards” column of the SCT |
2,339,746 |
2,428,302 |
2,327,705 |
2,382,878 |
1,222,404 |
613,027 |
647,238 |
618,057 |
711,288 |
348,644 |
Increase for fair value as of December 31 of each applicable year of all stock awards granted during that year that are outstanding and unvested as of such date |
3,414,897 |
2,032,615 |
2,618,488 |
4,434,765 |
457,144 |
879,322 |
553,326 |
681,623 |
1,274,104 |
130,383 |
Increase for Fair Value of Awards Granted During the Year that Vest During the Year |
- |
- |
- |
- |
- |
- |
- |
- |
- |
- |
Increase (Deduction) for change in fair value from December 31 of the prior year to December 31 of the applicable year of any awards granted in a prior year that are outstanding and unvested as of December 31 of the applicable year |
301,250 |
(58,458) |
1,058,257 |
909,106 |
(1,532,401) |
65,097 |
(9,211) |
287,388 |
257,209 |
(501,588) |
Increase (Deduction) for change in fair value from December 31 of the prior year to the vesting date of any awards granted in any prior year as to which all vesting conditions were satisfied during the applicable year |
1,296,020 |
63,304 |
98,425 |
174,504 |
(212,153) |
254,941 |
22,692 |
34,633 |
69,782 |
(101,537) |
Deduction for fair value as of December 31 of the prior year of any awards granted in any prior year as to which vesting conditions failed to be met during the applicable year |
- |
- |
- |
- |
- |
- |
- |
- |
- |
- |
Deduction for changes in the actuarial present value of accumulated pension benefits and earnings on non-qualified deferred compensation plans as reported in the “Change in Pension Value and Nonqualified Deferred Compensation Earnings” of the SCT |
42,779 |
150,460 |
- |
33,171 |
213,680 |
29,989 |
95,777 |
- |
29,156 |
166,508 |
Increase for actuarially determined service cost and prior service cost for services related to defined benefit pension plans during the applicable year |
82,197 |
73,225 |
53,200 |
60,166 |
55,827 |
54,102 |
64,756 |
50,110 |
56,263 |
54,013 |
Compensation Actually Paid |
5,769,326 |
5,097,193 |
8,160,975 |
9,101,298 |
932,265 |
2,589,125 |
1,839,444 |
2,727,056 |
3,127,514 |
595,913 |
(i)No amounts were added to reflect dividends or other earnings paid on stock awards because accrued dividends are included in the stock award fair value calculations and therefore are included in total compensation for such year.
For purposes of the foregoing, the fair value of the stock awards at all applicable dates was calculated using the same methodology (including applicable assumptions) as used to account for share-based payments in the Company’s financial statements. The assumptions used in calculating the fair value of awards at the applicable dates did not differ in any material respect from the assumptions used to calculate the grant date fair value of the
awards as reported in the Summary Compensation Table for the applicable year, except that (i) the fair value calculations of the PSUs subject to the EPS metric which were granted February 16, 2024, assumed a payout of 136%, the PSUs subject to the EPS metric which were granted February 17, 2023, assumed a payout at 65% as of December 31, 2024 and 58% as of December 31, 2023, and the PSUs subject to the EPS metric which were granted February 18, 2022, assumed a payout at 122% as of December 31, 2024, 122% as of December 31, 2023 and 165% as of December 31, 2022, respectively, and the PSUs subject to the EPS metric which were granted February 15, 2021, assumed a payout at 200% as of December 31, 2023, 2022 and 2021, respectively, the PSUs subject to the EPS metric which were granted January 2, 2020 assumed a payout at 0% as of December 31, 2022, 2021, and 2020, respectively, the PSUs subject to the EPS metric which were granted January 2, 2018 assumed a payout of 0% as of December 31, 2021 and 2020, respectively, and the PSUs subject to the EPS metric which were granted January 2, 2017 assumed a payout at 131% as of December 31, 2020, which was the probable outcome of the applicable performance conditions as of December 31, 2024, 2023, 2022, 2021 and 2020, respectively, compared to the grant date fair value calculations of such PSUs, which assumed a payout at target; (ii) the share price used to determine fair value as of December 31, 2024, 2023, 2022, 2021 and 2020 differed, in some cases materially, from the share price used to determine the grant date fair values; and (iii) for awards subject to the TSR metric, the assumptions used in the Monte Carlo calculation to determine the fair value as of December 31, 2024, 2023, 2022, 2021 and 2020 differed, in some cases materially, from the assumptions used in the Monte Carlo calculation used to determine the grant date fair values. For a discussion of the assumptions used to estimate the fair value of stock awards, please refer to the following sections of the Company’s Annual Report on Form 10-K for the year ended December 31, 2024: “Management’s Discussion and Analysis of Financial Condition and Results of Operations—Critical Accounting Policies and Estimates—Stock-Based Compensation,” and “Stock-Based Compensation” in Note 18 to the Consolidated Financial Statements.
(4)We selected the KBW Regional Banking Index (referred to herein as the “Regional Banking Index”) as our peer group for purposes of this disclosure, which index is comprised of approximately 50 companies categorized as primarily engaged in U.S. regional banking activities. The Regional Banking Index also is the same performance peer group selected by the Compensation Committee for determining the achievement of TSR targets for PSUs. See “Compensation Discussion and Analysis—Elements of Our Compensation” for additional information.
(5)Adjusted EPS is a non-GAAP financial measure. See “Appendix A—Reconciliation of Non-GAAP Financial Measures” for additional information.
Relationship between Compensation Paid and Company Performance
Total Shareholder Return
The graph below presents, for the cumulative period from January 1, 2020 – December 31, 2024, the relationship between the CAP to our CEO and the average CAP to our other NEOs and each of Company’s TSR and the TSR of the Regional Banking Index.
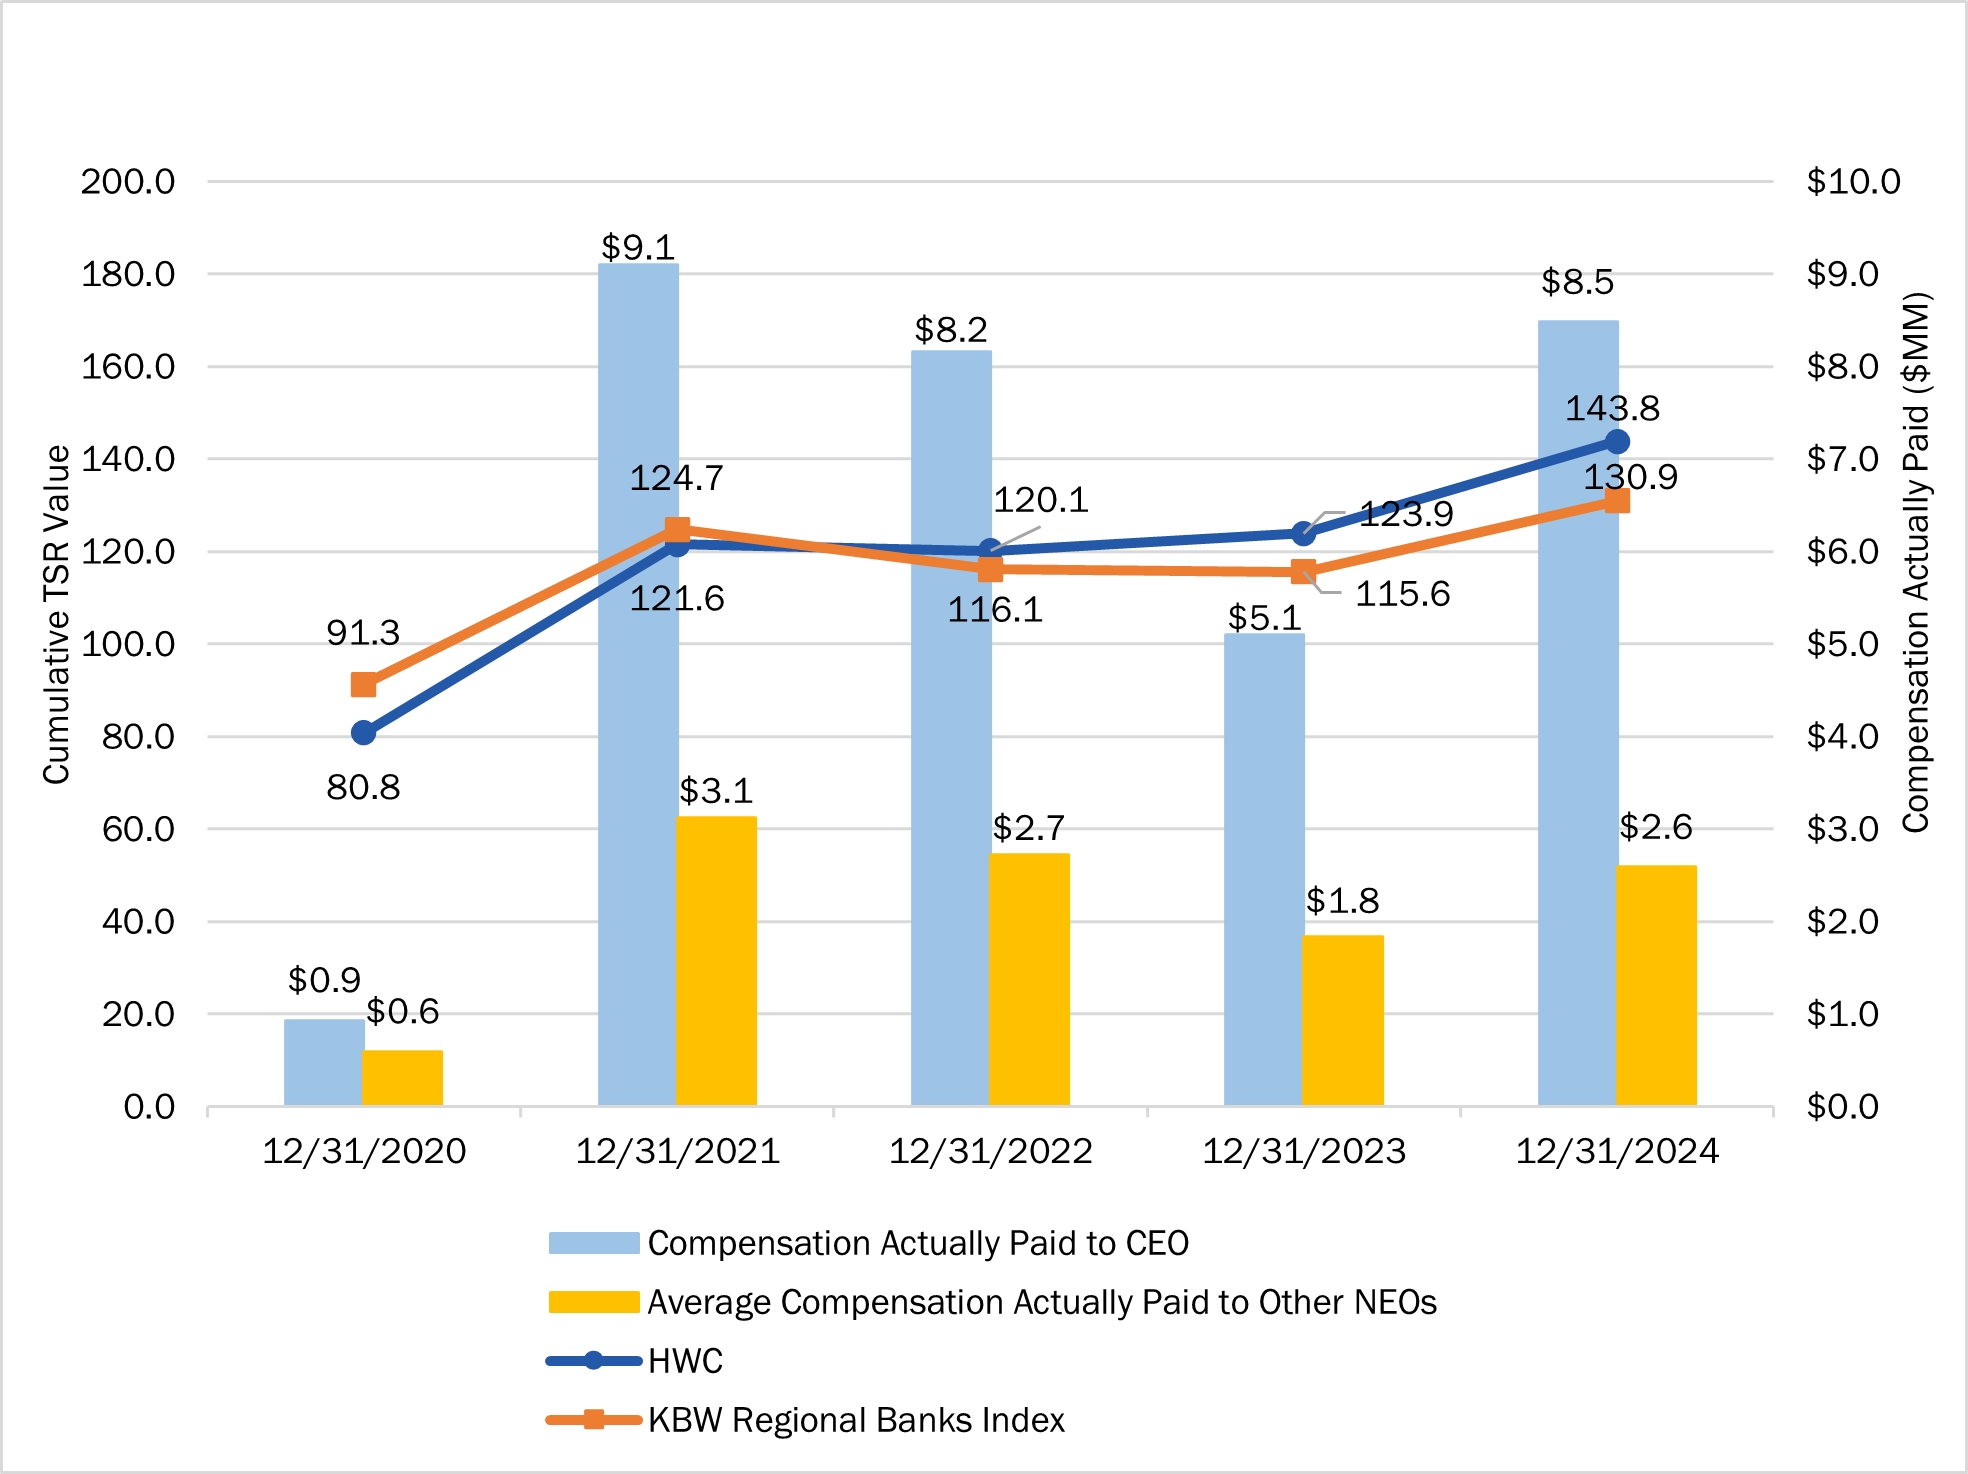
As demonstrated by the graph above, CAP to our CEO and the average CAP to our other NEOs is aligned with Company’s TSR as well as the TSR of the Regional Banking Index. Company’s TSR increased by 43.82% over the reporting period (50.54% in 2021, -1.23% in 2022, 3.18% in 2023 and 16.08% in 2024), outperforming the Regional Banking Index by 12.91% over the reporting period (13.90% in 2021, 5.70% in 2022, 3.58% in 2023 and 2.87% in 2024). During the reporting period, CAP to the CEO increased 810% in the aggregate, and average CAP to the other NEOs increased 334% in the aggregate. CAP to the CEO and to the other NEOs was highest among the reporting periods when Company achieved its highest year-end closing stock price in 2021, reflecting the high proportion of variable pay at risk for the CEO and the other NEOs. Conversely, CAP to the CEO and the other NEOs was lowest in 2020 due to the challenging market conditions and financial performance reflected in Company's lower closing stock price in 2020. 50% of the PSUs awarded in 2020, 2021, 2022 and 2023 vest based on the Company’s relative TSR performance. See “Compensation Discussion & Analysis—Elements of Our Compensation” for additional information.
Net Income
The graph below presents, for each of the years ended December 31, 2024, 2023, 2022, 2021 and 2020, the relationship between the CAP to our CEO and the average CAP to our other NEOs and the Company’s net income.
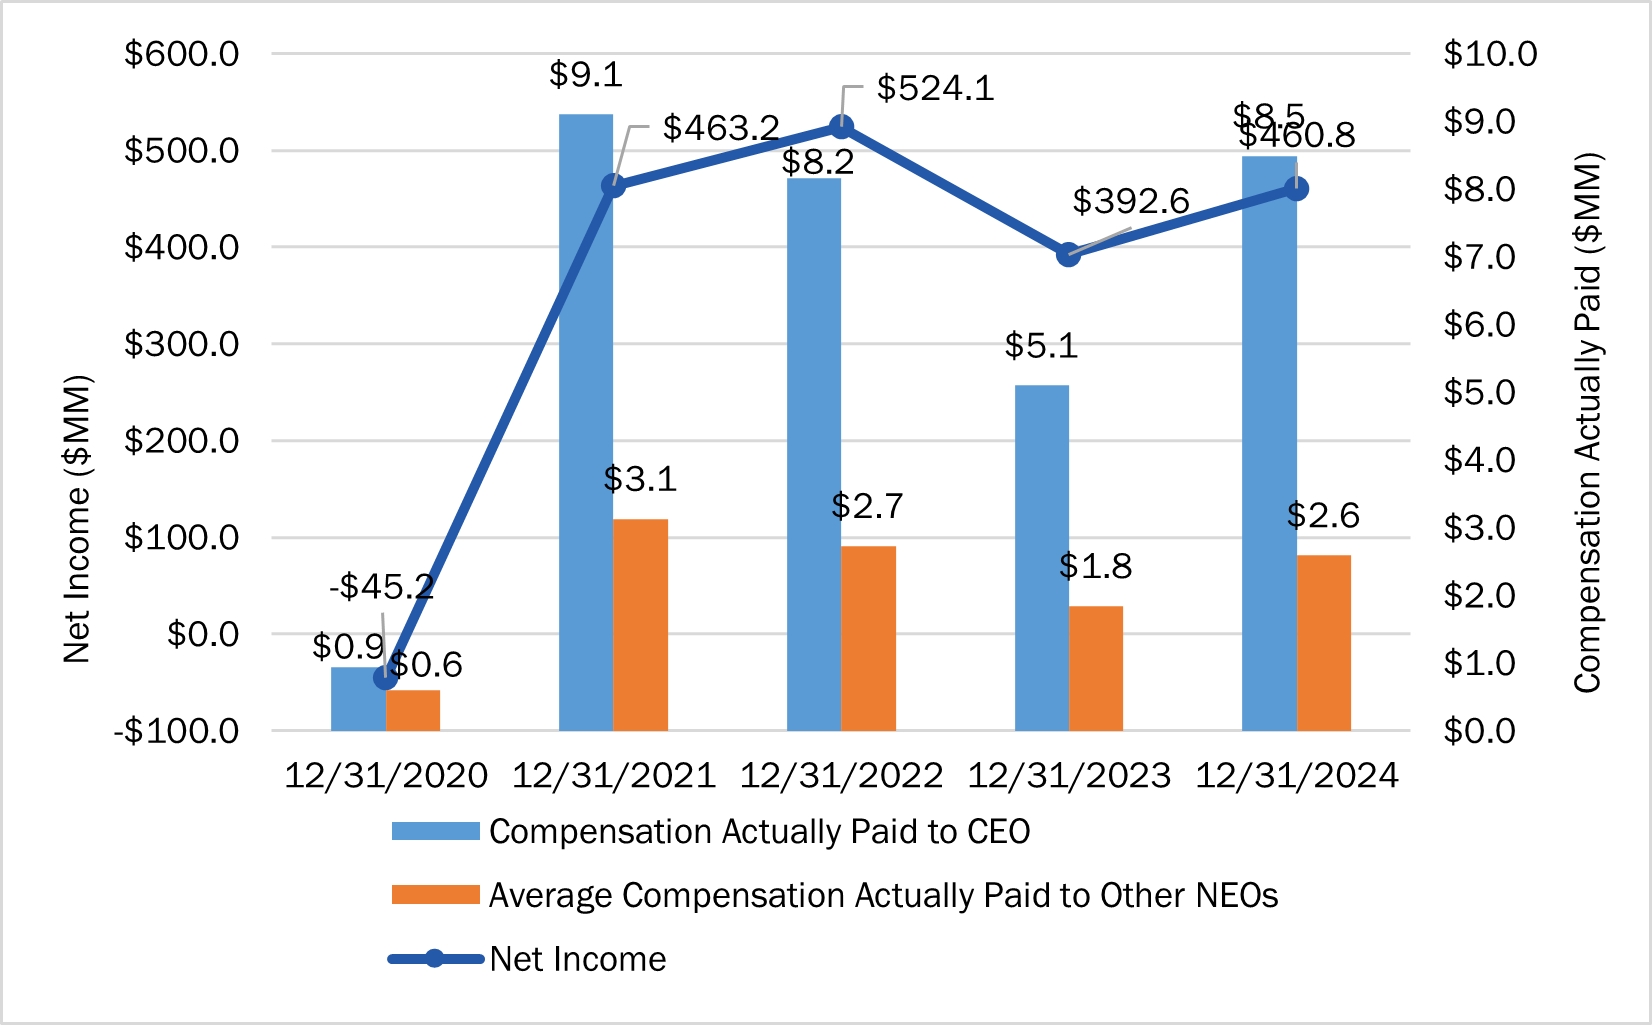
As demonstrated by the graph above, CAP to our CEO and to the other NEOs is aligned with Company’s Net Income. Net Income increased by 1,120% over the reporting period (1,125% in 2021, 13% in 2022, -25% in 2023, and 969% in 2024). During the reporting period, CAP to the CEO increased 810% in the aggregate, and average CAP to the other NEOs increased 334% in the aggregate. The Compensation Committee did not use net income as a distinct metric for purposes of determining or paying compensation during 2024, 2023, 2022, 2021 or 2020.
Adjusted EPS
The graph below presents, for each of the years ended December 31,2024, 2023, 2022, 2021 and 2020, the relationship between the CAP to our CEO and the average CAP to our other NEOs and the Company’s Adjusted EPS.
As demonstrated by the graph above, CAP to our CEO and to the other NEOs is aligned with Company’s Adjusted EPS. Adjusted EPS increased by 1,083% over the reporting period (1,124% in 2021, 8% in 2022 and 1,059% in 2023). During the reporting period, CAP to the CEO increased 810% in the aggregate, and average CAP to the other NEOs increased 334% in the aggregate. For 2024, 2023, 2022, 2021 and 2020, 50% of the annual cash incentive and 50% of the PSUs awarded were dependent on achievement of Adjusted EPS goals. See “Compensation Discussion & Analysis—Elements of Our Compensation” for additional information.
List of Most Important Financial Measures
The following table lists the most important financial performance measures used in 2024 to link CAP to our CEO and our other NEOs to Company’s performance. The financial performance measures and the non-financial performance measure are not ranked in order of importance. See “Compensation Discussion & Analysis – 2024 Compensation Structure and Design” for applicable definitions of each metric and a discussion of the application of these measures in determining the compensation of our CEO and our other NEOs.
|
|
Performance Metric |
Financial or Non-Financial |
Adjusted EPS |
Financial |
Relative TSR (1) |
Financial |
Adjusted Pre Provision Net Revenue |
Financial |
Commercial Criticized Loans to Total Commercial Loans |
Financial |
Non-Performing Loans to Total Loans |
Financial |
(1)Relative TSR for compensation purposes is calculated using the same peer group described above under “Pay Versus Performance Table.” See “Compensation Discussion and Analysis—Elements of Our Compensation” for additional information.
|
PROPOSAL NO. 2 ADVISORY VOTE ON COMPENSATION OF NAMED EXECUTIVE OFFICERS |
|
Pursuant to Section 14A of the Securities Exchange Act, as amended, we are seeking shareholder approval, on an advisory basis, of the compensation of our NEOs as disclosed in this proxy statement pursuant to SEC rules (the say-on-pay proposal). In your consideration of how to vote on this proposal, we encourage you to review all of the relevant information in this proxy statement – our Compensation Discussion and Analysis (including its executive summary), the compensation tables, and the accompanying narrative disclosures and footnotes regarding our executive compensation program. Shareholders are asked to vote, on an advisory basis, to approve the following resolution:
RESOLVED, that the compensation paid to the named executive officers as disclosed in the proxy statement for the Company’s 2025 annual meeting of shareholders pursuant to Item 402 of Regulation S-K of the rules of the Securities and Exchange Commission, including the Compensation Discussion and Analysis, compensation tables and narrative discussion, is hereby APPROVED.
We understand that executive compensation is an important matter for our shareholders. Our core executive compensation philosophy and practice continue to be based on pay for performance, and we believe that our compensation program is strongly aligned with the long-term interests of our shareholders.
While this say-on-pay proposal is advisory only and the voting results are not binding, our Compensation Committee and Board will consider the outcome of the vote when making future compensation decisions for our named executive officers.
We invite shareholders who wish to communicate with our Board on executive compensation or any other matters to contact us as provided under “Shareholder Communications” below.
THE BOARD UNANIMOUSLY RECOMMENDS A VOTE “FOR” THE APPROVAL, ON AN ADVISORY BASIS, OF THE COMPENSATION OF THE NAMED EXECUTIVE OFFICERS AS DESCRIBED IN THIS PROXY STATEMENT.
|
PROPOSAL NO. 3 APPROVAL OF AN AMENDMENT TO THE 2020 LONG TERM INCENTIVE PLAN TO INCREASE THE NUMBER OF SHARES AVAILABLE BY 1,300,000 |
|
We are asking shareholders to approve an amendment to the Hancock Whitney Corporation 2020 Long Term Incentive Plan (the 2020 Plan), which was approved by our shareholders at our 2020 annual meeting, and previously amended by the shareholders of the Company at the 2022 Annual Meeting. On February 27, 2025, the Board approved an amendment to the 2020 Plan to increase the number of shares authorized under the 2020 Plan by 1,300,000 shares, subject to shareholder approval at this annual meeting. Except for the proposed increase in the number of shares authorized under the 2020 Plan, the plan as previously approved by our shareholders in 2020 shall remain in full force and effect.
As of December 31, 2024, there were approximately 1,391,236 shares of our common stock subject to outstanding awards under the 2020 Plan. As of such date, there were approximately 1,415,499 shares of our common stock reserved and available for future awards under the 2020 Plan.
The Compensation Committee believes the number of shares available for future awards under the 2020 Plan will not be sufficient to make the grants it believes will be needed over the next few years to provide adequate long-term equity incentives to our key employees and directors. Considering our historical grant practices, we believe we have been judicious in our share usage under the 2020 Plan, and mindful of potential shareholder dilution. Approval of the amendment to the 2020 Plan will enable the Company to continue making equity compensation grants that serve as incentives to recruit and retain key employees and to continue aligning the interests of its employees with shareholders. Based on the number of requested shares to be reserved under the 2020 Plan and on our anticipated future grant cycles, we expect that the share reserve will be sufficient to cover future equity incentive awards for approximately 3 to 4 years.
A summary of the 2020 Plan is set forth below. This summary is qualified in its entirety by the full text of the 2020 Plan, which is filed as Appendix C to the Company’s proxy statement for our 2020 annual meeting. A copy of the proposed amendment increasing the number of shares authorized under the Plan by 1,300,000 shares is attached to this proxy statement as Appendix B.
Promotion of Sound Corporate Governance Practices
We designed the 2020 Plan to include a number of features that reinforce and promote alignment of equity compensation arrangements for employees, officers, and non-employee directors with the interests of shareholders and the Company. These features include, but are not limited to, the following:
|
•Awards Subject to Clawback Policy. Awards under the 2020 Plan are expressly subject to the Company’s clawback policy, which allows the Company to recover gains from awards granted under the plan if the Company’s financial statements are restated due to fraud or misconduct by an executive officer. •Minimum Vesting Requirements. Subject to certain limited exceptions, awards granted under the 2020 Plan will be subject to a minimum vesting period of one year. •No Liberal Share Counting. Shares withheld from an award to satisfy tax withholding requirements or to pay the exercise price of a stock option or stock appreciation right will not be available for future awards under the plan. •No Discounted Stock Options or Stock Appreciation Rights. Stock options and stock appreciation rights may not be granted with exercise prices lower than the fair market value of the underlying shares on the grant date. •Prohibition on Repricing. The exercise price of a stock option or stock appreciation right may not be reduced, directly or indirectly, without the prior approval of shareholders, including by a cash repurchase of “underwater” awards, except for equitable adjustments to maintain existing award values if there is a material corporate event. •No Single-Trigger Change in Control Vesting. Awards granted under the 2020 Plan do not automatically vest and pay out upon the change in control. •No Tax Gross-Ups. The 2020 Plan does not provide for any tax gross-ups. |
Key Data Relating to Outstanding Equity Awards and Shares Available
The following table includes information regarding outstanding equity awards and shares available for future awards under the 2020 Plan as of December 31, 2024 (and without giving effect to approval of the amendment to the 2020 Plan under this Proposal). [It also includes awards that remain outstanding under the Hancock Holding Company 2014 Long Term Incentive Plan (the Prior Plan) and prior equity incentive compensation plans, but no future awards may be granted thereunder].
|
|
|
Total shares underlying outstanding stock options |
0 |
|
Total shares underlying outstanding unvested time-based full value awards |
1,160,234 |
|
Total shares underlying outstanding unvested performance-based full value awards |
231,002 |
(1) |
Total shares underlying all outstanding awards |
1,391,236 |
|
Weighted average exercise price of outstanding stock options |
N/A |
|
Weighted average remaining contractual life of outstanding stock options |
N/A |
|
Total shares currently available for grant of new awards |
1,415,499 |
|
Common Stock outstanding as of December 31, 2024 |
86,123,999 |
|
Market price of Common Stock as of December 31, 2024 |
$54.72 |
|
(1) Assumes performance based awards will vest and pay out based on target performance levels being achieved.
Summary of the 2020 Plan
Purpose. The purpose of the 2020 Plan is to advance the interests of the Company and its shareholders and to promote the growth and profitability of the Company by providing associates and directors of the Company and its subsidiaries a means to acquire a proprietary interest in the Company, as well as to provide incentives to such associates and directors to reward and encourage their efforts in promoting the long-term growth and profitability of the Company. Further, the plan provides a means for the Company to obtain and retain qualified associates and directors in a competitive market, which is crucial to the Company’s continued growth and profitability.
Administration. The 2020 Plan is administered by the Compensation Committee of the Company’s Board of Directors (the Committee for purposes of this Proposal No. 3). The Committee is composed solely of “non-employee directors” within the meaning of Rule 16b-3 under the Exchange Act and directors who meet the independence requirements of the NASDAQ Stock Market listing standards.
The Committee has the power, in its discretion, to grant incentive awards under the 2020 Plan, to select the individuals to whom incentive awards are granted, to determine the number of shares of common stock subject to each incentive award and the terms of the grants, to interpret the provisions of the plan and to otherwise administer the plan. The Committee may delegate all or any of its responsibilities and powers under the 2020 Plan to individual officers or associates of the Company or a subsidiary, except its authority or responsibility with regard to awards to persons subject to Section 16 of the Exchange Act.
Eligibility. Any associate or non-employee director of the Company or any of its subsidiaries selected by the Committee, or selected by management and approved by the Committee, is eligible to receive incentive awards under the 2020 Plan. However, incentive stock options, within the meaning of Internal Revenue Code Section 422, may only be granted to associates of the Company or its subsidiaries. As of December 31, 2024, approximately 624 employees and 14 non-employee directors would be eligible to receive awards under the 2020 Plan.
Permissible Awards. The 2020 Plan authorizes the granting of awards in any of the following forms:
|
|
• |
market-priced options to purchase shares of our common stock, which may be designated under the Internal Revenue Code of 1986, as amended from time to time (the Code), as nonstatutory stock options (which may be granted to all participants) or incentive stock options (which may be granted to officers and employees, but not to non-employee directors), |
• |
stock appreciation rights, which give the holder the right to receive the difference (payable in cash or stock, as specified in the award certificate) between the fair market value per share of our common stock on the date of exercise over the base price of the award (which cannot be less than the fair market value of the underlying stock as of the grant date), |
• |
restricted stock, which is subject to restrictions on transferability and subject to forfeiture on terms set by the Committee, |
• |
restricted stock units, which represent the right to receive shares of common stock (or an equivalent value in cash or other property as specified in the award certificate) at a designated time in the future and subject to any vesting requirement as may be set by the Committee, |
• |
performance stock awards and performance units, which represent the right to receive payment of a number of shares of common stock or an amount in cash equal to the value of a specified number of shares of common stock, based on achievement of specified performance goals during a specified performance period, as established by the Committee, and |
• |
other stock-based awards that are payable or valued, in whole or in part, by reference to, or otherwise based on, shares of common stock, or other rights or securities that are convertible or exchangeable into shares of common stock, and cash awards, on such terms and conditions as the Committee determines. |
Shares Available for Awards. The total number of shares of common stock authorized for issuance under the 2020 Plan would be 5,200,000 shares, which consists of (i) 1,300,000 new shares subject to shareholder approval pursuant to this Proposal No. 3, and (ii) 3,900,000 previously approved and authorized under the 2020 Plan, plus a number of additional shares (not to exceed 1,000,000) underlying awards outstanding as of the effective date of the 2020 Plan under the Prior Plan that thereafter terminate or expire unexercised, or are cancelled, forfeited or lapse for any reason. All or any portion of such authorized shares may be issued pursuant to grants of incentive stock options or pursuant to any one or more other types of incentive award under the plan. Such shares of common stock may be either authorized but unissued shares, treasury shares or shares acquired on the open market.
For purposes of determining the number of shares of our common stock available for grants of incentive awards under the 2020 Plan, shares that are not delivered because an award expires, is forfeited, cancelled, or settled in cash will not count against the aggregate share limit and will again be available for grants under the plan. If shares are withheld to satisfy the exercise price of an option or the tax withholding obligation associated with any incentive award, those withheld shares will be counted against the aggregate share limit and will not be available for reissuance under the plan. With respect to stock appreciation rights paid in shares, all shares to which the stock appreciation rights relate are counted against the plan limits rather than the net number of shares delivered upon exercise.
Limitations on Awards. The aggregate number of shares for which awards may be granted during any plan year (i.e., calendar year) to any one participant may not exceed 250,000 shares. The aggregate fair market value of stock for which options intended to be incentive stock options become exercisable for the first time by an individual in any calendar year may not exceed $100,000, provided if such limitation is exceeded, the options above this limit shall be treated as non-qualified stock options.
Limitation of Non-Employee Director Compensation. With respect to any one Plan Year, the aggregate compensation that may be granted or awarded to any one non-employee director, including all meeting fees, cash retainers and retainers granted in the form of incentive awards, shall not exceed $300,000, or $400,000 in the case of a non-employee Chairman of the Board or Lead Director.
Minimum Vesting Requirements. Except in the case of substitute awards granted in a business combination, awards granted under the 2020 Plan will be subject to a minimum vesting period of one year. Notwithstanding the foregoing, the Committee may grant awards without the minimum vesting requirements described above with respect to awards covering 5% or fewer of the total number of shares authorized under the 2020 Plan.
Treatment of Awards upon a Change in Control. Under the 2020 Plan, in the event of a change in control, the Committee may provide for any of the following to occur with respect to an incentive award: (i) automatic maximization of all performance standards, lapse of all restrictions and acceleration of vesting; (ii) performance stock awards to be paid entirely in cash; (iii) with respect to outstanding options, a three-month period following termination of employment in which to exercise such option; and (iv) the award becomes non-cancelable. For purposes of the 2020 Plan, a change in control event includes, but is not limited to, certain acquisitions of fifty percent (50%) or more of the Company’s outstanding common stock, certain changes in the identity of a majority of the members of the Board of Directors and the acquisition of more than fifty percent (50%) of the Company’s assets.
Adjustments. The number and kind of shares of common stock available for issuance under the 2020 Plan (including under any awards then outstanding), the number and kind of shares subject to the individual limits set forth in the 2020 Plan, and the terms of any outstanding award, including the exercise price of any outstanding option, will be equitably adjusted by the Committee as it determines appropriate to reflect any merger, reorganization, consolidation, recapitalization, reclassification, stock split, reverse stock split, spin-off combination or exchange of shares, dividend or distribution of securities, or any other event or transaction that affects the number or kind of outstanding shares of the Company.
Amendment and Termination of the 2020 Plan. The Board of Directors may at any time terminate, or from time to time amend, the 2020 Plan, or alter any award certificate or other document evidencing an award. However, no such amendment or termination may be made without first obtaining shareholder approval if such amendment or termination would: (i) increase the maximum number of shares that may be issued under the 2020 Plan or to any one individual (except to the extent such amendment is made pursuant to a change in the Company’s capitalization), (ii) materially expand the classes of individuals eligible to receive awards under the 2020 Plan, (iii) reduce the price at which options and SARs may be granted, (iv) reduce the exercise price of outstanding options and SARs, or (v) otherwise require shareholder approval pursuant to the 2020 Plan, applicable law, or the NASDAQ Stock Market.
No termination of the 2020 Plan or amendment to the 2020 Plan or an award thereunder may be made which would adversely affect any rights or obligations with respect to any awards granted prior to the date of such termination or amendment, without the consent of the holder of such award.
Prohibition on Repricing. Outstanding stock options and stock appreciation rights cannot be repriced, directly or indirectly, without the prior consent of the Company’s shareholders, except for equitable adjustments to maintain existing award values if there is a material corporate event. In addition, the Company may not, without the prior approval of shareholders, repurchase an option or stock appreciation right for value from a participant if the current market value of the underlying stock is lower than the exercise price per share of the option or stock appreciation right.
Limitations on Transfer. Awards granted under the 2020 Plan generally may not be sold, transferred, pledged, assigned, or otherwise alienated or hypothecated by a participant other than by will or the laws of descent and distribution, and may be exercisable only by the participant during his or her lifetime or, in the event of the disability of a participant, by his or her legal representative.
Clawback Policy. All awards made to executive officers of the Company under the 2020 Plan are subject to the Company’s Clawback Policy under which all or a portion of the award, plus any gains realized thereon, may be recovered if the financial statements of the Company are restated due to fraud or dishonesty by one or more of the Company’s executive officers.
Federal Income Tax Consequences
The U.S. federal income tax discussion set forth below is intended for general information only and does not purport to be a complete analysis of all of the potential tax effects of the 2020 Plan. It is based upon laws, regulations, rulings, and decisions now in effect, all of which are subject to change. State, local and non-U.S. income tax consequences are not discussed and may vary from jurisdiction to jurisdiction.
Nonqualified Stock Options. There will be no federal income tax consequences to the optionee or to the Company upon the grant of a nonqualified stock option under the 2020 Plan. When the optionee exercises a nonqualified option, however, he or she will recognize ordinary income in an amount equal to the excess of the fair market value of the stock received upon exercise of the option at the time of exercise over the exercise price and the Company will be allowed a corresponding federal income tax deduction. Any gain that the optionee realizes when he or she later sells or disposes of the option shares will be short-term or long-term capital gain depending on how long the shares were held.
Incentive Stock Options. There will be no federal income tax consequences to the optionee or to the Company upon the grant of an incentive stock option. If the optionee holds the option shares for the required holding period of at least two years after the date the option was granted and one year after exercise, the difference between the exercise price and the amount realized upon sale or disposition of the option shares will be long-term capital gain or loss and the Company will not be entitled to a federal income tax deduction. If the optionee disposes of the option shares in a sale, exchange, or other disqualifying disposition before the required holding period ends, he or she will recognize taxable ordinary income in an amount equal to the excess of the fair market value of the option shares at the time of exercise over the exercise price and the Company will be allowed a federal income tax deduction equal to such amount. While the exercise of an incentive stock option does not result in current taxable income, the excess of the fair market value of the option shares at the time of exercise over the exercise price will be an item of adjustment for purposes of determining the optionee’s alternative minimum taxable income.
Stock Appreciation Rights. A participant receiving a stock appreciation right under the 2020 Plan will not recognize income, and the Company will not be allowed a tax deduction, at the time the award is granted. When the participant exercises the stock appreciation right, the amount of cash and the fair market value of any shares of stock received will be ordinary income to the participant and the Company will be allowed a corresponding federal income tax deduction at that time.
Restricted Stock. Unless a participant makes an election to accelerate recognition of the income to the date of grant as described below, a participant will not recognize income, and the Company will not be allowed a tax deduction, at the time a restricted stock award is granted, provided the award is nontransferable and is subject to a substantial risk of forfeiture. When the restrictions lapse, the participant will recognize ordinary income equal to the fair market value of the stock as of that date (less any amount he or she paid for the stock) and the Company will be allowed a corresponding federal income tax deduction at that time, subject to any applicable limitations under Code Section 162(m). If the participant files an election under Code Section 83(b) within 30 days after the date of grant of the restricted stock, he or she will recognize ordinary income as of the date of grant equal to the fair market value of the stock as of that date (less any amount paid for the stock) and the Company will be allowed a corresponding federal income tax deduction at that time, subject to any applicable limitations under Code Section 162(m). Any future appreciation in the stock will be taxable to the participant at capital gains rates. However, if the stock is later forfeited, the participant will not be able to recover the tax previously paid pursuant to the Code Section 83(b) election.
Stock Units. A participant will not recognize income, and the Company will not be allowed a tax deduction, at the time a stock unit award is granted. Upon receipt of shares of stock (or the equivalent value in cash or other property) in settlement of a stock unit award, a participant will recognize ordinary income equal to the fair market value of the stock or other property as of that date (less any amount he or she paid for the stock or property) and the Company will be allowed a corresponding federal income tax deduction at that time, subject to any applicable limitations under Code Section 162(m).
Performance Awards. A participant will not recognize income, and the Company will not be allowed a tax deduction, at the time a performance award is granted (e.g. when the performance goals are established). Upon receipt of cash, stock, or other property in settlement of a performance award, the participant will recognize ordinary income equal to the value of the cash, stock, or other property received and the Company will be allowed a corresponding federal income tax deduction at that time, subject to any applicable limitations under Code Section 162(m).
Code Section 409A. The 2020 Plan permits the grant of various types of incentive awards, which may or may not be exempt from Code Section 409A. If an award is subject to Code Section 409A, and if the requirements of Section 409A are not met, the taxable events as described above could apply earlier than described and could result in the imposition of additional taxes and penalties. Restricted stock awards, and stock options and stock appreciation rights that comply with the terms of the 2020 Plan, are designed to be exempt from the application of Code Section 409A. Restricted stock units and performance awards granted under the 2020 Plan would be subject to Code Section 409A unless they are designed to satisfy the short-term deferral exemption from such law. If not exempt, such awards must be specially designed to meet the requirements of Code Section 409A in order to avoid early taxation and penalties.
Tax Withholding. The Company has the right to deduct or withhold, or require a participant to remit to the Company, an amount sufficient to satisfy federal, state, and local taxes (including employment taxes) required by law to be withheld with respect to any exercise, lapse of restriction, or other taxable event arising as a result of the 2020 Plan.
Benefits to Named Executive Officers and Others
Future Awards under the 2020 Plan are granted at the discretion of the Compensation Committee and therefore are not determinable. The following table sets forth the number of stock option, restricted stock, restricted stock unit, performance stock and performance stock unit awards that have been granted under the 2020 Plan to our NEOs and the other individuals and groups indicated, as of December 31, 2024.
|
|
|
|
Name and Position |
Stock Options |
Restricted Stock and Restricted Stock Units |
Performance Stock and Performance Stock Units (1) |
John M. Hairston,
President and CEO |
0 |
66,961 |
312,484 |
Michael M. Achary,
Chief Financial Officer |
0 |
26,148 |
78,440 |
D. Shane Loper,
Chief Operating Officer |
0 |
31,620 |
94,860 |
Christopher S. Ziluca
Chief Credit Officer |
0 |
18,083 |
54,252 |
Michael Otero
Chief Risk Officer |
0 |
8,972 |
26,912 |
All Current Executive Officers
as a Group |
0 |
13,199 |
24,604 |
All Associates as a Group
(including Officers who are not Executive Officers) |
0 |
2,279,092 |
158,848 |
All Non-Executive Directors
as a Group |
0 |
90,760 |
0 |
(1) The maximum number of performance shares that could vest is represented in this table as 200% of the target award.
The following table provides information as of December 31, 2024 with respect to shares of common stock that may be issued under the Company's equity compensation plans.
|
|
|
|
|
|
EQUITY COMPENSATION PLAN INFORMATION |
|
Number of Securities
to be issued Upon
Exercise of Outstanding
Options, Warrants and Rights |
Weighted-Average
Exercise Price of
Outstanding
Options, Warrants
and Rights |
Number of Securities Remaining
Available for Future Issuance
Under Equity Compensation
Plans (Excluding Securities
Reflected in Column (a)) |
Plan Category |
(a) |
|
(b) |
|
(c) |
Equity compensation plans
approved by security holders |
1,510,274 |
(1) |
― |
|
1,415,499 |
Equity compensation plans not
approved by security holders |
― |
|
― |
|
― |
Total |
1,510,274 |
|
0 |
|
1,415,499 |
(1)Includes 58,006 shares potentially issuable upon the vesting of outstanding restricted share units and 56,084 shares potentially issuable upon the vesting of outstanding performance share units that represent awards deferred into the Company’s Nonqualified Deferred Compensation Plan. Also includes 405,920 performance share awards. Performance share awards and units are stated in amounts that would be issuable if the highest level of performance conditions are met.
THE BOARD UNANIMOUSLY RECOMMENDS A VOTE "FOR" THE APPROVAL OF THE
AMENDMENT TO THE HANCOCK WHTINEY CORPORATION 2020 LONG TERM INCENTIVE PLAN.
|
TRANSACTIONS WITH RELATED PERSONS |
The Company, through the Bank, has made, and expects to make in the future, loans in the ordinary course of business to insiders of the Company and the Bank, and their related interests. The Bank has made such loans on substantially the same terms, including interest rates and collateral, as those prevailing at the time for comparable transactions with persons not related to the Company. At the time made, no such loans involved more than the normal risk of repayment or presented other unfavorable features that require disclosure in the proxy statement.
Our Corporate Governance Guidelines require that we review all transactions that may be required to be disclosed pursuant to Item 404 of SEC Regulation S-K (Related Party Transactions) for potential conflicts of interest. Generally, the Audit Committee will be responsible for reviewing and approving all Related Party Transactions.
The Company provides limited brokerage services, investment advisory services and provides access to annuities and insurance products through its subsidiary Hancock Whitney Investment Services, Inc. (HWIS). It conducts virtually all of its other business activities through the Bank, or through the Bank’s subsidiaries, and those business activities primarily consist of offering deposit accounts, making loans, and engaging in trust business. While Section 402 of the Sarbanes-Oxley Act of 2002 generally prohibits a public company from extending or renewing credit or arranging the extension or renewal of credit to an officer or director, this prohibition does not apply to loans that are subject to the insider lending restrictions of the Federal Reserve Board’s Regulation O. Accordingly, we permit our directors and executive officers, their family members and their related interests, to establish and maintain banking and business relationships in the ordinary course of business with the Bank and HWIS, subject to the restrictions of Regulation O. With respect to lending activities, the Bank has a special written policy governing affiliate and insider lending transactions.
In order to promote compliance with applicable laws, regulations and rules pertaining to insider lending transactions discussed above, the Company has appointed an officer (the Regulation O Monitoring Officer) to assist Bank associates in identifying and reviewing pertinent transactions with identified insiders. The Regulation O Monitoring Officer annually receives lists of all directors and executive officers of the Company and the Bank from our Corporate Secretary, as well as a list of our principal shareholders, if any. The information collected from directors and designated executive officers includes the names of these individuals and their family members, as well as the names of their related interests. This information is compiled based on questionnaires our directors and designated executive officers submit to the Corporate Secretary. Information available from public databases and the Bank’s records supplement the data. The Bank’s Regulation O Monitoring Officer directly compiles information regarding other insiders designated by the Board of Directors as subject to Regulation O, their family members and related interests. The Bank’s officers managing proposed extensions of credit to insiders are responsible for confirming that the proposed extensions of credit comply with the Bank’s policies on insider transactions. The Regulation O Monitoring Officer will promptly notify our Corporate Secretary in the event the Regulation O Monitoring Officer detects an extension of credit to an insider that appears to violate the policy.
The Corporate Secretary follows procedures to help us determine at the end of each year whether any insider relationship or transaction has occurred that must be disclosed pursuant to the SEC’s rules regarding Related Party Transactions or that might impair a non-employee director’s independence under SEC rules or NASDAQ listing rules. These procedures include annual director and executive officer questionnaires, a survey of client databases of the Company and its subsidiaries, as well as a review of other records, including accounts payable, payroll and real estate transaction records. The Corporate Secretary reports any insider transactions so discovered to the Audit Committee for review, approval or ratification and reports other matters that would disqualify a non-employee director from meeting NASDAQ or SEC independence requirements to the Board.
To further raise awareness regarding, and to ensure the proper handling of, insider transactions, we have adopted various codes of conduct, including the Code of Business Ethics for Officers and Associates, the Code of Ethics for Financial Officers, and the Code of Ethics for Directors. These codes, which are available on the Governance Documents page of the Investor Relations website at investors.hancockwhitney.com, promote the ethical handling of actual or apparent conflicts of interest between personal and professional relationships, and encourage covered persons to seek advice to avoid conflicts of interest. Associates are also prohibited from handling any client relationship involving themselves, their relatives or affiliated businesses. Our Audit Committee is responsible for applying and interpreting the codes pertaining to senior financial officers, executive officers and directors, and shall report any violations to the Board for further action.
|
INDEPENDENT REGISTERED PUBLIC ACCOUNTING FIRM |
Pre-Approval Policies and Procedures
The Company’s Audit Committee selected PricewaterhouseCoopers LLP (PwC) as the Company’s independent registered public accounting firm to audit the consolidated financial statements of the Company and its subsidiaries for 2024. As part of its role in overseeing the independent registered public accounting firm, the Audit Committee has adopted policies and procedures to pre-approve all audit and permissible non-audit services performed by the independent registered public accounting firm. The policy requires that on an annual basis the Audit Committee pre-approve the general engagement of the independent registered public accounting firm to provide defined audit, audit-related and possible tax services within pre-approved fee levels. Unless otherwise provided, such pre-approvals shall remain in effect for 12 months. The Audit Committee may revise the list of generally pre-approved services from time to time. The Audit Committee may also grant general pre-approval for other permissible non-audit services classified as all other services, provided that such services would not impair the independent registered public accounting firm’s independence. Pre-approval may be granted by action of the full Audit Committee or, in the absence of such action, the Audit Committee Chair or the Audit Committee Chair's designee may pre-approve individual engagements up to a limit of $100,000. Any pre-approval granted by less than the full Audit Committee must be reported to the full Audit Committee at its next scheduled meeting. The Audit Committee will consult the SEC’s rules and relevant guidance in applying this policy. During 2024, the Audit Committee pre-approved all services provided by PwC.
Fees and Related Disclosures for Accounting Services
The Audit Committee pre-approved all professional services provided by PwC and the related fees in 2024 and 2023. The following table discloses the fees for professional services provided by PwC in each of the last two fiscal years to the Company and its subsidiaries:
|
|
|
|
|
2024 |
|
2023 |
Audit Fees(1) |
$2,169,000 |
|
$2,195,800 |
Audit-Related Fees (2) |
61,000 |
|
58,000 |
Tax Fees (3) |
- |
|
- |
All Other Fees (4) |
1,000 |
|
1,000 |
Total |
$2,231,000 |
|
$2,254,800 |
(1)Relates to services rendered in connection with the audits of the consolidated financial statements of the Company, reviews of the quarterly consolidated financial statements of the Company, the audit of the design and operating effectiveness of internal control over financial reporting in compliance with Section 404 of the Sarbanes-Oxley Act of 2002 and the Federal Deposit Insurance Corporation Improvement Act, and audits of the Company subsidiaries.
(2)Relates to services rendered in connection with assurance services for compliance reporting, registration statements, consents and comfort letters.
(3)No tax fees were incurred during 2024 or 2023.
(4)Relates to permissible advisory services.
The Audit Committee assists the Board in monitoring the Company’s accounting and financial reporting processes and has a key role in the oversight and supervision of PricewaterhouseCoopers LLP (PwC), the Company’s independent registered public accounting firm. The Audit Committee’s role includes sole authority to: (1) appoint or replace the Company’s independent registered public accounting firm; (2) pre-approve all audit or permissible non-audit services that the Company’s independent registered public accounting firm performs on behalf of the Company; and (3) approve compensation related to all auditing services and any permissible non-audit services. The Audit Committee monitors management’s evaluation of the effectiveness of internal control over financial reporting and retains and monitors the activities of PwC. The Audit Committee also oversees the Company’s procedures for the receipt, retention and treatment of complaints the Company receives regarding accounting, internal accounting controls or auditing matters. For greater detail regarding the functions and responsibilities of the Audit Committee, please refer to the Audit Committee Charter, which is available on the Company’s Investor Relations website at investors.hancockwhitney.com under Corporate Overview – Committee Charting. The Audit Committee reviews and reassesses the adequacy of the Audit Committee charter on an annual basis. The Audit Committee is in compliance with the Audit Committee Charter.
Management has the primary responsibility for the financial statements and reporting processes, including the system of internal control over financial reporting. In fulfilling its oversight responsibilities for 2024, the Audit Committee reviewed and discussed with management the audited financial statements as of and for the year ended December 31, 2024. Management has represented to the Audit Committee that the financial statements were prepared in accordance with accounting principles generally accepted in the United States of America (GAAP).
The Audit Committee reviewed the audited financial statements with the independent registered public accounting firm who is responsible for expressing an opinion on the conformity of those statements with GAAP and discussed with the independent registered public accounting firm the matters required to be communicated by the Public Company Accounting Oversight Board (PCAOB) and the SEC. The Audit Committee has also received the written disclosures and letter required by the applicable requirements of the PCAOB regarding the independent registered public accounting firm’s communications with the Audit Committee concerning independence, and has discussed with the independent registered public accounting firm their independence and considered the compatibility of non-audit services with the independent registered public accounting firm’s independence.
The Audit Committee discussed with the Company’s internal auditors and the independent registered public accounting firm the overall scope and plans for their respective audits. The Audit Committee met with the internal auditors and the independent registered public accounting firm to discuss the results of audits, evaluations of the Company’s system of internal control over financial reporting, and the overall quality of the Company’s financial reporting. Both the internal auditors and the independent registered public accounting firm have unrestricted access to the Audit Committee. The Audit Committee held one executive session with its independent accountants in 2024 and held three executive sessions with the Chief Internal Auditor in 2024.
In reliance on the reviews and discussions referred to above, the Audit Committee recommended to the Board that the audited consolidated financial statements for the year ended December 31, 2024 be included in the Annual Report on Form 10-K for filing with the SEC. The Audit Committee has selected PwC as the Company’s independent registered public accounting firm for 2025, subject to ratification by a majority of the shares represented at the annual meeting.
Audit Committee of the Board of Directors,
Christine L. Pickering, Chair
Sonya C. Little, Vice Chair
Moses H. Feagin
Hardy B. Fowler
Jerry L. Levens
|
PROPOSAL NO. 4 RATIFICATION OF SELECTION OF INDEPENDENT REGISTERED PUBLIC ACCOUNTING FIRM |
The Audit Committee is directly responsible for the appointment, compensation, retention and oversight of the independent registered public accounting firm retained to audit the Company’s consolidated financial statements and to attest to the effectiveness of the Company’s internal control over financial reporting. The Audit Committee has selected PricewaterhouseCoopers LLP (PwC) as the Company’s independent registered public accounting firm for the fiscal year ending December 31, 2025, and until their successors are selected. PwC has served continuously as the Company’s auditor since 2009. PwC is a registered public accounting firm with the PCAOB, as required by the Sarbanes-Oxley Act of 2002 and the rules of the PCAOB.
The Audit Committee recognizes the importance of maintaining the independence of the Company’s independent auditor, both in fact and appearance. In order to ensure continuing auditor independence, the Audit Committee periodically considers whether there should be a regular rotation of the independent auditor. In addition, the Audit Committee recognizes that restrictions exist as to the hiring of any current or former partner, principal, shareholder or professional employee of its independent auditor and has reasonable measures in place to ensure any such potential candidates are reviewed prior to hiring for compliance with such restrictions. The Audit Committee also requires the lead PwC partner assigned to the Company’s audit to be rotated at least every five years. The Audit Committee and its chairperson are directly involved in the selection of the new lead partner.
Each year, the Audit Committee evaluates the qualifications, performance and independence of the Company’s independent auditor and determines whether to re-engage the current independent auditor for the following year. In doing so, the Audit Committee considers, among other things: (i) external data relating to audit quality and performance, including recent PCAOB reports on PwC and its peer firms; (ii) PwC’s tenure as our independent auditor and its familiarity with our operations and business, accounting policies and practices and internal control over financial reporting; (iii) the quality and efficiency of the services provided by the auditors, the auditors’ capabilities and expertise; (iv) whether the firm or any of its partners has any direct or any material indirect financial interest in the securities of the Company or any of its subsidiaries, except as auditors and consultants on accounting procedures and tax matters; and (v) PwC’s independence. Based on this evaluation, the members of the Audit Committee and the Company’s Board believe that the continued retention of PwC in 2025 is in the best interests of the Company and its shareholders.
The Board anticipates that representatives of PwC will be in attendance at the annual meeting and will be available to respond to questions.
Although not required to do so, the Company’s Board has chosen to submit its selection of PwC for ratification by the Company’s shareholders. It is the intention of the persons named in the proxy to vote such proxy FOR the ratification of this selection. If this proposal does not pass, the Audit Committee will reconsider the selection. The proposal will be ratified if the votes cast favoring the appointment exceed the votes cast opposing it. Even if the selection is ratified, the Audit Committee, in its discretion, may select a different independent registered public accounting firm at any time during the year if it determines that such a change would be in the best interests of the Company and our shareholders.
THE BOARD UNANIMOUSLY RECOMMENDS A VOTE “FOR” THE RATIFICATION OF THE
SELECTION OF PRICEWATERHOUSECOOPERS LLP AS OUR INDEPENDENT REGISTERED
PUBLIC ACCOUNTING FIRM FOR 2025.
|
SHAREHOLDER COMMUNICATIONS |
The Board provides a process for shareholders to send communications to the Board or to individual directors. Information regarding this process is set out in the Corporate Governance Guidelines, which are available to shareholders on the Governance Documents page of the Investor Relations section of our website at investors.hancockwhitney.com.
We do not know of any matters to be presented at our 2025 annual meeting other than those set forth in the accompanying notice. However, if any other matters properly come before the annual meeting or any adjournments or postponements thereof, the proxy holders will vote or abstain from voting thereon in accordance with their best judgment.
|
SHAREHOLDER PROPOSALS FOR THE 2026 ANNUAL MEETING |
SEC Rule 14a-8 If you are a shareholder who would like us to include your proposal in our notice of the 2026 annual meeting and related proxy materials, you must follow SEC Rule 14a-8. In submitting your proposal, our Corporate Secretary must receive your proposal, in writing, at our principal executive offices, no later than November 11, 2025. If you do not follow Rule 14a-8, we will not consider your proposal for inclusion in next year’s proxy statement.
Advance notice procedures Under our Bylaws, a shareholder who wishes to nominate an individual for election to the Board of Directors directly at an annual meeting, or to propose any business to be considered at an annual meeting, must deliver advance notice of such nomination or business to the Company. The shareholder must be a shareholder as of the date the notice is delivered and at the time of the annual meeting and must be entitled to vote at the meeting. The notice must be in writing and contain the information specified in our Bylaws for a director nomination or other business as well as the information required by Rule 14a-19 under the Exchange Act, if applicable. Director nominations must also include the related questionnaire and agreement specified in our Bylaws. If you would like to receive a printed copy of our Bylaws at no cost you may request these by contacting Ms. Juanita P. Kuhner, Corporate Secretary, Hancock Whitney Corporation, Hancock Whitney Plaza, 2510 14th Street, Gulfport, MS 39501 or at P.O. Box 4019, Gulfport, MS 39502.
Based on this year’s annual meeting date, to be timely, the written notice must be delivered not earlier than December 24, 2025 (the 120th day prior to the first anniversary of this year’s annual meeting) and not later than January 23, 2026 (the 90th day prior to the first anniversary of this year’s annual meeting) to the Corporate Secretary at our principal executive offices by mail or overnight delivery service.
These advance notice procedures are separate from the procedures you must follow to submit a director nominee for consideration by the Corporate Governance Committee for recommendation to the Board for election as described under Board of Directors and Corporate Governance — Board Committees — Corporate Governance and Nominating Committee – Identification of New Directors and from the SEC’s requirements that a shareholder must meet in order to have a shareholder proposal included in our proxy statement pursuant to SEC Rule 14a-8 referred to above.
The proxies we appoint for the 2025 annual meeting may exercise their discretionary authority to vote on any shareholder proposal timely received and presented at the meeting. Our proxy statement must advise shareholders of the proposal and how our proxies intend to vote. A shareholder may mail a separate proxy statement to our shareholders, and satisfy certain other requirements, to remove discretionary voting authority from our proxies.
At the annual meeting, the Chairperson or other officer presiding will determine whether any nomination or other business proposed to be brought before the annual meeting was made or proposed in accordance with our Bylaws and shall have the authority to declare that a defective proposal or nomination be disregarded.
Please direct any questions about the requirements or notices in this section by writing to Ms. Juanita P. Kuhner, Corporate Secretary, Hancock Whitney Corporation, Hancock Whitney Plaza, 2510 14th Street, Gulfport, MS 39501 or at P.O. Box 4019, Gulfport, MS 39502.
By Order of the Board of Directors.
|
|
|

|
|

|
Jerry L. Levens |
|
John M. Hairston |
Chairman of the Board |
|
President and CEO |
|
|
|
Dated: March 11, 2025 |
|
|
|
APPENDIX A: RECONCILIATION OF NON-GAAP FINANCIAL MEASURES |
Adjusted Pre-Provision Net Revenue, Adjusted Earnings and Earnings per diluted share (Adjusted EPS), Adjusted Revenue, Adjusted Noninterest Expense, and Efficiency Ratio are non-GAAP financial measures that exclude certain income or expense items highlighted as supplemental disclosures. Supplemental disclosure items are certain items that are outside of our principal business and/or those that are not indicative of forward-looking trends. Adjusted Pre-Provision Net Revenue and Adjusted Revenue are also presented on a taxable equivalent (te) basis to adjust for the tax-favored status of net interest income from certain loans and investments using the statutory federal tax rate; a preferred industry method that enhances comparability of income arising from taxable and tax-free sources. Adjusted Pre-Provision Net Revenue is defined as net income, plus provision for credit loss, plus income tax expense, plus taxable equivalent adjustment, net of supplemental disclosure items, if applicable. Adjusted Earnings are defined as net income excluding impact of the supplemental disclosure items net of income tax using the statutory federal tax rate, if applicable. Adjusted Earnings per Share is defined as adjusted earnings expressed as an amount available to each common shareholder on a diluted basis. We define Adjusted Revenue as net interest income (te) and noninterest income less supplemental disclosure items. We define Adjusted Noninterest Expense as noninterest expense less supplemental disclosure items. We define our Efficiency Ratio as noninterest expense to total net interest income (te) and noninterest income, excluding amortization of purchased intangibles and supplemental disclosure items, if applicable. Management believes these are useful financial measures because they enable investors and others to gain a better understanding of the Company’s performance period over period, as well as measure management’s success in executing its strategic initiatives. Adjusted pre-provision net revenue is also a useful financial measure to assess the Company’s ability to generate capital to cover credit losses through a credit cycle.
A reconciliation of these measures to GAAP measures is presented in the tables below:
Table 1. Adjusted and Pre-Provision Net Revenue (Adjusted Leverage) – Years Ended December 31, 2024 and 2023
|
|
|
|
Years Ended December 31, |
(In thousands) |
2024 |
2023 |
Net income (GAAP) |
$460,815 |
$392,602 |
Provision for credit loss |
52,167 |
59,103 |
Income tax expense |
113,158 |
97,526 |
Pre-provision net revenue |
626,140 |
549,231 |
Taxable equivalent adjustment (te) |
11,086 |
11,107 |
Pre-provision net revenue (te) |
637,226 |
560,338 |
Supplemental disclosure items |
|
|
Loss on securities portfolio restructure |
― |
65,380 |
Gain on sale of parking facility |
― |
(16,126) |
FDIC special assessment |
3,800 |
26,123 |
Adjusted pre-provision net revenue (te) |
$641,026 |
$635,715 |
Table 2. Adjusted Earnings and Adjusted Earnings per diluted share – Years Ended December 31, 2024 and 2023
|
|
|
(In thousands, except per share) |
Earnings |
EPS |
Year Ended December 31, 2024 |
|
|
Net income |
$460,815 |
$5.28 |
Supplemental disclosure items, after tax |
3,002 |
0.03 |
Adjusted earnings and Adjusted EPS |
$463,817 |
$5.31 |
|
|
|
Year Ended December 31, 2023 |
|
|
Net income |
$392,602 |
$4.50 |
Supplemental disclosure items, after tax |
59,548 |
0.68 |
Adjusted earnings and Adjusted EPS |
$452,150 |
$5.18 |
Table 3. Adjusted Revenue, Adjusted Noninterest Expense for Efficiency Ratio and Efficiency Ratio – Years Ended December 31, 2024 and 2023
|
|
|
|
Years Ended December 31, |
(In thousands) |
2024 |
2023 |
Net interest income |
$1,081,921 |
$1,097,599 |
Noninterest income |
364,129 |
288,480 |
Total GAAP revenue |
1,446,050 |
1,386,079 |
Taxable equivalent adjustment |
11,086 |
11,107 |
Total revenue (TE) |
1,457,136 |
1,397,186 |
Adjustments from supplemental disclosures |
|
|
Gain on sale of parking facility |
― |
(16,126) |
Loss on securities portfolio restructure |
― |
65,380 |
Adjusted revenue (TE) |
$1,457,136 |
$1,446,440 |
GAAP Noninterest expense |
$819,910 |
$836,848 |
Amortization of Intangibles |
(9,413) |
(11,556) |
Adjustments from supplemental disclosures |
|
|
FDIC special assessment |
(3,800) |
(26,123) |
Adjusted noninterest expense for efficiency |
$806,697 |
$799,169 |
Efficiency |
55.36% |
55.25% |
|
APPENDIX B: AMENDMENT TO THE HANCOCK WHITNEY CORPORATION 2020 LONG TERM INCENTIVE PLAN |
This Amendment to the Hancock Whitney Corporation 2020 Long Term Incentive Plan (the “Plan”), has been adopted by the Board of Directors and approved by the shareholders of Hancock Whitney Corporation (the “Company”), to be effective as of April 23, 2025.
1. The Plan is hereby amended by deleting the first sentence of Section 5.2 and replacing it with the following:
“Subject to adjustment in accordance with Section 9.2, the maximum number of shares of Common Stock reserved exclusively for issuance upon an award of or exercise or payment pursuant to Incentive Awards under the Plan shall be 5,200,000 shares, plus a number of additional shares of Common Stock (not to exceed 1,000,000) that are subject to outstanding awards under the Prior Plan on the Effective Date that are subsequently canceled, expired, forfeited or otherwise not issued or are settled in cash.”
2. Except as expressly amended hereby, the terms of the Plan shall be and remain unchanged and the Plan as amended hereby shall remain in full force and effect.
APPENDIX A:
v3.25.0.1
| X |
- DefinitionBoolean flag that is true when the XBRL content amends previously-filed or accepted submission.
| Name: |
dei_AmendmentFlag |
| Namespace Prefix: |
dei_ |
| Data Type: |
xbrli:booleanItemType |
| Balance Type: |
na |
| Period Type: |
duration |
|
| X |
- DefinitionThe type of document being provided (such as 10-K, 10-Q, 485BPOS, etc). The document type is limited to the same value as the supporting SEC submission type, or the word 'Other'.
| Name: |
dei_DocumentType |
| Namespace Prefix: |
dei_ |
| Data Type: |
dei:submissionTypeItemType |
| Balance Type: |
na |
| Period Type: |
duration |
|
| X |
- DefinitionA unique 10-digit SEC-issued value to identify entities that have filed disclosures with the SEC. It is commonly abbreviated as CIK. Reference 1: http://www.xbrl.org/2003/role/presentationRef
-Publisher SEC
-Name Exchange Act
-Number 240
-Section 12
-Subsection b-2
| Name: |
dei_EntityCentralIndexKey |
| Namespace Prefix: |
dei_ |
| Data Type: |
dei:centralIndexKeyItemType |
| Balance Type: |
na |
| Period Type: |
duration |
|
| X |
- DefinitionThe exact name of the entity filing the report as specified in its charter, which is required by forms filed with the SEC. Reference 1: http://www.xbrl.org/2003/role/presentationRef
-Publisher SEC
-Name Exchange Act
-Number 240
-Section 12
-Subsection b-2
| Name: |
dei_EntityRegistrantName |
| Namespace Prefix: |
dei_ |
| Data Type: |
xbrli:normalizedStringItemType |
| Balance Type: |
na |
| Period Type: |
duration |
|
v3.25.0.1
Pay vs Performance Disclosure - USD ($)
|
12 Months Ended |
Dec. 31, 2023 |
Dec. 31, 2022 |
Dec. 31, 2021 |
Dec. 31, 2020 |
| Pay vs Performance Disclosure |
|
|
|
|
| Pay vs Performance Disclosure, Table |
Pay Versus Performance Background Item 402(v) of the SEC’s Regulation S-K, which was mandated by the Dodd-Frank Wall Street Reform and Consumer Protection Act of 2010, requires disclosure of information that demonstrates the relationship between executive compensation actually paid (referred to herein as “CAP”) and the financial performance of the issuer.
|
|
|
|
|
|
|
|
|
PAY VERSUS PERFORMANCE |
|
|
|
|
|
Value of Initial Fixed
$100 Investment Based on: |
|
|
Year |
Summary
Compensation
Table Total for
CEO ($) |
Compensation
Actually Paid to
CEO ($) (2)(3) |
Average Summary
Compensation
Table Total for Non-
CEO NEOs ($) (1) |
Average Summary
Compensation
Actually Paid to Non-CEO NEOs ($) (2)(3) |
Total
Shareholder
Return |
Peer Group
Total
Shareholder
Return (4) |
Net
Income
(in thousands) |
Adjusted EPS (5) |
(a) |
(b) |
(c) |
(d) |
(e) |
(f) |
(g) |
(h) |
(i) |
2024 |
$5,769,326 |
$8,481,165 |
$1,978,679 |
$2,589,125 |
$143.82 |
$130.90 |
$460,815 |
$5.31 |
2023 |
$5,565,268 |
$5,097,193 |
$1,950,896 |
$1,839,444 |
$123.90 |
$115.63 |
$392,602 |
$5.18 |
2022 |
$6,660,310 |
$8,160,975 |
$2,291,358 |
$2,727,056 |
$120.08 |
$116.10 |
$524,089 |
$5.98 |
2021 |
$5,938,806 |
$9,101,298 |
$2,210,600 |
$3,127,514 |
$121.57 |
$124.74 |
$463,215 |
$5.53 |
2020 |
$3,599,933 |
$932,265 |
$1,529,794 |
$595,913 |
$80.75 |
$91.29 |
$(45,174) |
$(0.54) |
(1)Non-CEO NEOs included Mr. Achary, Mr. Loper, Mr. Ziluca, and Mr. Otero for 2024 and Mr. Achary, Mr. Loper, Mr. Exnicios, and Mr. Knight for 2023, 2022, 2021, and 2020. (2)The dollar amounts reported in columns (c) and (e) represent the amount of “compensation actually paid,” or CAP, to the CEO and Other Non-CEO NEOs, respectively, as computed in accordance with Item 402(v) of Regulation S-K. The dollar amounts do not reflect the actual amount of compensation earned by or paid to the CEO or other NEOs, respectively, during the applicable year. (3)The table below sets forth the calculation of CAP.
|
|
|
|
|
|
|
|
|
|
|
|
CEO |
Average of Non-CEO NEOs |
|
2024 |
2023 |
2022 |
2021 |
2020 |
2024 |
2023 |
2022 |
2021 |
2020 |
Total Compensation as Reported in the “Total” column of the SCT |
$5,769,326 |
$5,565,268 |
$6,660,310 |
$5,938,806 |
$3,599,933 |
$1,978,679 |
$1,950,896 |
$2,291,358 |
$2,210,600 |
$1,529,794 |
Deduction for Grant Date Fair Values of Stock Awards Granted in the Year as Reported in the “Stock Awards” column of the SCT |
2,339,746 |
2,428,302 |
2,327,705 |
2,382,878 |
1,222,404 |
613,027 |
647,238 |
618,057 |
711,288 |
348,644 |
Increase for fair value as of December 31 of each applicable year of all stock awards granted during that year that are outstanding and unvested as of such date |
3,414,897 |
2,032,615 |
2,618,488 |
4,434,765 |
457,144 |
879,322 |
553,326 |
681,623 |
1,274,104 |
130,383 |
Increase for Fair Value of Awards Granted During the Year that Vest During the Year |
- |
- |
- |
- |
- |
- |
- |
- |
- |
- |
Increase (Deduction) for change in fair value from December 31 of the prior year to December 31 of the applicable year of any awards granted in a prior year that are outstanding and unvested as of December 31 of the applicable year |
301,250 |
(58,458) |
1,058,257 |
909,106 |
(1,532,401) |
65,097 |
(9,211) |
287,388 |
257,209 |
(501,588) |
Increase (Deduction) for change in fair value from December 31 of the prior year to the vesting date of any awards granted in any prior year as to which all vesting conditions were satisfied during the applicable year |
1,296,020 |
63,304 |
98,425 |
174,504 |
(212,153) |
254,941 |
22,692 |
34,633 |
69,782 |
(101,537) |
Deduction for fair value as of December 31 of the prior year of any awards granted in any prior year as to which vesting conditions failed to be met during the applicable year |
- |
- |
- |
- |
- |
- |
- |
- |
- |
- |
Deduction for changes in the actuarial present value of accumulated pension benefits and earnings on non-qualified deferred compensation plans as reported in the “Change in Pension Value and Nonqualified Deferred Compensation Earnings” of the SCT |
42,779 |
150,460 |
- |
33,171 |
213,680 |
29,989 |
95,777 |
- |
29,156 |
166,508 |
Increase for actuarially determined service cost and prior service cost for services related to defined benefit pension plans during the applicable year |
82,197 |
73,225 |
53,200 |
60,166 |
55,827 |
54,102 |
64,756 |
50,110 |
56,263 |
54,013 |
Compensation Actually Paid |
5,769,326 |
5,097,193 |
8,160,975 |
9,101,298 |
932,265 |
2,589,125 |
1,839,444 |
2,727,056 |
3,127,514 |
595,913 |
(i)No amounts were added to reflect dividends or other earnings paid on stock awards because accrued dividends are included in the stock award fair value calculations and therefore are included in total compensation for such year. For purposes of the foregoing, the fair value of the stock awards at all applicable dates was calculated using the same methodology (including applicable assumptions) as used to account for share-based payments in the Company’s financial statements. The assumptions used in calculating the fair value of awards at the applicable dates did not differ in any material respect from the assumptions used to calculate the grant date fair value of the awards as reported in the Summary Compensation Table for the applicable year, except that (i) the fair value calculations of the PSUs subject to the EPS metric which were granted February 16, 2024, assumed a payout of 136%, the PSUs subject to the EPS metric which were granted February 17, 2023, assumed a payout at 65% as of December 31, 2024 and 58% as of December 31, 2023, and the PSUs subject to the EPS metric which were granted February 18, 2022, assumed a payout at 122% as of December 31, 2024, 122% as of December 31, 2023 and 165% as of December 31, 2022, respectively, and the PSUs subject to the EPS metric which were granted February 15, 2021, assumed a payout at 200% as of December 31, 2023, 2022 and 2021, respectively, the PSUs subject to the EPS metric which were granted January 2, 2020 assumed a payout at 0% as of December 31, 2022, 2021, and 2020, respectively, the PSUs subject to the EPS metric which were granted January 2, 2018 assumed a payout of 0% as of December 31, 2021 and 2020, respectively, and the PSUs subject to the EPS metric which were granted January 2, 2017 assumed a payout at 131% as of December 31, 2020, which was the probable outcome of the applicable performance conditions as of December 31, 2024, 2023, 2022, 2021 and 2020, respectively, compared to the grant date fair value calculations of such PSUs, which assumed a payout at target; (ii) the share price used to determine fair value as of December 31, 2024, 2023, 2022, 2021 and 2020 differed, in some cases materially, from the share price used to determine the grant date fair values; and (iii) for awards subject to the TSR metric, the assumptions used in the Monte Carlo calculation to determine the fair value as of December 31, 2024, 2023, 2022, 2021 and 2020 differed, in some cases materially, from the assumptions used in the Monte Carlo calculation used to determine the grant date fair values. For a discussion of the assumptions used to estimate the fair value of stock awards, please refer to the following sections of the Company’s Annual Report on Form 10-K for the year ended December 31, 2024: “Management’s Discussion and Analysis of Financial Condition and Results of Operations—Critical Accounting Policies and Estimates—Stock-Based Compensation,” and “Stock-Based Compensation” in Note 18 to the Consolidated Financial Statements. (4)We selected the KBW Regional Banking Index (referred to herein as the “Regional Banking Index”) as our peer group for purposes of this disclosure, which index is comprised of approximately 50 companies categorized as primarily engaged in U.S. regional banking activities. The Regional Banking Index also is the same performance peer group selected by the Compensation Committee for determining the achievement of TSR targets for PSUs. See “Compensation Discussion and Analysis—Elements of Our Compensation” for additional information. (5)Adjusted EPS is a non-GAAP financial measure. See “Appendix A—Reconciliation of Non-GAAP Financial Measures” for additional information. |
|
|
|
| Named Executive Officers, Footnote |
(1)Non-CEO NEOs included Mr. Achary, Mr. Loper, Mr. Ziluca, and Mr. Otero for 2024 and Mr. Achary, Mr. Loper, Mr. Exnicios, and Mr. Knight for 2023, 2022, 2021, and 2020.
|
|
|
|
| PEO Total Compensation Amount |
$ 5,565,268
|
$ 6,660,310
|
$ 5,938,806
|
$ 3,599,933
|
| PEO Actually Paid Compensation Amount |
5,097,193
|
8,160,975
|
9,101,298
|
932,265
|
| Non-PEO NEO Average Total Compensation Amount |
1,950,896
|
2,291,358
|
2,210,600
|
1,529,794
|
| Non-PEO NEO Average Compensation Actually Paid Amount |
$ 1,839,444
|
2,727,056
|
3,127,514
|
595,913
|
| Compensation Actually Paid vs. Total Shareholder Return |
Total Shareholder Return The graph below presents, for the cumulative period from January 1, 2020 – December 31, 2024, the relationship between the CAP to our CEO and the average CAP to our other NEOs and each of Company’s TSR and the TSR of the Regional Banking Index.
As demonstrated by the graph above, CAP to our CEO and the average CAP to our other NEOs is aligned with Company’s TSR as well as the TSR of the Regional Banking Index. Company’s TSR increased by 43.82% over the reporting period (50.54% in 2021, -1.23% in 2022, 3.18% in 2023 and 16.08% in 2024), outperforming the Regional Banking Index by 12.91% over the reporting period (13.90% in 2021, 5.70% in 2022, 3.58% in 2023 and 2.87% in 2024). During the reporting period, CAP to the CEO increased 810% in the aggregate, and average CAP to the other NEOs increased 334% in the aggregate. CAP to the CEO and to the other NEOs was highest among the reporting periods when Company achieved its highest year-end closing stock price in 2021, reflecting the high proportion of variable pay at risk for the CEO and the other NEOs. Conversely, CAP to the CEO and the other NEOs was lowest in 2020 due to the challenging market conditions and financial performance reflected in Company's lower closing stock price in 2020. 50% of the PSUs awarded in 2020, 2021, 2022 and 2023 vest based on the Company’s relative TSR performance. See “Compensation Discussion & Analysis—Elements of Our Compensation” for additional information.
|
|
|
|
| Compensation Actually Paid vs. Net Income |
Net Income The graph below presents, for each of the years ended December 31, 2024, 2023, 2022, 2021 and 2020, the relationship between the CAP to our CEO and the average CAP to our other NEOs and the Company’s net income.
As demonstrated by the graph above, CAP to our CEO and to the other NEOs is aligned with Company’s Net Income. Net Income increased by 1,120% over the reporting period (1,125% in 2021, 13% in 2022, -25% in 2023, and 969% in 2024). During the reporting period, CAP to the CEO increased 810% in the aggregate, and average CAP to the other NEOs increased 334% in the aggregate. The Compensation Committee did not use net income as a distinct metric for purposes of determining or paying compensation during 2024, 2023, 2022, 2021 or 2020.
|
|
|
|
| Compensation Actually Paid vs. Company Selected Measure |
Adjusted EPS The graph below presents, for each of the years ended December 31,2024, 2023, 2022, 2021 and 2020, the relationship between the CAP to our CEO and the average CAP to our other NEOs and the Company’s Adjusted EPS.
|
|
|
|
| Tabular List, Table |
|
|
Performance Metric |
Financial or Non-Financial |
Adjusted EPS |
Financial |
Relative TSR (1) |
Financial |
Adjusted Pre Provision Net Revenue |
Financial |
Commercial Criticized Loans to Total Commercial Loans |
Financial |
Non-Performing Loans to Total Loans |
Financial |
|
|
|
|
| Net Income (Loss) |
$ 392,602,000
|
$ 524,089,000
|
$ 463,215,000
|
$ (45,174,000)
|
| Company Selected Measure Amount |
5,180,000
|
5,980,000
|
5,530,000
|
(540,000)
|
| Adj to Comp Fn [Text Block] |
(3)The table below sets forth the calculation of CAP.
|
|
|
|
|
|
|
|
|
|
|
|
CEO |
Average of Non-CEO NEOs |
|
2024 |
2023 |
2022 |
2021 |
2020 |
2024 |
2023 |
2022 |
2021 |
2020 |
Total Compensation as Reported in the “Total” column of the SCT |
$5,769,326 |
$5,565,268 |
$6,660,310 |
$5,938,806 |
$3,599,933 |
$1,978,679 |
$1,950,896 |
$2,291,358 |
$2,210,600 |
$1,529,794 |
Deduction for Grant Date Fair Values of Stock Awards Granted in the Year as Reported in the “Stock Awards” column of the SCT |
2,339,746 |
2,428,302 |
2,327,705 |
2,382,878 |
1,222,404 |
613,027 |
647,238 |
618,057 |
711,288 |
348,644 |
Increase for fair value as of December 31 of each applicable year of all stock awards granted during that year that are outstanding and unvested as of such date |
3,414,897 |
2,032,615 |
2,618,488 |
4,434,765 |
457,144 |
879,322 |
553,326 |
681,623 |
1,274,104 |
130,383 |
Increase for Fair Value of Awards Granted During the Year that Vest During the Year |
- |
- |
- |
- |
- |
- |
- |
- |
- |
- |
Increase (Deduction) for change in fair value from December 31 of the prior year to December 31 of the applicable year of any awards granted in a prior year that are outstanding and unvested as of December 31 of the applicable year |
301,250 |
(58,458) |
1,058,257 |
909,106 |
(1,532,401) |
65,097 |
(9,211) |
287,388 |
257,209 |
(501,588) |
Increase (Deduction) for change in fair value from December 31 of the prior year to the vesting date of any awards granted in any prior year as to which all vesting conditions were satisfied during the applicable year |
1,296,020 |
63,304 |
98,425 |
174,504 |
(212,153) |
254,941 |
22,692 |
34,633 |
69,782 |
(101,537) |
Deduction for fair value as of December 31 of the prior year of any awards granted in any prior year as to which vesting conditions failed to be met during the applicable year |
- |
- |
- |
- |
- |
- |
- |
- |
- |
- |
Deduction for changes in the actuarial present value of accumulated pension benefits and earnings on non-qualified deferred compensation plans as reported in the “Change in Pension Value and Nonqualified Deferred Compensation Earnings” of the SCT |
42,779 |
150,460 |
- |
33,171 |
213,680 |
29,989 |
95,777 |
- |
29,156 |
166,508 |
Increase for actuarially determined service cost and prior service cost for services related to defined benefit pension plans during the applicable year |
82,197 |
73,225 |
53,200 |
60,166 |
55,827 |
54,102 |
64,756 |
50,110 |
56,263 |
54,013 |
Compensation Actually Paid |
5,769,326 |
5,097,193 |
8,160,975 |
9,101,298 |
932,265 |
2,589,125 |
1,839,444 |
2,727,056 |
3,127,514 |
595,913 |
|
|
|
|
| Measure:: 1 |
|
|
|
|
| Pay vs Performance Disclosure |
|
|
|
|
| Name |
Adjusted EPS
|
|
|
|
| Non-GAAP Measure Description |
(5)Adjusted EPS is a non-GAAP financial measure. See “Appendix A—Reconciliation of Non-GAAP Financial Measures” for additional information.
|
|
|
|
| Measure:: 2 |
|
|
|
|
| Pay vs Performance Disclosure |
|
|
|
|
| Name |
Relative TSR
|
|
|
|
| Measure:: 3 |
|
|
|
|
| Pay vs Performance Disclosure |
|
|
|
|
| Name |
Adjusted Pre Provision Net Revenue
|
|
|
|
| Measure:: 4 |
|
|
|
|
| Pay vs Performance Disclosure |
|
|
|
|
| Name |
Commercial Criticized Loans to Total Commercial Loans
|
|
|
|
| Measure:: 5 |
|
|
|
|
| Pay vs Performance Disclosure |
|
|
|
|
| Name |
Non-Performing Loans to Total Loans
|
|
|
|
| PEO |
|
|
|
|
| Pay vs Performance Disclosure |
|
|
|
|
| Adjustment to Compensation, Amount |
$ 5,097,193,000
|
$ 8,160,975,000
|
$ 9,101,298,000
|
$ 932,265,000
|
| PEO | Total Compensation as Reported [Member] |
|
|
|
|
| Pay vs Performance Disclosure |
|
|
|
|
| Adjustment to Compensation, Amount |
5,565,268,000
|
6,660,310,000
|
5,938,806,000
|
3,599,933,000
|
| PEO | Deduction for Grant Date Fair Values of Stock Awards Granted in the Year [Member] |
|
|
|
|
| Pay vs Performance Disclosure |
|
|
|
|
| Adjustment to Compensation, Amount |
2,428,302,000
|
2,327,705,000
|
2,382,878,000
|
1,222,404,000
|
| PEO | Increase For Fair Value As Of December 31 Of Each Applicable Year Of All Stock Awards Granted During That Year That Are Outstanding And Unvested As of Such Date [Member] |
|
|
|
|
| Pay vs Performance Disclosure |
|
|
|
|
| Adjustment to Compensation, Amount |
2,032,615,000
|
2,618,488,000
|
4,434,765,000
|
457,144,000
|
| PEO | Increase (Deduction) For Change In Fair Value From December 31 Of The Prior Year To December 31 Of The Applicable Year Of Any Awards Granted In A Prior Year That Are Outstanding And Unvested As of December 31 of The Applicable Year [Member] |
|
|
|
|
| Pay vs Performance Disclosure |
|
|
|
|
| Adjustment to Compensation, Amount |
(58,458,000)
|
1,058,257,000
|
909,106,000
|
(1,532,401,000)
|
| PEO | Increase (Deduction) For Change In Fair Value From December 31 Of The Prior Year To The Vesting Date Of Any Awards Granted In Any Prior Year As To Which All Vesting Conditions Were Satisfied During The Applicable Year [Member] |
|
|
|
|
| Pay vs Performance Disclosure |
|
|
|
|
| Adjustment to Compensation, Amount |
63,304,000
|
98,425,000
|
174,504,000
|
(212,153,000)
|
| PEO | Deduction For Changes In The Actuarial Present Value Of Accumulated Pension Benefits And Earnings On Non-qualified Deferred Compensation Plans As Reported In The Change In Pension Value And Nonqualified Deferred Compensation Earnings Of The SCT [Member] |
|
|
|
|
| Pay vs Performance Disclosure |
|
|
|
|
| Adjustment to Compensation, Amount |
150,460,000
|
|
33,171,000
|
213,680,000
|
| PEO | Increase For Actuarially Determined Service Cost And Prior Service Cost For Services Related To Defined Benefit Pension Plans During The Applicable Year [Member] |
|
|
|
|
| Pay vs Performance Disclosure |
|
|
|
|
| Adjustment to Compensation, Amount |
73,225,000
|
53,200,000
|
60,166,000
|
$ 55,827,000
|
| Non-PEO NEO |
|
|
|
|
| Pay vs Performance Disclosure |
|
|
|
|
| Adjustment to Compensation, Amount |
1,839,444,000
|
2,727,056,000
|
2,589,125,000
|
|
| Non-PEO NEO | Total Compensation as Reported [Member] |
|
|
|
|
| Pay vs Performance Disclosure |
|
|
|
|
| Adjustment to Compensation, Amount |
1,950,896,000
|
2,291,358,000
|
1,978,679,000
|
|
| Non-PEO NEO | Deduction for Grant Date Fair Values of Stock Awards Granted in the Year [Member] |
|
|
|
|
| Pay vs Performance Disclosure |
|
|
|
|
| Adjustment to Compensation, Amount |
647,238,000
|
618,057,000
|
613,027,000
|
|
| Non-PEO NEO | Increase For Fair Value As Of December 31 Of Each Applicable Year Of All Stock Awards Granted During That Year That Are Outstanding And Unvested As of Such Date [Member] |
|
|
|
|
| Pay vs Performance Disclosure |
|
|
|
|
| Adjustment to Compensation, Amount |
553,326,000
|
681,623,000
|
879,322,000
|
|
| Non-PEO NEO | Increase (Deduction) For Change In Fair Value From December 31 Of The Prior Year To December 31 Of The Applicable Year Of Any Awards Granted In A Prior Year That Are Outstanding And Unvested As of December 31 of The Applicable Year [Member] |
|
|
|
|
| Pay vs Performance Disclosure |
|
|
|
|
| Adjustment to Compensation, Amount |
(9,211,000)
|
287,388,000
|
65,097,000
|
|
| Non-PEO NEO | Increase (Deduction) For Change In Fair Value From December 31 Of The Prior Year To The Vesting Date Of Any Awards Granted In Any Prior Year As To Which All Vesting Conditions Were Satisfied During The Applicable Year [Member] |
|
|
|
|
| Pay vs Performance Disclosure |
|
|
|
|
| Adjustment to Compensation, Amount |
22,692,000
|
34,633,000
|
254,941,000
|
|
| Non-PEO NEO | Deduction For Changes In The Actuarial Present Value Of Accumulated Pension Benefits And Earnings On Non-qualified Deferred Compensation Plans As Reported In The Change In Pension Value And Nonqualified Deferred Compensation Earnings Of The SCT [Member] |
|
|
|
|
| Pay vs Performance Disclosure |
|
|
|
|
| Adjustment to Compensation, Amount |
95,777,000
|
|
29,989,000
|
|
| Non-PEO NEO | Increase For Actuarially Determined Service Cost And Prior Service Cost For Services Related To Defined Benefit Pension Plans During The Applicable Year [Member] |
|
|
|
|
| Pay vs Performance Disclosure |
|
|
|
|
| Adjustment to Compensation, Amount |
$ 64,756,000
|
$ 50,110,000
|
$ 54,102,000
|
|
| X |
- ReferencesReference 1: http://www.xbrl.org/2003/role/presentationRef
-Publisher SEC
-Name Regulation S-K
-Number 229
-Section 402
-Subsection v
-Paragraph 3
| Name: |
ecd_AdjToCompAmt |
| Namespace Prefix: |
ecd_ |
| Data Type: |
xbrli:monetaryItemType |
| Balance Type: |
na |
| Period Type: |
duration |
|
| X |
- ReferencesReference 1: http://www.xbrl.org/2003/role/presentationRef
-Publisher SEC
-Name Regulation S-K
-Number 229
-Section 402
-Subsection v
-Paragraph 2
-Subparagraph vi
| Name: |
ecd_CoSelectedMeasureAmt |
| Namespace Prefix: |
ecd_ |
| Data Type: |
xbrli:decimalItemType |
| Balance Type: |
na |
| Period Type: |
duration |
|
| X |
- ReferencesReference 1: http://www.xbrl.org/2003/role/presentationRef
-Publisher SEC
-Name Regulation S-K
-Number 229
-Section 402
-Subsection v
-Paragraph 5
-Subparagraph iii
| Name: |
ecd_CompActuallyPaidVsCoSelectedMeasureTextBlock |
| Namespace Prefix: |
ecd_ |
| Data Type: |
dtr-types:textBlockItemType |
| Balance Type: |
na |
| Period Type: |
duration |
|
| X |
- ReferencesReference 1: http://www.xbrl.org/2003/role/presentationRef
-Publisher SEC
-Name Regulation S-K
-Number 229
-Section 402
-Subsection v
-Paragraph 5
-Subparagraph ii
| Name: |
ecd_CompActuallyPaidVsNetIncomeTextBlock |
| Namespace Prefix: |
ecd_ |
| Data Type: |
dtr-types:textBlockItemType |
| Balance Type: |
na |
| Period Type: |
duration |
|
| X |
- ReferencesReference 1: http://www.xbrl.org/2003/role/presentationRef
-Publisher SEC
-Name Regulation S-K
-Number 229
-Section 402
-Subsection v
-Paragraph 5
-Subparagraph i
| Name: |
ecd_CompActuallyPaidVsTotalShareholderRtnTextBlock |
| Namespace Prefix: |
ecd_ |
| Data Type: |
dtr-types:textBlockItemType |
| Balance Type: |
na |
| Period Type: |
duration |
|
| X |
- ReferencesReference 1: http://www.xbrl.org/2003/role/presentationRef
-Publisher SEC
-Name Regulation S-K
-Number 229
-Section 402
-Subsection v
-Paragraph 2
-Subparagraph vi
| Name: |
ecd_MeasureName |
| Namespace Prefix: |
ecd_ |
| Data Type: |
xbrli:normalizedStringItemType |
| Balance Type: |
na |
| Period Type: |
duration |
|
| X |
- ReferencesReference 1: http://www.xbrl.org/2003/role/presentationRef
-Publisher SEC
-Name Regulation S-K
-Number 229
-Section 402
-Subsection v
-Paragraph 3
| Name: |
ecd_NamedExecutiveOfficersFnTextBlock |
| Namespace Prefix: |
ecd_ |
| Data Type: |
dtr-types:textBlockItemType |
| Balance Type: |
na |
| Period Type: |
duration |
|
| X |
- ReferencesReference 1: http://www.xbrl.org/2003/role/presentationRef
-Publisher SEC
-Name Regulation S-K
-Number 229
-Section 402
-Subsection v
-Paragraph 2
-Subparagraph vi
| Name: |
ecd_NonGaapMeasureDescriptionTextBlock |
| Namespace Prefix: |
ecd_ |
| Data Type: |
dtr-types:textBlockItemType |
| Balance Type: |
na |
| Period Type: |
duration |
|
| X |
- ReferencesReference 1: http://www.xbrl.org/2003/role/presentationRef
-Publisher SEC
-Name Regulation S-K
-Number 229
-Section 402
-Subsection v
-Paragraph 2
-Subparagraph iii
| Name: |
ecd_NonPeoNeoAvgCompActuallyPaidAmt |
| Namespace Prefix: |
ecd_ |
| Data Type: |
xbrli:monetaryItemType |
| Balance Type: |
na |
| Period Type: |
duration |
|
| X |
- ReferencesReference 1: http://www.xbrl.org/2003/role/presentationRef
-Publisher SEC
-Name Regulation S-K
-Number 229
-Section 402
-Subsection v
-Paragraph 2
-Subparagraph ii
| Name: |
ecd_NonPeoNeoAvgTotalCompAmt |
| Namespace Prefix: |
ecd_ |
| Data Type: |
xbrli:monetaryItemType |
| Balance Type: |
na |
| Period Type: |
duration |
|
| X |
- ReferencesReference 1: http://www.xbrl.org/2003/role/presentationRef
-Publisher SEC
-Name Regulation S-K
-Number 229
-Section 402
-Subsection v
-Paragraph 2
-Subparagraph iii
| Name: |
ecd_PeoActuallyPaidCompAmt |
| Namespace Prefix: |
ecd_ |
| Data Type: |
xbrli:monetaryItemType |
| Balance Type: |
na |
| Period Type: |
duration |
|
| X |
- ReferencesReference 1: http://www.xbrl.org/2003/role/presentationRef
-Publisher SEC
-Name Regulation S-K
-Number 229
-Section 402
-Subsection v
-Paragraph 2
-Subparagraph ii
| Name: |
ecd_PeoTotalCompAmt |
| Namespace Prefix: |
ecd_ |
| Data Type: |
xbrli:monetaryItemType |
| Balance Type: |
na |
| Period Type: |
duration |
|
| X |
- ReferencesReference 1: http://www.xbrl.org/2003/role/presentationRef
-Publisher SEC
-Name Regulation S-K
-Number 229
-Section 402
-Subsection v
-Paragraph 1
| Name: |
ecd_PvpTable |
| Namespace Prefix: |
ecd_ |
| Data Type: |
xbrli:stringItemType |
| Balance Type: |
na |
| Period Type: |
duration |
|
| X |
- ReferencesReference 1: http://www.xbrl.org/2003/role/presentationRef
-Publisher SEC
-Name Regulation S-K
-Number 229
-Section 402
-Subsection v
-Paragraph 1
| Name: |
ecd_PvpTableTextBlock |
| Namespace Prefix: |
ecd_ |
| Data Type: |
dtr-types:textBlockItemType |
| Balance Type: |
na |
| Period Type: |
duration |
|
| X |
- ReferencesReference 1: http://www.xbrl.org/2003/role/presentationRef
-Publisher SEC
-Name Regulation S-K
-Number 229
-Section 402
-Subsection v
-Paragraph 6
| Name: |
ecd_TabularListTableTextBlock |
| Namespace Prefix: |
ecd_ |
| Data Type: |
dtr-types:textBlockItemType |
| Balance Type: |
na |
| Period Type: |
duration |
|
| X |
- Definition
+ References
+ Details
| Name: |
hwc_AdjToCompFnTextBlock |
| Namespace Prefix: |
hwc_ |
| Data Type: |
dtr-types:textBlockItemType |
| Balance Type: |
na |
| Period Type: |
duration |
|
| X |
- DefinitionThe portion of profit or loss for the period, net of income taxes, which is attributable to the parent. Reference 1: http://www.xbrl.org/2003/role/disclosureRef
-Topic 250
-SubTopic 10
-Name Accounting Standards Codification
-Section 50
-Paragraph 6
-Publisher FASB
-URI https://asc.fasb.org/1943274/2147483443/250-10-50-6
Reference 2: http://www.xbrl.org/2003/role/disclosureRef
-Topic 250
-SubTopic 10
-Name Accounting Standards Codification
-Section 50
-Paragraph 9
-Publisher FASB
-URI https://asc.fasb.org/1943274/2147483443/250-10-50-9
Reference 3: http://www.xbrl.org/2003/role/disclosureRef
-Topic 805
-SubTopic 60
-Name Accounting Standards Codification
-Section 65
-Paragraph 1
-Subparagraph (g)
-Publisher FASB
-URI https://asc.fasb.org/1943274/2147476176/805-60-65-1
Reference 4: http://www.xbrl.org/2003/role/disclosureRef
-Topic 740
-SubTopic 323
-Name Accounting Standards Codification
-Section 65
-Paragraph 2
-Subparagraph (g)(3)
-Publisher FASB
-URI https://asc.fasb.org/1943274/2147478666/740-323-65-2
Reference 5: http://fasb.org/us-gaap/role/ref/legacyRef
-Topic 220
-SubTopic 10
-Name Accounting Standards Codification
-Section S99
-Paragraph 2
-Subparagraph (SX 210.5-03(20))
-Publisher FASB
-URI https://asc.fasb.org/1943274/2147483621/220-10-S99-2
Reference 6: http://www.xbrl.org/2003/role/disclosureRef
-Topic 235
-SubTopic 10
-Name Accounting Standards Codification
-Section S99
-Paragraph 1
-Subparagraph (SX 210.4-08(g)(1)(ii))
-Publisher FASB
-URI https://asc.fasb.org/1943274/2147480678/235-10-S99-1
Reference 7: http://www.xbrl.org/2003/role/disclosureRef
-Topic 323
-SubTopic 10
-Name Accounting Standards Codification
-Section 50
-Paragraph 3
-Subparagraph (c)
-Publisher FASB
-URI https://asc.fasb.org/1943274/2147481687/323-10-50-3
Reference 8: http://www.xbrl.org/2003/role/disclosureRef
-Topic 825
-SubTopic 10
-Name Accounting Standards Codification
-Section 50
-Paragraph 28
-Subparagraph (f)
-Publisher FASB
-URI https://asc.fasb.org/1943274/2147482907/825-10-50-28
Reference 9: http://www.xbrl.org/2003/role/disclosureRef
-Topic 220
-SubTopic 10
-Name Accounting Standards Codification
-Section 50
-Paragraph 6
-Publisher FASB
-URI https://asc.fasb.org/1943274/2147482765/220-10-50-6
Reference 10: http://www.xbrl.org/2003/role/disclosureRef
-Topic 250
-SubTopic 10
-Name Accounting Standards Codification
-Section 50
-Paragraph 3
-Publisher FASB
-URI https://asc.fasb.org/1943274/2147483443/250-10-50-3
Reference 11: http://www.xbrl.org/2003/role/disclosureRef
-Topic 250
-SubTopic 10
-Name Accounting Standards Codification
-Section 50
-Paragraph 1
-Subparagraph (b)(2)
-Publisher FASB
-URI https://asc.fasb.org/1943274/2147483443/250-10-50-1
Reference 12: http://www.xbrl.org/2003/role/disclosureRef
-Topic 815
-SubTopic 40
-Name Accounting Standards Codification
-Section 65
-Paragraph 1
-Subparagraph (f)
-Publisher FASB
-URI https://asc.fasb.org/1943274/2147480175/815-40-65-1
Reference 13: http://www.xbrl.org/2003/role/disclosureRef
-Topic 250
-SubTopic 10
-Name Accounting Standards Codification
-Section 50
-Paragraph 8
-Publisher FASB
-URI https://asc.fasb.org/1943274/2147483443/250-10-50-8
Reference 14: http://www.xbrl.org/2003/role/disclosureRef
-Topic 250
-SubTopic 10
-Name Accounting Standards Codification
-Section 50
-Paragraph 11
-Subparagraph (a)
-Publisher FASB
-URI https://asc.fasb.org/1943274/2147483443/250-10-50-11
Reference 15: http://www.xbrl.org/2003/role/disclosureRef
-Topic 250
-SubTopic 10
-Name Accounting Standards Codification
-Section 50
-Paragraph 11
-Subparagraph (b)
-Publisher FASB
-URI https://asc.fasb.org/1943274/2147483443/250-10-50-11
Reference 16: http://www.xbrl.org/2003/role/disclosureRef
-Topic 250
-SubTopic 10
-Name Accounting Standards Codification
-Section 50
-Paragraph 4
-Publisher FASB
-URI https://asc.fasb.org/1943274/2147483443/250-10-50-4
Reference 17: http://www.xbrl.org/2003/role/exampleRef
-Topic 946
-SubTopic 830
-Name Accounting Standards Codification
-Section 55
-Paragraph 10
-Publisher FASB
-URI https://asc.fasb.org/1943274/2147479168/946-830-55-10
Reference 18: http://www.xbrl.org/2003/role/disclosureRef
-Topic 946
-SubTopic 220
-Name Accounting Standards Codification
-Section 45
-Paragraph 7
-Publisher FASB
-URI https://asc.fasb.org/1943274/2147479105/946-220-45-7
Reference 19: http://www.xbrl.org/2003/role/disclosureRef
-Topic 944
-SubTopic 220
-Name Accounting Standards Codification
-Section S99
-Paragraph 1
-Subparagraph (SX 210.7-04(18))
-Publisher FASB
-URI https://asc.fasb.org/1943274/2147477250/944-220-S99-1
Reference 20: http://www.xbrl.org/2003/role/disclosureRef
-Topic 946
-SubTopic 220
-Name Accounting Standards Codification
-Section S99
-Paragraph 1
-Subparagraph (SX 210.6-07(9))
-Publisher FASB
-URI https://asc.fasb.org/1943274/2147479134/946-220-S99-1
Reference 21: http://www.xbrl.org/2003/role/disclosureRef
-Topic 946
-SubTopic 220
-Name Accounting Standards Codification
-Section S99
-Paragraph 3
-Subparagraph (SX 210.6-09(1)(d))
-Publisher FASB
-URI https://asc.fasb.org/1943274/2147479134/946-220-S99-3
Reference 22: http://www.xbrl.org/2003/role/disclosureRef
-Topic 470
-SubTopic 10
-Name Accounting Standards Codification
-Section S99
-Paragraph 1A
-Subparagraph (SX 210.13-01(a)(4)(i))
-Publisher FASB
-URI https://asc.fasb.org/1943274/2147480097/470-10-S99-1A
Reference 23: http://www.xbrl.org/2009/role/commonPracticeRef
-Topic 470
-SubTopic 10
-Name Accounting Standards Codification
-Section S99
-Paragraph 1A
-Subparagraph (SX 210.13-01(a)(4)(ii))
-Publisher FASB
-URI https://asc.fasb.org/1943274/2147480097/470-10-S99-1A
Reference 24: http://www.xbrl.org/2003/role/disclosureRef
-Topic 470
-SubTopic 10
-Name Accounting Standards Codification
-Section S99
-Paragraph 1A
-Subparagraph (SX 210.13-01(a)(4)(iii)(A))
-Publisher FASB
-URI https://asc.fasb.org/1943274/2147480097/470-10-S99-1A
Reference 25: http://www.xbrl.org/2003/role/disclosureRef
-Topic 470
-SubTopic 10
-Name Accounting Standards Codification
-Section S99
-Paragraph 1A
-Subparagraph (SX 210.13-01(a)(4)(iv))
-Publisher FASB
-URI https://asc.fasb.org/1943274/2147480097/470-10-S99-1A
Reference 26: http://www.xbrl.org/2003/role/disclosureRef
-Topic 470
-SubTopic 10
-Name Accounting Standards Codification
-Section S99
-Paragraph 1A
-Subparagraph (SX 210.13-01(a)(5))
-Publisher FASB
-URI https://asc.fasb.org/1943274/2147480097/470-10-S99-1A
Reference 27: http://www.xbrl.org/2003/role/disclosureRef
-Topic 470
-SubTopic 10
-Name Accounting Standards Codification
-Section S99
-Paragraph 1B
-Subparagraph (SX 210.13-02(a)(4)(i))
-Publisher FASB
-URI https://asc.fasb.org/1943274/2147480097/470-10-S99-1B
Reference 28: http://www.xbrl.org/2003/role/disclosureRef
-Topic 470
-SubTopic 10
-Name Accounting Standards Codification
-Section S99
-Paragraph 1B
-Subparagraph (SX 210.13-02(a)(4)(iii)(A))
-Publisher FASB
-URI https://asc.fasb.org/1943274/2147480097/470-10-S99-1B
Reference 29: http://www.xbrl.org/2003/role/disclosureRef
-Topic 470
-SubTopic 10
-Name Accounting Standards Codification
-Section S99
-Paragraph 1B
-Subparagraph (SX 210.13-02(a)(4)(iii)(B))
-Publisher FASB
-URI https://asc.fasb.org/1943274/2147480097/470-10-S99-1B
Reference 30: http://www.xbrl.org/2003/role/disclosureRef
-Topic 470
-SubTopic 10
-Name Accounting Standards Codification
-Section S99
-Paragraph 1B
-Subparagraph (SX 210.13-02(a)(4)(iv))
-Publisher FASB
-URI https://asc.fasb.org/1943274/2147480097/470-10-S99-1B
Reference 31: http://www.xbrl.org/2003/role/disclosureRef
-Topic 470
-SubTopic 10
-Name Accounting Standards Codification
-Section S99
-Paragraph 1B
-Subparagraph (SX 210.13-02(a)(5))
-Publisher FASB
-URI https://asc.fasb.org/1943274/2147480097/470-10-S99-1B
Reference 32: http://www.xbrl.org/2003/role/disclosureRef
-Topic 260
-SubTopic 10
-Name Accounting Standards Codification
-Section 45
-Paragraph 60B
-Subparagraph (a)
-Publisher FASB
-URI https://asc.fasb.org/1943274/2147482689/260-10-45-60B
Reference 33: http://www.xbrl.org/2003/role/disclosureRef
-Topic 205
-SubTopic 20
-Name Accounting Standards Codification
-Section 50
-Paragraph 7
-Publisher FASB
-URI https://asc.fasb.org/1943274/2147483499/205-20-50-7
Reference 34: http://fasb.org/us-gaap/role/ref/legacyRef
-Topic 230
-SubTopic 10
-Name Accounting Standards Codification
-Section 45
-Paragraph 28
-Publisher FASB
-URI https://asc.fasb.org/1943274/2147482740/230-10-45-28
Reference 35: http://www.xbrl.org/2003/role/disclosureRef
-Topic 220
-SubTopic 10
-Name Accounting Standards Codification
-Section 45
-Paragraph 1A
-Subparagraph (a)
-Publisher FASB
-URI https://asc.fasb.org/1943274/2147482790/220-10-45-1A
Reference 36: http://www.xbrl.org/2003/role/disclosureRef
-Topic 220
-SubTopic 10
-Name Accounting Standards Codification
-Section 45
-Paragraph 1B
-Subparagraph (a)
-Publisher FASB
-URI https://asc.fasb.org/1943274/2147482790/220-10-45-1B
Reference 37: http://fasb.org/us-gaap/role/ref/legacyRef
-Topic 942
-SubTopic 220
-Name Accounting Standards Codification
-Section S99
-Paragraph 1
-Subparagraph (SX 210.9-04(22))
-Publisher FASB
-URI https://asc.fasb.org/1943274/2147478524/942-220-S99-1
| Name: |
us-gaap_NetIncomeLoss |
| Namespace Prefix: |
us-gaap_ |
| Data Type: |
xbrli:monetaryItemType |
| Balance Type: |
credit |
| Period Type: |
duration |
|
| X |
- Details
| Name: |
ecd_MeasureAxis=1 |
| Namespace Prefix: |
|
| Data Type: |
na |
| Balance Type: |
|
| Period Type: |
|
|
| X |
- Details
| Name: |
ecd_MeasureAxis=2 |
| Namespace Prefix: |
|
| Data Type: |
na |
| Balance Type: |
|
| Period Type: |
|
|
| X |
- Details
| Name: |
ecd_MeasureAxis=3 |
| Namespace Prefix: |
|
| Data Type: |
na |
| Balance Type: |
|
| Period Type: |
|
|
| X |
- Details
| Name: |
ecd_MeasureAxis=4 |
| Namespace Prefix: |
|
| Data Type: |
na |
| Balance Type: |
|
| Period Type: |
|
|
| X |
- Details
| Name: |
ecd_MeasureAxis=5 |
| Namespace Prefix: |
|
| Data Type: |
na |
| Balance Type: |
|
| Period Type: |
|
|
| X |
- Details
| Name: |
ecd_ExecutiveCategoryAxis=ecd_PeoMember |
| Namespace Prefix: |
|
| Data Type: |
na |
| Balance Type: |
|
| Period Type: |
|
|
| X |
- Details
| Name: |
ecd_AdjToCompAxis=hwc_TotalCompensationAsReportedMember |
| Namespace Prefix: |
|
| Data Type: |
na |
| Balance Type: |
|
| Period Type: |
|
|
| X |
- Details
| Name: |
ecd_AdjToCompAxis=hwc_DeductionForGrantDateFairValuesOfStockAwardsGrantedInTheYearMember |
| Namespace Prefix: |
|
| Data Type: |
na |
| Balance Type: |
|
| Period Type: |
|
|
| X |
- Details
| Name: |
ecd_AdjToCompAxis=hwc_IncreaseForFairValueAsOfDecember31OfEachApplicableYearOfAllStockAwardsGrantedDuringThatYearAreOutstandingAndUnvestedAsOfSuchDateMember |
| Namespace Prefix: |
|
| Data Type: |
na |
| Balance Type: |
|
| Period Type: |
|
|
| X |
- Details
| Name: |
ecd_AdjToCompAxis=hwc_IncreaseDeductionForChangeInFairValueFromDecember31OfThePriorYearToDecember31OfTheApplicableYearOfAnyAwardsGrantedInAPriorYearThatAreOutstandingAndUnvestedAsOfDecember31OfTheApplicableYearMember |
| Namespace Prefix: |
|
| Data Type: |
na |
| Balance Type: |
|
| Period Type: |
|
|
| X |
- Details
| Name: |
ecd_AdjToCompAxis=hwc_IncreaseDeductionForChangeInFairValueFromDecember31OfThePriorYearToTheVestingDateOfAnyAwardsGrantedInAnyPriorYearAsToWhichAllVestingConditionsWereSatisfiedDuringTheApplicableYearMember |
| Namespace Prefix: |
|
| Data Type: |
na |
| Balance Type: |
|
| Period Type: |
|
|
| X |
- Details
| Name: |
ecd_AdjToCompAxis=hwc_DeductionForChangesInTheActuarialPresentValueOfAccumulatedPensionBenefitsAndEarningsOnNonQualifiedDeferredCompensationPlansAsReportedMember |
| Namespace Prefix: |
|
| Data Type: |
na |
| Balance Type: |
|
| Period Type: |
|
|
| X |
- Details
| Name: |
ecd_ExecutiveCategoryAxis=ecd_NonPeoNeoMember |
| Namespace Prefix: |
|
| Data Type: |
na |
| Balance Type: |
|
| Period Type: |
|
|
Hancock Whitney (NASDAQ:HWCPZ)
Historical Stock Chart
From Feb 2025 to Mar 2025

Hancock Whitney (NASDAQ:HWCPZ)
Historical Stock Chart
From Mar 2024 to Mar 2025

