Pay vs Performance Disclosure - USD ($)
|
12 Months Ended |
Dec. 28, 2024 |
Dec. 30, 2023 |
Dec. 31, 2022 |
Dec. 25, 2021 |
Dec. 26, 2020 |
| Pay vs Performance Disclosure |
|
|
|
|
|
| Pay vs Performance Disclosure, Table |
| | | | | | | | | | | | Average | | Value of Initial Fixed $100 | | | | | | Summary | Average | Investment Based On | | | | Summary | | Compensation | Compensation | Company | Peer Group | | | | Compensation | Compensation | Table Total | Actually Paid | Total | Total | Net | Royalty | | Table Total | Actually Paid | for Non-PEO | to Non-PEO | Shareholder | Shareholder | Income | Revenues(6) | Year | for PEO(1)($) | to PEO(1)(2)($) | NEOs(3) ($) | NEOs(3)(4)($) | Return ($) | Return(5)($) | ($) | ($) | 2024 | 1,832,143 | 1,091,533 | 1,019,428 | 577,666 | 230 | 216 | 39,954,200 | 72,198,500 | 2023 | 1,618,639 | 6,428,551 | 906,715 | 3,854,631 | 237 | 157 | 40,178,100 | 70,230,700 | 2022 | 1,838,665 | 2,155,075 | 1,023,729 | 1,174,596 | 130 | 113 | 39,424,900 | 67,148,100 | 2021 | 1,826,625 | 2,530,288 | 962,045 | 1,620,766 | 131 | 166 | 39,919,900 | 60,779,300 | 2020 | 856,400 | 594,579 | 682,275 | 472,481 | 96 | 139 | 29,823,300 | 46,286,200 |
| (1) | The PEO listed in the table for all years presented includes Brett D. Heffes, Chief Executive Officer. |
| (2) | The dollar amounts reported in this column represent the amount of “Compensation Actually Paid” to Mr. Heffes as computed in accordance with Item 402(v) of Regulation S-K. The dollar amounts do not reflect the actual amount of compensation earned by or paid to Mr. Heffes during the applicable year. In accordance with the requirements of Item 402(v) of Regulation S-K, the following adjustments were made to Mr. Heffes’ total compensation for each year to determine the compensation actually paid: |
| | | | | | Adjustments to Determine Compensation Actually Paid for PEO | 2024 ($) | 2023 ($) | 2022 ($) | 2021 ($) | 2020 ($) | Subtraction for values reported in the Option Awards column of the Summary Compensation Table | (674,282) | (321,278) | (591,845) | (615,355) | (226,000) | Addition of year-end fair value of Option Awards granted during the year that are outstanding and unvested as of the end of the year | 755,230 | 598,966 | 858,464 | 602,093 | 301,720 | Addition (subtraction) for the change in the fair value at the end of the year from the prior year end for Option Awards granted in prior years that are outstanding and unvested as of the end of the year | (420,614) | 3,074,007 | 141,517 | 462,835 | (117,983) | Addition (subtraction) for the change in the fair value at the vesting date from the prior year end for Option Awards granted in prior years that vested in the year | (400,944) | 1,458,217 | (91,726) | 254,090 | (219,558) |
| (3) | The Non-PEO NEOs listed in the table for all years presented include Anthony D. Ishaug, Chief Financial Officer and Treasurer, and Renae M. Gaudette, Chief Operating Officer. |
| (4) | The dollar amounts reported in this column represent the amount of “Compensation Actually Paid” to the Non PEO NEOs as computed in accordance with Item 402(v) of Regulation S-K. The dollar amounts do not reflect the actual amount of compensation earned by or paid to the Non-PEO NEOs during the applicable year. In accordance with the requirements of Item 402(v) of Regulation S-K, the following adjustments were made to the average of the Non-PEO NEOs total compensation for each year to determine the compensation actually paid: |
| | | | | | Adjustments to Determine Compensation Actually Paid for Non-PEO NEOs | 2024 ($) | 2023 ($) | 2022 ($) | 2021 ($) | 2020 ($) | Subtraction for values reported in the Option Awards column of the Summary Compensation Table | (376,567) | (179,354) | (326,909) | (325,775) | (211,875) | Addition of year-end fair value of Option Awards granted during the year that are outstanding and unvested as of the end of the year | 421,790 | 334,374 | 475,051 | 366,876 | 282,863 | Addition (subtraction) for the change in the fair value at the end of the year from the prior year end for Option Awards granted in prior years that are outstanding and unvested as of the end of the year | (227,421) | 1,837,904 | 94,204 | 410,244 | (96,591) | Addition (subtraction) for the change in the fair value at the vesting date from the prior year end for Option Awards granted in prior years that vested in the year | (259,565) | 954,992 | (91,479) | 207,376 | (184,191) |
| (5) | The peer group is the NASDAQ US Benchmark Retail TR industry index, of which Winmark is a component. |
| (6) | Our company-selected measure, which is the measure we believe represents the most important financial performance measure not otherwise presented in the table above that is used to link compensation to company performance, is royalty revenues, a GAAP measure. |
|
|
|
|
|
| Company Selected Measure Name |
royalty revenues
|
|
|
|
|
| Named Executive Officers, Footnote |
| (1) | The PEO listed in the table for all years presented includes Brett D. Heffes, Chief Executive Officer. |
| (3) | The Non-PEO NEOs listed in the table for all years presented include Anthony D. Ishaug, Chief Financial Officer and Treasurer, and Renae M. Gaudette, Chief Operating Officer. |
|
|
|
|
|
| Peer Group Issuers, Footnote |
| (5) | The peer group is the NASDAQ US Benchmark Retail TR industry index, of which Winmark is a component. |
|
|
|
|
|
| PEO Total Compensation Amount |
$ 1,832,143
|
$ 1,618,639
|
$ 1,838,665
|
$ 1,826,625
|
$ 856,400
|
| PEO Actually Paid Compensation Amount |
$ 1,091,533
|
6,428,551
|
2,155,075
|
2,530,288
|
594,579
|
| Adjustment To PEO Compensation, Footnote |
| | | | | | Adjustments to Determine Compensation Actually Paid for PEO | 2024 ($) | 2023 ($) | 2022 ($) | 2021 ($) | 2020 ($) | Subtraction for values reported in the Option Awards column of the Summary Compensation Table | (674,282) | (321,278) | (591,845) | (615,355) | (226,000) | Addition of year-end fair value of Option Awards granted during the year that are outstanding and unvested as of the end of the year | 755,230 | 598,966 | 858,464 | 602,093 | 301,720 | Addition (subtraction) for the change in the fair value at the end of the year from the prior year end for Option Awards granted in prior years that are outstanding and unvested as of the end of the year | (420,614) | 3,074,007 | 141,517 | 462,835 | (117,983) | Addition (subtraction) for the change in the fair value at the vesting date from the prior year end for Option Awards granted in prior years that vested in the year | (400,944) | 1,458,217 | (91,726) | 254,090 | (219,558) |
|
|
|
|
|
| Non-PEO NEO Average Total Compensation Amount |
$ 1,019,428
|
906,715
|
1,023,729
|
962,045
|
682,275
|
| Non-PEO NEO Average Compensation Actually Paid Amount |
$ 577,666
|
3,854,631
|
1,174,596
|
1,620,766
|
472,481
|
| Adjustment to Non-PEO NEO Compensation Footnote |
| | | | | | Adjustments to Determine Compensation Actually Paid for Non-PEO NEOs | 2024 ($) | 2023 ($) | 2022 ($) | 2021 ($) | 2020 ($) | Subtraction for values reported in the Option Awards column of the Summary Compensation Table | (376,567) | (179,354) | (326,909) | (325,775) | (211,875) | Addition of year-end fair value of Option Awards granted during the year that are outstanding and unvested as of the end of the year | 421,790 | 334,374 | 475,051 | 366,876 | 282,863 | Addition (subtraction) for the change in the fair value at the end of the year from the prior year end for Option Awards granted in prior years that are outstanding and unvested as of the end of the year | (227,421) | 1,837,904 | 94,204 | 410,244 | (96,591) | Addition (subtraction) for the change in the fair value at the vesting date from the prior year end for Option Awards granted in prior years that vested in the year | (259,565) | 954,992 | (91,479) | 207,376 | (184,191) |
|
|
|
|
|
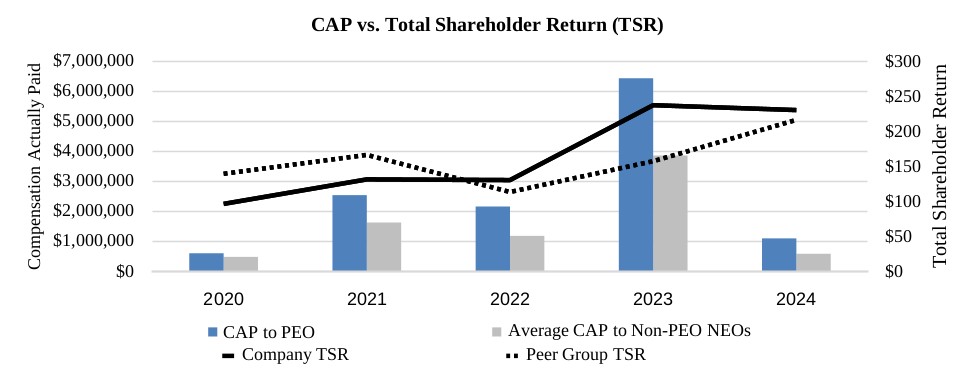
| Compensation Actually Paid vs. Total Shareholder Return |
|
|
|
|
|
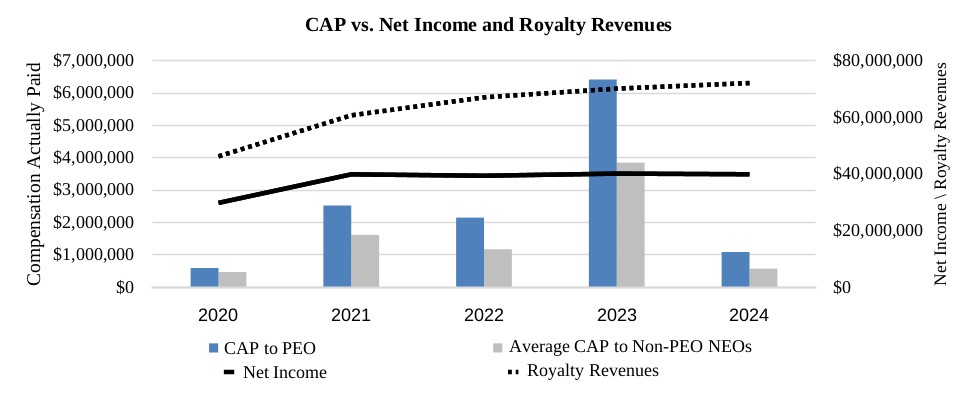
| Compensation Actually Paid vs. Net Income |
|
|
|
|
|
| Compensation Actually Paid vs. Company Selected Measure |
|
|
|
|
|
| Total Shareholder Return Vs Peer Group |
|
|
|
|
|
| Total Shareholder Return Amount |
$ 230
|
237
|
130
|
131
|
96
|
| Peer Group Total Shareholder Return Amount |
216
|
157
|
113
|
166
|
139
|
| Net Income (Loss) |
$ 39,954,200
|
$ 40,178,100
|
$ 39,424,900
|
$ 39,919,900
|
$ 29,823,300
|
| Company Selected Measure Amount |
72,198,500
|
70,230,700
|
67,148,100
|
60,779,300
|
46,286,200
|
| PEO Name |
Brett D. Heffes
|
|
|
|
|
| Measure:: 1 |
|
|
|
|
|
| Pay vs Performance Disclosure |
|
|
|
|
|
| Non-GAAP Measure Description |
| (6) | Our company-selected measure, which is the measure we believe represents the most important financial performance measure not otherwise presented in the table above that is used to link compensation to company performance, is royalty revenues, a GAAP measure. |
|
|
|
|
|
| PEO | Year-end Fair Value of Equity Awards Granted in Covered Year that are Outstanding and Unvested |
|
|
|
|
|
| Pay vs Performance Disclosure |
|
|
|
|
|
| Adjustment to Compensation, Amount |
$ 755,230
|
$ 598,966
|
$ 858,464
|
$ 602,093
|
$ 301,720
|
| PEO | Year-over-Year Change in Fair Value of Equity Awards Granted in Prior Years That are Outstanding and Unvested |
|
|
|
|
|
| Pay vs Performance Disclosure |
|
|
|
|
|
| Adjustment to Compensation, Amount |
(420,614)
|
3,074,007
|
141,517
|
462,835
|
(117,983)
|
| PEO | Change in Fair Value as of Vesting Date of Prior Year Equity Awards Vested in Covered Year |
|
|
|
|
|
| Pay vs Performance Disclosure |
|
|
|
|
|
| Adjustment to Compensation, Amount |
(400,944)
|
1,458,217
|
(91,726)
|
254,090
|
(219,558)
|
| PEO | Option Awards Value In Summary Compensation Table (Grant Date Value) |
|
|
|
|
|
| Pay vs Performance Disclosure |
|
|
|
|
|
| Adjustment to Compensation, Amount |
(674,282)
|
(321,278)
|
(591,845)
|
(615,355)
|
(226,000)
|
| Non-PEO NEO | Year-end Fair Value of Equity Awards Granted in Covered Year that are Outstanding and Unvested |
|
|
|
|
|
| Pay vs Performance Disclosure |
|
|
|
|
|
| Adjustment to Compensation, Amount |
421,790
|
334,374
|
475,051
|
366,876
|
282,863
|
| Non-PEO NEO | Year-over-Year Change in Fair Value of Equity Awards Granted in Prior Years That are Outstanding and Unvested |
|
|
|
|
|
| Pay vs Performance Disclosure |
|
|
|
|
|
| Adjustment to Compensation, Amount |
(227,421)
|
1,837,904
|
94,204
|
410,244
|
(96,591)
|
| Non-PEO NEO | Change in Fair Value as of Vesting Date of Prior Year Equity Awards Vested in Covered Year |
|
|
|
|
|
| Pay vs Performance Disclosure |
|
|
|
|
|
| Adjustment to Compensation, Amount |
(259,565)
|
954,992
|
(91,479)
|
207,376
|
(184,191)
|
| Non-PEO NEO | Option Awards Value In Summary Compensation Table (Grant Date Value) |
|
|
|
|
|
| Pay vs Performance Disclosure |
|
|
|
|
|
| Adjustment to Compensation, Amount |
$ (376,567)
|
$ (179,354)
|
$ (326,909)
|
$ (325,775)
|
$ (211,875)
|
