Auto Insurance Shopping Continued to Rise Even as Rates Stabilized in Q2 2024
13 August 2024 - 10:00PM

Auto insurance shopping volume set a new record for the second
consecutive quarter, according to new research from TransUnion
(NYSE: TRU). The number of U.S. consumers shopping for auto
insurance was up 7%, compared to Q2 2023 (YoY).
This trend has been driven in recent years by
increasing insurance premiums that motivated consumers to shop for
lower rates. However, for the first time since December 2021, the
month-to-month Consumer Price Index for Motor Vehicle Insurance
decreased—a 0.2% drop that occurred between April 2024 and May
2024.
The slight shift could signal that insurers are
approaching rate adequacy and prospective loss trends could be
moderating. These insights and more are part of TransUnion’s latest
quarterly Insurance Personal Lines Trends and Perspectives
Report.
“It is very encouraging to see indicators that
carriers are returning to rate adequacy, and ultimately
profitability,” said Stothard Deal, vice president of strategic
planning for TransUnion’s insurance business. “TransUnion’s
research has uncovered ways for insurers to accelerate the move to
profitability and prepare to resume marketing activity in a
more-efficient manner.”
Driving record and violation
insightsOne means for carriers to shorten the path to
profitability is by leveraging court records in addition to state
Motor Vehicle Records (MVR) to assess driving history. Beginning
with the pandemic, states across the U.S. began issuing fewer
traffic violations, which insurers have used to price and
underwrite risks.
Due to a lower number of violations issued, auto
insurers have been capturing fewer dollars in surcharge premiums,
thereby contributing to negative premium trends. TransUnion
estimates the declining volume of traffic violations starting in
2020 has cost the auto insurance industry an estimated $200 million
per year in lost premium capture.
In addition, more states have adopted automated
traffic enforcement, though reporting varies significantly. For
example, 17 of the 27 states that currently use automated traffic
enforcement prohibit the use of these violations in insurance
rating and underwriting. As a result, from 2019 to 2023, states
with automated enforcement saw a 25% decrease in violations
compared to a 5% decrease in states without.
The issue is further complicated by inefficient
sharing of violation information between states. While 48 states
have inter-state violation sharing programs, only 24 execute them
effectively. This often means drivers with dangerous prior
violations can relocate to a new state, potentially leaving their
histories behind.
Violations increasingly predict
lossIn 2019, 42% of accidents involved drivers who had
traffic violations within the prior three years. In 2022, that
number jumped to 51%— meaning the predictive power of using prior
violation history to project future auto insurance losses has
increased during this period despite a lower number of total
violations issued.
The confluence of these factors—fewer violations,
unusable automated traffic citations, and a lack of inter-state
violation history sharing—means that insurers are significantly
hindered from accurately pricing risk. Compounding this issue is
that most insurers rely on MVRs to access driving histories.
While MVRs are subject to some of these same
limitations, TransUnion has found court records offer a clearer
view of violation activity, returning over four times the number of
ratable out-of-service (OOS) violations compared to state MVRs.
Additionally, court record data is more cost effective than carrier
processes that depend solely on MVR data.
Click here to read the latest Insurance Personal
Lines Trends and Perspectives Report.
About TransUnion’s Insurance Personal Lines
Trends and Perspectives ReportThis quarterly publication
examines trends in the personal lines insurance industry, including
shopping, migration, violation, credit-based insurance stability
and more. The Trends and Perspectives Report research is based
almost entirely on TransUnion’s extensive internal data and
analyses. It includes information on insurance shopping
transactions from January 2023 to June 2024. However, the report
excludes shopping data from insurance customers in California,
Hawaii (auto), Massachusetts (auto), and Maryland (property), where
credit-based insurance scoring information is not used for
insurance rating or underwriting.
About TransUnion (NYSE: TRU)
TransUnion is a global information and insights company with over
13,000 associates operating in more than 30 countries. We make
trust possible by ensuring each person is reliably represented in
the marketplace. We do this with a Tru™ picture of each person: an
actionable view of consumers, stewarded with care. Through our
acquisitions and technology investments we have developed
innovative solutions that extend beyond our strong foundation in
core credit into areas such as marketing, fraud, risk and advanced
analytics. As a result, consumers and businesses can transact with
confidence and achieve great things. We call this Information for
Good® — and it leads to economic opportunity, great experiences and
personal empowerment for millions of people around the
world. http://www.transunion.com/business
|
Contact |
Dave BlumbergTransUnion |
|
|
|
|
E-mail |
david.blumberg@transunion.com |
|
|
|
|
Telephone |
312-972-6646 |
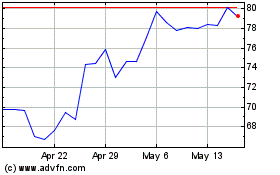
TransUnion (NYSE:TRU)
Historical Stock Chart
From Dec 2024 to Jan 2025

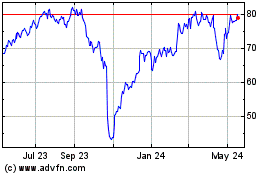
TransUnion (NYSE:TRU)
Historical Stock Chart
From Jan 2024 to Jan 2025
