Goodfellow Inc. (TSX:GDL) announced today its financial results for
the second quarter ended February 28, 2013. The Company recorded a
net loss of $(0.9) million or $(0.11) per share compared to $(0.6)
million or $(0.07) per share during the corresponding period a year
ago. Consolidated sales for the three months ended February 28,
2013 were $95.4 million compared to $101.1 million last year. Sales
during the second quarter declined due to unfavourable weather
conditions, and a reduced demand from our retailers business. The
decrease was mitigated by the increased demand for our value-added
product lines and the introduction of new product lines compared to
last year. The Canadian housing market conditions were sluggish
with new housing starts decreasing 11.7% to 178,100 units on
average (Source: CMHC) for the three months ended February 28, 2013
compared to 201,800 units during the second quarter a year ago.
Cash flow from operations (excluding non-cash working capital
income tax and interest paid) for the second quarter of Fiscal 2013
closed at $(0.8) million from $(0.4) million for the same period
last year. Operational costs during the second quarter increased
with the increased production of value added products and higher
maintenance costs during the cold winter months. As a result,
operating costs during the second quarter increased 6% compared to
the second quarter last year.
On a year-to-date basis, the Company recorded a net loss of
$(0.2) million or $(0.02) per share compared to net income of $0.3
million or $0.03 per share a year ago. Consolidated sales for the
six months ended February 28, 2013 were $207.5 million compared to
$207.2 million in the previous year. Cash flow from operations
(excluding non-cash working capital income tax and interest paid)
for the first six months of Fiscal 2013 decreased to $0.7 million
from $1.3 million for the same period last year.
"Continued global financial uncertainties, the harsh winter
across the country, and the sharp reduction in demand at the retail
customer level all added up to making Q2 a difficult one." said
Richard Goodfellow, President and Chief Executive Officer. "We
continue to be however cautiously optimistic for the spring period
with a strong order file in hand."
Goodfellow Inc. is one of eastern Canada's largest independent
re-manufacturers and distributors of lumber and hardwood flooring
products. Goodfellow shares trade on the Toronto Stock Exchange
under the symbol GDL.
GOODFELLOW INC.
Condensed Interim Consolidated Statements of Comprehensive Income
(in thousands of dollars, except per share amounts)
(unaudited)
----------------------------------------------------------------------------
----------------------------------------------------------------------------
                                       Three Months               Six Months
                                       ended Feb 28             ended Feb 28
                                   2013        2012        2013         2012
----------------------------------------------------------------------------
                                      $           $           $            $

Sales                            95,429     101,122     207,476      207,161
----------------------------------------------------------------------------

Expenses
  Cost of goods sold             77,655      84,095     168,555      169,665
  Selling, administrative
   and general expenses          18,700      17,595      38,364       36,441
  Financial costs                   367         351         809          685
----------------------------------------------------------------------------
                                 96,722     102,041     207,728      206,791
----------------------------------------------------------------------------

Earnings before income taxes     (1,293)       (919)       (252)         370

Income taxes                       (375)       (285)        (73)         115

----------------------------------------------------------------------------
Net earnings, being
 comprehensive income              (918)       (634)       (179)         255
----------------------------------------------------------------------------

Earnings per share
----------------------------------------------------------------------------

----------------------------------------------------------------------------
  Basic and diluted               (0.11)      (0.07)      (0.02)        0.03
----------------------------------------------------------------------------
GOODFELLOW INC.
Condensed Interim Consolidated Statements of Financial Position
(in thousands of dollars)
(unaudited)
----------------------------------------------------------------------------
----------------------------------------------------------------------------
                                            Feb 28       Feb 29       Aug 31
                                              2013         2012         2012
----------------------------------------------------------------------------
                                                 $            $            $
Assets
Current Assets
  Cash and cash equivalents                    572          267          707
  Trade and other receivables               58,838       58,976       83,083
  Income taxes recoverable                     511        4,934            -
  Inventories                               85,868       72,679       63,736
  Prepaid expenses                           3,670        1,874        3,474
----------------------------------------------------------------------------
Total Current Assets                       149,459      138,730      151,000

Non Current Assets
  Property, plant and equipment             36,253       36,180       35,743
  Defined benefit plan asset                   358            -            -
----------------------------------------------------------------------------
                                           186,070      174,910      186,743
----------------------------------------------------------------------------
----------------------------------------------------------------------------

Liabilities
Current liabilities
  Bank indebtedness                         45,345       33,035       37,157
  Trade and other payables                  22,036       23,658       29,060
  Income taxes payable                           -            -           22
----------------------------------------------------------------------------
Total Current Liabilities                   67,381       56,693       66,239

Non-Current Liabilities
  Provisions                                 1,457        1,513        1,442
  Long term debt                               150            -            -
  Deferred income taxes                      2,514        2,195        2,514
  Defined benefit plan obligation                -        1,239          512
----------------------------------------------------------------------------
Total Non-Current Liabilities                4,121        4,947        4,468
----------------------------------------------------------------------------

----------------------------------------------------------------------------
                                            71,502       61,640       70,707
----------------------------------------------------------------------------

Shareholders' equity
  Share capital                              9,152        9,218        9,154
  Retained earnings                        105,416      104,052      106,882
----------------------------------------------------------------------------
                                           114,568      113,270      116,036
----------------------------------------------------------------------------
                                           186,070      174,910      186,743
----------------------------------------------------------------------------
GOODFELLOW INC.
Condensed Consolidated Statements of Cash Flows
(in thousands of dollars)
(unaudited)
----------------------------------------------------------------------------
----------------------------------------------------------------------------
                                       Three Months              Six Months
                                       ended Feb 28            ended Feb 28
----------------------------------------------------------------------------
----------------------------------------------------------------------------
                                   2013        2012        2013        2012
----------------------------------------------------------------------------
                                      $           $           $           $

Cash Flows Used From
 Operating Activities
  Net Earnings                     (918)       (634)       (179)        255
  Adjustments for :
    Depreciation                    687         713       1,348       1,416
    Accretion expense on
     Provisions                       8           7          15          15
    Income tax expenses            (375)       (284)        (73)        115
    Interest expenses               197         184         411         343
    Funding in excess of
     pension plan of
     expenses                      (367)       (361)       (869)       (809)
----------------------------------------------------------------------------
                                   (768)       (375)        653       1,335
----------------------------------------------------------------------------

  Changes in non-cash
   working capital items        (14,711)     (3,335)     (5,060)     (2,592)
  Interest paid                    (247)       (274)       (460)       (402)
  Income taxes paid                (146)       (432)       (460)     (1,341)
----------------------------------------------------------------------------
                                (15,104)     (4,041)     (5,980)     (4,335)
----------------------------------------------------------------------------

Cash Flows Used By Financing
 Activities
  Increase (Decrease) in
   bank loan                     14,000       2,000       8,000      (4,000)
  (Decrease) Increase in
   banker's acceptances          (5,000)      4,000      (4,000)      9,000
  Long term debt                    150           -         150           -
  Redemption of shares                -         (32)        (14)        (32)
  Dividends paid                      -           -      (1,275)       (857)
----------------------------------------------------------------------------
                                  9,150       5,968       2,861       4,111
----------------------------------------------------------------------------

Cash Flows Used By Investing
 Activities
  Acquisition of property,
   plant and equipment             (563)       (157)     (1,857)       (472)
----------------------------------------------------------------------------
                                   (563)       (157)     (1,857)       (472)
----------------------------------------------------------------------------

Net cash (outflow) inflow        (7,285)      1,395      (4,323)        639
Cash position, beginning of
 period                          (5,488)    (10,163)     (8,450)     (9,407)
----------------------------------------------------------------------------
Cash position, end of period    (12,773)     (8,768)    (12,773)     (8,768)
----------------------------------------------------------------------------
----------------------------------------------------------------------------

Cash position is comprised
 of :
  Cash and cash equivalents         572         267         572         267
  Bank overdraft                (13,345)     (9,035)    (13,345)     (9,035)
----------------------------------------------------------------------------
                                (12,773)     (8,768)    (12,773)     (8,768)
----------------------------------------------------------------------------
GOODFELLOW INC.
Condensed Consolidated Statements of Change in Shareholder's Equity
(in thousands of dollars)
(unaudited)
----------------------------------------------------------------------------
----------------------------------------------------------------------------


                                            Share     Retained
                                          Capital     Earnings        Total
----------------------------------------------------------------------------
                                                $            $            $

Balance as at August 31, 2012               9,154      106,882      116,036
----------------------------------------------------------------------------

Net earnings                                    -         (179)        (179)

Transactions with owners, recorded
 directly in equity

  Dividends                                     -       (1,275)      (1,275)
  Share repurchased                            (2)         (12)         (14)
----------------------------------------------------------------------------
Balance as at February 28, 2013             9,152      105,416      114,568
----------------------------------------------------------------------------


                                            Share     Retained
                                          Capital     Earnings        Total
----------------------------------------------------------------------------
                                                $            $            $

Balance as at August 31, 2011               9,222      104,682      113,904
----------------------------------------------------------------------------

Net earnings                                    -          255          255

Transactions with owners, recorded
 directly in equity

  Dividends                                     -         (857)        (857)
  Share repurchased                            (4)         (28)         (32)
----------------------------------------------------------------------------

----------------------------------------------------------------------------
Balance as at February 29, 2012             9,218      104,052      113,270
----------------------------------------------------------------------------
Contacts: Goodfellow Inc. Richard Goodfellow President and CEO
(450) 635-6511 (450) 635-3730 (FAX)info@goodfellowinc.com
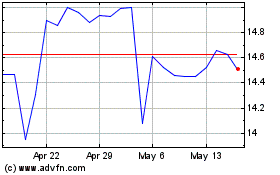
Goodfellow (TSX:GDL)
Historical Stock Chart
From Dec 2024 to Jan 2025

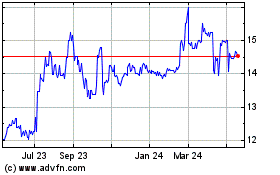
Goodfellow (TSX:GDL)
Historical Stock Chart
From Jan 2024 to Jan 2025
