Goodfellow Reports Its Results for the Second Quarter Ended May 31, 2024
11 July 2024 - 9:41AM

Goodfellow Inc. (TSX: GDL) (the “Company” or “Goodfellow”)
announced today its financial results for the second quarter ended
May 31, 2024.
The Company reported net earnings of $5.3
million or $0.62 per share compared to net earnings of $6.6 million
or $0.77 per share a year ago. Consolidated sales for the three
months ended May 31, 2024 were $140.3 million compared to $142.3
million last year.
For the six months ended May 31, 2024, the
Company reported net earnings of $5.2 million or $0.61 per share
compared to net earnings of $6.4 million or $0.75 per share a year
ago, while consolidated sales were $245.7 million compared to
$248.3 million last year.
Goodfellow continues to navigate a broader
economic landscape characterized by low consumer confidence and
sluggish new housing starts. These conditions have impacted
industry growth and shifted demand towards different types of
products within the Company’s portfolio. Goodfellow’s offering is
well positioned to cater to this evolving demand, ensuring revenue
and margin stability even as certain segments experience
fluctuations.
About Goodfellow
Goodfellow is a diversified manufacturer of
value-added lumber products, as well as a wholesale distributor of
building materials and floor coverings. Goodfellow has a
distribution footprint from coast-to-coast in Canada servicing
commercial and residential sectors through lumber yard retailer
networks, manufacturers, industrial and infrastructure project
partners, and floor covering specialists. Goodfellow also leverages
its value-added product capabilities to serve lumber markets
internationally. Goodfellow Inc. is a publicly traded company, and
its shares are listed on the Toronto Stock Exchange under the
symbol “GDL”.
|
GOODFELLOW INC. |
|
|
|
|
|
Consolidated Statements of Comprehensive
Income |
|
|
|
|
| For
the three and six months ended May 31, 2024 and 2023 |
|
|
|
|
| (in
thousands of dollars, except per share amounts) |
|
|
|
|
|
Unaudited |
|
|
|
|
|
|
|
|
|
|
|
|
For the three months ended |
For the six months ended |
|
|
May 31 2024 |
May 31 2023 |
May 31 2024 |
May 31 2023 |
|
|
$ |
$ |
$ |
$ |
| |
|
|
|
|
|
Sales |
140,334 |
142,326 |
245,668 |
248,251 |
|
Expenses |
|
|
|
|
|
Cost of goods sold |
106,199 |
110,034 |
188,745 |
194,294 |
|
Selling, administrative and general expenses |
26,108 |
22,239 |
48,992 |
43,923 |
|
Net financial costs |
652 |
921 |
707 |
1,195 |
|
|
132,959 |
133,194 |
238,444 |
239,412 |
|
|
|
|
|
|
| Earnings
before income taxes |
7,375 |
9,132 |
7,224 |
8,839 |
| |
|
|
|
|
| Income
taxes |
2,066 |
2,557 |
2,023 |
2,475 |
|
|
|
|
|
|
|
Total comprehensive income |
5,309 |
6,575 |
5,201 |
6,364 |
| |
|
|
|
|
|
|
|
|
|
|
|
Net earnings per share – Basic and Diluted |
0.62 |
0.77 |
0.61 |
0.75 |
|
GOODFELLOW INC. |
|
|
|
|
Consolidated Statements of Financial Position |
|
|
|
| (in
thousands of dollars) |
|
|
|
|
Unaudited |
|
|
|
|
|
As at |
As at |
As at |
|
|
May 31 2024 |
November 30 2023 |
May 31 2023 |
|
|
$ |
$ |
$ |
|
Assets |
|
|
|
|
Current Assets |
|
|
|
|
Cash |
4,822 |
28,379 |
3,171 |
|
Trade and other receivables |
95,546 |
53,674 |
87,163 |
|
Income taxes receivable |
7,286 |
6,286 |
6,001 |
|
Inventories |
130,239 |
98,473 |
122,268 |
|
Prepaid expenses |
2,536 |
4,215 |
2,263 |
|
Total Current Assets |
240,429 |
191,027 |
220,866 |
| |
|
|
|
|
Non-Current Assets |
|
|
|
|
Property, plant and equipment |
34,631 |
32,761 |
32,405 |
|
Intangible assets |
1,192 |
1,487 |
1,795 |
|
Right-of-use assets |
9,993 |
11,354 |
12,916 |
|
Defined benefit plan asset |
15,264 |
15,347 |
11,760 |
|
Other assets |
1,227 |
777 |
802 |
|
Total Non-Current Assets |
62,307 |
61,726 |
59,678 |
|
Total Assets |
302,736 |
252,753 |
280,544 |
|
|
|
|
|
|
Liabilities |
|
|
|
|
Current Liabilities |
|
|
|
|
Bank indebtedness |
35,883 |
- |
34,002 |
|
Trade and other payables |
52,645 |
37,620 |
36,553 |
|
Provision |
2,774 |
2,789 |
2,252 |
|
Current portion of lease liabilities |
4,170 |
4,732 |
4,748 |
|
Total Current Liabilities |
95,472 |
45,141 |
77,555 |
| |
|
|
|
|
Non-Current Liabilities |
|
|
|
|
Provision |
- |
- |
770 |
|
Lease liabilities |
7,373 |
8,497 |
10,189 |
|
Deferred income taxes |
4,112 |
4,112 |
3,431 |
|
Total Non-Current Liabilities |
11,485 |
12,609 |
14,390 |
|
Total Liabilities |
106,957 |
57,750 |
91,945 |
|
|
|
|
|
|
Shareholders’ Equity |
|
|
|
|
Share capital |
9,366 |
9,379 |
9,394 |
|
Retained earnings |
186,413 |
185,624 |
179,205 |
|
|
195,779 |
195,003 |
188,599 |
|
Total Liabilities and Shareholders’ Equity |
302,736 |
252,753 |
280,544 |
|
GOODFELLOW INC. |
|
|
|
|
|
Consolidated Statements of Cash Flows |
|
|
|
|
|
For the three and six months ended May 31, 2024 and May 31,
2023 |
|
|
|
(in thousands of dollars) Unaudited |
|
|
|
|
|
For the three months ended |
For the six months ended |
|
|
May 31 2024 |
May 31 2023 |
May 31 2024 |
May 31 2023 |
|
|
$ |
$ |
$ |
$ |
|
Operating Activities |
|
|
|
|
|
Net earnings |
5,309 |
6,575 |
5,201 |
6,364 |
|
Adjustments for: |
|
|
|
|
|
Depreciation and amortization of: |
|
|
|
|
|
Property, plant and equipment |
882 |
795 |
1,717 |
1,540 |
|
Intangible assets |
148 |
150 |
295 |
301 |
|
Right-of-use assets |
1,089 |
1,188 |
2,123 |
2,445 |
|
Gain on disposal of property, plant and equipment |
(69) |
(171) |
(77) |
(181) |
|
Accretion expense on provision |
- |
68 |
- |
136 |
|
Provision |
(4) |
(7) |
(15) |
(29) |
|
Income taxes |
2,066 |
2,557 |
2,023 |
2,475 |
|
Interest expense |
330 |
481 |
375 |
569 |
|
Interest on lease liabilities |
137 |
158 |
274 |
140 |
|
Funding in excess (deficit) of pension plan expense |
189 |
(70) |
83 |
(140) |
|
Other |
7 |
(10) |
8 |
(139) |
|
|
10,084 |
11,714 |
12,007 |
13,481 |
|
|
|
|
|
|
|
Changes in non-cash working capital items |
(24,366) |
(15,844) |
(56,876) |
(32,124) |
|
Interest paid |
(518) |
(632) |
(707) |
(740) |
|
Income taxes paid |
(1,098) |
(3,019) |
(3,023) |
(6,037) |
|
|
(25,982) |
(19,495) |
(60,606) |
(38,901) |
|
Net Cash Flows from Operating Activities |
(15,898) |
(7,781) |
(48,599) |
(25,420) |
|
|
|
|
|
|
|
Financing Activities |
|
|
|
|
|
Net increase (decrease) in bank loans |
6,000 |
(2,000) |
6,000 |
- |
|
Net increase in banker’s acceptances |
- |
23,000 |
- |
28,000 |
|
Net increase in CORRA loans |
18,000 |
- |
18,000 |
- |
|
Payment of lease liabilities |
(1,257) |
(1,287) |
(2,456) |
(2,792) |
|
Redemption of shares |
(50) |
(150) |
(169) |
(270) |
|
Dividends paid |
(4,256) |
(4,274) |
(4,256) |
(4,274) |
|
Net Cash Flows from Financing Activities |
18,437 |
15,289 |
17,119 |
20,664 |
|
|
|
|
|
|
|
Investing Activities |
|
|
|
|
|
Acquisition of property, plant and equipment |
(2,618) |
(839) |
(3,900) |
(1,683) |
|
Proceeds on disposal of property, plant and equipment |
382 |
178 |
390 |
188 |
|
Other assets |
(450) |
- |
(450) |
- |
|
Net Cash Flows from Investing Activities |
(2,686) |
(661) |
(3,960) |
(1,495) |
|
|
|
|
|
|
| Net cash
(outflow) inflow |
(147) |
6,847 |
(35,440) |
(6,251) |
|
Cash position, beginning of period |
(6,914) |
(9,678) |
28,379 |
3,420 |
|
Cash position, end of period |
(7,061) |
(2,831) |
(7,061) |
(2,831) |
|
GOODFELLOW INC. |
|
Consolidated Statements of Changes in Shareholders’
Equity |
| For
the six months ended May 31, 2024 and May 31, 2023 |
| (in
thousands of dollars) Unaudited |
| |
|
|
Share Capital |
Retained Earnings |
Total |
|
|
$ |
$ |
$ |
| |
|
|
|
|
Balance as at November 30, 2022 |
9,419 |
177,360 |
186,779 |
|
|
|
|
|
|
Net earnings |
- |
6,364 |
6,364 |
|
|
|
|
|
|
Total comprehensive income |
- |
6,364 |
6,364 |
|
|
|
|
|
|
Dividend |
- |
(4,274) |
(4,274) |
|
Redemption of Shares |
(25) |
(245) |
(270) |
|
|
|
|
|
|
Balance as at May 31, 2023 |
9,394 |
179,205 |
188,599 |
|
|
|
|
|
| |
|
|
|
| |
|
|
|
|
Balance as at November 30, 2023 |
9,379 |
185,624 |
195,003 |
| |
|
|
|
|
Net earnings |
- |
5,201 |
5,201 |
|
|
|
|
|
|
Total comprehensive income |
- |
5,201 |
5,201 |
|
|
|
|
|
|
Dividend |
- |
(4,256) |
(4,256) |
|
Redemption of Shares |
(13) |
(156) |
(169) |
|
|
|
|
|
|
Balance as at May 31, 2024 |
9,366 |
186,413 |
195,779 |
|
From: |
Goodfellow
Inc. |
| |
Patrick Goodfellow |
| |
President and CEO |
| |
T: 450 635-6511 |
| |
F: 450 635-3730 |
| |
info@goodfellowinc.com |
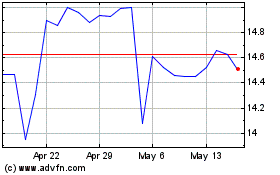
Goodfellow (TSX:GDL)
Historical Stock Chart
From Nov 2024 to Dec 2024

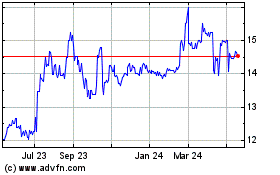
Goodfellow (TSX:GDL)
Historical Stock Chart
From Dec 2023 to Dec 2024
