Trisura Group Announces Results of Annual Meeting of Shareholders
05 June 2024 - 4:05AM

Trisura Group Ltd. (“Trisura Group” or the “Company”) (TSX: TSU)
today announced the results of the Company’s annual meeting of
shareholders held on June 3, 2024 in Toronto (the “Meeting”).
At the Meeting, all nine nominees proposed for
election to the Board by Shareholders were elected. Management
received the following proxies from Shareholders in regard to the
election of directors:
|
Director Nominee |
Votes For |
% |
Votes Withheld |
% |
|
David Clare |
33,530,663 |
98.25% |
597,786 |
1.75% |
|
Paul Gallagher |
32,118,368 |
94.11% |
2,010,081 |
5.89% |
|
Sacha Haque |
33,658,204 |
98.62% |
470,245 |
1.38% |
|
Barton Hedges |
33,599,955 |
98.45% |
528,494 |
1.55% |
|
Anik Lanthier |
33,601,593 |
98.46% |
526,856 |
1.54% |
|
Janice Madon |
33,594,631 |
98.44% |
533,818 |
1.56% |
|
George E. Myhal |
30,614,846 |
89.70% |
3,513,603 |
10.30% |
|
Lilia Sham |
33,659,553 |
98.63% |
468,896 |
1.37% |
|
Robert Taylor |
32,840,051 |
96.22% |
1,288,398 |
3.78% |
About Trisura Group
Trisura Group Ltd. is a specialty insurance
provider operating in the Surety, Risk Solutions, Corporate
Insurance, and Fronting business lines of the market. Trisura has
investments in wholly owned subsidiaries through which it conducts
insurance and reinsurance operations. Those operations are
primarily in Canada and the United States. Trisura Group Ltd. is
listed on the Toronto Stock Exchange under the symbol “TSU”.
Further information is available
at www.trisura.com. Important information may be disseminated
exclusively via the website; investors should consult the site to
access this information. Details regarding the operations of
Trisura Group Ltd. are also set forth in regulatory filings. A copy
of the filings may be obtained on Trisura Group’s SEDAR+ profile
at www.sedarplus.ca.
For more information, please contact:
Name: Bryan SinclairTel: 416 607 2135Email:
bryan.sinclair@trisura.com
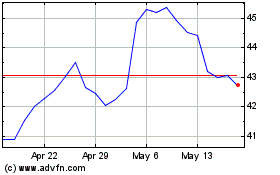
Trisura (TSX:TSU)
Historical Stock Chart
From May 2024 to Jun 2024

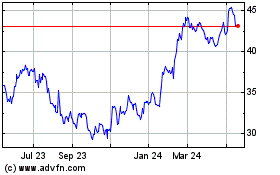
Trisura (TSX:TSU)
Historical Stock Chart
From Jun 2023 to Jun 2024
