Richmond Minerals Inc.
(TSX-V: RMD) (“Richmond” or the
“Company”) is pleased to announce the closing of a
non-brokered private placement of common shares at a price of $0.05
per share, for gross proceeds of up to $340,000 (the "Private
Placement"). Two of the subscribers in the Private Placement are
related parties of the Company.
The company is also pleased to provide an update
for exploration work at the Company’s Ridley Lake Gold Project (the
“Property”) located in the west central area of the Swayze
Greenstone belt approximately 35 kilometres east of Newmont's
Borden Gold Project.
Furthermore the company informs about the future
holdings and strategy for the Austrian exploration projects.
Private Placement
The Company completed the Private Placement and
issued a total of 6,800,000 common shares at a price of $0.05 per
share. As a result of the Private Placement, KNP Group Inc., a
company controlled by Phillip Chong, the CFO of the Company, has
become a new insider of the Company. KNP Group Inc. acquired
4,000,000 common shares in the capital of the Company, representing
approximately 11% of the issued and outstanding shares of the
Company. Prior to the completion of the Private Placement neither
Mr. Chong nor KNP Group Inc. held any common shares of the
Company.
Share for Debt Transaction
The Company also completed a share for debt
transaction with two related parties of the Company settling an
aggregate debt of $52,725.35. The Company issued a total of
1,054,507 common shares to satisfy such debts at a deemed price per
share of $0.05 (the "Share for Debt Transaction"). The creditors
include Franz Kozich, the CEO and a director of the Company, and a
company affiliated with Thomas Unterweissacher, a director of the
Company, each of whom is a related party to the Company.
The Private Placement and the Share for Debt
Transaction each constitute a “related party transaction” under
Multilateral Instrument 61-101 - Protection of Minority
Securityholders in Special Transactions (“MI 61-101”), in respect
of the related parties participating in such transaction. However,
each transaction is exempt from: (i) the valuation requirements of
MI 61-101 by virtue of the exemption contained in Section 5.5(b) of
MI 61-101, as the common shares of the Company are not listed on a
market specified in MI 61-101, and (ii) from the minority
shareholder approval requirements of MI 61-101, by virtue of the
exemption contained in Section 5.7(1)(a) of MI 61-101, as the fair
market value of the common shares to be issued in such transactions
will not exceed 25% of the Company's market capitalization. The
participation by related parties in the Private Placement and the
Share for Debt Transaction has been approved by directors of the
Company who are independent in respect of such transactions.
Exploration at Ridley Lake Gold
ProjectAs reported in 2015 and 2016 IP and Magnetic
surveys were successful in identifying well-defined geophysical
anomalies characterized by high chargeability and resistivity with
prominent coincidental magnetic anomalies (the “Aguara East
anomalies”), having a northeast orientation and a strike length in
excess of 825 metres. Modeling of the data obtained from the July
2015 and November 2016 combined surveys identified multiple targets
at vertical depths down to the IP survey limit of approximately 200
metres. Drill testing of these IP/Mag targets in the Aguara Zone in
2017 and 2020 yielded drill intersections high-lighted by 18.3 g/t
gold over 3 m in hole RS-20-33 (from 329m to 332m) and 0.33 g/t
gold over 136 m in hole RS-17-30. In December 2023 the Company
completed 17.15 km of Spectral Induced Polarization
(IP)/Resistivity (dipole-dipole, a=50 m, n= 1 to 6) and Magnetic
surveys (the "Survey") to test for anomalous responses at the Cyril
Knight Zone located approximately 800 m due north of the Aguara
Zone.
Overall the IP/Resistivity Survey of the Cyril
Knight Grid resulted in unusual anomalies. The contour map apparent
chargeability (mV/V), derived from the combined data of the Cyril
Knight, Aguara East and, Aguara West Grids, show two, markedly
different apparent chargeability regimes. The southern Regime IP-A,
that covers the Aguara East and Aguara West grids is characterized
by northwest striking, discrete, well defined IP anomalous trends,
as opposed to the northern Cyril Knight Zone Regime IP-B where the
anomalous responses are broad and continuous along almost entire
survey lines.
Specifically,
seven IP anomalous horizons were identified within
the IP-B regime. The trends are sub-parallel and confirm with the
northeast trending geology. The trends are identified as
trends RW-1, RW-4, RW-5, RIP-6 and the
discontinuous trend RW-7.
The significant trend is RW-1 and may form the
westerly continuation of the Trend RIP-1A of the Aguara East Grid
and is centered about the Cyril Knight Grid base line 0 extending
to L600W located between Lines 75W and 150W. The trend is
associated with apparent resistivities exceeding 10,000 ohm-m and
is suggestive of possible strong alteration within this area of the
Property.
The prominent apparent chargeability anomalous
trend identified as RW-5 extends from L225W to L750W and is found
within the northern area of the grid and may represent the
extension of Trend RIP-5 of the Aguara East Gri. RW-5 is
characterized by apparent resistivities of 1,000 ohm-m or lower.
Further west of L750W the signatures become complex and imply the
depth of these wide source(s) may be 100 m or greater.
Trend RW-6 consists of anomalous IP responses
that were observed at dipole separations n=8 and n=9, and are
indicative of deeper sources. The associated resistivities here
exceed 10,000 ohm-m and may also be associated with strong
alteration. It is noted the wide anomalous IP responses with larger
dipole separations (n=7, 8 and 9) at L900W may be in part of the
northwesterly extension of RW-6.
Trend RW-7 is detected intermittently at larger
dipole separations indicating greater depths to the sources. The
trend is located between Trend RW-5 in the north and RW-1 on the
south and is well defined along Lines 525W 375W and 300W.
Significantly, the associated apparent resistivities are more than
10,000 ohm-m. Company management believes this trend is very
promising and worthy of follow-up drill testing.
Trend RW-4 is noted in pseudo-sections from L75W
to L375W. It is characterized by apparent chargeabilities exceeding
10 mV/V. RW-4 is the westerly extension of RIP-6 of the East
grid. A formational source is suspected.
Multiple drill hole collar locations have been
recommended for follow-up testing of these new targets. Plans are
underway for the resumption of drilling in early summer of
2024.
Austrian Projects Update
Oberzeiring Polymetallic ProjectThe 99
exploration licenses near the village of Oberzeiring expired on
31st December 2023. The licenses had been acquired from Silbermine
Zeiring GmbH on March 12 2020. A number of unpredictably burdensome
circumstances arose relating to this project, and the company
decided to halt exploration activities and focus on its more
promising Canadian projects. Richmond plans to phase out all
Austrian projects in the coming months.
Warren Hawkins, P.Eng, a “Qualified Person”,
within the meaning of Nation Instrument 43-101- Standards of
Disclosure for Minerals Projects, has reviewed and approved the
scientific and technical information contained in this news
release. Mr. Hawkins is not considered to be “independent” of the
Corporation (as defined in National Instrument 43-101), as he
currently holds securities of the Corporation.
Neither the TSX
Venture Exchange nor its Regulation Services Provider (as that term
is defined in the policies of the TSX Venture Exchange) accepts
responsibility for the adequacy or accuracy of this news
release.
On Behalf of Richmond
Minerals,
David
Ellis
President, Richmond
Minerals Inc.
For further
information: David Ellis at (416) 603-2114
Cautionary Note
Regarding Forward-Looking Statements: Certain disclosure in this
release constitutes forward-looking statements. In making the
forward-looking statements in this release, the Company has applied
certain factors and assumptions that are based on the Company’s
current beliefs as well as assumptions made by and information
currently available to the Company. Although the Company considers
these assumptions to be reasonable based on information currently
available to it, they may prove to be incorrect, and the
forward-looking statements in this release are subject to numerous
risks, uncertainties and other factors that may cause future
results to differ materially from those expressed or implied in
such forward-looking statements. Readers are cautioned not to place
undue reliance on forward-looking statements. The Company
does not intend, and expressly disclaims
any intention or obligation to update
or revise any forward-looking statements whether as
a result of new information, future events or otherwise, except as
required by law.
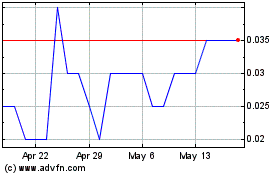
Richmond Minerals (TSXV:RMD)
Historical Stock Chart
From Oct 2024 to Nov 2024

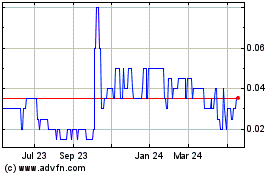
Richmond Minerals (TSXV:RMD)
Historical Stock Chart
From Nov 2023 to Nov 2024
