ALKM Breaks $0.0015 50 Day MA; Heading Back To $0.009 52 Week High?
02 September 2021 - 2:50AM
InvestorsHub NewsWire
September 1, 2021 -- InvestorsHub NewsWire -- via
pennymillions--
Alkame Holdings, Inc. (ALKM)
has broken through its 50 Day Moving Average (MA) in trading today
on 50 plus million shares in trading volume. The ALKM 52 week high
is $0.009.
Alkame (CE) (USOTC:ALKM)
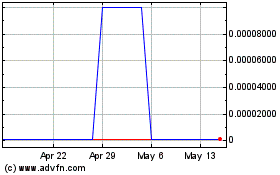
Historical Stock Chart
From Jan 2025 to Feb 2025

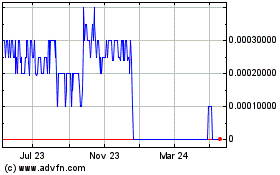
Alkame (CE) (USOTC:ALKM)
Historical Stock Chart
From Feb 2024 to Feb 2025

Real-Time news about Alkame Holdings Inc (CE) (OTCMarkets): 0 recent articles
More Alkame Holdings Inc (PK) News Articles