UNITED
STATES
SECURITIES
AND EXCHANGE COMMISSION
WASHINGTON,
D.C. 20549
FORM
6-K
REPORT
OF FOREIGN PRIVATE ISSUER
PURSUANT
TO RULE 13a-16 OR 15d-16 OF THE
SECURITIES
EXCHANGE ACT OF 1934
For
the month of, October 2023
Commission
File Number 001-40848
GUARDFORCE
AI CO., LIMITED
(Translation
of registrant’s name into English)
10
Anson Road, #28-01 International Plaza
Singapore
079903
(Address
of principal executive offices)
Indicate
by check mark whether the registrant files or will file annual reports under cover of Form 20-F or Form 40-F: Form 20-F
☒ Form 40-F ☐
EXPLANATORY
NOTE
Guardforce
AI Co., Limited (the “Company”) is furnishing this Form 6-K to provide the unaudited consolidated financial statements
for the six months ended June 30, 2023 and 2022 and incorporate such financial statements into the Company’s registration statements
referenced below.
This
report on Form 6-K and the attached Exhibits 99.1, 99.2 and 99.3 are incorporated by reference into (i) the prospectus contained in the
Company’s registration statement on Form F-3 (SEC File No. 333-261881) declared effective by the Securities and Exchange
Commission on January 5, 2022, (ii) the prospectus dated February 9, 2022 contained in the Company’s registration statement on Form
F-3 (SEC File No. 333-262441) declared effective by the Securities and Exchange Commission on February 9, 2022, and (iii) the prospectus
dated June 14, 2022 contained in the Company’s post-effective Amendment No. 1 to the Form F-1 registration statement on Form
F-3 (SEC File No. 333-258054) declared effective by the Securities and Exchange Commission on June 14, 2022.
FORWARD-LOOKING
INFORMATION
This
Report on Form 6-K contains forward-looking statements and information relating to us that are based on the current beliefs, expectations,
assumptions, estimates and projections of our management regarding our company and industry. When used in this report, the words “may”,
“will”, “anticipate”, “believe”, “estimate”, “expect”, “intend”,
“plan” and similar expressions, as they relate to us or our management, are intended to identify forward-looking statements.
These statements reflect management’s current view of us concerning future events and are subject to certain risks, uncertainties
and assumptions, including among many others: our negative operating profits may raise substantial doubt regarding our ability to continue
as a going concern, our substantial customer concentration, with a limited number of customers accounting for a substantial portion of
our recent revenues, our subsidiaries’ ability to distribute dividends to us may be subject to restrictions under the laws of their
respective jurisdictions, the emergence of additional competing technologies, changes in domestic and foreign laws, regulations and taxes,
political and social events in Thailand, the volatility of the securities markets, and other risks and uncertainties which are generally
set forth under the heading, “Key information - Risk Factors” and elsewhere in our Annual Report on Form 20-F filed on May
1, 2023 (the “Annual Report”). Should any of these risks or uncertainties materialize, or should the underlying assumptions
about our business and the commercial markets in which we operate prove incorrect, actual results may vary materially from those described
as anticipated, estimated or expected in the Annual Report.
All
forward-looking statements included herein attributable to us or other parties or any person acting on our behalf are expressly qualified
in their entirety by the cautionary statements contained or referred to in this section. Except to the extent required by applicable
laws and regulations, we undertake no obligations to update these forward-looking statements to reflect events or circumstances after
the date of this report or to reflect the occurrence of unanticipated events.
SIGNATURES
Pursuant
to the requirements of the Securities Exchange Act of 1934, the registrant has duly caused this report to be signed on its behalf by
the undersigned, thereunto duly authorized.
| Date:
October 2, 2023 |
Guardforce
AI Co., Limited |
| |
|
|
| |
By: |
/s/
Lei Wang |
| |
Lei
Wang |
| |
Chief
Executive Officer |
EXHIBIT
INDEX
4
Exhibit
99.1
GUARDFORCE AI CO., LIMITED AND SUBSIDIARIES
UNAUDITED INTERIM CONDENSED CONSOLIDATED FINANCIAL
STATEMENTS
FOR THE SIX MONTHS ENDED JUNE 30, 2023 and 2022
Guardforce AI Co., Limited and Subsidiaries
Unaudited Interim Condensed Consolidated Balance
Sheets
(Expressed in U.S. Dollars)
| | |
Note | | |
As of
June 30,
2023 | | |
As of
December 31,
2022 | |
| | |
| | |
(Unaudited) | | |
| |
| Assets | |
| | |
| | |
| |
| Current assets: | |
| | |
| | |
| |
| Cash and cash equivalents | |
| 4 | | |
$ | 24,738,377 | | |
$ | 6,930,639 | |
| Restricted cash | |
| 4 | | |
| 17,059 | | |
| - | |
| Trade receivables | |
| 6 | | |
| 5,127,998 | | |
| 5,400,186 | |
| Other receivables | |
| 8 | | |
| - | | |
| 817,564 | |
| Other current assets | |
| 9 | | |
| 2,380,718 | | |
| 1,743,008 | |
| Withholding tax receivable, net | |
| 7 | | |
| 536,974 | | |
| 757,024 | |
| Inventories | |
| 5 | | |
| 1,636,245 | | |
| 5,105,770 | |
| Amounts due from related parties | |
| 22 | | |
| 7,716,503 | | |
| 14,508,873 | |
| Total current assets | |
| | | |
| 42,153,874 | | |
| 35,263,064 | |
| | |
| | | |
| | | |
| | |
| Non-current assets: | |
| | | |
| | | |
| | |
| Restricted cash | |
| 4 | | |
| 1,274,956 | | |
| 1,300,005 | |
| Property, plant and equipment | |
| 10 | | |
| 6,018,408 | | |
| 8,066,761 | |
| Right-of-use assets | |
| 11 | | |
| 3,323,870 | | |
| 4,171,409 | |
| Intangible assets, net | |
| 12 | | |
| 6,954,467 | | |
| 5,793,143 | |
| Goodwill | |
| 3 | | |
| 1,416,405 | | |
| 2,679,445 | |
| Withholding tax receivable, net | |
| 7 | | |
| 1,921,073 | | |
| 1,934,072 | |
| Deferred tax assets, net | |
| 17 | | |
| 634,619 | | |
| 1,511,753 | |
| Other non-current assets | |
| 9 | | |
| 397,030 | | |
| 447,322 | |
| Total non-current assets | |
| | | |
| 21,940,828 | | |
| 25,903,910 | |
| Total assets | |
| | | |
$ | 64,094,702 | | |
$ | 61,166,974 | |
| | |
| | | |
| | | |
| | |
| Liabilities and Equity | |
| | | |
| | | |
| | |
| Current liabilities: | |
| | | |
| | | |
| | |
| Trade and other payables | |
| 13 | | |
$ | 3,065,838 | | |
$ | 2,633,995 | |
| Borrowings | |
| 14 | | |
| 3,509,709 | | |
| 3,181,616 | |
| Borrowing from a related party | |
| 22 | | |
| 1,666,846 | | |
| 3,148,500 | |
| Current portion of operating lease liabilities | |
| 11 | | |
| 1,645,233 | | |
| 1,774,192 | |
| Current portion of finance lease liabilities, net | |
| 16 | | |
| 200,383 | | |
| 398,136 | |
| Other current liabilities | |
| 13 | | |
| 2,837,287 | | |
| 2,477,369 | |
| Amounts due to related parties | |
| 22 | | |
| 3,703,038 | | |
| 3,868,691 | |
| Convertible note payables | |
| 15 | | |
| 606,786 | | |
| 1,730,267 | |
| Total current liabilities | |
| | | |
| 17,235,120 | | |
| 19,212,766 | |
| | |
| | | |
| | | |
| | |
| Non-current liabilities: | |
| | | |
| | | |
| | |
| Borrowings | |
| 14 | | |
| 13,727,574 | | |
| 13,899,818 | |
| Operating lease liabilities | |
| 11 | | |
| 1,686,803 | | |
| 2,340,075 | |
| Borrowings from related parties | |
| 22 | | |
| 1,437,303 | | |
| 1,455,649 | |
| Finance lease liabilities | |
| 16 | | |
| 229,747 | | |
| 233,550 | |
| Other non-current liabilities | |
| | | |
| - | | |
| 43,200 | |
| Provision for employee benefits | |
| 18 | | |
| 4,775,062 | | |
| 4,849,614 | |
| Total non-current liabilities | |
| | | |
| 21,856,489 | | |
| 22,821,906 | |
| Total liabilities | |
| | | |
| 39,091,609 | | |
| 42,034,672 | |
| | |
| | | |
| | | |
| | |
| Equity | |
| | | |
| | | |
| | |
| Ordinary shares – par value $0.12 authorized 300,000,000 shares, issued and outstanding 6,883,223 shares at June 30, 2023; par value $0.12 authorized 7,500,000 shares, issued and outstanding 1,618,977 shares at December 31, 2022 | |
| | | |
| 826,022 | | |
| 194,313 | |
| Subscription receivable | |
| | | |
| (50,000 | ) | |
| (50,000 | ) |
| Additional paid in capital | |
| | | |
| 65,150,407 | | |
| 46,231,302 | |
| Legal reserve | |
| 21 | | |
| 223,500 | | |
| 223,500 | |
| Warrants reserve | |
| | | |
| 251,036 | | |
| 251,036 | |
| Accumulated deficit | |
| | | |
| (42,588,233 | ) | |
| (28,769,014 | ) |
| Accumulated other comprehensive income | |
| | | |
| 1,281,904 | | |
| 1,112,494 | |
| Capital & reserves attributable to equity holders of the Company | |
| | | |
| 25,094,636 | | |
| 19,193,631 | |
| Non-controlling interests | |
| | | |
| (91,543 | ) | |
| (61,329 | ) |
| Total equity | |
| | | |
| 25,003,093 | | |
| 19,132,302 | |
| Total liabilities and equity | |
| | | |
$ | 64,094,702 | | |
$ | 61,166,974 | |
The accompanying notes are an integral part
of these unaudited condensed consolidated financial statements.
Guardforce AI Co., Limited and Subsidiaries
Unaudited Interim Condensed Consolidated Statement
of Profit or Loss
(Expressed in U.S. Dollars)
| | |
Note | | |
For the six months ended
June 30, | |
| | |
| | |
2023 | | |
2022 | |
| | |
| | |
(Unaudited) | | |
(Unaudited) | |
| Revenue | |
| 2.13 | | |
$ | 18,413,292 | | |
$ | 16,942,522 | |
| Cost of sales | |
| 2.14 | | |
| (15,939,067 | ) | |
| (14,998,727 | ) |
| Gross profit | |
| | | |
| 2,474,225 | | |
| 1,943,795 | |
| | |
| | | |
| | | |
| | |
| Stock based compensation | |
| | | |
| - | | |
| (252,095 | ) |
| Provision for and write off of withholding tax receivable | |
| | | |
| (561,277 | ) | |
| (263,340 | ) |
| Provision for expected credit loss on trade and other receivables | |
| | | |
| (870,408 | ) | |
| - | |
| Provision for obsolete inventories | |
| | | |
| (3,090,283 | ) | |
| - | |
| Impairment loss on fixed assets | |
| | | |
| (1,591,766 | ) | |
| - | |
| Impairment of goodwill | |
| | | |
| (1,263,040 | ) | |
| - | |
| Selling, distribution and administrative expenses | |
| 20 | | |
| (6,981,660 | ) | |
| (6,977,996 | ) |
| Operating loss | |
| | | |
| (11,884,209 | ) | |
| (5,549,636 | ) |
| | |
| | | |
| | | |
| | |
| Other income, net | |
| | | |
| 77,765 | | |
| 46,859 | |
| Foreign exchange losses, net | |
| | | |
| (583,661 | ) | |
| (745,759 | ) |
| Finance costs | |
| | | |
| (584,897 | ) | |
| (410,861 | ) |
| Loss before income tax | |
| | | |
| (12,975,002 | ) | |
| (6,659,397 | ) |
| | |
| | | |
| | | |
| | |
| Provision for income tax (expense) benefit | |
| 17 | | |
| (874,431 | ) | |
| 320,183 | |
| Net loss for the period | |
| | | |
| (13,849,433 | ) | |
| (6,339,214 | ) |
| Less: net loss attributable to non-controlling interests | |
| | | |
| 30,214 | | |
| 32,392 | |
| Net loss attributable to equity holders of the Company | |
| | | |
$ | (13,819,219 | ) | |
$ | (6,306,822 | ) |
| | |
| | | |
| | | |
| | |
| Loss per share | |
| | | |
| | | |
| | |
Basic and diluted loss attributable to the equity holders of the Company | |
| | | |
$ | (4.35 | ) | |
$ | (7.16 | ) |
| | |
| | | |
| | | |
| | |
| Weighted average number of shares used in computation: | |
| | | |
| | | |
| | |
Basic and diluted | |
| | | |
| 3,174,282 | | |
| 880,618 | |
The accompanying notes are an integral part
of these unaudited interim condensed consolidated financial statements.
Guardforce AI Co., Limited and Subsidiaries
Unaudited Interim Condensed Consolidated Statement
of Comprehensive Loss
(Expressed in U.S. Dollars)
| | |
Note | |
For the six months ended
June 30, | |
| | |
| |
2023 | | |
2022 | |
| | |
| |
(Unaudited) | | |
(Unaudited) | |
| Net (loss) for the period | |
| |
$ | (13,849,433 | ) | |
$ | (6,339,214 | ) |
| Currency translation differences | |
2.6 | |
| 169,410 | | |
| (197,909 | ) |
| Total comprehensive (loss) for the period | |
| |
$ | (13,680,023 | ) | |
$ | (6,537,123 | ) |
| | |
| |
| | | |
| | |
| Attributable to: | |
| |
| | | |
| | |
| Equity holders of the Company | |
| |
$ | (13,651,390 | ) | |
$ | (6,502,884 | ) |
| Non-controlling interests | |
| |
| (28,633 | ) | |
| (34,239 | ) |
| | |
| |
$ | (13,680,023 | ) | |
$ | (6,537,123 | ) |
The accompanying notes are an integral part
of these unaudited interim condensed consolidated financial statements.
Guardforce AI Co., Limited and Subsidiaries
Unaudited Interim Condensed Consolidated Statement
of Changes in Equity (Deficit)
(Expressed in U.S. Dollars)
| |
|
|
|
|
|
|
|
|
|
|
|
|
|
|
|
|
|
|
|
Accumulated |
|
|
|
|
|
|
|
|
|
|
| |
|
Number of Shares |
|
|
Amount ($0.12
par) |
|
|
Subscription
Receivable |
|
|
Additional
Paid-in
Capital |
|
|
Legal
Reserve |
|
|
Warrants
Reserves |
|
|
Other
Comprehensive
Income |
|
|
Accumulated
Deficit |
|
|
Non- controlling Interests |
|
|
Total
Equity |
|
| Balance as of December 31, 2021 |
|
|
529,766 |
|
|
$ |
63,606 |
|
|
$ |
(50,000 |
) |
|
$ |
15,379,595 |
|
|
$ |
223,500 |
|
|
$ |
251,036 |
|
|
$ |
821,527 |
|
|
$ |
(10,204,220 |
) |
|
$ |
39,935 |
|
|
$ |
6,524,979 |
|
| |
|
|
|
|
|
|
|
|
|
|
|
|
|
|
|
|
|
|
|
|
|
|
|
|
|
|
|
|
|
|
|
|
|
|
|
|
|
|
|
|
| Currency translation adjustments |
|
|
- |
|
|
|
- |
|
|
|
- |
|
|
|
- |
|
|
|
- |
|
|
|
- |
|
|
|
(197,909 |
) |
|
|
- |
|
|
|
- |
|
|
|
(197,909 |
) |
| Stock-based compensation expenses |
|
|
7,000 |
|
|
|
840 |
|
|
|
- |
|
|
|
251,255 |
|
|
|
- |
|
|
|
- |
|
|
|
- |
|
|
|
- |
|
|
|
- |
|
|
|
252,095 |
|
| Cancellation of shares |
|
|
(2 |
) |
|
|
- |
|
|
|
- |
|
|
|
- |
|
|
|
- |
|
|
|
- |
|
|
|
- |
|
|
|
- |
|
|
|
- |
|
|
|
- |
|
| Issuance of ordinary shares through private placements |
|
|
416,483 |
|
|
|
49,978 |
|
|
|
- |
|
|
|
18,225,749 |
|
|
|
- |
|
|
|
- |
|
|
|
- |
|
|
|
- |
|
|
|
- |
|
|
|
18,275,727 |
|
| Issuance of ordinary shares through exercise of warrants |
|
|
27,377 |
|
|
|
3,285 |
|
|
|
- |
|
|
|
1,420,404 |
|
|
|
- |
|
|
|
- |
|
|
|
- |
|
|
|
- |
|
|
|
- |
|
|
|
1,423,689 |
|
| Issuance of ordinary shares for acquisition of subsidiaries |
|
|
148,071 |
|
|
|
17,769 |
|
|
|
- |
|
|
|
4,562,111 |
|
|
|
- |
|
|
|
- |
|
|
|
- |
|
|
|
- |
|
|
|
- |
|
|
|
4,579,880 |
|
| Issuance of ordinary shares for deposit paid for acquisitions of subsidiaries |
|
|
243,000 |
|
|
|
29,160 |
|
|
|
|
|
|
|
4,830,840 |
|
|
|
|
|
|
|
|
|
|
|
|
|
|
|
|
|
|
|
|
|
|
|
4,860,000 |
|
| Net loss for the period |
|
|
- |
|
|
|
- |
|
|
|
- |
|
|
|
- |
|
|
|
- |
|
|
|
- |
|
|
|
- |
|
|
|
(6,306,822 |
) |
|
|
(32,392 |
) |
|
|
(6,339,214 |
) |
| |
|
|
|
|
|
|
|
|
|
|
|
|
|
|
|
|
|
|
|
|
|
|
|
|
|
|
|
|
|
|
|
|
|
|
|
|
|
|
|
|
| Balance as of June 30, 2022 (Unaudited) |
|
|
1,371,695 |
|
|
$ |
164,638 |
|
|
$ |
(50,000 |
) |
|
$ |
44,669,954 |
|
|
$ |
223,500 |
|
|
$ |
251,036 |
|
|
$ |
623,618 |
|
|
$ |
(16,511,042 |
) |
|
$ |
7,543 |
|
|
$ |
29,379,247 |
|
| |
|
|
|
|
|
|
|
|
|
|
|
|
|
|
|
|
|
|
|
|
|
|
|
|
|
|
|
|
|
|
|
|
|
|
|
|
|
|
|
|
| Balance as of December 31, 2022 |
|
|
1,618,977 |
|
|
$ |
194,313 |
|
|
$ |
(50,000 |
) |
|
$ |
46,231,302 |
|
|
$ |
223,500 |
|
|
$ |
251,036 |
|
|
$ |
1,112,494 |
|
|
$ |
(28,769,014 |
) |
|
$ |
(61,329 |
) |
|
$ |
19,132,302 |
|
| |
|
|
|
|
|
|
|
|
|
|
|
|
|
|
|
|
|
|
|
|
|
|
|
|
|
|
|
|
|
|
|
|
|
|
|
|
|
|
|
|
| Currency translation adjustments |
|
|
- |
|
|
|
- |
|
|
|
- |
|
|
|
- |
|
|
|
- |
|
|
|
- |
|
|
|
169,410 |
|
|
|
- |
|
|
|
- |
|
|
|
169,410 |
|
| Cancellation of shares (Note 19) |
|
|
(245,339 |
) |
|
|
(29,441 |
) |
|
|
- |
|
|
|
(4,880,223 |
) |
|
|
- |
|
|
|
- |
|
|
|
- |
|
|
|
- |
|
|
|
- |
|
|
|
(4,909,664 |
) |
| Issuance of ordinary shares through CMPOs (Note 19) |
|
|
4,946,184 |
|
|
|
593,542 |
|
|
|
- |
|
|
|
20,273,844 |
|
|
|
- |
|
|
|
- |
|
|
|
- |
|
|
|
- |
|
|
|
- |
|
|
|
20,867,386 |
|
| Issuance of ordinary shares through exercise of warrants (Note 19) |
|
|
128,901 |
|
|
|
15,468 |
|
|
|
- |
|
|
|
491,224 |
|
|
|
- |
|
|
|
- |
|
|
|
- |
|
|
|
- |
|
|
|
- |
|
|
|
506,692 |
|
| Issuance of ordinary shares for acquisition of assets (Note 19) |
|
|
262,500 |
|
|
|
31,500 |
|
|
|
- |
|
|
|
1,816,500 |
|
|
|
- |
|
|
|
- |
|
|
|
- |
|
|
|
- |
|
|
|
- |
|
|
|
1,848,000 |
|
| Issuance of ordinary shares for a convertible note conversion (Note 19) |
|
|
172,000 |
|
|
|
20,640 |
|
|
|
|
|
|
|
1,217,760 |
|
|
|
|
|
|
|
|
|
|
|
|
|
|
|
|
|
|
|
|
|
|
|
1,238,400 |
|
| Net loss for the period |
|
|
- |
|
|
|
- |
|
|
|
- |
|
|
|
- |
|
|
|
- |
|
|
|
- |
|
|
|
- |
|
|
|
(13,819,219 |
) |
|
|
(30,214 |
) |
|
|
(13,849,433 |
) |
| |
|
|
|
|
|
|
|
|
|
|
|
|
|
|
|
|
|
|
|
|
|
|
|
|
|
|
|
|
|
|
|
|
|
|
|
|
|
|
|
|
| Balance as of June 30, 2023 (Unaudited) |
|
|
6,883,223 |
|
|
$ |
826,022 |
|
|
$ |
(50,000 |
) |
|
$ |
65,150,407 |
|
|
$ |
223,500 |
|
|
$ |
251,036 |
|
|
$ |
1,281,904 |
|
|
$ |
(42,588,233 |
) |
|
$ |
(91,543 |
) |
|
$ |
25,003,093 |
|
The accompanying notes are an integral
part of these unaudited interim condensed consolidated financial statements
Guardforce AI Co., Limited and Subsidiaries
Unaudited Interim Condensed Consolidated Statement
of Cash Flows
(Expressed in U.S. Dollars)
| |
|
For the six months ended
June 30, |
|
| |
|
2023 |
|
|
2022 |
|
| |
|
(Unaudited) |
|
|
(Unaudited) |
|
| Cash flows from operating activities |
|
|
|
|
|
|
|
|
| Net loss |
|
$ |
(13,849,433 |
) |
|
$ |
(6,339,214 |
) |
| Adjustments for: |
|
|
|
|
|
|
|
|
| Depreciation and Amortization of fixed and intangible assets |
|
|
2,619,001 |
|
|
|
2,697,378 |
|
| Stock-based compensation |
|
|
- |
|
|
|
252,095 |
|
| Provision for and write off of withholding tax receivable |
|
|
561,277 |
|
|
|
263,340 |
|
| Provision for expected credit loss on trade and other receivables |
|
|
869,519 |
|
|
|
- |
|
| Provision for obsolete inventories |
|
|
3,090,282 |
|
|
|
- |
|
| Impairment loss on fixed assets |
|
|
1,591,766 |
|
|
|
- |
|
| Impairment on goodwill |
|
|
1,263,040 |
|
|
|
- |
|
| Finance costs |
|
|
584,897 |
|
|
|
506,818 |
|
| Loss from fixed assets disposal |
|
|
41,965 |
|
|
|
24,530 |
|
| Changes in operating assets and liabilities: |
|
|
|
|
|
|
|
|
| Decrease (Increase) in trade and other receivables |
|
|
157,279 |
|
|
|
(205,716 |
) |
| Increase in other assets |
|
|
(719,595 |
) |
|
|
(968,103 |
) |
| Decrease (Increase) in inventories |
|
|
296,824 |
|
|
|
(5,521,429 |
) |
| Decrease (Increase) in amounts due from/to related parties |
|
|
639,807 |
|
|
|
(6,111,443 |
) |
| Decrease (Increase) in deferred tax assets |
|
|
874,431 |
|
|
|
(325,083 |
) |
| Increase in Trade and other payables and other current liabilities |
|
|
1,285,317 |
|
|
|
1,265,752 |
|
| (Decrease) Increase in withholding tax receivable |
|
|
(374,013 |
) |
|
|
663,095 |
|
| Increase (Decrease) in provision for employee benefits |
|
|
20,774 |
|
|
|
(29,812 |
) |
| Net cash used in operating activities |
|
|
(1,046,862 |
) |
|
|
(13,827,792 |
) |
| |
|
|
|
|
|
|
|
|
| Cash flows from investing activities |
|
|
|
|
|
|
|
|
| Acquisition of property, plant and equipment |
|
|
(829,231 |
) |
|
|
(2,309,334 |
) |
| Proceeds from sale of property, plant and equipment |
|
|
- |
|
|
|
4,120 |
|
| Acquisition of intangible assets |
|
|
(217,077 |
) |
|
|
(3,082,880 |
) |
| Acquisition of subsidiaries, net of cash acquired |
|
|
- |
|
|
|
(1,793,614 |
) |
| Deposits paid for business acquisitions |
|
|
- |
|
|
|
(2,160,000 |
) |
| Net cash used in investing activities |
|
|
(1,046,308 |
) |
|
|
(9,341,708 |
) |
| |
|
|
|
|
|
|
|
|
| Cash flows from financing activities |
|
|
|
|
|
|
|
|
| Proceeds from issue of shares |
|
|
20,867,386 |
|
|
|
18,275,728 |
|
| Proceeds from exercise of warrants |
|
|
506,693 |
|
|
|
1,423,690 |
|
| Cash paid for the cancellation of fractional shares |
|
|
(49,664 |
) |
|
|
- |
|
| Proceeds from borrowings |
|
|
1,756,738 |
|
|
|
- |
|
| Repayment of borrowings |
|
|
(1,937,096 |
) |
|
|
(840,762 |
) |
| Payment of lease liabilities |
|
|
(1,267,979 |
) |
|
|
(1,483,203 |
) |
| Net cash generated from financing activities |
|
|
19,876,078 |
|
|
|
17,375,453 |
|
| |
|
|
|
|
|
|
|
|
| Net decrease in cash and cash equivalents, and restricted cash |
|
|
17,782,908 |
|
|
|
(5,794,047 |
) |
| Effect of movements in exchange rates on cash |
|
|
16,840 |
|
|
|
(519,523 |
) |
| Cash and cash equivalents, and restricted cash at January 1, |
|
|
8,230,644 |
|
|
|
15,853,811 |
|
| Cash and cash equivalents, and restricted cash at June 30, |
|
$ |
26,030,392 |
|
|
$ |
9,540,241 |
|
| |
|
|
|
|
|
|
|
|
| Non-cash investing and financing activities |
|
|
|
|
|
|
|
|
| Equity portion of purchase consideration paid for acquisition of subsidiaries |
|
|
- |
|
|
|
4,579,879 |
|
| Equity portion of purchase consideration paid for acquisition of assets (Note 19) |
|
|
1,848,000 |
|
|
|
- |
|
The accompanying notes are an integral
part of these unaudited interim condensed consolidated financial statements.
Guardforce AI Co., Limited and Subsidiaries
Notes to the Unaudited Interim Condensed Consolidated
Financial Statements
(Expressed in U.S. Dollars)
Guardforce AI Co., Limited (“Guardforce”)
is a company incorporated and domiciled in the Cayman Islands under the Cayman Islands Companies Act on April 20, 2018. The Company’s
ordinary shares and warrants are listed under the symbol “GFAI” and “GFAIW”, respectively, on the Nasdaq Capital
Market upon the completion of an initial public offering on September 28, 2021.
Guardforce AI Holding Limited (“AI
Holdings”) was incorporated in the British Virgin Islands under the BVI Business Companies Act, 2004, on May 22, 2018. AI Holdings
is a 100% owned subsidiary of Guardforce. AI Holdings is an investment holding company.
Guardforce AI Robots Limited (“AI
Robots”) was incorporated in the British Virgin Islands under the BVI Business Companies Act, 2004, on May 22, 2018. AI Robots is
a 100% owned subsidiary of Guardforce. AI Robots is an investment holding company.
Guardforce AI (Hong Kong) Co., Limited
(“AI Hong Kong”) was incorporated in Hong Kong under the Hong Kong Companies’ Ordinance (Chapter 622), on May 30, 2018.
AI Hong Kong is a 100% owned subsidiary of Guardforce. Beginning March 2020, AI Hong Kong commenced robotic AI solution business of selling
and leasing robots.
Southern Ambition Limited (“Southern
Ambition”) was incorporated in the British Virgin Islands under the BVI Business Companies Act, 2004, on August 3, 2018. Southern
Ambition is a 100% owned subsidiary of AI Robots. Southern Ambition is an investment holding company.
Horizon Dragon Limited (“Horizon
Dragon”) was incorporated in the British Virgin Islands under the BVI Business Companies Act, 2004, on July 3, 2018. Horizon Dragon
is a 100% owned subsidiary of AI Holdings. Horizon Dragon is an investment holding company.
Guardforce AI Group Co., Limited (“AI
Thailand”) was incorporated in Thailand under the Civil and Commercial Code at the Registry of partnerships and Companies, Bangkok
Metropolis, Thailand, on September 21, 2018 and has 100,000 ordinary plus preferred shares outstanding. 48,999 of the shares in AI Thailand
are owned by Southern Ambition Limited, with one share being held by Horizon Dragon Limited, for an aggregate of 49,000 ordinary shares,
or 49%, and 51,000 cumulative preferred shares are owned by two individuals of Thailand. The two individuals owned in aggregate 49,000
ordinary shares with a value of approximately $16,000. The cumulative preferred shares are entitled to dividends of USD$0.03 per share
when declared. The cumulative unpaid dividends of the preferred shares as of June 30, 2023 and December 31, 2022 is approximately $1,700.
Pursuant to article of associates of AI Thailand, the holder of an ordinary share may cast one vote per share at a general meeting of
shareholders, the holder of preferred shares may cast one vote for every 20 preferred shares held at a general meeting of shareholders.
Southern Ambition is entitled to cast more than 95% of the votes at a general meeting of shareholders. No dividends were declared for
the six months ended June 30, 2023 and 2022.
Guardforce Cash Solutions Security Thailand
Co., Limited (“GF Cash (CIT)”) was incorporated in Thailand under the Civil and Commercial Code at the Registry of partnerships
and Companies, Bangkok Metropolis, Thailand, on July 27, 1982 and has 3,857,144 outstanding shares. 3,799,544 ordinary shares and 21,599
preferred shares of the outstanding shares in GF Cash (CIT) (approximately 99.07% of the shares in GF Cash (CIT)) are owned by AI Thailand
with one preferred share being held by Southern Ambition and 33,600 ordinary shares and 2,400 preferred shares (approximately 0.933% of
the shares in GF Cash (CIT)) being held by Bangkok Bank Public Company Limited. Pursuant to the articles of association a shareholder
may cast one vote per one share at a general meeting of shareholders. AI Thailand is entitled to cast 99.07% of the votes at a general
meeting of shareholders. No dividends were declared for the six months ended June 30, 2023 and 2022. The Company engages principally in
providing cash management and handling services located in Thailand.
On March 25, 2021, the Company acquired
51% majority stake in information security consultants Handshake Networking Ltd (“Handshake”), a Hong Kong-based company
specializing in penetration testing and forensics analysis in Hong Kong and the Asia Pacific region since 2004.
On November 1, 2021, the Company entered
into a Transfer Agreement (the “Singapore Agreement”) to acquire 100% of the equity interests in Guardforce AI Singapore Pte.
Ltd. (“AI Singapore”), a company incorporated in Singapore. Pursuant to the Agreement, AI Singapore became a wholly owned
subsidiary of the Company. AI Singapore commenced robotic AI solution business of selling and leasing robots.
On November 18, 2021, the Company entered
into a Transfer Agreement (the “Macau Agreement”) to acquire 100% of the equity interests in Macau GF Robotics Limited,
a company incorporated in Macau (“AI Macau”). The consideration is approximately $3,205 (MOP25,000). AI Macau commenced robotic
AI solution business of selling and leasing robots. The acquisition was closed on February 9, 2022. AI Macau is a 100% owned subsidiary
of AI Robotics.
On November 18, 2021, the Company entered
into another Transfer Agreement (the “Malaysia Agreement”) to acquire 100% of the equity interests in GF Robotics
Malaysia Sdn. Bhd., a company incorporated in Malaysia (“AI Malaysia”). The consideration is approximately $1 (RM1). AI Malaysia
commenced robotic AI solution business of selling and leasing robots. The acquisition was closed on January 20, 2022. AI Malaysia is a
100% owned subsidiary of AI Robotics.
GFAI Robotics Group Co., Limited (“AI
Robotics”) was incorporated in the British Virgin Islands under the BVI Business Companies Act, 2004, on December 6, 2021. AI Robotics
is a 100% owned subsidiary of Guardforce. AI Robotics is an investment holding company.
GFAI Robot Service (Hong Kong) Limited
(“AI Robot Service”) was incorporated in Hong Kong under the Hong Kong Companies’ Ordinance (Chapter 622), on January
18, 2022. AI Robot Service is an investment holding company. AI Robot Service is a 100% owned subsidiary of AI Robotics.
Guardforce AI Robot Service (Shenzhen)
Co., Limited (“AI Shenzhen”) was incorporated in the People’s Republic of China (“PRC”) on February 23,
2022. AI Shenzhen is an investment holding company. AI Shenzhen is a 100% owned subsidiary of AI Robot Service.
GFAI Robotics Services LLC (“AI
US”) was incorporated in the State of Delaware on February 28, 2022. AI US commenced robotic AI solution business of selling and
leasing robots. AI US is a 100% owned subsidiary of AI Robotics.
GFAI Robot Service (Australia) Pty Ltd.
(“AI Australia”) was incorporated in Australia on February 28, 2022. AI Australia commenced robotic AI solution business of
selling and leasing robots. AI Australia is a 100% owned subsidiary of AI Robot Service.
GFAI Robot & Smart Machines Trading
LLC (“AI Dubai”) was incorporated in the United Arab Emirates (UAE) on March 13, 2022. AI Dubai commenced robotic AI
solution business of selling and leasing robots. AI Dubai is a 100% owned subsidiary of AI Robot Service.
GFAI Robotic and Innovation Solution
(Thailand) Company Limited (“AI R&I”) was incorporated in Thailand on March 30, 2022. AI R&I commenced robotic AI
solution business of selling and leasing robots. AI R&I is 98% owned by AI Thailand, 1% owned by Horizon Dragon and 1% owned by Southern
Ambition.
GFAI Robot Service (UK) Limited (“AI
UK”) was incorporated in the United Kingdom on April 29, 2022. AI UK commenced robotic AI solution business of selling and leasing
robots. AI UK is a 100% owned subsidiary of AI Robot Service.
GFAI Robot Service Limited (“AI
Canada”) was incorporated in Canada on May 6, 2022. AI Canada commenced robotic AI solution business of selling and leasing robots.
AI Canada is a 100% owned subsidiary of AI Robot Service.
Guardforce AI Robot (Jian) Co., Limited
(“AI Jian”) was incorporated in the People’s Republic of China (“PRC”) on May 16, 2022. AI Jian is an investment
holding company. AI Jian is a 100% owned subsidiary of AI Robot Service.
GFAI Robot Service GK (“AI Japan”)
was incorporated in Japan on May 24, 2022. AI Japan commenced robotic AI solution business of selling and leasing robots. AI Japan is
a 100% owned subsidiary of AI Hong Kong.
GFAI Robot Service Co., Ltd. (“AI
Korea”) was incorporated in South Korea on June 17, 2022. AI Korea commenced robotic AI solution business of selling and leasing
robots. AI Korea is a 100% owned subsidiary of AI Hong Kong.
On March 11, 2022, the Company entered
into a Sale and Purchase Agreement (the “Kewei Agreement”) with Shenzhen Kewei Robot Technology Co., Limited (“Shenzhen
Kewei”) to acquire 100% of the equity interests in Shenzhen Keweien Robot Service Co., Ltd. (“Shenzhen GFAI”) and Guangzhou
Kewei Robot Technology Co., Ltd. (“Guangzhou GFAI”) from Shenzhen Kewei. Both acquirees are PRC-based companies. The
acquisition serves an integral role in the growth of the Company’s robotic AI solution business as a service (RaaS) business initiative.
The acquisition was closed on March 22, 2022. The acquisition purchase price of $10,000,000 was paid in a mix of cash (10%) and restricted
ordinary shares of the Company (90%). On March 14, 2022, the Company issued 53,571 (post-consolidation) restricted Ordinary Shares to
the sellers’ designated parties.
On May 24, 2022, the Company entered
into a Sale and Purchase Agreement (the “Yeantec Agreement”) with Shenzhen Yeantec Co., Limited (“Yeantec”) to
acquire 100% of the equity interests in Beijing Wanjia Security System Co., Ltd. (“Beijing Wanjia”) from Yeantec. Beijing
Wanjia is a PRC-based company with more than 25 years of experience in providing integrated security solution, focusing on fire alarm
security systems, and a well-established customer base among retail businesses. The acquisition serves the growth of the Company’s
other security business. The acquisition was closed on June 22, 2022. The acquisition purchase price of $8,400,000 was paid in a mix of
cash (10%) and restricted ordinary shares of the Company (90%). On June 16, 2022, the Company issued 94,500 (post-consolidation) restricted
Ordinary Shares to the sellers’ designated parties.
GFAI Robot Service (Vietnam) Co.,
Ltd (“AI Vietnam”) was incorporated in Vietnam on July 8, 2022. AI Vietnam is a dormant company and is a 100% owned subsidiary
of AI Hong Kong. On March 22, 2023, the Company deregistered AI Vietnam.
On December 21, 2022, the Company entered
into an asset purchase agreement (“Agreement”) with Shenzhen Kewei Robot Technology Co., Limited (“Shenzhen Kewei”)
to purchase certain of Shenzhen Kewei’s robot-related business assets in China. The Company will acquire, and Yeantec will transfer
to the Company, select robotic equipment assets and Kewei’s technology platform. The purchase price for these assets is $2,100,000,
which will be fully paid in the form of 262,500 (post-consolidation) restricted ordinary shares of the Company based on a price of $8.0
(post-consolidation) per share. The Company issued 262,500 shares to Shenzhen Kewei on March 1, 2023.
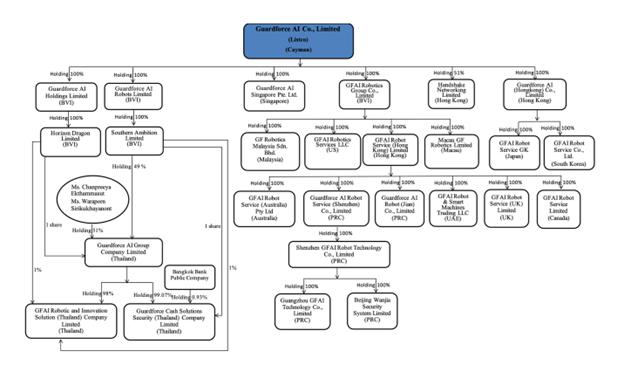
The following diagram illustrates the
Company’s legal entity ownership structure as of June 30, 2023:
| 2. |
SIGNIFICANT ACCOUNTING POLICIES |
The accounting policies applied for the
six months ended June 30, 2023 and 2022 are consistent with those of the audited consolidated financial statements for the years ended
December 31, 2022, 2021 and 2020, as described in those audited consolidated financial statements, except for the adoption of new and
amended International Financial Reporting Standards (“IFRS”) effective for the year ending December 31, 2022 which are relevant
to the preparation of the June 30, 2023 and 2022 interim condensed consolidated financial statements.
On
September 25, 2023, the interim condensed consolidated financial statements were approved by the board of directors and authorized for
issuance.
| 2.1 | Basis of presentation |
The accompanying interim condensed consolidated
financial statements have been prepared in accordance with International Accounting Standard (“IAS”) 34, “Interim Financial
Reporting”. These statements should be read in conjunction with the audited consolidated financial statements for the years ended
December 31, 2022, 2021 and 2020, which have been prepared in accordance with International Financial Reporting Standards (“IFRS”)
as issued by the International Accounting Standards Board (“IASB”). The interim condensed consolidated financial statements
have been prepared on a historical cost basis. In the opinion of management, all adjustments necessary for a fair presentation have
been included in the accompanying unaudited condensed consolidated financial statements. The results of operations for the six months
ended June 30, 2023 are not necessarily indicative of the results that may be expected for the full year ended December 31, 2023.
All amounts are presented in United States
dollars (“USD”) and have been rounded to the nearest USD.
In addition, the accompanying condensed
consolidated interim financial statements are presented on the basis that the Company is a going concern. The going concern assumption
contemplates the realization of assets and the satisfaction of liabilities in the normal course of business.
The Company’s operating losses
and net current liability position may raise substantial doubt on the Company’s ability to continue as a going concern.
In assessing the going concern, management
and the Board has considered:
| | - | As of June 30, 2023, the current and non-current portion of loan outstanding with WK Venture Success Limited (“WK Venture”) were approximately $2.5 million and $13.6 million, respectively, which will be due on December 31, 2024 (Note 14). On September 28, 2023, WK Venture agreed to convert the principal and accrued interest of this loan in an aggregate amount of $15,914,615 at the conversion price of $5.40 into restricted ordinary shares of the Company. Thus, the loan with WK Venture has no impact on the Company’s liquidity and on the Company’s ability to meet its short-term financial obligations. |
| - | As of June 30, 2023, the Company has a convertible note payable of $606,786 with Streeterville Capital,
LLC ( “CVP”), which will be due on October 24, 2023 (Note 15). Management believes this convertible note payable will be settled
before the maturity date, either CVP will convert the outstanding balance into restricted ordinary shares or the Company will repay the
amount owed in cash. |
| - | Based on the budget and financial plans of the Company, management is satisfied that the receipt of an
aggregate of approximately $21.0 million, after deducting underwriting discounts and other offering expenses from the two underwritten
public offering proceeds (Note 19) has provided the Company adequate financial resources to continue in operational existence for the
foreseeable future, a period of at least 12 months from the date of this report. |
On January 31, 2023, the Company completed
a 1 for 40 share consolidation of its authorized and issued ordinary shares whereby every forty shares were consolidated into one share.
In addition, the par value of each ordinary share increased from $0.003 to $0.12. Immediately following the completion of the share consolidation,
the Company increased its authorized ordinary shares from 7,500,000 ordinary shares to 300,000,000 ordinary shares. The accompanying interim
condensed consolidated financial statements for the six months ended June 30, 2022 have been retroactively adjusted to reflect the effect
of the share consolidation.
| 2.2 | Basis of consolidation |
The consolidated statements of
profit or loss and other comprehensive loss, statements of changes in equity and statements of cash flows of the Company for the
relevant periods include the results and cash flows of all companies now comprising the Company from the earliest date presented or
since the date when the subsidiaries and/or businesses first came under the common control of the controlling shareholders, wherever
the period is shorter.
The interim condensed consolidated balance
sheet of the Company as of June 30, 2023 has been prepared to present the assets and liabilities of the subsidiaries under the historical
cost convention.
Equity interests in subsidiaries held
by parties other than the controlling shareholders are presented as non-controlling interests in equity.
All intra-group and inter-company transactions
and balances have been eliminated on consolidation.
Segment information is consistent with
how management reviews the businesses, makes investing and resource allocation decisions and assesses operating performance. Transfers
and sales between reportable segments, if any, are recorded at cost.
The Company reports financial and operating
information in the following five segments (Note 23):
| |
(ii) |
Information security; |
| |
(iii) |
Robotics AI solutions; |
| |
(iv) |
General security solutions; and |
| 2.4 | Business combinations |
The Company accounts for business combinations
using the acquisition method when control is transferred to the Company, other than those between and among entities under common control.
The consideration transferred in the acquisition is generally measured at fair value, as are the identifiable net assets acquired. Any
goodwill that arises is tested annually for impairment. Any gain on the bargain purchase is recognized in the statement of profit or loss
immediately. Transaction costs are expensed as incurred, except if related to the issue of debt or equity securities.
| 2.5 | Critical accounting estimate and judgements |
The preparation of the consolidated financial
statements in conformity with IFRS requires management to make estimates and judgments that affect the reported amounts of assets and
liabilities and disclosure of contingent assets and liabilities at the date of the financial statements and the reported amounts of revenues
and expenses during the reporting periods. Actual results could differ from these estimates.
In preparing the interim condensed consolidated
financial statements, the significant judgments made by management in applying the Company’s accounting policies and the key sources
of estimation uncertainty were the same as those that applied to the consolidated financial statements for the year ended December 31,
2022.
| 2.6 | Foreign currency translation |
The presentational currency of the Company
is the U.S. dollar (“USD”). The functional currency of Guardforce, AI Holdings, AI Robots, Horizon Dragon, Southern Ambition,
AI Singapore, AI Robotics, AI Robots Service, AI Malaysia, AI Macau, AI US, AI Australia, AI Dubai, AI UK, AI Korea, AI Japan, AI Canada
and AI Vietnam is the USD. The functional currency of AI Hong Kong and Handshake is the Hong Kong dollar (“HKD”). The functional
currency of AI Thailand, GF Cash (CIT) and AI R&I is the Thai Baht (“Baht” or “THB”). The functional currency
of AI Shenzhen, AI Jian, Shenzhen GFAI, Guangzhou GFAI and Beijing Wanjia is the Chinese Renminbi (“RMB”).
The currency exchange rates that impact
our business are shown in the following table:
| | |
Period End Rate | | |
Average Rate | |
| | |
June 30, | | |
December 31, | | |
For the six months ended
June 30, | |
| | |
2023 | | |
2022 | | |
2023 | | |
2022 | |
| Thai Baht | |
| 0.0283 | | |
| 0.0289 | | |
| 0.0293 | | |
| 0.0295 | |
| Hong Kong Dollar | |
| 0.1282 | | |
| 0.1282 | | |
| 0.1282 | | |
| 0.1282 | |
| Chinese Renminbi | |
| 0.1379 | | |
| 0.1447 | | |
| 0.1444 | | |
| 0.1544 | |
| 2.7 | Financial risk management |
| 2.7.1 |
Financial risk factors |
The Company’s activities expose
it to a variety of financial risks: foreign exchange risk, interest rate risk and liquidity risk. The Company’s overall risk management
program focuses on the unpredictability of financial markets and seeks to minimize potential adverse effects on the Company’s financial
performance.
The interim condensed consolidated financial
statements do not include all financial risk management information and disclosures required in the audited financial statements, and
should be read in conjunction with the Company’s audited consolidated financial statements as of December 31, 2022, 2021 and 2020.
Prudent liquidity management implies
maintaining sufficient cash and cash equivalents and the availability of funding through an adequate amount of committed credit facilities.
The Company’s primary cash requirements
are for operating expenses and purchases of fixed assets. The Company mainly finances its working capital requirements from cash generated
from funds raised from the public offerings, operations, proceeds from the exercise of warrants, bank borrowings and finance leases.
The Company’s policy is to regularly
monitor current and expected liquidity requirements to ensure it maintains sufficient cash and cash equivalents and an adequate amount
of committed credit facilities to meet its liquidity requirements in the short and long term.
At the reporting date, the contractual
undiscounted cash flows of the Company’s current financial liabilities approximate their respective carrying amounts due to their
short maturities.
| 2.7.3 |
Capital risk management |
The Company’s objectives on managing
capital are to safeguard the Company’s ability to continue as a going concern and support the sustainable growth of the Company
in order to provide returns for shareholders and benefits for other stakeholders and to maintain an optimal capital structure to enhance
shareholders’ value in the long term.
In order to maintain or adjust the capital
structure, the Company may adjust the amount of dividends paid to shareholders, return of capital to shareholders, issue new shares or
sell assets to reduce debt.
The COVID-19 pandemic developed rapidly
in 2020. The resulting impact of the virus on the operations and measures taken by various governments to contain the virus have negatively
affected the Company’s financial performance in the fiscal year 2022. The regulatory measures in response to the pandemic were relaxed
and travel restrictions in most countries was lifted in late 2022, the Company might be recovered through the increase in economic activity
in the fiscal year 2023. The Company is monitoring the situation closely and conscientiously managing its costs by adopting an operating
cost reduction strategy and conserving liquidity by working with major creditors to align repayment obligations with receivable collections.
Inventories consist of robots and security
equipment which are stated at the lower of cost, determined on a weighted average basis, or net realizable value. Net realizable value
is the estimated selling price in the ordinary course of business less the estimated cost of completion and the estimated costs necessary
to make the sale. When inventory is sold, their carrying amount is charged to expense in the period in which the revenue is recognized.
Write-downs for declines in net realizable value or for losses of inventories are recognized as an expense in the period the impairment
or loss occurs. The Company recorded an allowance for slow-moving or obsolete robot inventories of $3,090,283 and nil for the six months
ended June 30, 2023 and 2022, respectively.
During the six months ended June 30,
2023 and 2022, all robot inventories were purchased from the related parties (Note 22), and all security equipment’s inventories
were purchased from third parties.
Parties are considered to be related
if one party has the ability, directly or indirectly, to control the other party or exercise significant influence over the other party
in making financial and operating decisions. Parties are also considered to be related if they are subject to common control or significant
influence, such as a family member or relative, shareholder, or a related corporation.
The Company recognizes the contractual
right to receive money or products from related parties as amounts due from related parties. For those that the contractual maturity date
is less than one year, the Company records as current assets.
| 2.10 | Assets under construction |
Assets under construction recorded
in property, plant and equipment and intangible assets are stated at cost less impairment losses, if any. Cost comprises direct
costs of construction as well as interest expense and exchange differences capitalized during the periods of construction and
installation. Capitalization of these costs ceases and the construction in progress is transferred to property, plant and equipment
when substantially all the activities necessary to prepare the assets for their intended use are completed. No depreciation is
provided for assets under construction until they are completed and ready for intended use.
Following initial recognition, goodwill
is stated at cost less any accumulated impairment losses. Goodwill is reviewed for impairment annually or more frequently if events or
changes in circumstances indicate that the carrying value may be impaired.
At the acquisition date, any
goodwill acquired is allocated to the cash-generating units (CGU) which are expected to benefit from the combination’s
synergies. Impairment is determined by assessing the recoverable amount of the CGU to which the goodwill related. Where the
recoverable amount of the CGU is less than the carrying amount, an impairment loss is recognized. Where goodwill forms part of a CGU
and part of the operation within that unit is disposed of, the goodwill associated with the operation disposed of is included in the
carrying amount of the operation when determining the gain or loss on disposal of the operation. Goodwill disposed of In these
circumstances is measured on the basis of the relative values of the operation disposed of and the portion of the CGU retained. The
Company recorded a goodwill impairment of 1,263,040 and nil for the six months ended June 30, 2023 and 2022, respectively.
| 2.11 | Impairment of long-lived assets |
At the end of each reporting period,
the Company reviews the carrying amounts of its long-lived assets to determine whether there is any indication that those assets have
suffered an impairment loss. If any such indication exists, the recoverable amount of the asset is estimated in order to determine the
extent of the impairment loss (if any). Where it is not possible to estimate the recoverable amount of an individual asset, the Company
estimates the recoverable amount of the cash-generating unit to which the asset belongs. For the six months ended June 30, 2023, an impairment
loss on the robot assets of $1,591,766 was recognized when the carrying amount was greater than the value in use. Management estimated
the value in use by estimating the expected cash flows from the cash-generating unit as well as a suitable discount rate in order to calculate
the present value of those cash flows. The basis of impairment is determined based on the result of assessment. The Company did not incur
any impairment loss for the six months ended June 30, 2022.
| 2.12 | Offsetting Assets and Liabilities |
During the six months ended June 30,
2023, the Company engaged in offsetting arrangements for certain financial assets and financial liabilities. These arrangements primarily
involve the offsetting of related party receivables, related party payables and borrowings from a related party. The Company has established
legally enforceable rights to offset financial assets and financial liabilities subject to offsetting arrangements. These rights may arise
from agreements, netting arrangements, or a combination of legal and contractual rights.
| 2.13 | Revenue from contracts with customers |
The Company generates its revenue primarily
from four service lines: (1) Secure logistics; (2) Robotics AI resolutions; (3) Information security; and (4) General security solutions.
Each service line primarily renders the
following services:
| |
(i) |
Cash-In-Transit – Non Dedicated Vehicle (CIT Non-DV); (ii) Cash-In-Transit – Dedicated Vehicle (CIT DV); (iii) ATM management; (iv) Cash Processing (CPC); (v) Cash Center Operations (CCT); (vi) Consolidate Cash Center (CCC); (vii) Cheque Center Service (CDC); (viii) Express Cash; (ix) Coin Processing Service; and (x) Cash Deposit Management Solutions |
| |
(2) |
Robotics AI solutions |
| |
(i) |
Sale of robots and (ii) Rental of robots |
| |
(i) |
Penetration test; (ii) PCI ASV Scan and (iii) Rapid7 Sales |
| |
(4) |
General security solutions |
| |
(i) |
Installation of fire alarm security systems; (ii) Sale of security equipment |
The Company recognizes revenue at a point
in time as products are delivered and services are performed. Consultancy fees typically covers a period of time, the revenue is recognized
on a ratable basis over the contract term. The Company applies the following five-step model in order to determine the amount:
| |
● |
To identify the contract or quotation with the agreed service price. |
| |
● |
To evaluate the services engaged in the customer’s contract and identify the related performance obligations. |
| |
● |
To consider the contract terms and commonly accepted practices in the business to determine the transaction price. The transaction price is the consideration that the Company expects to be entitled for delivering the services engaged with the customer. The consideration engaged in a customer’s contract is generally a fixed amount. |
| |
● |
To allocate the transaction price, if necessary, to each performance obligation (to each good or service that is different) for an amount that represents the part of the benefit that the Company expects to receive in exchange for the right of delivering the services engaged with the customer. |
| |
● |
To recognize revenue when the Company satisfies the performance obligation through the rendering of services engaged. |
All of the conditions mentioned above
are accomplished normally when the services are rendered to the customer and this moment is considered a point in time. The reported revenue
reflects services delivered at the contract or agreed-upon price.
Contract liabilities consist of deferred
revenue related to prepaid fees received from customers for future information security service over the term of the service agreement.
The Company expects to recognize revenue of $428,839 within the next 12 months and $nil after 12 months to 36 months.
Revenue is recognized when the related
performance obligation is satisfied.
Disaggregation information of revenue
by service type which was recognized based on the nature of performance obligation disclosed above is as follows:
| | |
For the six months ended June
30, | |
| | |
2023 | | |
Percentage of
Total | | |
2022 | | |
Percentage of
Total | |
| Service Type | |
$ | | |
Revenue | | |
$ | | |
Revenue | |
| | |
(Unaudited) | | |
| | |
(Unaudited) | | |
| |
| Cash-In-Transit – Non-Dedicated Vehicles (CIT Non-DV) | |
$ | 5,988,087 | | |
| 32.5 | % | |
$ | 5,377,474 | | |
| 31.8 | % |
| Cash-In-Transit – Dedicated Vehicle to Banks (CIT DV) | |
| 1,961,464 | | |
| 10.7 | % | |
| 2,135,199 | | |
| 12.6 | % |
| ATM Management | |
| 3,895,708 | | |
| 21.2 | % | |
| 4,731,015 | | |
| 27.9 | % |
| Cash Processing (CPC) | |
| 1,613,933 | | |
| 8.8 | % | |
| 1,410,902 | | |
| 8.3 | % |
| Cash Center Operations (CCT) | |
| 958,760 | | |
| 5.2 | % | |
| 1,202,214 | | |
| 7.1 | % |
| Consolidate Cash Center (CCC) | |
| 395,105 | | |
| 2.1 | % | |
| 225,513 | | |
| 1.3 | % |
| Cheque Center Service (CDC) | |
| - | | |
| - | % | |
| 4,729 | | |
| 0.05 | % |
| Others ** | |
| 4,332 | | |
| 0.02 | % | |
| 4,399 | | |
| 0.05 | % |
| Cash Deposit Management Solutions (GDM) | |
| 1,125,767 | | |
| 6.1 | % | |
| 869,102 | | |
| 5.1 | % |
| Robotics AI solutions | |
| 440,229 | | |
| 2.4 | % | |
| 719,041 | | |
| 4.2 | % |
| Information security | |
| 407,689 | | |
| 2.2 | % | |
| 262,934 | | |
| 1.6 | % |
| General security solutions | |
| 1,622,218 | | |
| 8.8 | % | |
| - | | |
| - | % |
| Total | |
$ | 18,413,292 | | |
| 100.0 | % | |
$ | 16,942,522 | | |
| 100.0 | % |
During the six months ended June 30,
2022, revenues amounting to $16,808,399 were generated from third parties; and $134,123 were generated from a related party (Note 22).
During the six months ended June 30,
2023 all revenues were generated from third parties.
Cost of sales consists primarily
of internal labor costs and related benefits, and other overhead costs that are directly attributable to services provided.
| 2.15 | New and amended accounting standards |
All new standards and amendments that
are effective for annual reporting period commencing January 1, 2023 have been applied by the Company for the six months ended June 30,
2023. The adoption of these new and amended standards did not have material impact on the interim condensed consolidated financial statements
of the Company. A number of new standards and amendments to standards have not come into effect for the year beginning January 1, 2023,
and they have not been early adopted by the Company in preparing these interim condensed consolidated financial statements. None of these
new standards and amendments to standards is expected to have a significant effect on the interim condensed consolidated financial statements
of the Company.
In 2021 and 2022, the Company acquired
a total of five subsidiaries, these acquisitions have been accounted for in accordance with IFRS 3 guidelines under acquisition accounting,
whereby the Company recognized the assets and liabilities transferred at their carrying amounts with carry-over basis.
A Purchase Price Allocation exercise
has been undertaken to establish the constituent parts of the acquired companies’ balance sheet at fair value on acquisition. As
is customary in these circumstances, this will remain under review and subject to change during the twelve-month hindsight period. The
interim condensed consolidated financial statements condensed the information and disclosures of all the acquired subsidiaries required
in the audited financial statements, and should be read in conjunction with the Company’s audited consolidated financial statements
as of December 31, 2022, 2021 and 2020.
The following represents the
purchase price allocation at the dates of the acquisitions:
| | |
Handshake
on March 25,
2021 | | |
AI Macau
on February 9,
2022 | | |
AI
Malaysia
on January 20,
2022 | | |
Beijing
Wanjia on
June 22,
2022 | | |
Shenzhen
GFAI and
Guangzhou
GFAI on
March 22,
2022 | |
| Cash and cash equivalents | |
$ | 24,276 | | |
$ | 21,038 | | |
$ | 12,500 | | |
$ | 38,342 | | |
$ | 2,187 | |
| Other current assets | |
| 32,250 | | |
| 4,162 | | |
| - | | |
| 2,219,318 | | |
| 2,393,558 | |
| Property, plant and equipment | |
| - | | |
| - | | |
| - | | |
| 20,488 | | |
| 2,055,610 | |
| Intangible assets | |
| - | | |
| - | | |
| - | | |
| 1,593,398 | | |
| 1,592,783 | |
| Other non-current assets | |
| - | | |
| - | | |
| - | | |
| 203,765 | | |
| 23,566 | |
| Current liabilities | |
| (58,297 | ) | |
| (92,350 | ) | |
| (13,184 | ) | |
| (1,681,573 | ) | |
| (4,320,434 | ) |
| Goodwill | |
| 329,534 | | |
| 70,355 | | |
| 685 | | |
| 411,862 | | |
| 1,867,009 | |
| Total purchase price | |
$ | 327,763 | | |
$ | 3,205 | | |
$ | 1 | | |
$ | 2,805,600 | | |
$ | 3,614,279 | |
During the six months ended June 30,
2023, the Company recorded impairment losses on Handshake of $329,534 and on Shenzhen GFAI and Guangzhou GFAI of $933,506.
| 4. |
CASH, CASH EQUIVALENTS AND RESTRICTED CASH |
| | |
As of
June 30,
2023 | | |
As of
December 31,
2022 | |
| | |
(Unaudited) | | |
| |
| Cash on hand | |
$ | 465,853 | | |
$ | 471,408 | |
| Cash in bank | |
| 24,272,524 | | |
| 6,459,231 | |
| Subtotal | |
| 24,783,377 | | |
| 6,930,639 | |
| Restricted cash – current (a) | |
| 17,059 | | |
| - | |
| Restricted cash – non-current (b) | |
| 1,274,956 | | |
| 1,300,005 | |
| Cash, cash equivalents, and restricted cash | |
$ | 26,030,392 | | |
$ | 8,230,644 | |
| | |
As of
June 30,
2023 | | |
As of
December 31,
2022 | |
| | |
(Unaudited) | | |
| |
| Robots in warehouse | |
$ | 4,976,219 | | |
$ | 5,553,859 | |
| Robots in transit | |
| 46,950 | | |
| - | |
| Security equipment | |
| 415,036 | | |
| 494,793 | |
| Impairment provision for inventories | |
| (3,801,960 | ) | |
| (942,882 | ) |
| Inventories | |
$ | 1,636,245 | | |
$ | 5,105,770 | |
The Company recorded an allowance for
slow-moving or obsolete robot inventories of $3,090,283 and nil for the six months ended June 30, 2023 and 2022, respectively.
| 6. |
TRADE RECEIVABLES, NET |
| | |
As of
June 30,
2023 | | |
As of
December 31,
2022 | |
| | |
(Unaudited) | | |
| |
| Trade receivable | |
$ | 5,160,600 | | |
$ | 5,392,720 | |
| (Impairment provision) recovery of doubtful accounts | |
| (32,602 | ) | |
| 7,466 | |
| Trade receivable, net | |
$ | 5,127,998 | | |
$ | 5,400,186 | |
The Company recorded an allowance for
doubtful accounts of $45,932 and $nil for the six months ended June 30, 2023 and 2022, respectively.
| 7. |
WITHHOLDING TAX RECEIVABLE |
| | |
2023 | | |
2022 | |
| | |
(Unaudited) | | |
(Unaudited) | |
| Balance at January 1, | |
$ | 2,691,096 | | |
$ | 3,531,953 | |
| Addition | |
| 401,941 | | |
| 381,966 | |
| Collection | |
| - | | |
| (1,045,061 | ) |
| Write off/ Allowance for uncollectible | |
| (561,277 | ) | |
| (263,340 | ) |
| Exchange difference | |
| (73,713 | ) | |
| (153,902 | ) |
| Balance at June 30, | |
$ | 2,458,047 | | |
$ | 2,451,616 | |
| | |
As of
June 30,
2023 | | |
As of
December 31,
2022 | |
| | |
(Unaudited) | | |
| |
| Current portion | |
$ | 536,974 | | |
$ | 757,024 | |
| Non-current portion | |
| 1,921,073 | | |
| 1,934,072 | |
| Withholding tax receivable | |
$ | 2,458,047 | | |
$ | 2,691,096 | |
On July 12, 2023, the Company received
a withholding tax refund of THB18,959,514 (approximately $0.5 million) in connection with the Company’s 2018 withholding tax refund
applications of THB29,188,153 (approximately $0.8 million). The Company wrote off approximately $0.3 million, representing the difference
between the receivable recorded and the amount of refund subsequently received from the Thai Revenue Department.
During the six months ended June 30,
2022, the Company received a withholding tax refund of THB35,312,291 (approximately $1.0 million) in connection with the Company’s
2016 to 2017 withholding tax refund applications (totaled THB56,107,574 or approximately $1.6 million). The Company wrote off approximately
$0.6 million, representing the difference between the receivable recorded and the amount of refund received from the Thai Revenue Department.
Out of prudence, based on amount refunded
and written off for the receivable related to years 2013 to 2018, the Company recorded an allowance of approximately $0.3 million and
$0.1 million for the six months ended June 30, 2023 and 2022, respectively. As of June 30, 2023 and December 31, 2022, an allowance balance
of $1.2 million and $0.9 million, respectively were maintained against its withholding tax receivable.
| | |
As of
June 30,
2023 | | |
As of
December 31,
2022 | |
| | |
(Unaudited) | | |
| |
| Cash advance to a third-party vendor | |
$ | 778,724 | | |
$ | 817,564 | |
| Impairment provision for other receivables | |
| (778,724 | ) | |
| - | |
| | |
$ | - | | |
$ | 817,564 | |
The Company recorded an allowance
for doubtful accounts of $815,887 and $nil for the six months ended June 30, 2023 and 2022, respectively.
| 9. |
OTHER CURRENT AND OTHER NON-CURRENT ASSETS |
| | |
As of
June 30,
2023 | | |
As of
December 31,
2022 | |
| | |
(Unaudited) | | |
| |
| Input VAT and other taxes receivable | |
$ | 314,855 | | |
$ | 293,429 | |
| Prepayments – office and warehouse rental | |
| 1,240,967 | | |
| 780,279 | |
| Prepayments - insurance | |
| 375,985 | | |
| 106,167 | |
| Prepayments - others | |
| 166,165 | | |
| 91,926 | |
| Uniforms | |
| 14,781 | | |
| 24,699 | |
| Tools and supplies | |
| 152,035 | | |
| 155,642 | |
| Deferred costs | |
| 90,555 | | |
| 219,782 | |
| Cash advances to employees | |
| 25,375 | | |
| 71,084 | |
| Other current assets | |
$ | 2,380,718 | | |
$ | 1,743,008 | |
| | |
| | | |
| | |
| Deposits | |
$ | 397,030 | | |
$ | 437,602 | |
| Deferred costs | |
| - | | |
| 9,720 | |
| Other non-current assets | |
$ | 397,030 | | |
$ | 447,322 | |
The Company recorded an allowance for
doubtful accounts of $8,589 and $nil for the six months ended June 30, 2023 and 2022, respectively.
| 10. |
PROPERTY, PLANT and EQUIPMENT |
| | |
Leasehold
improvements | | |
Machinery
and
equipment | | |
Office
decoration
and
equipment | | |
Vehicles | | |
Assets
under
construction | | |
GDM
machines | | |
Robots | | |
Total | |
| Cost | |
| | |
| | |
| | |
| | |
| | |
| | |
| | |
| |
| At December 31, 2021 | |
$ | 3,239,683 | | |
$ | 5,108,501 | | |
$ | 5,412,444 | | |
$ | 16,233,868 | | |
$ | 248,686 | | |
$ | 1,713,926 | | |
$ | 5,369,070 | | |
$ | 37,326,178 | |
| Acquisitions through business combinations | |
| - | | |
| - | | |
| 205,070 | | |
| 141,619 | | |
| - | | |
| - | | |
| 2,571,013 | | |
| 2,917,702 | |
| Additions | |
| 26,342 | | |
| 18,698 | | |
| 18,603 | | |
| 80,350 | | |
| - | | |
| 318,905 | | |
| 2,178,914 | | |
| 2,641,812 | |
| Disposals | |
| (101,834 | ) | |
| (7,437 | ) | |
| (15,463 | ) | |
| (344,818 | ) | |
| (211,659 | ) | |
| (15,892 | ) | |
| (12,273 | ) | |
| (709,376 | ) |
| Exchange differences | |
| (173,963 | ) | |
| (281,325 | ) | |
| (298,630 | ) | |
| (880,949 | ) | |
| (4,472 | ) | |
| (107,391 | ) | |
| (392,122 | ) | |
| (2,138,852 | ) |
| At June 30, 2022 (Unaudited) | |
| 2,990,228 | | |
| 4,838,437 | | |
| 5,322,024 | | |
| 15,230,070 | | |
| 32,555 | | |
| 1,909,548 | | |
| 9,714,602 | | |
| 40,037,464 | |
| | |
| | | |
| | | |
| | | |
| | | |
| | | |
| | | |
| | | |
| | |
| At December 31, 2022 | |
$ | 3,146,864 | | |
$ | 4,868,015 | | |
$ | 5,354,351 | | |
$ | 15,518,987 | | |
$ | 33,222 | | |
$ | 1,948,698 | | |
$ | 7,194,815 | | |
$ | 38,064,952 | |
| Additions | |
| - | | |
| 1,750 | | |
| 6,964 | | |
| - | | |
| - | | |
| 624,126 | | |
| 273,779 | | |
| 906,619 | |
| Disposals | |
| (104,773 | ) | |
| (105,939 | ) | |
| (48,955 | ) | |
| (47,155 | ) | |
| - | | |
| - | | |
| (56,389 | ) | |
| (363,211 | ) |
| Impairment of fixed assets | |
| - | | |
| - | | |
| - | | |
| - | | |
| - | | |
| - | | |
| (1,591,766 | ) | |
| (1,591,766 | ) |
| Exchange differences | |
| (60,518 | ) | |
| (95,521 | ) | |
| (106,807 | ) | |
| (353,552 | ) | |
| (652 | ) | |
| (38,238 | ) | |
| (141,241 | ) | |
| (796,529 | ) |
| At June 30, 2023 (Unaudited) | |
| 2,981,573 | | |
| 4,668,305 | | |
| 5,205,553 | | |
| 15,118,280 | | |
| 32,570 | | |
| 2,534,586 | | |
| 5,679,198 | | |
| 36,220,065 | |
| | |
| | | |
| | | |
| | | |
| | | |
| | | |
| | | |
| | | |
| | |
| Accumulated Depreciation | |
| | | |
| | | |
| | | |
| | | |
| | | |
| | | |
| | | |
| | |
| At December 31, 2021 | |
$ | 2,693,472 | | |
$ | 4,906,277 | | |
$ | 4,799,149 | | |
$ | 13,447,168 | | |
$ | - | | |
$ | 891,378 | | |
$ | 691,433 | | |
$ | 27,428,877 | |
| Acquisitions through business combinations | |
| - | | |
| - | | |
| 184,364 | | |
| 136,723 | | |
| - | | |
| - | | |
| 520,516 | | |
| 841,603 | |
| Depreciation charged for the period | |
| 51,903 | | |
| 57,623 | | |
| 96,235 | | |
| 416,775 | | |
| - | | |
| 188,620 | | |
| 762,874 | | |
| 1,574,030 | |
| Disposals | |
| (99,439 | ) | |
| (7,396 | ) | |
| (15,432 | ) | |
| (330,993 | ) | |
| - | | |
| (5,303 | ) | |
| (461 | ) | |
| (459,024 | ) |
| Exchange differences | |
| (146,005 | ) | |
| (271,901 | ) | |
| (268,318 | ) | |
| (742,974 | ) | |
| - | | |
| (56,970 | ) | |
| (81,330 | ) | |
| (1,567,498 | ) |
| As June 30, 2022 (Unaudited) | |
| 2,499,931 | | |
| 4,684,603 | | |
| 4,795,998 | | |
| 12,926,699 | | |
| - | | |
| 1,017,725 | | |
| 1,893,032 | | |
| 27,817,988 | |
| | |
| | | |
| | | |
| | | |
| | | |
| | | |
| | | |
| | | |
| | |
| At December 31, 2022 | |
$ | 2,577,341 | | |
$ | 4,748,031 | | |
$ | 4,889,742 | | |
$ | 13,493,656 | | |
$ | - | | |
$ | 1,230,247 | | |
$ | 3,059,174 | | |
$ | 29,998,191 | |
| Depreciation charged for the period | |
| 48,922 | | |
| 34,180 | | |
| 87,164 | | |
| 263,962 | | |
| - | | |
| 202,983 | | |
| 516,626 | | |
| 1,153,837 | |
| Disposals | |
| (108,213 | ) | |
| (109,514 | ) | |
| (44,542 | ) | |
| (48,748 | ) | |
| | | |
| - | | |
| (14,847 | ) | |
| (325,864 | ) |
| Exchange differences | |
| (48,443 | ) | |
| (90,705 | ) | |
| (101,287 | ) | |
| (275,519 | ) | |
| - | | |
| (30,774 | ) | |
| (77,779 | ) | |
| (624,507 | ) |
| As June 30, 2023 (Unaudited) | |
| 2,469,607 | | |
| 4,581,992 | | |
| 4,831,077 | | |
| 13,433,351 | | |
| - | | |
| 1,402,456 | | |
| 3,483,174 | | |
| 30,201,657 | |
| | |
| | | |
| | | |
| | | |
| | | |
| | | |
| | | |
| | | |
| | |
| Net book value | |
| | | |
| | | |
| | | |
| | | |
| | | |
| | | |
| | | |
| | |
| At June 30, 2022 (Unaudited) | |
$ | 490,298 | | |
$ | 153,834 | | |
$ | 526,026 | | |
$ | 2,303,371 | | |
$ | 32,555 | | |
$ | 891,822 | | |
$ | 7,821,570 | | |
$ | 12,219,476 | |
| At June 30, 2023 (Unaudited) | |
$ | 511,966 | | |
$ | 86,313 | | |
$ | 374,476 | | |
$ | 1,684,929 | | |
$ | 32,570 | | |
$ | 1,132,130 | | |
$ | 2,196,024 | | |
$ | 6,018,408 | |
Depreciation expense related to property,
plant and equipment was $1,057,117 and $1,460,187, respectively for the six months ended June 30, 2023 and 2022.
For the six months ended June 30, 2023
and 2022, the Company recorded an impairment loss on robot assets of $1,591,766 and $nil, respectively.
As of June 30, 2023 and 2022, net book
value of robot assets of approximately $695,000 and $1,145,000, respectively were leased out to third parties and the robot assets were
held and used by the lessee.
| 11. |
RIGHT-OF-USE ASSETS AND OPERATING LEASE LIABILITIES |
The carrying amounts of right-of-use assets are
as below:
| | |
2023 | | |
2022 | |
| | |
(Unaudited) | | |
(Unaudited) | |
| Balance at January 1, | |
$ | 4,171,409 | | |
$ | 2,364,993 | |
| New leases | |
| 271,004 | | |
| 804,500 | |
| New leases acquired through business combinations | |
| - | | |
| 167,597 | |
| Depreciation expense | |
| (1,042,981 | ) | |
| (1,095,227 | ) |
| Exchange difference | |
| (75,562 | ) | |
| (108,566 | ) |
| Balance at June 30, | |
$ | 3,323,870 | | |
$ | 2,133,297 | |
Lease liabilities were measured at the
present value of the remaining lease payments, discounted using the lessee’s incremental borrowing rate. The weighted average incremental
borrowing rate applied to new leases during the six months ended June 30, 2023 was 3.52%. The weighted average incremental borrowing rate
applied to new leases during the six months ended June 30, 2022 varies from 3.49% to 5% in different regions.
For the six months ended June 30, 2023
and 2022, interest expense of $58,602 and $41,211 arising from lease liabilities was included in finance costs, respectively. Depreciation
expense related to right-of-use assets was $1,026,316 and $1,064,623, respectively for the six months ended June 30, 2023 and 2022.
| | |
| | |
| | |
| | |
| | |
| | |
Assets under construction | | |
| | |
| |
| | |
Computer
software | | |
Right-of-use
Platform | | |
Customer
base | | |
Technical
know-how | | |
Security
Surveillance
system | | |
Cash
Management
Systems | | |
Intelligent
Cloud
Platform | | |
Intelligent
Cloud
Platforms | | |
Total | |
| Cost | |
| | |
| | |
| | |
| | |
| | |
| | |
| | |
| | |
| |
| At December 31, 2021 | |
$ | 907,304 | | |
$ | - | | |
$ | - | | |
$ | - | | |
$ | - | | |
$ | - | | |
$ | - | | |
$ | - | | |
$ | 907,304 | |
| Acquisitions through business combinations | |
| - | | |
| 733,311 | | |
| 1,120,688 | | |
| 514,968 | | |
| 1,102,647 | | |
| - | | |
| - | | |
| - | | |
| 3,471,614 | |
| Additions | |
| 1,761 | | |
| - | | |
| | | |
| - | | |
| - | | |
| 81,119 | | |
| 3,000,000 | | |
| | | |
| 3,082,880 | |
| Exchange differences | |
| (49,955 | ) | |
| - | | |
| - | | |
| - | | |
| - | | |
| (3,525 | ) | |
| | | |
| - | | |
| (53,480 | ) |
| At June 30, 2022 (Unaudited) | |
| 859,110 | | |
| 733,311 | | |
| 1,120,688 | | |
| 514,968 | | |
| 1,102,647 | | |
| 77,594 | | |
| 3,000,000 | | |
| - | | |
| 7,408,318 | |
| | |
| | | |
| | | |
| | | |
| | | |
| | | |
| | | |
| | | |
| | | |
| | |
| At December 31, 2022 | |
$ | 887,745 | | |
$ | 673,029 | | |
$ | 1,042,110 | | |
$ | 499,344 | | |
$ | 1,360,898 | | |
$ | 194,495 | | |
$ | 3,000,000 | | |
$ | - | | |
$ | 7,657,621 | |
| Additions | |
| - | | |
| - | | |
| - | | |
| - | | |
| 195,087 | | |
| - | | |
| - | | |
| 1,597,754 | | |
| 1,792,841 | |
| Transfer | |
| - | | |
| - | | |
| - | | |
| - | | |
| - | | |
| - | | |
| (2,821,882 | ) | |
| 2,821,882 | | |
| - | |
| Exchange differences | |
| (17,419 | ) | |
| (31,974 | ) | |
| (49,509 | ) | |
| (23,723 | ) | |
| (306,604 | ) | |
| (3,816 | ) | |
| - | | |
| - | | |
| (433,045 | ) |
| At June 30, 2023 (Unaudited) | |
| 870,326 | | |
| 641,055 | | |
| 992,601 | | |
| 475,621 | | |
| 1,249,381 | | |
| 190,679 | | |
| 178,118 | | |
| 4,419,636 | | |
| 9,017,417 | |
| | |
| | | |
| | | |
| | | |
| | | |
| | | |
| | | |
| | | |
| | | |
| | |
| Accumulated amortization | |
| | | |
| | | |
| | | |
| | | |
| | | |
| | | |
| | | |
| | | |
| | |
| At December 31, 2021 | |
$ | 742,988 | | |
$ | - | | |
$ | - | | |
$ | - | | |
$ | - | | |
$ | - | | |
$ | - | | |
$ | - | | |
$ | 742,988 | |
| Acquisitions through business combinations | |
| - | | |
| - | | |
| - | | |
| - | | |
| 285,433 | | |
| - | | |
| - | | |
| - | | |
| 285,433 | |
| Amortization charged for the period | |
| 25,290 | | |
| 17,951 | | |
| 129,327 | | |
| - | | |
| - | | |
| - | | |
| - | | |
| - | | |
| 172,568 | |
| Exchange differences | |
| (41,944 | ) | |
| | | |
| - | | |
| - | | |
| - | | |
| - | | |
| - | | |
| - | | |
| (41,944 | ) |
| As June 30, 2022 (Unaudited) | |
| 726,334 | | |
| 17,951 | | |
| 129,327 | | |
| - | | |
| 285,433 | | |
| - | | |
| - | | |
| - | | |
| 1,159,045 | |
| | |
| | | |
| | | |
| | | |
| | | |
| | | |
| | | |
| | | |
| | | |
| | |
| At December 31, 2022 | |
$ | 767,168 | | |
$ | 50,477 | | |
$ | 405,868 | | |
$ | 28,405 | | |
$ | 612,560 | | |
$ | - | | |
$ | - | | |
$ | - | | |
$ | 1,864,478 | |
| Amortization charged for the period | |
| 26,139 | | |
| 33,582 | | |
| 201,013 | | |
| 28,346 | | |
| 63,817 | | |
| - | | |
| - | | |
| 182,671 | | |
| 535,568 | |
| Exchange differences | |
| (15,908 | ) | |
| (3,927 | ) | |
| (28,438 | ) | |
| (2,641 | ) | |
| (286,182 | ) | |
| - | | |
| - | | |
| - | | |
| (337,096 | ) |
| As June 30, 2023 (Unaudited) | |
| 777,399 | | |
| 80,132 | | |
| 578,443 | | |
| 54,110 | | |
| 390,195 | | |
| - | | |
| - | | |
| 182,671 | | |
| 2,062,950 | |
| | |
| | | |
| | | |
| | | |
| | | |
| | | |
| | | |
| | | |
| | | |
| | |
| Net book value | |
| | | |
| | | |
| | | |
| | | |
| | | |
| | | |
| | | |
| | | |
| | |
| At June 30, 2022 (Unaudited) | |
$ | 132,776 | | |
$ | 715,360 | | |
$ | 991,361 | | |
$ | 514,968 | | |
$ | 817,214 | | |
$ | 77,594 | | |
$ | 3,000,000 | | |
$ | - | | |
$ | 6,249,273 | |
| At June 30, 2023 (Unaudited) | |
$ | 92,927 | | |
$ | 560,923 | | |
$ | 414,158 | | |
$ | 421,511 | | |
$ | 859,186 | | |
$ | 190,679 | | |
$ | 178,118 | | |
$ | 4,236,965 | | |
$ | 6,954,467 | |
Amortization expense related to intangible
assets was $535,568 and $172,568, respectively for the six months ended June 30, 2023 and 2022.
| 13. |
TRADE AND OTHER PAYABLES AND OTHER CURRENT LIABILITIES |
| | |
As of
June 30,
2023 | | |
As of
December 31,
2022 | |
| | |
(Unaudited) | | |
| |
| Trade payables – third parties | |
$ | 2,596,576 | | |
$ | 2,060,856 | |
| Accrued salaries and bonus | |
| 454,218 | | |
| 515,758 | |
| Accrued customer claims, cash loss and shortage ** | |
| 15,044 | | |
| 57,381 | |
| Trade and other payables | |
$ | 3,065,838 | | |
$ | 2,633,995 | |
| | |
| | | |
| | |
| Output VAT | |
$ | 74,171 | | |
$ | 118,125 | |
| Accrued expenses | |
| 389,318 | | |
| 522,059 | |
| Payroll payable | |
| 1,776,907 | | |
| 979,027 | |
| Other payables | |
| 168,052 | | |
| 289,494 | |
| Deferred revenue | |
| 428,839 | | |
| 568,664 | |
| Other current liabilities | |
$ | 2,837,287 | | |
$ | 2,477,369 | |
| |
|
As of
June 30,
2023 |
|
|
As of
December 31,
2022 |
|
| |
|
(Unaudited) |
|
|
|
|
| Current portion of long-term bank borrowings |
|
$ |
1,039,988 |
|
|
$ |
947,559 |
|
| Current portion of long-term third-party borrowing |
|
|
2,469,721 |
|
|
|
2,234,057 |
|
| Long-term bank borrowings |
|
|
138,212 |
|
|
|
432,179 |
|
| Long-term third-party borrowing |
|
|
13,589,362 |
|
|
|
13,467,639 |
|
| Total borrowings |
|
$ |
17,237,283 |
|
|
$ |
17,081,434 |
|
The Company maintains two borrowings
with one financial institution. The borrowings are used for working capital purposes to support its business operations in Thailand. Those
borrowings carry interest at the rates of 4.72% and 4.69% per annum. The borrowings mature on July 29, 2023 and April 7, 2025. For the
six months ended June 30, 2023 and 2022, the interest expense was $33,394 and $33,745, respectively.
As of June 30, 2023, the Company has
unused bank overdraft availability of approximately $283,000 (THB10 million) and no unused trust receipts availability.
The Company obtained a loan in the principal amount of $13.42 million
from WK Venture Success Limited (“WK Venture”), a third party on April 25, 2018.
The Loan bears interest at 4% and is due on December 31, 2024. In accordance with the terms of the Agreements, the Company is required
to pay the full principal amount of the Loan, along with accrued interest, on December 31, 2024 and the Company is not required to make
monthly payments on this obligation. For the six months ended June 30, 2023 and 2022, interest expense was $411,270 and $400,920, respectively.
The accrued interest portion of this loan is classified as short-term borrowing and the principal portion of this loan is classified as
long-term borrowing. On September 28, 2023, WK Venture agreed to convert the principal and accrued interest of this loan in an aggregate
amount of $15,914,615 at the conversion price of $5.40 into restricted ordinary shares of the Company.
| 15. |
CONVERTIBLE NOTE PAYABLE |
On October
25, 2022, the Company entered into a securities purchase agreement with Streeterville Capital, LLC ( “CVP”), pursuant to which
the Company issued CVP an unsecured convertible promissory note on October 25, 2022 in the original principal amount of $1,707,500.00
(the “Note”), convertible into the Company’s ordinary shares.
The Note bears simple interest at a
rate of 8% per annum. All outstanding principal and accrued interest on the Note will become due and payable on the maturity date, which
is twelve months after the purchase price of the Note is delivered by Investor to the Company. Subject to the occurrence of any triggering
events as defined in the Note, the Investor shall have the right to increase the balance of the Note by 5% or 10%. The Company may pay
all or any portion of the amount owed earlier than it is due; provided that in the event the Company elects to prepay all or any portion
of the outstanding balance, the Company shall pay to the Investor 120% of the portion of the outstanding balance the Company elects to
prepay. Early payments of less than all principal, fees and interest outstanding will not, unless agreed to by Investor in writing, relieve
the Company of the Company’s remaining obligations hereunder.
On April 17, 2023, CVP delivered to
the Company a conversion notice informing the Company that CVP had elected to convert a portion of the Note balance $1,238,400 at the
conversion price of $7.20 into restricted ordinary shares of the Company. In connection with this conversion, the Company issued 172,000
restricted ordinary shares to CVP on April 19, 2023. As of April 17, 2023, the date of conversion notice, $534,744 remained outstanding
under the Note. For the six months ended June 30, 2023, the interest expense was $65,644.
| 16. |
FINANCE LEASE LIABILITIES |
| | |
As of
June 30,
2023 | | |
As of
December 31,
2022 | |
| | |
(Unaudited) | | |
| |
| Current portion | |
$ | 200,383 | | |
$ | 398,136 | |
| Non-current portion | |
| 229,747 | | |
| 233,550 | |
| Finance lease liabilities | |
$ | 430,130 | | |
$ | 631,686 | |
For the six months ended June 30, 2023
and 2022, interest expense was $15,987 and $30,942, respectively.
The minimum lease payments under finance
lease agreements are as follows:
| | |
As of
June 30,
2023 | | |
As of
December 31,
2022 | |
| | |
(Unaudited) | | |
| |
| Within 1 year | |
$ | 212,173 | | |
$ | 423,514 | |
| After 1 year but within 5 years | |
| 248,490 | | |
| 253,448 | |
| Less: Finance charges | |
| (30,533 | ) | |
| (45,276 | ) |
| Present value of finance lease liabilities, net | |
$ | 430,130 | | |
$ | 631,686 | |
Finance lease assets comprise primarily
vehicles and office equipment as follow:
| | |
As of
June 30,
2023 | | |
As of
December 31,
2022 | |
| | |
(Unaudited) | | |
| |
| Cost | |
$ | 1,540,416 | | |
$ | 1,571,075 | |
| Less: Accumulated depreciation | |
| (618,097 | ) | |
| (564,844 | ) |
| Net book value | |
$ | 922,319 | | |
$ | 1,006,231 | |
Value added tax (“VAT”)
GF Cash (CIT) and AI R&I are subsidiaries
operating in Thailand, which are subject to a statutory VAT of 7% for services in Thailand. Shenzhen GFAI, Guangzhou GFAI and Beijing
Wanjia are subsidiaries operating in the PRC, which are subject to a statutory VAT of 13% for goods delivered and rental provided, 6%
for services provided and 9% for construction projects in the PRC. The output VAT is charged to customers who receive services from the
Company and the input VAT is paid when the Company purchases goods and services from its vendors. The input VAT can be offset against
the output VAT. The VAT payable is presented on the balance sheets when input VAT is less than the output VAT. A recoverable balance is
presented on the balance sheets when input VAT is larger than the output VAT.
Income tax
Current income tax is provided on the
basis of net income for financial reporting purposes, adjusted for income and expense items which are not assessable or deductible for
income tax purposes, in accordance with the regulations of the relevant tax jurisdictions. Deferred income tax is accounted for using
an asset and liability method. Under this method, deferred income tax is recognized for the tax consequences of temporary differences
by applying enacted statutory rates applicable to future years to differences between the financial statement carrying amounts and the
tax bases of existing assets and liabilities. The tax base of an asset or liability is the amount attributed to that asset or liability
for tax purposes. The effect on deferred tax of a change in tax rates is recognized in the consolidated statements of profit or loss in
the period of change. A valuation allowance is provided to reduce the amount of deferred tax assets if it is considered more likely than
not that some portion of, or all of the deferred tax assets will not be realized.
The Company offsets deferred tax assets
and deferred tax liabilities if and only if it has a legally enforceable right to set off current tax assets and current tax liabilities
and the deferred tax assets and deferred tax liabilities relate to income tax levied by the same taxation authority on either the same
taxable entity or different taxable entities which intend either to settle current tax liabilities and assets on a net basis, or to realize
the assets and settle the liabilities simultaneously, in each future period in which significant amounts of deferred tax liabilities or
assets are expected to be settled or recovered. During the six months ended June 30, 2023 and 2022, the Company made a valuation allowance
of $874,431 and $nil on the portion of deferred tax assets not expected to be realized.
| 18. |
PROVISION FOR EMPLOYEE BENEFITS |
Prior to March 30, 2022, the Company
had only one retired benefit plan (“Plan A”), on March 30, 2022, the Company established an additional retired benefit plan
(“Plan B”). Both plans are based on the requirements of the Thailand Labor Protection Act B.E.2541 (1988) to provide retirement
benefits to employees based on pensionable remuneration and length of service which are considered as unfunded. The plan asset is unfunded
and the Company will pay benefits when needed.
| | |
Provision for
employee benefits | |
| | |
2023 | | |
2022 | |
| | |
(Unaudited) | | |
(Unaudited) | |
| Defined benefit obligations at January 1, | |
$ | 4,849,614 | | |
$ | 5,819,132 | |
| Estimate for the six months period* | |
| (74,552 | ) | |
| (348,418 | ) |
| Defined benefit obligations at June 30, | |
$ | 4,775,062 | | |
$ | 5,470,714 | |
On January 31, 2023, the Company completed
a 1 for 40 share consolidation of its authorized and issued ordinary shares whereby every forty shares were consolidated into one share.
In addition, the par value of each ordinary share increased from $0.003 to $0.12. Immediately following the completion of the share consolidation,
the Company increased its authorized ordinary shares from 7,500,000 ordinary shares to 300,000,000 ordinary shares.
On February 17, 2023, a total of 2,339
fractional shares were canceled as a result of the share consolidation.
In connection with the restricted ordinary
shares issued on June 16, 2022 as a deposit to acquire 100% of the equity interests in seven Kewei Group companies, such acquisition was
terminated on September 13, 2022 (Note 22) and on February 13, a total of 243,000 shares were returned and cancelled.
In connection with an asset purchase
agreement entered between the Company and Shenzhen Kewei Robot Technology Co., Limited (“Shenzhen Kewei”) on December
21, 2022 to purchase certain of Shenzhen Kewei’s robot-related business assets in China (Note 1), on March 1, 2023, a total of 262,500
restricted ordinary shares were issued to the shareholders of Shenzhen Kewei.
In connection with the conversion of
the convertible note with Streeterville Capital, LLC (“CVP”) (Note 15), the Company issued 172,000 restricted ordinary shares
to CVP on April 19, 2023.
A total of 128,901 warrants were exercised
during the six months ended June 30, 2023. No warrants were exercised subsequently from July 1, 2023 to the date of this filing. As of
June 30, 2023, we have an aggregate of 2,013,759 warrants issued and outstanding. On March 8, 2023, the Company issued a Notice regarding
Adjustment of Exercise Price (for Public Warrants) after share consolidation to the Company’s public warrant holders. As a result
of the share consolidation, the exercise price under the public warrant was proportionately increased from $0.16 to $6.40, the exercise
price under the private warrant was proportionately increased from $0.18 to $7.20. If any holder exercises one warrant, one-40th (1/40)
ordinary share will be received in cash (by Cash in Lieu), holders must exercise at least 40 warrants to receive 1 ordinary share.
On May 5, 2023, the Company completed
an underwritten public offering (“CMPO 1”) to issue 1,720,430 ordinary shares and an additional 258,064 ordinary shares for
the exercise of an over-allotment option at the time of the closing at a public offering price of $4.65 per share for aggregate gross
proceeds of approximately $9.2 million. On May 12, 2023, the Company completed another underwritten public offering (“CMPO 2”) to issue 2,580,600 ordinary shares and an additional 387,090 ordinary shares for the exercise of an over-allotment
option at the time of the closing at a public offering price of $4.65 per share for aggregate gross proceeds of approximately $13.8 million.
| 20. |
SELLING, DISTRIBUTION AND ADMINISTRATIVE EXPENSES |
| | |
For the six months ended
June 30, | |
| | |
2023 | | |
2022 | |
| | |
(Unaudited) | | |
(Unaudited) | |
| Staff expense | |
$ | 3,602,127 | | |
$ | 2,988,331 | |
| Rental expense | |
| 345,026 | | |
| 77,999 | |
| Depreciation and amortization expense | |
| 1,251,359 | | |
| 1,176,705 | |
| Utilities expense | |
| 53,015 | | |
| 30,021 | |
| Travelling and entertainment expense | |
| 135,186 | | |
| 216,633 | |
| Marketing expense | |
| 150,203 | | |
| 228,054 | |
| Professional fees | |
| 774,553 | | |
| 1,262,085 | |
| Repairs and maintenance | |
| 35,298 | | |
| 26,835 | |
| Employee benefits | |
| 29,316 | | |
| 228,506 | |
| Research and development expense | |
| 95,322 | | |
| 68,946 | |
| Other expenses** | |
| 510,255 | | |
| 673,881 | |
| | |
$ | 6,981,660 | | |
$ | 6,977,996 | |
Thailand
Under the provisions of the Civil and
Commercial Code, GF Cash (CIT) is required to set aside as a legal reserve at least 5% of the profits arising from the business of the
Company at each dividend distribution until the reserve is at least 10% of the registered share capital. The legal reserve is non-distributable.
The Company reserve has met the legal reserve requirement of $223,500 as of June 30, 2023 and December 31, 2022.
The
PRC
Pursuant to
the laws applicable to the PRC’s Foreign Investment Enterprises, the Company must make appropriations from after-tax profit to non-distributable
reserve funds. Subject to certain cumulative limits, the general reserve requires annual appropriations of 10% of after-tax profits as
determined under the PRC laws and regulations at each year-end until the balance reaches 50% of the PRC entity registered capital; the
other reserve appropriations are at the Company’s discretion. These reserves can only be used for specific purposes of enterprise
expansion and are not distributable as cash dividends. For the six months ended June 30, 2023, the Company did not accrue any legal reserve.
| 22. |
RELATED PARTY TRANSACTIONS |
The principal related party balances
as of June 30, 2023 and December 31, 2022 are as follows:
Amounts due from related parties:
| | |
| |
As of
June 30,
2023 | | |
As of
December 31,
2022 | |
| | |
| |
(Unaudited) | | |
| |
| Guardforce TH Group Company Limited | |
(c) | |
$ | 1,749 | | |
$ | 894 | |
| Guardforce AI Technology Limited | |
(c) | |
| 423 | | |
| 423 | |
| Guardforce AI Service Limited | |
(c) | |
| 423 | | |
| 423 | |
| Shenzhen Intelligent Guardforce Robot Technology Co., Limited | |
(a) | |
| 5,544,156 | | |
| 7,312,883 | |
| Shareholders’ of Shenzhen Kewei Robot Technology Co., Limited and its subsidiaries | |
(b) | |
| 2,160,000 | | |
| 7,020,000 | |
| Nanjing Zhongzhi Yonghao Robot Co., Ltd. | |
(c) | |
| - | | |
| 7,297 | |
| Nanchang Zongkun Intelligent Technology Co., Ltd. | |
(c) | |
| - | | |
| 7,310 | |
| Sichuan Qiantu Guardforce Robot Technology Co., Ltd. | |
(c) | |
| - | | |
| 3,777 | |
| Shanghai Nanshao Fire Engineering and Equipment Co., Ltd. | |
(c) | |
| - | | |
| 144,737 | |
| CSF Mingda Technology Co., Ltd | |
(c) | |
| 9,752 | | |
| 11,129 | |
| | |
| |
$ | 7,716,503 | | |
$ | 14,508,873 | |
| (a) | On May 25, 2023, following the repayment plan provided by Tu Jingyi (“Mr. Tu”) to the Company on March 1, 2023 in connection with the settlement of the outstanding balance of the receivables due from the related parties under Mr. Tu’s control, the Company entered into an agreement with Mr. Tu, Shenzhen Intelligent Guardforce Robot Technology Co., Limited (“CIOT”), Shenzhen Kewei Robot Technology Co., Limited and its subsidiaries (“Shenzhen Kewei”) and Guardforce Holdings (HK) Limited (“GF Holdings”) to legally enforce the right to set-off certain recognized related party receivable and payable amounts on a net basis (“Netting Arrangement”). Mr. Tu agreed to waive the Company’s repayment of the borrowings from Guardforce Holdings (HK) Limited in an aggregate amount of $1,500,000 to offset the same amount of related party receivables with CIOT. As of the date of this filing, the Company is negotiating with Mr. Tu on the settlement of the second installment of $1,500,000 which is due on September 30, 2023 in accordance with the repayment plan. |
On September 13, 2022, the Company terminated the securities purchase agreement, the cash paid to Shenzhen Kewei was agreed to be refunded and the shares issued to Shenzhen Kewei was agreed to be returned. On February 13, 2023, 243,000 restricted ordinary shares amounting to $4,860,000 were returned to and canceled by the Company.
On March 31, 2023, shareholders’ of Shenzhen Kewei repaid RMB2,000,000 (approximately $291,000) to the Company. On May 25, 2023, an amount of $1,500,000 due was offset with the borrowings from Guardforce Holdings (HK) Limited under the Netting Arrangement.
Amounts due to related parties:
| | |
| |
As of
June 30,
2023 | | |
As of
December 31,
2022 | |
| | |
| |
(Unaudited) | | |
| |
| Tu Jingyi | |
(a) | |
$ | 220,808 | | |
$ | 210,028 | |
| Guardforce Holdings (HK) Limited | |
(b) | |
| 423,184 | | |
| 394,016 | |
| Guardforce Security (Thailand) Company Limited | |
(c) | |
| 68,897 | | |
| 77,413 | |
| Shenzhen Kewei Robot Technology Co., Limited and its subsidiaries | |
(d) | |
| 2,569,448 | | |
| 2,403,555 | |
| Shenzhen Zhongzhi Yonghao Robot Co., Ltd. | |
| |
| 376,391 | | |
| 394,151 | |
| Shenzhen Qianban Technology Co., Ltd. | |
(d) | |
| - | | |
| 99,733 | |
| Guardforce Security Service (Shanghai) Co., Ltd. | |
(e) | |
| 34,465 | | |
| 267,764 | |
| Shenzhen Guardforce Qiyun Technology Co., Ltd. | |
(e) | |
| - | | |
| 189 | |
| Shanghai Yongan Security Alarm System Co., Ltd. | |
(e) | |
| 9,650 | | |
| 21,842 | |
| Guardforce Aviation Security Company Limited | |
(c) | |
| 195 | | |
| - | |
| | |
| |
$ | 3,703,038 | | |
$ | 3,868,691 | |
Short-term borrowings from related parties:
| | |
| |
As of
June 30,
2023 | | |
As of
December 31,
2022 | |
| | |
| |
(Unaudited) | | |
| |
| Guardforce Holdings (HK) Limited | |
(a) | |
$ | 1,666,846 | | |
$ | 3,148,500 | |
Long-term borrowings from related parties:
| | |
| |
As of
June 30,
2023 | | |
As of
December 31,
2022 | |
| | |
| |
(Unaudited) | | |
| |
| Guardforce Holdings (HK) Limited | |
(b) | |
$ | - | | |
$ | 18,346 | |
| Tu Jingyi | |
(c) | |
| 1,437,303 | | |
| 1,437,303 | |
| | |
| |
$ | 1,437,303 | | |
$ | 1,455,649 | |
| (a) | On September 9, 2020, the Company borrowed $413,500 from Guardforce Holdings (HK) Limited. The loan is unsecured and it bears interest at 2%. The loan is due on September 8, 2023. For the six months ended June 30, 2023 and 2022, interest expense on this loan was $3,446 and $4,135, respectively. On May 25, 2023, the principal amount of this loan of $413,500 was settled under the Netting Arrangement. |
The principal related party
transactions for the six months ended June 30, 2023 and 2022 are as follows:
Related party transactions:
| | |
| |
For the six months ended
June 30, | |
| Nature | |
| |
2023 | | |
2022 | |
| | |
| |
(Unaudited) | | |
(Unaudited) | |
| Service/ Products received from related parties: | |
| |
| | |
| |
| Guardforce Security (Thailand) Company Limited | |
(a) | |
$ | 68,897 | | |
$ | 67,864 | |
| Guardforce Aviation Security Company Limited | |
(b) | |
| 600 | | |
| - | |
| Shenzhen Intelligent Guardforce Robot Technology Co., Limited – Purchases | |
(c) | |
| - | | |
| 7,008,322 | |
| Shenzhen Kewei Robot Technology Co., Ltd. – Purchases | |
(c) | |
| 141,569 | | |
| 844,255 | |
| Shenzhen Kewei Robot Technology Co., Limited – ICP | |
(d) | |
| - | | |
| 3,000,000 | |
| | |
| |
$ | 211,066 | | |
$ | 10,920,441 | |
| | |
| |
| | | |
| | |
| Service/ Products delivered to related parties: | |
| |
| | | |
| | |
| GF Technovation Company Limited – Sales | |
(e) | |
$ | - | | |
$ | 134,123 | |
Nature of transactions:
| 23. |
CONSOLIDATED SEGMENT DATA |
Selected information by segment is presented in the following
tables for the six months ended June 30, 2023 and 2022:
| | |
For the six months ended
June 30, | |
| Revenues(1) | |
2023 | | |
2022 | |
| | |
(Unaudited) | | |
(Unaudited) | |
| Secured logistics | |
$ | 15,943,156 | | |
$ | 15,960,547 | |
| Information security | |
| 407,689 | | |
| 262,934 | |
| Robotics AI solutions | |
| 440,229 | | |
| 719,041 | |
| General security solutions | |
| 1,622,218 | | |
| - | |
| | |
$ | 18,413,292 | | |
$ | 16,942,522 | |
| | |
For the six months ended
June 30, | |
| Operating loss | |
2023 | | |
2022 | |
| | |
(Unaudited) | | |
(Unaudited) | |
| Secured logistics | |
$ | (1,101,369 | ) | |
$ | (962,310 | ) |
| Information security | |
| (311,916 | ) | |
| (19,041 | ) |
| Robotics AI solutions | |
| (8,320,982 | ) | |
| (1,977,324 | ) |
| General security solutions | |
| (542,569 | ) | |
| - | |
| Corporate and others (2) | |
| (1,607,373 | ) | |
| (2,590,961 | ) |
| Operating loss | |
| (11,884,209 | ) | |
| (5,549,636 | ) |
| Total other income from five segments | |
| 77,765 | | |
| 46,859 | |
| Foreign exchange losses, net: | |
| | | |
| | |
| - Secured logistics | |
| (598,053 | ) | |
| (751,622 | ) |
| - Information security | |
| 432 | | |
| 44 | |
| - Robotics AI solutions | |
| 13,150 | | |
| 5,973 | |
| - Corporate and others | |
| 810 | | |
| (154 | ) |
| Finance costs: | |
| | | |
| | |
| - Secured logistics | |
| (423,440 | ) | |
| (405,365 | ) |
| - Information security | |
| (6,589 | ) | |
| (1,648 | ) |
| - Corporate and others | |
| (154,868 | ) | |
| (3,848 | ) |
| Loss before income tax | |
| (12,975,002 | ) | |
| (6,659,397 | ) |
| Provision for income tax (expense) benefit | |
| (874,431 | ) | |
| 320,183 | |
| Net loss for the period | |
| (13,849,433 | ) | |
| (6,339,214 | ) |
| Less: Loss attributable to the non-controlling interest | |
| 30,214 | | |
| 32,392 | |
| Net loss attributable to equity holders of the Company | |
$ | (13,819,219 | ) | |
$ | (6,306,822 | ) |
For the six months ended June 30, 2023 and 2022, non-cash
compensation of $nil and $252,095, respectively was solely attributable the Corporate and others segment.
Depreciation and amortization by segment for six
months ended June 30, 2023 and 2022 are as follows:
| | |
For the six months ended
June 30, | |
| Depreciation and amortization: | |
2023 | | |
2022 | |
| | |
(Unaudited) | | |
(Unaudited) | |
| Secured logistics | |
$ | 1,570,069 | | |
$ | 1,887,059 | |
| Robotics AI solutions | |
| 741,548 | | |
| 810,319 | |
| General security solutions | |
| 124,713 | | |
| - | |
| | |
$ | 2,436,330 | | |
$ | 2,697,378 | |
Total assets by segment as of June 30, 2023 and
December 31, 2022 are as follows:
| Total assets | |
As of
June 30,
2023 | | |
As of
December 31,
2022 | |
| | |
(Unaudited) | | |
(Audited) | |
| Secured logistics | |
$ | 22,854,857 | | |
$ | 25,315,845 | |
| Information security | |
| 199,259 | | |
| 615,517 | |
| Robotics AI solutions | |
| 17,330,745 | | |
| 23,577,547 | |
| General security solutions | |
| 2,296,882 | | |
| 4,260,811 | |
| Corporate and others | |
| 21,412,959 | | |
| 7,397,254 | |
| | |
$ | 64,094,702 | | |
$ | 61,166,974 | |
Total non-current assets by geographical segment
as of December 31, 2022 and 2021 are as follows:
| Total non-current assets | |
As of
June 30,
2023 | | |
As of
December 31,
2022 | |
| | |
(Unaudited) | | |
(Audited) | |
| The PRC (including Hong Kong and Macau) | |
$ | 11,762,228 | | |
$ | 11,234,176 | |
| Thailand | |
| 9,774,623 | | |
| 14,223,714 | |
| Other countries | |
| 403,977 | | |
| 446,020 | |
| | |
$ | 21,940,828 | | |
$ | 25,903,910 | |
Total liabilities by segment as of June 30, 2023
and December 31, 2022 are as follows:
| Total liabilities | |
As of
June 30,
2023 | | |
As of
December 31,
2022 | |
| | |
(Unaudited) | | |
(Audited) | |
| Secured logistics | |
$ | 12,850,116 | | |
$ | 28,789,053 | |
| Information security | |
| 143,919 | | |
| 238,229 | |
| Robotics AI solutions | |
| 4,477,486 | | |
| 4,580,740 | |
| General security solutions | |
| 1,425,037 | | |
| 1,661,469 | |
| Corporate and others | |
| 20,195,051 | | |
| 6,765,181 | |
| | |
$ | 39,091,609 | | |
$ | 42,034,672 | |
| 24. |
COMMITMENTS AND CONTINGENCIES |
Executives/directors agreements
The Company has several employment agreements
with executives and directors with the latest expiring in August 2025. All agreements provide for automatic renewal options with varying
terms of one year or three years unless terminated by either party. Future payments for employment agreements as of June 30, 2023, are
as follows:
| | |
Amount | |
| Twelve months ending June 30: | |
| |
| 2024 | |
$ | 875,472 | |
| 2025 | |
| 740,000 | |
| 2026 | |
| 118,333 | |
| Total minimum payment required | |
$ | 1,733,805 | |
Contracted expenditure commitments
The Company’s contracted expenditures
commitments as of June 30, 2023 but not provided in the interim condensed consolidated financial statements are as follows:
| | |
| |
Payments Due by Period | |
| | |
| |
| | |
Less than | | |
1-3 | | |
4-5 | | |
More
than | |
| Contractual Obligations | |
Nature | |
Total | | |
1 year | | |
years | | |
years | | |
5 years | |
| Service fee commitments | |
(a) | |
$ | 56,644 | | |
$ | 56,644 | | |
$ | - | | |
$ | - | | |
$ | - | |
| Operating lease commitments | |
(b) | |
| 3,589,243 | | |
| 1,924,149 | | |
| 1,645,840 | | |
| 19,254 | | |
| - | |
| Purchase commitments | |
(c) | |
| 3,106,786 | | |
| 3,106,786 | | |
| - | | |
| - | | |
| - | |
| | |
| |
$ | 6,752,673 | | |
$ | 5,087,579 | | |
$ | 1,645,840 | | |
$ | 19,254 | | |
$ | - | |
Bank guarantees
As of June 30, 2023, the Company had
commitments with banks for bank guarantees in favor of government agencies and others of approximately $3,700,000.
Litigation
As of the date of filing, the Company
is a defendant in various labor-related lawsuits totaling approximately $400,593. Management believes sufficient provision has been made
for these liabilities in this interim condensed consolidated financial statements.
Numerous subsequent events disclosures
are being made elsewhere in this interim condensed consolidated financial statements. Subsequent events have been reviewed through the
date of filing and required no adjustments or disclosures.
F-33
4.35
7.16
3174282
880618
false
--12-31
Q2
2023-06-30
0001804469
0001804469
2023-01-01
2023-06-30
0001804469
2023-06-30
0001804469
2022-12-31
0001804469
2022-01-01
2022-06-30
0001804469
ifrs-full:IssuedCapitalMember
2021-12-31
0001804469
gfai:SubscriptionReceivableMember
2021-12-31
0001804469
ifrs-full:AdditionalPaidinCapitalMember
2021-12-31
0001804469
gfai:LegalReservesMember
2021-12-31
0001804469
ifrs-full:OtherReservesMember
2021-12-31
0001804469
ifrs-full:AccumulatedOtherComprehensiveIncomeMember
2021-12-31
0001804469
ifrs-full:RetainedEarningsMember
2021-12-31
0001804469
ifrs-full:NoncontrollingInterestsMember
2021-12-31
0001804469
2021-12-31
0001804469
ifrs-full:IssuedCapitalMember
2022-01-01
2022-06-30
0001804469
gfai:SubscriptionReceivableMember
2022-01-01
2022-06-30
0001804469
ifrs-full:AdditionalPaidinCapitalMember
2022-01-01
2022-06-30
0001804469
gfai:LegalReservesMember
2022-01-01
2022-06-30
0001804469
ifrs-full:OtherReservesMember
2022-01-01
2022-06-30
0001804469
ifrs-full:AccumulatedOtherComprehensiveIncomeMember
2022-01-01
2022-06-30
0001804469
ifrs-full:RetainedEarningsMember
2022-01-01
2022-06-30
0001804469
ifrs-full:NoncontrollingInterestsMember
2022-01-01
2022-06-30
0001804469
ifrs-full:IssuedCapitalMember
2022-06-30
0001804469
gfai:SubscriptionReceivableMember
2022-06-30
0001804469
ifrs-full:AdditionalPaidinCapitalMember
2022-06-30
0001804469
gfai:LegalReservesMember
2022-06-30
0001804469
ifrs-full:OtherReservesMember
2022-06-30
0001804469
ifrs-full:AccumulatedOtherComprehensiveIncomeMember
2022-06-30
0001804469
ifrs-full:RetainedEarningsMember
2022-06-30
0001804469
ifrs-full:NoncontrollingInterestsMember
2022-06-30
0001804469
2022-06-30
0001804469
ifrs-full:IssuedCapitalMember
2022-12-31
0001804469
gfai:SubscriptionReceivableMember
2022-12-31
0001804469
ifrs-full:AdditionalPaidinCapitalMember
2022-12-31
0001804469
gfai:LegalReservesMember
2022-12-31
0001804469
ifrs-full:OtherReservesMember
2022-12-31
0001804469
ifrs-full:AccumulatedOtherComprehensiveIncomeMember
2022-12-31
0001804469
ifrs-full:RetainedEarningsMember
2022-12-31
0001804469
ifrs-full:NoncontrollingInterestsMember
2022-12-31
0001804469
ifrs-full:IssuedCapitalMember
2023-01-01
2023-06-30
0001804469
gfai:SubscriptionReceivableMember
2023-01-01
2023-06-30
0001804469
ifrs-full:AdditionalPaidinCapitalMember
2023-01-01
2023-06-30
0001804469
gfai:LegalReservesMember
2023-01-01
2023-06-30
0001804469
ifrs-full:OtherReservesMember
2023-01-01
2023-06-30
0001804469
ifrs-full:AccumulatedOtherComprehensiveIncomeMember
2023-01-01
2023-06-30
0001804469
ifrs-full:RetainedEarningsMember
2023-01-01
2023-06-30
0001804469
ifrs-full:NoncontrollingInterestsMember
2023-01-01
2023-06-30
0001804469
ifrs-full:IssuedCapitalMember
2023-06-30
0001804469
gfai:SubscriptionReceivableMember
2023-06-30
0001804469
ifrs-full:AdditionalPaidinCapitalMember
2023-06-30
0001804469
gfai:LegalReservesMember
2023-06-30
0001804469
ifrs-full:OtherReservesMember
2023-06-30
0001804469
ifrs-full:AccumulatedOtherComprehensiveIncomeMember
2023-06-30
0001804469
ifrs-full:RetainedEarningsMember
2023-06-30
0001804469
ifrs-full:NoncontrollingInterestsMember
2023-06-30
0001804469
gfai:AIHoldingLimitedMember
2023-01-01
2023-06-30
0001804469
gfai:AIRoboticsMember
2023-01-01
2023-06-30
0001804469
gfai:AIHongKongLimitedMember
2023-01-01
2023-06-30
0001804469
gfai:SouthernAmbitionLimitedMember
2023-01-01
2023-06-30
0001804469
gfai:HorizonDragonLimitedMember
2023-01-01
2023-06-30
0001804469
2018-09-21
0001804469
2018-09-01
2018-09-21
0001804469
gfai:HorizonDragonLimitedMember
2018-09-01
2018-09-21
0001804469
2022-01-01
2022-12-31
0001804469
gfai:SouthernAmbitionLimitedMember
2023-06-30
0001804469
gfai:SouthernAmbitionLimitedMember
2022-12-31
0001804469
gfai:AIThailandMember
2023-01-01
2023-06-30
0001804469
2021-03-25
0001804469
gfai:SingaporeAgreementMember
2021-11-01
0001804469
gfai:MacauAgreementMember
2021-11-18
0001804469
gfai:MalaysiaAgreementMember
2021-11-18
0001804469
gfai:MalaysiaAgreementMember
2023-06-30
0001804469
gfai:AIMalaysiaMember
2023-06-30
0001804469
gfai:AIRoboticsMember
2021-11-18
0001804469
gfai:AIRobotServiceMember
2023-06-30
0001804469
gfai:AIShenzhenMember
2023-06-30
0001804469
gfai:AIRoboticsMember
2023-06-30
0001804469
country:AT
gfai:AIRobotServiceMember
2023-06-30
0001804469
gfai:DubaiMember
gfai:AIRobotServiceMember
2023-06-30
0001804469
gfai:AIThailandMember
2023-06-30
0001804469
gfai:HorizonDragonLimitedMember
2023-06-30
0001804469
gfai:UKMember
gfai:AIRobotServiceMember
2023-06-30
0001804469
country:CA
gfai:AIRobotServiceMember
2023-06-30
0001804469
gfai:AIJianMember
gfai:AIRobotServiceMember
2023-06-30
0001804469
country:JP
gfai:AIRobotServiceMember
2023-06-30
0001804469
currency:KPW
gfai:AIRobotServiceMember
2023-06-30
0001804469
gfai:KeweiAgreementMember
2022-03-11
0001804469
gfai:ShenzhenKeweiMember
2023-01-01
2023-06-30
0001804469
gfai:BeijingWanjiaMember
2023-06-30
0001804469
gfai:BeijingWanjiaMember
2023-01-01
2023-06-30
0001804469
gfai:BeijingWanjiaMember
2022-06-01
2022-06-16
0001804469
gfai:ShenzhenKeweiMember
2023-06-30
0001804469
2023-09-28
0001804469
2023-09-28
2023-09-28
0001804469
ifrs-full:TopOfRangeMember
2023-01-01
2023-01-31
0001804469
ifrs-full:BottomOfRangeMember
2023-01-01
2023-01-31
0001804469
ifrs-full:TopOfRangeMember
2023-01-31
0001804469
ifrs-full:BottomOfRangeMember
2023-01-31
0001804469
ifrs-full:BottomOfRangeMember
2022-01-01
2022-12-31
0001804469
ifrs-full:TopOfRangeMember
2022-01-01
2022-12-31
0001804469
gfai:ThaiBahtMember
2023-06-30
0001804469
gfai:ThaiBahtMember
2022-12-31
0001804469
gfai:ThaiBahtMember
2023-01-01
2023-06-30
0001804469
gfai:ThaiBahtMember
2022-01-01
2022-06-30
0001804469
gfai:HongKongDollarMember
2023-06-30
0001804469
gfai:HongKongDollarMember
2022-12-31
0001804469
gfai:HongKongDollarMember
2023-01-01
2023-06-30
0001804469
gfai:HongKongDollarMember
2022-01-01
2022-06-30
0001804469
gfai:ChineseRenminbiMember
2023-06-30
0001804469
gfai:ChineseRenminbiMember
2022-12-31
0001804469
gfai:ChineseRenminbiMember
2023-01-01
2023-06-30
0001804469
gfai:ChineseRenminbiMember
2022-01-01
2022-06-30
0001804469
gfai:CashInTransitNonDedicatedVehiclesCITNonDVMember
2023-01-01
2023-06-30
0001804469
gfai:CashInTransitNonDedicatedVehiclesCITNonDVMember
2022-01-01
2022-06-30
0001804469
gfai:CashInTransitDedicatedVehicleToBanksCITDVMember
2023-01-01
2023-06-30
0001804469
gfai:CashInTransitDedicatedVehicleToBanksCITDVMember
2022-01-01
2022-06-30
0001804469
gfai:ATMManagementMember
2023-01-01
2023-06-30
0001804469
gfai:ATMManagementMember
2022-01-01
2022-06-30
0001804469
gfai:CashProcessingCPCMember
2023-01-01
2023-06-30
0001804469
gfai:CashProcessingCPCMember
2022-01-01
2022-06-30
0001804469
gfai:CashCenterOperationsCCTMember
2023-01-01
2023-06-30
0001804469
gfai:CashCenterOperationsCCTMember
2022-01-01
2022-06-30
0001804469
gfai:ConsolidateCashCenterCCCMember
2023-01-01
2023-06-30
0001804469
gfai:ConsolidateCashCenterCCCMember
2022-01-01
2022-06-30
0001804469
gfai:ChequeCenterServiceCDCMember
2023-01-01
2023-06-30
0001804469
gfai:ChequeCenterServiceCDCMember
2022-01-01
2022-06-30
0001804469
gfai:OthersMember
2023-01-01
2023-06-30
0001804469
gfai:OthersMember
2022-01-01
2022-06-30
0001804469
gfai:CashDepositManagementSolutionsGDMMember
2023-01-01
2023-06-30
0001804469
gfai:CashDepositManagementSolutionsGDMMember
2022-01-01
2022-06-30
0001804469
gfai:RoboticAISolutionsMember
2023-01-01
2023-06-30
0001804469
gfai:RoboticAISolutionsMember
2022-01-01
2022-06-30
0001804469
gfai:InformationSecurityMember
2023-01-01
2023-06-30
0001804469
gfai:InformationSecurityMember
2022-01-01
2022-06-30
0001804469
gfai:GeneralSecuritySolutionsMember
2023-01-01
2023-06-30
0001804469
gfai:GeneralSecuritySolutionsMember
2022-01-01
2022-06-30
0001804469
gfai:HandshakeMember
2023-01-01
2023-06-30
0001804469
gfai:GuangzhouGFAIMember
2023-01-01
2023-06-30
0001804469
ifrs-full:MajorBusinessCombinationMember
2021-03-25
0001804469
ifrs-full:MajorBusinessCombinationMember
2022-02-09
0001804469
ifrs-full:MajorBusinessCombinationMember
2022-01-20
0001804469
ifrs-full:MajorBusinessCombinationMember
2022-06-22
0001804469
ifrs-full:MajorBusinessCombinationMember
2022-03-22
0001804469
ifrs-full:MajorBusinessCombinationMember
2021-02-26
2021-03-25
0001804469
ifrs-full:MajorBusinessCombinationMember
2022-01-10
2022-02-09
0001804469
ifrs-full:MajorBusinessCombinationMember
2021-12-21
2022-01-20
0001804469
ifrs-full:MajorBusinessCombinationMember
2022-05-23
2022-06-22
0001804469
ifrs-full:MajorBusinessCombinationMember
2022-02-23
2022-03-22
0001804469
gfai:RobotsAtWarehouseMember
2023-06-30
0001804469
gfai:RobotsAtWarehouseMember
2022-12-31
0001804469
gfai:RobotsInTransitMember
2023-06-30
0001804469
gfai:RobotsInTransitMember
2022-12-31
0001804469
gfai:SecurityEquipmentMember
2023-06-30
0001804469
gfai:SecurityEquipmentMember
2022-12-31
0001804469
gfai:ImpairmentProvisionForInventoriesMember
2023-06-30
0001804469
gfai:ImpairmentProvisionForInventoriesMember
2022-12-31
0001804469
2023-07-12
2023-07-12
0001804469
2023-07-12
0001804469
ifrs-full:AccumulatedDepreciationAndAmortisationMember
2023-01-01
2023-06-30
0001804469
ifrs-full:LeaseholdImprovementsMember
2021-12-31
0001804469
ifrs-full:MachineryMember
2021-12-31
0001804469
ifrs-full:OfficeEquipmentMember
2021-12-31
0001804469
ifrs-full:VehiclesMember
2021-12-31
0001804469
ifrs-full:ConstructionInProgressMember
2021-12-31
0001804469
gfai:GDMMachinesMember
2021-12-31
0001804469
gfai:RobotsMember
2021-12-31
0001804469
ifrs-full:LeaseholdImprovementsMember
2022-01-01
2022-06-30
0001804469
ifrs-full:MachineryMember
2022-01-01
2022-06-30
0001804469
ifrs-full:OfficeEquipmentMember
2022-01-01
2022-06-30
0001804469
ifrs-full:VehiclesMember
2022-01-01
2022-06-30
0001804469
ifrs-full:ConstructionInProgressMember
2022-01-01
2022-06-30
0001804469
gfai:GDMMachinesMember
2022-01-01
2022-06-30
0001804469
gfai:RobotsMember
2022-01-01
2022-06-30
0001804469
ifrs-full:LeaseholdImprovementsMember
2022-06-30
0001804469
ifrs-full:MachineryMember
2022-06-30
0001804469
ifrs-full:OfficeEquipmentMember
2022-06-30
0001804469
ifrs-full:VehiclesMember
2022-06-30
0001804469
ifrs-full:ConstructionInProgressMember
2022-06-30
0001804469
gfai:GDMMachinesMember
2022-06-30
0001804469
gfai:RobotsMember
2022-06-30
0001804469
ifrs-full:LeaseholdImprovementsMember
2022-12-31
0001804469
ifrs-full:MachineryMember
2022-12-31
0001804469
ifrs-full:OfficeEquipmentMember
2022-12-31
0001804469
ifrs-full:VehiclesMember
2022-12-31
0001804469
ifrs-full:ConstructionInProgressMember
2022-12-31
0001804469
gfai:GDMMachinesMember
2022-12-31
0001804469
gfai:RobotsMember
2022-12-31
0001804469
ifrs-full:LeaseholdImprovementsMember
2023-01-01
2023-06-30
0001804469
ifrs-full:MachineryMember
2023-01-01
2023-06-30
0001804469
ifrs-full:OfficeEquipmentMember
2023-01-01
2023-06-30
0001804469
ifrs-full:VehiclesMember
2023-01-01
2023-06-30
0001804469
ifrs-full:ConstructionInProgressMember
2023-01-01
2023-06-30
0001804469
gfai:GDMMachinesMember
2023-01-01
2023-06-30
0001804469
gfai:RobotsMember
2023-01-01
2023-06-30
0001804469
ifrs-full:LeaseholdImprovementsMember
2023-06-30
0001804469
ifrs-full:MachineryMember
2023-06-30
0001804469
ifrs-full:OfficeEquipmentMember
2023-06-30
0001804469
ifrs-full:VehiclesMember
2023-06-30
0001804469
ifrs-full:ConstructionInProgressMember
2023-06-30
0001804469
gfai:GDMMachinesMember
2023-06-30
0001804469
gfai:RobotsMember
2023-06-30
0001804469
ifrs-full:BottomOfRangeMember
2022-06-30
0001804469
ifrs-full:TopOfRangeMember
2022-06-30
0001804469
ifrs-full:ComputerSoftwareMember
2021-12-31
0001804469
gfai:RightofusePlatformMember
2021-12-31
0001804469
gfai:CustomerBaseMember
2021-12-31
0001804469
gfai:TechnicalKnowhowMember
2021-12-31
0001804469
gfai:SecuritySurveillanceSystemMember
2021-12-31
0001804469
gfai:AssetsUnderConstructionCashManagementSystemsMember
2021-12-31
0001804469
gfai:AssetsUnderConstructionIntelligentCloudPlatformMember
2021-12-31
0001804469
gfai:IntelligentCloudPlatformsMember
2021-12-31
0001804469
ifrs-full:ComputerSoftwareMember
2022-01-01
2022-06-30
0001804469
gfai:RightofusePlatformMember
2022-01-01
2022-06-30
0001804469
gfai:CustomerBaseMember
2022-01-01
2022-06-30
0001804469
gfai:TechnicalKnowhowMember
2022-01-01
2022-06-30
0001804469
gfai:SecuritySurveillanceSystemMember
2022-01-01
2022-06-30
0001804469
gfai:AssetsUnderConstructionCashManagementSystemsMember
2022-01-01
2022-06-30
0001804469
gfai:AssetsUnderConstructionIntelligentCloudPlatformMember
2022-01-01
2022-06-30
0001804469
gfai:IntelligentCloudPlatformsMember
2022-01-01
2022-06-30
0001804469
ifrs-full:ComputerSoftwareMember
2022-06-30
0001804469
gfai:RightofusePlatformMember
2022-06-30
0001804469
gfai:CustomerBaseMember
2022-06-30
0001804469
gfai:TechnicalKnowhowMember
2022-06-30
0001804469
gfai:SecuritySurveillanceSystemMember
2022-06-30
0001804469
gfai:AssetsUnderConstructionCashManagementSystemsMember
2022-06-30
0001804469
gfai:AssetsUnderConstructionIntelligentCloudPlatformMember
2022-06-30
0001804469
gfai:IntelligentCloudPlatformsMember
2022-06-30
0001804469
ifrs-full:ComputerSoftwareMember
2022-12-31
0001804469
gfai:RightofusePlatformMember
2022-12-31
0001804469
gfai:CustomerBaseMember
2022-12-31
0001804469
gfai:TechnicalKnowhowMember
2022-12-31
0001804469
gfai:SecuritySurveillanceSystemMember
2022-12-31
0001804469
gfai:AssetsUnderConstructionCashManagementSystemsMember
2022-12-31
0001804469
gfai:AssetsUnderConstructionIntelligentCloudPlatformMember
2022-12-31
0001804469
gfai:IntelligentCloudPlatformsMember
2022-12-31
0001804469
ifrs-full:ComputerSoftwareMember
2023-01-01
2023-06-30
0001804469
gfai:RightofusePlatformMember
2023-01-01
2023-06-30
0001804469
gfai:CustomerBaseMember
2023-01-01
2023-06-30
0001804469
gfai:TechnicalKnowhowMember
2023-01-01
2023-06-30
0001804469
gfai:SecuritySurveillanceSystemMember
2023-01-01
2023-06-30
0001804469
gfai:AssetsUnderConstructionCashManagementSystemsMember
2023-01-01
2023-06-30
0001804469
gfai:AssetsUnderConstructionIntelligentCloudPlatformMember
2023-01-01
2023-06-30
0001804469
gfai:IntelligentCloudPlatformsMember
2023-01-01
2023-06-30
0001804469
ifrs-full:ComputerSoftwareMember
2023-06-30
0001804469
gfai:RightofusePlatformMember
2023-06-30
0001804469
gfai:CustomerBaseMember
2023-06-30
0001804469
gfai:TechnicalKnowhowMember
2023-06-30
0001804469
gfai:SecuritySurveillanceSystemMember
2023-06-30
0001804469
gfai:AssetsUnderConstructionCashManagementSystemsMember
2023-06-30
0001804469
gfai:AssetsUnderConstructionIntelligentCloudPlatformMember
2023-06-30
0001804469
gfai:IntelligentCloudPlatformsMember
2023-06-30
0001804469
srt:MaximumMember
2023-06-30
0001804469
srt:MinimumMember
2023-06-30
0001804469
gfai:THMember
2023-01-01
2023-06-30
0001804469
gfai:THMember
2022-01-01
2022-06-30
0001804469
2018-04-25
2018-04-25
0001804469
2022-10-25
0001804469
2023-04-01
2023-04-17
0001804469
2023-04-01
2023-04-19
0001804469
2023-02-01
2023-02-17
0001804469
gfai:SevenKeweiGroupCompaniesMember
2023-02-01
2023-02-13
0001804469
gfai:SevenKeweiGroupCompaniesMember
2023-03-01
2023-03-01
0001804469
gfai:NoteWarrantsMember
2023-06-30
0001804469
2023-03-01
2023-03-08
0001804469
gfai:NoteWarrantsMember
2023-01-01
2023-06-30
0001804469
gfai:OverAllotmentOptionsMember
2023-05-05
0001804469
2023-05-05
0001804469
2023-05-01
2023-05-05
0001804469
gfai:OverAllotmentOptionsMember
2023-05-12
0001804469
2023-05-12
0001804469
2023-05-01
2023-05-12
0001804469
2023-09-30
2023-09-30
0001804469
2022-05-24
0001804469
gfai:ShenzhenKeweiRobotTechnologyCoLimitedMember
2023-02-13
0001804469
gfai:ShenzhenKeweiRobotTechnologyCoLimitedMember
2023-02-01
2023-02-13
0001804469
2023-03-31
0001804469
2023-01-01
2023-05-25
0001804469
2020-04-17
0001804469
gfai:GuardforceHoldingHKLimitedMember
2023-01-01
2023-06-30
0001804469
gfai:GuardforceHoldingHKLimitedMember
2023-06-30
0001804469
gfai:GuardforceHoldingHKLimitedMember
2022-06-30
0001804469
gfai:GuardforceHoldingHKLimitedMember
2023-05-25
0001804469
2020-09-09
0001804469
gfai:GuardforceHoldingsHKLimitedOneMember
2023-01-01
2023-06-30
0001804469
gfai:GuardforceHoldingsHKLimitedOneMember
2023-06-30
0001804469
gfai:GuardforceHoldingsHKLimitedOneMember
2022-06-30
0001804469
gfai:GuardforceHoldingsHKLimitedOneMember
2023-05-25
0001804469
2019-12-31
0001804469
gfai:GuardforceHoldingsHKLimitedTwoMember
2023-01-01
2023-06-30
0001804469
gfai:GuardforceHoldingsHKLimitedTwoMember
2023-06-30
0001804469
gfai:GuardforceHoldingsHKLimitedTwoMember
2022-06-30
0001804469
2023-05-25
0001804469
gfai:TuJingyiMember
2023-01-01
2023-06-30
0001804469
gfai:TuJingyiMember
2023-06-30
0001804469
gfai:TuJingyiMember
2022-06-30
0001804469
gfai:GuardforceTHGroupCompanyLimitedMember
2023-06-30
0001804469
gfai:GuardforceTHGroupCompanyLimitedMember
2022-12-31
0001804469
gfai:GuardforceAITechnologyLimitedMember
2023-06-30
0001804469
gfai:GuardforceAITechnologyLimitedMember
2022-12-31
0001804469
gfai:GuardforceAIServiceLimitedMember
2023-06-30
0001804469
gfai:GuardforceAIServiceLimitedMember
2022-12-31
0001804469
gfai:ShenzhenIntelligentGuardforceRobotTechnologyCoLimitedMember
2023-06-30
0001804469
gfai:ShenzhenIntelligentGuardforceRobotTechnologyCoLimitedMember
2022-12-31
0001804469
gfai:ShareholdersOfShenzhenKeweiRobotTechnologyCoLimitedAndItsSubsidiariesMember
2023-06-30
0001804469
gfai:ShareholdersOfShenzhenKeweiRobotTechnologyCoLimitedAndItsSubsidiariesMember
2022-12-31
0001804469
gfai:NanjingZhongzhiYonghaoRobotCoLtdMember
2023-06-30
0001804469
gfai:NanjingZhongzhiYonghaoRobotCoLtdMember
2022-12-31
0001804469
gfai:NanchangZongkunIntelligentTechnologyCoLtdMember
2023-06-30
0001804469
gfai:NanchangZongkunIntelligentTechnologyCoLtdMember
2022-12-31
0001804469
gfai:SichuanQiantuGuardforceRobotTechnologyCoLtdMember
2023-06-30
0001804469
gfai:SichuanQiantuGuardforceRobotTechnologyCoLtdMember
2022-12-31
0001804469
gfai:ShanghaiNanshaoFireEngineeringAndEquipmentCoLtdMember
2023-06-30
0001804469
gfai:ShanghaiNanshaoFireEngineeringAndEquipmentCoLtdMember
2022-12-31
0001804469
gfai:CSFMingdaTechnologyCoLtdMember
2023-06-30
0001804469
gfai:CSFMingdaTechnologyCoLtdMember
2022-12-31
0001804469
gfai:TuJingyiMember
2022-12-31
0001804469
gfai:Guardforce3LimitedMember
2023-06-30
0001804469
gfai:Guardforce3LimitedMember
2022-12-31
0001804469
gfai:GuardforceSecurityThailandCompanyLimitedMember
2023-06-30
0001804469
gfai:GuardforceSecurityThailandCompanyLimitedMember
2022-12-31
0001804469
gfai:ShenzhenKeweiRobotTechnologyCoLimitedAndItsSubsidiariesMember
2023-06-30
0001804469
gfai:ShenzhenKeweiRobotTechnologyCoLimitedAndItsSubsidiariesMember
2022-12-31
0001804469
gfai:ShenzhenZhongzhiYonghaoRobotCoLtdMember
2023-06-30
0001804469
gfai:ShenzhenZhongzhiYonghaoRobotCoLtdMember
2022-12-31
0001804469
gfai:ShenzhenQianbanTechnologyCoLtdMember
2023-06-30
0001804469
gfai:ShenzhenQianbanTechnologyCoLtdMember
2022-12-31
0001804469
gfai:GuardforceSecurityServiceShanghaiCoLtdMember
2023-06-30
0001804469
gfai:GuardforceSecurityServiceShanghaiCoLtdMember
2022-12-31
0001804469
gfai:ShenzhenGuardforceQiyunTechnologyCoLtdMember
2023-06-30
0001804469
gfai:ShenzhenGuardforceQiyunTechnologyCoLtdMember
2022-12-31
0001804469
gfai:ShanghaiYonganSecurityAlarmSystemCoLtdMember
2023-06-30
0001804469
gfai:ShanghaiYonganSecurityAlarmSystemCoLtdMember
2022-12-31
0001804469
gfai:GuardforceAviationSecurityCompanyLimitedMember
2023-06-30
0001804469
gfai:GuardforceAviationSecurityCompanyLimitedMember
2022-12-31
0001804469
gfai:GuardforceHoldingsHKLimitedMember
2023-06-30
0001804469
gfai:GuardforceHoldingsHKLimitedMember
2022-12-31
0001804469
gfai:GuardforceSecurityThailandCompanyLimitedMember
2023-01-01
2023-06-30
0001804469
gfai:GuardforceSecurityThailandCompanyLimitedMember
2022-01-01
2022-06-30
0001804469
gfai:GuardforceAviationSecurityCompanyLimitedMember
2023-01-01
2023-06-30
0001804469
gfai:GuardforceAviationSecurityCompanyLimitedMember
2022-01-01
2022-06-30
0001804469
gfai:ShenzhenIntelligentGuardforceRobotTechnologyCoLimitedMember
2023-01-01
2023-06-30
0001804469
gfai:ShenzhenIntelligentGuardforceRobotTechnologyCoLimitedMember
2022-01-01
2022-06-30
0001804469
gfai:ShenzhenKeweiRobotTechnologyCoLtdPurchasesMember
2023-01-01
2023-06-30
0001804469
gfai:ShenzhenKeweiRobotTechnologyCoLtdPurchasesMember
2022-01-01
2022-06-30
0001804469
gfai:ShenzhenKeweiRobotTechnologyCoLimitedICPMember
2023-01-01
2023-06-30
0001804469
gfai:ShenzhenKeweiRobotTechnologyCoLimitedICPMember
2022-01-01
2022-06-30
0001804469
gfai:GFTechnovationCompanyLimitedSalesMember
2023-01-01
2023-06-30
0001804469
gfai:GFTechnovationCompanyLimitedSalesMember
2022-01-01
2022-06-30
0001804469
gfai:RevenueMember
gfai:SecuredLogisticsMember
2023-01-01
2023-06-30
0001804469
gfai:RevenueMember
gfai:SecuredLogisticsMember
2022-01-01
2022-06-30
0001804469
gfai:RevenueMember
gfai:InformationSecurityMember
2023-01-01
2023-06-30
0001804469
gfai:RevenueMember
gfai:InformationSecurityMember
2022-01-01
2022-06-30
0001804469
gfai:RevenueMember
gfai:RoboticsAISolutionsMember
2023-01-01
2023-06-30
0001804469
gfai:RevenueMember
gfai:RoboticsAISolutionsMember
2022-01-01
2022-06-30
0001804469
gfai:RevenueMember
gfai:GeneralSecuritySolutionsMember
2023-01-01
2023-06-30
0001804469
gfai:RevenueMember
gfai:GeneralSecuritySolutionsMember
2022-01-01
2022-06-30
0001804469
gfai:RevenueMember
2023-01-01
2023-06-30
0001804469
gfai:RevenueMember
2022-01-01
2022-06-30
0001804469
gfai:OperatingLossMember
gfai:SecuredLogisticsMember
2023-01-01
2023-06-30
0001804469
gfai:OperatingLossMember
gfai:SecuredLogisticsMember
2022-01-01
2022-06-30
0001804469
gfai:OperatingLossMember
gfai:InformationSecurityMember
2023-01-01
2023-06-30
0001804469
gfai:OperatingLossMember
gfai:InformationSecurityMember
2022-01-01
2022-06-30
0001804469
gfai:OperatingLossMember
gfai:RoboticsAISolutionsMember
2023-01-01
2023-06-30
0001804469
gfai:OperatingLossMember
gfai:RoboticsAISolutionsMember
2022-01-01
2022-06-30
0001804469
gfai:OperatingLossMember
gfai:GeneralSecuritySolutionsMember
2023-01-01
2023-06-30
0001804469
gfai:OperatingLossMember
gfai:GeneralSecuritySolutionsMember
2022-01-01
2022-06-30
0001804469
gfai:OperatingLossMember
gfai:CorporateAndOthersMember
2023-01-01
2023-06-30
0001804469
gfai:OperatingLossMember
gfai:CorporateAndOthersMember
2022-01-01
2022-06-30
0001804469
gfai:OperatingLossMember
2023-01-01
2023-06-30
0001804469
gfai:OperatingLossMember
2022-01-01
2022-06-30
0001804469
gfai:OperatingLossMember
gfai:ForeignExchangeLossesNetMember
gfai:SecuredLogisticsMember
2023-01-01
2023-06-30
0001804469
gfai:OperatingLossMember
gfai:ForeignExchangeLossesNetMember
gfai:SecuredLogisticsMember
2022-01-01
2022-06-30
0001804469
gfai:OperatingLossMember
gfai:ForeignExchangeLossesNetMember
gfai:InformationSecurityMember
2023-01-01
2023-06-30
0001804469
gfai:OperatingLossMember
gfai:ForeignExchangeLossesNetMember
gfai:InformationSecurityMember
2022-01-01
2022-06-30
0001804469
gfai:OperatingLossMember
gfai:ForeignExchangeLossesNetMember
gfai:RoboticsAISolutionsMember
2023-01-01
2023-06-30
0001804469
gfai:OperatingLossMember
gfai:ForeignExchangeLossesNetMember
gfai:RoboticsAISolutionsMember
2022-01-01
2022-06-30
0001804469
gfai:OperatingLossMember
gfai:ForeignExchangeLossesNetMember
gfai:CorporateAndOthersMember
2023-01-01
2023-06-30
0001804469
gfai:OperatingLossMember
gfai:ForeignExchangeLossesNetMember
gfai:CorporateAndOthersMember
2022-01-01
2022-06-30
0001804469
gfai:OperatingLossMember
gfai:FinanceCostsMember
gfai:SecuredLogisticsMember
2023-01-01
2023-06-30
0001804469
gfai:OperatingLossMember
gfai:FinanceCostsMember
gfai:SecuredLogisticsMember
2022-01-01
2022-06-30
0001804469
gfai:OperatingLossMember
gfai:FinanceCostsMember
gfai:InformationSecurityMember
2023-01-01
2023-06-30
0001804469
gfai:OperatingLossMember
gfai:FinanceCostsMember
gfai:InformationSecurityMember
2022-01-01
2022-06-30
0001804469
gfai:OperatingLossMember
gfai:FinanceCostsMember
gfai:CorporateAndOthersMember
2023-01-01
2023-06-30
0001804469
gfai:OperatingLossMember
gfai:FinanceCostsMember
gfai:CorporateAndOthersMember
2022-01-01
2022-06-30
0001804469
gfai:SecuredLogisticsMember
2023-01-01
2023-06-30
0001804469
gfai:SecuredLogisticsMember
2022-01-01
2022-06-30
0001804469
gfai:RoboticsAISolutionsMember
2023-01-01
2023-06-30
0001804469
gfai:RoboticsAISolutionsMember
2022-01-01
2022-06-30
0001804469
gfai:GeneralSecuritySolutionsMember
2023-01-01
2023-06-30
0001804469
gfai:GeneralSecuritySolutionsMember
2022-01-01
2022-06-30
0001804469
gfai:SecuredLogisticsMember
2023-06-30
0001804469
gfai:SecuredLogisticsMember
2022-12-31
0001804469
gfai:InformationSecurityMember
2023-06-30
0001804469
gfai:InformationSecurityMember
2022-12-31
0001804469
gfai:RoboticsAISolutionsMember
2023-06-30
0001804469
gfai:RoboticsAISolutionsMember
2022-12-31
0001804469
gfai:GeneralSecuritySolutionsMember
2023-06-30
0001804469
gfai:GeneralSecuritySolutionsMember
2022-12-31
0001804469
gfai:CorporateAndOthersMember
2023-06-30
0001804469
gfai:CorporateAndOthersMember
2022-12-31
0001804469
country:HK
2023-06-30
0001804469
country:HK
2022-12-31
0001804469
gfai:THMember
2023-06-30
0001804469
gfai:THMember
2022-12-31
0001804469
gfai:OtherCountriesMember
2023-06-30
0001804469
gfai:OtherCountriesMember
2022-12-31
0001804469
ifrs-full:NotLaterThanOneYearMember
2023-06-30
0001804469
ifrs-full:LaterThanOneYearAndNotLaterThanTwoYearsMember
2023-06-30
0001804469
ifrs-full:LaterThanThreeYearsAndNotLaterThanFiveYearsMember
2023-06-30
0001804469
ifrs-full:LaterThanFiveYearsMember
2023-06-30
iso4217:USD
iso4217:USD
xbrli:shares
xbrli:shares
xbrli:pure
iso4217:DKK
iso4217:THB
iso4217:CNY
Exhibit 99.2
OPERATING AND FINANCIAL REVIEW AND PROSPECTS
IN CONNECTION WITH THE INTERIM CONDENSED CONSOLIDATED
FINANCIAL STATEMENTS FOR THE
SIX MONTHS ENDED JUNE 30, 2023
In this report, as used herein, and unless the
context suggests otherwise, the terms “GFAI,” “Company,” “we,” “us” or “ours”
refer to the combined business of Guardforce AI Co., Limited, its subsidiaries and other consolidated entities. References to “dollar”
and “$” are to U.S. dollars, the lawful currency of the United States. References to “THB” are to the legal currency
of Thailand. References to “RMB” are to the legal currency of the People’s Republic of China. References to “SEC”
are to the Securities and Exchange Commission.
You should read the following discussion and analysis
of our financial condition and results of operations in conjunction with our unaudited consolidated financial statements and the related
notes included elsewhere in this Report on Form 6-K and with the discussion and analysis of our financial condition and results of operations
contained in our Annual Report on Form 20-F for the fiscal year ended December 31, 2022 filed with the Securities and Exchange Commission
on May 1, 2023 (the “2022 Form 20- F”). This discussion may contain forward-looking statements based upon current expectations
that involve risks and uncertainties. Our actual results may differ materially from those anticipated in these forward-looking statements
as a result of various factors, including those identified elsewhere in this report on Form 6-K, and those listed in the 2022 Form 20-F
under “Item 3. Key Information-D. Risk Factors” or in other parts of the 2022 Form 20-F.
Overview
Our businesses are categorized into four main
units:
[i] Secure Logistics Business;
[ii] Information Security Business;
[iii] Robotics AI Solution Business; and
[iv] General security Business.
Secure Logistics Business
We conduct business mainly through Guardforce
Cash Solutions Security Thailand Co., Limited, or GF Cash (CIT), our subsidiary, which provides secured logistics solutions in Thailand.
This includes the following services:
(i) Cash-In-Transit – Non-Dedicated Vehicle
(Non-DV):
CIT (Non-DV) includes the secure transportation
of cash and other valuables between commercial banks and the Bank of Thailand, Thailand’s central bank. CIT (Non-DV) also includes
the transportation of coins between the commercial banks, the Thai Royal Mints and the Bank of Thailand. As such, the main customers for
this service are the local commercial banks. Charges to the customers are dependent on the value of the consignment; condition of the
cash being collected (for example, seal bag collection, piece count collection, bulk count collection, or loose cash collection); and
the volume of the transaction. Vehicles used for the delivery of this service are not dedicated to the specific customers.
(ii) Cash-In-Transit – Dedicated Vehicle
(DV):
CIT (DV) includes the secure transportation of
cash and other valuables between commercial banks. As part of this service, dedicated vehicles are assigned specifically to the contracted
customer for their dedicated use between the contracted designated bank branches. As this is a dedicated vehicle service, customers will
submit direct schedules to our CIT teams for the daily operational arrangements and planning. Charges to the customers are on a per vehicle
per month basis.
(iii) ATM Management Services:
ATM management includes cash replenishment services
and first and second line of maintenance services for the ATM machines. First line of maintenance services (FLM) includes rectification
of issues related to jammed notes, dispenser failures and transaction record print-out issues. Second line of maintenance services (SLM)
includes all other issues that cannot be rectified under the FLM. SLM includes, for example, complete machine failure, and damage to hardware
and software.
(iv) Cash Processing (CPC):
Cash processing (CPC) services include counting,
sorting, counterfeit detection and vaulting services. We provide these services to commercial banks in Thailand.
(v) Cash Center Operations (CCT):
Cash Center Operations (CCT) is an outsourced
cash center management service. We operate the cash center on behalf of the customer, which includes note counting, sorting, storage,
inventory management and secured transportation of the notes and coins to the various commercial banks in Thailand.
(vi) Cheque Center Service (CDC):
Cheque Center Service (CDC) includes secured cheque
pickup and delivery service.
(vii) Express Cash:
The express cash service is an expansion of our
Guardforce Digital Machine, or GDM, solution. We work with commercial banks to have a mobile GDM installed in our CIT vehicles to collect
cash from retail customers at the retailers’ sites. The cash is immediately processed inside the CIT vehicle and the cash counting
results are immediately transmitted to GF Cash (CIT) headquarters and to a commercial bank. The bank will then credit the counted amount
to its customers’ bank accounts. We launched the Express Cash service in 2019.
(viii) Coin Processing Service:
The Coin Processing Service includes the secure
collection of coins from retail businesses and banks. The coins are stored and then delivered to the Royal Thai Mint, a sub-division of
the Thai Treasury Department, Ministry of Finance. We deploy manpower to work at the Royal Thai Mint as cashier services. Additionally,
we use our existing vehicle fleet to deliver coins from the Royal Thai Mint to bank branches, and vice versa.
(ix) Cash Deposit Management Solutions:
Cash Deposit Management Solutions are currently
delivered by our Guardforce Digital Machine solution. Our GDM product is deployed at customer sites to provide secured retail cash deposit
services. Customers use our GDM product to deposit daily cash receipts. We then collect the daily receipts from our GDM in accordance
with agreed schedules. All cash receipts are then securely collected and delivered to our cash processing center for further handling
and processing.
Information Security Business
We acquired a majority stake in Handshake Networking
(Handshake) on March 25, 2021, in furtherance of our strategy to diversify into information security as part of our portfolio of services.
The purpose of this acquisition was to provide us with the experience, expertise, and creditability to capitalize on the growing information
security market.
The services offered under our Information Security
business include:
| ● | External
and Internal Penetration Testing; |
| ● | Wireless
Network Testing; |
| ● | Web
Application Testing; |
| ● | Hospitality
Services Testing; |
| ● | Consulting
Services, Training; |
Robotics AI Solution Business
Our Robotics Solutions business was established
in 2020 as part of our revenue diversification efforts. We do not manufacture the robots, but we operate on a Robots as a Service (RaaS)
business model and purchase the robots from equipment manufacturers. We integrate various value add applications into the robots for leasing
to generate recurring revenue. As part of our market penetration strategy, we have adopted a mass adoption strategy by providing the robots
on a trial basis with an option to purchase or rent.
On March 22, 2022, we acquired 100% of the equity
interests in Shenzhen GFAI Robot Technology Co., Limited (“Shenzhen GFAI”) and Guangzhou GFAI Technology Co., Limited (“Guangzhou
GFAI”). Shenzhen GFAI and Guangzhou GFAI are based in both Shenzhen and Guangzhou, ranking among the top 10 largest Chinese cities
and among the 30 largest cities globally. Shenzhen GFAI and Guangzhou GFAI focus on the hospitality, healthcare, property management,
and government sectors. Revenues are derived from AI robotic services which automate repetitive tasks, making them less labor intensive.
This acquisition is expected to serve an integral role in the growth of our RaaS business initiative in the Greater Bay Area, which is
one of the fastest-growing economic regions in the PRC. During the six months ended June 30, 2023, revenues contributed by Shenzhen GFAI
and Guangzhou GFAI was $307,677.
On December 21, 2022, we entered into an
asset purchase agreement (“Agreement”) with Shenzhen Kewei Robot Technology Co., Limited (“Shenzhen Kewei”)
to purchase select robotic equipment assets and Kewei’s technology platform. With this acquisition, we will have a solid foundation
for future RaaS capability and have access to the entire China market through the sales channels and agents built by Kewei since 2019,
and will serve clients across various industries, such as restaurants, hotels, and office buildings, including Fortune 500 customers.
The revenue streams will include robotic rental, advertising, and technical services across most of the major metropolitan cities in China.
General Security Business
On June 22, 2022, we acquired 100% of the equity
interests in Beijing Wanjia Security System Co. Ltd (“Beijing Wanjia”) in the PRC. Beijing Wanjia is an integrated
alarm security solution provider with over 25 years’ experience and a well-established customer base among retail businesses. The
acquisition of a well-established integrated security solution provider in Beijing is truly transformative as it not only strengthens
our foothold in Asia, but also expands our integrated security capabilities. During the six months ended June 30, 2023, revenues contributed
by Beijing Wanjia was $1,622,218.
The business environment in which we operate can
change quickly. We must quickly adapt to changes in the competitive landscape and local market conditions. To be successful, we must be
able to balance, on a market-by market basis, the effects of changing demand on the utilization of our resources. We operate on a centralized
basis but allow enough flexibility so local field management can adjust operations to the particular circumstances of their markets.
We measure financial performance on a long-term
basis. We create value by focusing on yielding solid returns on capital, growing our revenues and earnings, and generating cash flows
sufficient to fund our growth.
Results of Operations
The following table sets forth a summary of our
unaudited interim condensed consolidated results of operations and the amounts as a percentage of total revenues for the periods indicated.
This information should be read together with our unaudited interim condensed consolidated financial statements and related notes included
elsewhere in this prospectus. Our historical results presented below are not necessarily indicative of the results that may be expected
for any future period.
| | |
For the six months ended
June 30, | |
| | |
2023 | | |
2022 | |
| | |
$ | | |
% of
Revenue | | |
$ | | |
% of
Revenue | |
| Revenue | |
| 18,413,292 | | |
| 100.0 | % | |
| 16,942,522 | | |
| 100.0 | % |
| Cost of sales | |
| (15,939,067 | ) | |
| (86.6 | )% | |
| (14,998,727 | ) | |
| (88.5 | )% |
| Gross profit | |
| 2,474,225 | | |
| 13.4 | % | |
| 1,943,795 | | |
| 11.5 | % |
| Stock based compensation | |
| - | | |
| - | % | |
| (252,095 | ) | |
| (1.5 | )% |
| Provision for and write off of withholding taxes receivable | |
| (561,277 | ) | |
| (3.0 | )% | |
| (265,340 | ) | |
| (1.6 | )% |
| Provision for expected credit loss on trade and other receivables | |
| (870,408 | ) | |
| (4.7 | )% | |
| - | | |
| - | % |
| Provision for obsolete inventories | |
| (3,090,283 | ) | |
| (16.8 | )% | |
| - | | |
| - | % |
| Impairment loss on fixed assets | |
| (1,591,766 | ) | |
| (8.6 | )% | |
| - | | |
| - | % |
| Impairment on goodwill | |
| (1,263,040 | ) | |
| (6.9 | )% | |
| - | | |
| - | % |
| Selling, distribution and administrative expenses | |
| (6,981,660 | ) | |
| (37.9 | )% | |
| (6,977,996 | ) | |
| (41.1 | )% |
| Operating loss | |
| (11,884,209 | ) | |
| (64.5 | )% | |
| (5,549,636 | ) | |
| (32.8 | )% |
| Other income, net | |
| 77,765 | | |
| 0.4 | % | |
| 46,859 | | |
| 0.3 | % |
| Foreign exchange losses, net | |
| (583,661 | ) | |
| (3.1 | )% | |
| (745,759 | ) | |
| (4.4 | )% |
| Finance costs | |
| (584,897 | ) | |
| (3.2 | )% | |
| (410,861 | ) | |
| (2.4 | )% |
| Loss before income tax | |
| (12,975,002 | ) | |
| (70.4 | )% | |
| (6,659,397 | ) | |
| (39.3 | )% |
| Provision for income tax (expense) benefit | |
| (874,431 | ) | |
| (4.7 | )% | |
| 320,183 | | |
| 1.9 | % |
| Net loss for the period | |
| (13,849,433 | ) | |
| (75.1 | )% | |
| (6,339,214 | ) | |
| (37.4 | )% |
| Net loss attributable to: | |
| | | |
| | | |
| | | |
| | |
| Equity holders of the Company | |
| (13,819,219 | ) | |
| | | |
| (6,306,822 | ) | |
| | |
| Non-controlling interests | |
| 30,214 | | |
| | | |
| 32,392 | | |
| | |
| | |
| (13,849,433 | ) | |
| | | |
| (6,339,214 | ) | |
| | |
Comparison of six months ended June 30,
2023, and 2022
Revenue
For the six months ended June 30, 2023, our revenue
was $18,413,292, an increase of $1,470,770, or 8.7%, compared to $16,942,522 for the six months ended June 30, 2022. This increase was
mainly driven by the following factors:
| (i) | There
was $610,613, or 11.4%, increase from our Cash-In-Transit business with our retail customers due to the increased frequency of services
when Thailand begins to ease tough Covid pandemic control and lockdown measures in 2023. However, there was a decrease in our Cash-In-Transit
and ATM business with our bank customers by $1,009,042, or 14.7%, due to the decreasing use of cash which results in a reduced need for
cash in the marketplace and a decline in the need for physical bank branches and ATM services. |
| (ii) | We
experienced continuous increase on the demand for our Guarcforce Digital Machine or GDM products. For the six months ended June 30, 2023,
the revenue contribution from our GDM product increased by $256,665, or 29.5%. |
| (iii) | We
acquired Beijing Wanjia Security System Co., Ltd. on June 22, 2022, which contributed $1,622,218, or 8.8%, to our total revenue for the
six months ended June 30, 2023. |
| (iv) | There
was decrease in our robotics AI solutions revenue due to the lasting effects after Covid-19. Revenue decreased by$278,352, or 38.7%,
compared to the same period of 2022. The impact of the COVID-19 pandemic on our business has been significant and we were unable to fully
recover in the first half of year 2023. There was a decline in consumer demand on our robots during the six months ended June 30, 2023,
we will evolve our robots with changing consumer preferences by investing in the R&D projects. |
Cost of sales
Cost of revenue consists primarily of internal
labor cost and related benefits, and other overhead costs that are directly attributable to services provided.
For the six months ended June 30, 2023, our cost
of revenue was $15,939,067, an increase of $940,340, or 6.3%, compared to $14,998,727 for the six months ended June 30, 2022. This increase
was in line with the increase in revenue. Cost of revenue as a percentage of our revenues slightly decreased from 88.5% for the six months
ended June 30, 2022, to 86.6% for the six months ended June 30, 2023. Despite the increase in fuel consumption costs in the past comparable
period by approximately 8.3% from THB31.11 ($0.92) average per liter for the six months ended June 30, 2022 to THB33.70 ($0.99) average
per liter for the six months ended June 30, 2023, we continue our effective cost savings measures to control our direct labor and overhead
cost which offset the impact on the increase fuel price.
Gross profit.
As a percentage of revenue, our gross profit margin
increased from 11.5% for the six months ended June 30, 2022 to 13.4% for the six months ended June 30, 2023, primarily due to the cost
control and we have a higher profit margin from our robotics AI solution business. During the six months ended June 30, 2023, the gross
profit margin for our secured logistics business and robotics AI solution business was 9.3% and 22.1%, respectively.
Provision for and write off of withholding
tax receivable.
During the six months ended June 30, 2023, we
recorded a provision for, and write-off of, withholding tax receivable of $261,793 and $299,484, respectively. On July 12, 2023, we received
a withholding tax refund of THB18,959,514 (approximately $0.5 million) in connection with the Company’s 2018 withholding tax refund
applications of THB29,188,153 (approximately $0.8 million). The Company wrote-off the difference between the receivable recorded and the
amount of refund subsequently received from the Thai Revenue Department. Out of prudence, at each reporting period, we estimate and record
the provision for withholding tax receivable based on the amount historically refunded and written off.
Provision for expected credit loss on trade
and other receivables.
During the six months ended June 30, 2023, we
made a provision for expected credit loss on trade and other receivables amounting to $870,408. During the COVID-19 pandemic, we temporarily
provided flexible credit terms to certain customers to foster long-term business relationships, however, some of our customers are still
facing financial hardship since the end of the COVID-19 pandemic, leading to their inability to repay our outstanding receivables. As
of June 30, 2023, we estimated the potential credit losses through a comprehensive assessment of credit risk, probability of default and
scenario analysis and recorded a provision to reflect the true value of our receivables on the financial statements.
Provision for obsolete inventory.
During the six months ended June 30, 2023, we
made a provision for our robot inventory amounting to $3,090,283. This provision represents an estimate of the amount of inventory that
may not be sold at its original cost due to obsolescence, damage, or a decline in market value. Our inventory provision is determined
based on an analysis of historical sales trends, current market conditions, existing sales pipeline, and the age and condition of our
inventory. During the first half-year of 2023, although our business is gradually recovering from the COVID-19 pandemic, which was less
severe than 2022, we experienced a continuous decrease in demand and reduction of selling price for our robots compared to our budget,
resulting in excess inventory levels. This led to the recognition of a provision for inventory was needed as we adjusted our estimates
for potential losses on slow-moving or obsolete inventory.
We have implemented measures to improve our inventory
forecasting and management, including the use of our GFAI ICP which provides advanced analytics and planning. Going forward, our newly
acquired Kewei’s technology platform will provide more in-depth analytics and planning on our China market, and we will continue
monitoring our inventory levels and adjust our inventory provision as necessary. We believe that our proactive approach to inventory management
will enable us to maintain a healthy balance between inventory levels and sales performance, while mitigating the impact of losses on
our financial results. Overall, we believe that our inventory provision reflects our commitment to responsible inventory management and
our focus on delivering long-term value to our shareholders.
Impairment loss on fixed assets.
During the six months ended June 30, 2023, we
recognized an impairment loss of $1,591,766 on our robot fixed assets. This impairment loss was primarily driven by our free trial business
model that shows an inadequate estimated future cash flow associated with these assets. This impairment loss reflects the reduction in
the value of the impaired assets and negatively impacts our financial performance.
Despite this impairment loss, we remain committed
to investing in our robot assets to support our growth and expansion plans. We continue to evaluate our fixed assets on a regular basis
to ensure that they remain relevant and meet our operational needs. Going forward, we will continue to monitor our fixed assets for indications
of potential impairment and will adjust our estimates as necessary. We are committed to investing in our assets in a prudent and responsible
manner while balancing the need for growth and innovation with the need to maintain a strong balance sheet. Overall, we believe that our
recognition of the impairment loss reflects our commitment to transparent and responsible financial reporting, and our focus on delivering
long-term value to our shareholders.
Impairment on goodwill.
During the six months ended June 30, 2023, we
recognized impairment losses on Handshake Networking Limited, Shenzhen GFAI Robot Technology Co., Limited and Guangzhou GFAI Technology
Co., Limited in an aggregate amount of $1,263,040. Despite the passing of the COVID-19 pandemic, our businesses have not returned to normal
and our markets have not regained confidence as we expected, we identified indicators of potential impairment including declining sales
trends, increased competition, and changes in the operating environment in first half-year of 2023, thus we performed impairment testing
and the amount of the impairment losses recognized reflects the excess of the carrying value of goodwill over its estimated recoverable
amount.
These impairment losses recognized during the
six months ended June 30, 2023 serve as a prudent measure to ensure the accuracy and transparency of our financial reporting. Going forward,
we will continue to closely monitor the performance of our reporting units and evaluate any indicators of impairment. Despite the challenges
on our business operations that we are still facing, we remain committed to the sustained success of the Company.
Selling, distribution and administrative expenses.
The Company’s total selling, distribution
and administrative expenses are comprised of the following:
| ● | Selling
and distribution expenses are mainly comprised of compensation and benefits for our sales and marketing personnel, travel and entertainment
expenses, exhibitions, advertising and marketing promotion expenses, depreciation of motor vehicles, rental expenses, utility expenses
and transportation charges. |
| ● | Administrative
expenses are mainly comprised of compensation and related expenses for our management and administrative personnel, depreciation of leasehold
improvements, robots and motor vehicles and rental expenses of our offices in different countries. |
Our three most significant selling, distribution
and administrative expenses for the six months ended June 30, 2023 were staff expense, depreciation and amortization expense and professional
fees of $3,602,127, $1,251,359 and $774,553, respectively. Professional fees mainly represent (i) the corporate legal fees in connection
with the acquisition of the assets from Shenzhen Kewei Robot Technology Co., Limited, two underwritten public offerings (“CMPOs”)
completed in May 2023, provision of legal advice, (ii) the audit fees and audit-related fees.
For the six months ended June 30, 2023, our total
selling, distribution, and administrative expenses were $6,981,660, a slight increase of $3,664, or 0.05%, compared to $6,977,996 for
the six months ended June 30, 2022. We have successfully maintained our operating expenses at a consistent level with the previous same
period of 2022, which resulted from our successful cost reduction strategies including streamlining processes and allocating resources
effectively to optimize our operational efficiency.
Although we maintain our cost reduction measures,
we expect our administrative expenses will increase over time as we continue to expand our business. Our selling expenses are expected
to increase as we continue to expand our business and promote our Guardforce brand. Our administrative expenses are expected to increase,
reflecting the hiring of additional personnel and other costs related to the anticipated growth of our business, as well as the higher
costs of operating as a public company.
Other income.
For the six months ended June 30, 2023, other
income was $77,765 as compared to $46,859 for the six months ended June 30, 2022. Other income is comprised mainly of miscellaneous income,
interest income and gain (loss) from disposal of fixed assets.
Finance costs.
For the six months ended June 30, 2023, finance
costs were $584,897 as compared to $410,861 for the six months ended June 30, 2022. Finance costs are comprised of finance charges for
leases, interest expense on interest-bearing bank borrowings and a third-party borrowing, an interest-bearing convertible note and two
related-party borrowings utilized for working capital purposes.
Provision for income tax (expense) benefit.
For the six months ended June 30, 2023, our income
tax expense was $874,431 as compared to income tax benefit of $320,183 for the six months ended June 30, 2022. We are subject to various
rates of income tax under different jurisdictions. During the six months ended June 30, 2023, we recognized an income tax expense related
to the valuation allowance on our deferred tax assets arising from our secured logistics business. Due to the historical losses and economic
conditions, management determines to establish an allowance of $874,431 on the deferred tax assets after assessing the probability of
realizing the benefits of the deferred tax assets in future periods.
Net loss.
For the six months ended June 30, 2023, our net
loss was $13,849,433, an increase of $7,510,219, as compared to net loss $6,339,214 for the six months ended June 30, 2022. This was mainly
due to provisions and impairments made during the first half-year of 2023.
Although we incurred a significant net loss for
the six months ended June 30, 2023, we expect to see a positive trend in our future results.
Net loss attributable to non-controlling Interests.
For the six months ended June 30, 2023, and 2022,
net loss attributable to non-controlling interests were $30,214 and $32,392, respectively.
Net loss attributable to equity holders of
the Company.
For the six months ended June 30, 2023, and 2022,
our net loss attributable to equity holders of the Company were $13,819,219 and $6,306,822, respectively.
Inflation.
Our operating results for the six months ended
June 30, 2023, were negatively affected by the recent inflationary cost pressures. The higher fuel price, transportation costs, and higher
wage rates impact the profitability of our business. We will develop operational strategies to mitigate the inflation which involve a
combination of cost-cutting measures and adjustments to pricing.
Foreign Currency Fluctuations.
Our activities expose it to a variety of financial
risks: foreign exchange risk, interest rate risk and liquidity risk. Our overall risk management program focuses on the unpredictability
of financial markets and seeks to minimize potential adverse effects on our financial performance.
Critical Accounting Policies.
IFRS 15 Revenue from Contracts with Customers
supersedes IAS 11 Construction Contracts, IAS 18 Revenue and related Interpretations and it applies, with limited exceptions, to
all revenue arising from contracts with customers. IFRS 15 establishes a five-step model to account for revenue arising from contracts
with customers and requires that revenue be recognized at an amount that reflects the consideration to which an entity expects to be entitled
in exchange for transferring services or goods to a customer. IFRS 15 requires entities to exercise judgment, taking into consideration
all of the relevant facts and circumstances when applying each step of the model to contracts with our customers. The standard also specifies
the accounting for the incremental costs of obtaining a contract and the costs directly related to fulfilling a contract. In addition,
the standard requires extensive disclosures.
IFRS 9 Financial Instruments replaces IAS 39
Financial Instruments: Recognition and Measurement for annual periods beginning on or after January 1, 2018, bringing together all
three aspects of the accounting for financial instruments: classification and measurement; impairment: and hedge accounting.
Non-IFRS Financial Measures
To supplement our unaudited interim condensed
consolidated financial statements, which are prepared and presented in accordance with IFRS, we use the non-IFRS adjusted EBITDA as financial
measures for our consolidated results.
We believe that adjusted EBITDA helps identify
underlying trends in our business that could otherwise be distorted by the effect of certain income or expenses that we include in loss
from operations and net loss. We believe that these non-IFRS measures provide useful information about our core operating results, enhance
the overall understanding of our past performance and future prospects and allow for greater visibility with respect to key metrics used
by our management in its financial and operational decision-making. We present the non-IFRS financial measures in order to provide more
information and greater transparency to investors about our operating results.
EBITDA represents net loss before
(i) finance costs, provision for income tax benefit, depreciation of fixed assets and amortization of intangible assets, which we
do not believe are reflective of our core operating performance during the periods presented.
Non-IFRS adjusted net loss represents net
loss before (i) finance costs, income tax benefit and depreciation of fixed assets and amortization of intangible assets, (ii) certain
non-cash expenses, consisting of stock-based compensation expense and allowance for, write off of withholding tax receivables, (iii) impairment
of assets including trade and other receivables, inventories, fixed assets and goodwill.
Non-IFRS loss per share represents
non-IFRS net (loss) income attributable to ordinary shareholders divided by the weighted average number of shares outstanding during the
periods. Non-IFRS diluted (loss) earnings per share represents non-IFRS
net (loss) income attributable to ordinary shareholders divided by the weighted average number of shares outstanding during the periods
on a diluted basis.
The table below is a reconciliation of our net
loss to EBITDA and non-IFRS net loss for the periods indicated:
| | |
For the six months ended
June 30, | |
| | |
2023 | | |
2022 | |
| Net loss – IFRS | |
$ | (13,849,433 | ) | |
$ | (6,339,214 | ) |
| Finance costs | |
| 584,897 | | |
| 410,861 | |
| Provision for income tax expense (benefit) | |
| 874,431 | | |
| (320,183 | ) |
| Depreciation and amortization expense | |
| 2,619,001 | | |
| 2,697,378 | |
| EBITDA | |
| (9,771,104 | ) | |
| (3,551,158 | ) |
| Stock based compensation | |
| - | | |
| 252,095 | |
| Provision for and write off of withholding taxes receivable | |
| 561,277 | | |
| 263,340 | |
| Provision for expected credit loss on trade and other receivables | |
| 869,519 | | |
| - | |
| Provision for obsolete inventories | |
| 3,090,282 | | |
| - | |
| Impairment loss on fixed assets | |
| 1,591,766 | | |
| - | |
| Impairment of goodwill | |
| 1,263,040 | | |
| - | |
| Adjusted net loss (Non-IFRS) | |
$ | (2,395,220 | ) | |
$ | (3,035,723 | ) |
| Non-IFRS loss per share | |
| | | |
| | |
| Loss per share attributable to equity holders of the Company | |
| | | |
| | |
| Basic and diluted | |
$ | (0.75 | ) | |
$ | (3.45 | ) |
| | |
| | | |
| | |
| Weighted average number of shares used in computation: | |
| | | |
| | |
| Basic and diluted | |
| 3,174,282 | | |
| 880,618 | |
Liquidity and Capital Resources
Our principal sources of liquidity and capital
resources have been, and are expected to continue to be, cash flow from operations and bank borrowings. Our principal uses of cash have
been, and we expect will continue to be, for working capital to support a reasonable increase in our scale of operations as well as for
business expansion investments.
As of June 30, 2023 and 2022, we had cash and
cash equivalents and restricted cash of approximately $26.0 million and $9.5 million, respectively.
The following table summarizes the key cash flow
components from our unaudited interim condensed consolidated statements of cash flows for the periods indicated.
| | |
For the six months ended
June 30, | |
| | |
2023 | | |
2022 | |
| Net cash used in operating activities | |
$ | (1,046,862 | ) | |
$ | (13,827,792 | ) |
| Net cash used in investing activities | |
| (1,046,308 | ) | |
| (9,341,708 | ) |
| Net cash generated from financing activities | |
| 19,876,078 | | |
| 17,375,453 | |
| Effect of exchange rate changes on cash | |
| 16,840 | | |
| (519,523 | ) |
| Net decrease in cash and cash equivalents, and restricted cash | |
| 17,799,748 | | |
| (6,313,570 | ) |
| Cash and cash equivalents, and restricted cash at January 1, | |
| 8,230,644 | | |
| 15,853,811 | |
| Cash and cash equivalents, and restricted cash at June 30, | |
$ | 26,030,392 | | |
$ | 9,540,241 | |
Operating Activities.
Net cash used in operating activities was
$1,046,862 for the six months ended June 30, 2023. The difference between our net loss of $13,849,433 and net cash used in operating
activities was mainly due to (i) depreciation and amortization of $2,619,001, comprised of depreciation of fixed assets,
depreciation of right-of-use assets and amortization of intangible assets mainly acquired through the business combinations; (ii)
interest expense of $584,897 for the bank loans and loans from related parties and finance costs related to the finance lease and
operating lease liabilities; (iii) provision for and write off of withholding tax receivable of $561,277; (iv) provision for
expected credit loss on trade and other receivable of $869,519; (v) impairment of robotics related assets including inventories and
fixed assets in aggregate of $4,682,048; (vi) impairment of goodwill of $1,263,040; and (vi) the cash generated from operating
activities of $2,180,824, which was generally due to the increase in trade and other payables and other current liabilities of
$1,285,317, which mainly represents the trade payables to third parties and payroll payable; the decrease in amounts due with
related parties of $639,807 due to the repayment of related party receivables by returning the shares we issued in connection with
the deposit paid for acquisitions that was subsequently terminated; the decrease in deferred tax assets of $874,431 due to a
valuation allowance made on the portion that is more likely than not that it will not be realized. The cash generated was being
offset with the cash used in operating activities by the increase in other assets of $719,254 representing the prepayments made for
office and warehouse rental during the six months ended June 30, 2023.
Investing Activities.
Net cash used in from investing activities was
$1,046,308 for the six months ended June 30, 2023, which was due to the purchase of property, plant, and equipment of $829,231 and the
purchase of intangible assets of $217,077.
Financing Activities.
Net cash generated from financing activities was
$19,876,078 for the six months ended June 30, 2023, which was mainly attributable to the two underwritten public offerings (“CMPOs”)
completed in May 2023. On May 5, 2023, we completed an underwritten public offering to issue 1,720,430 ordinary shares and an additional
258,064 ordinary shares for the exercise of an over-allotment option at the time of the closing at a public offering price of $4.65 per
share for aggregate gross proceeds of approximately $9.2 million. On May 12, 2023, we completed another underwritten public offering to
issue 2,580,600 ordinary shares and an additional 387,090 ordinary shares for the exercise of an over-allotment option at the time of
the closing at a public offering price of $4.65 per share for aggregate gross proceeds of approximately $13.8 million.
In addition, we obtained proceeds from bank borrowings
of $1,756,738 and from the exercise of warrants of $506,693. The cash generated was being offset with (i) $49,664 cash paid for the cancellation
of fractional shares as a result of the share consolidation which was effective on January 31, 2023; (ii) repayment of borrowings of $1,937,096;
and (iii) lease payments and interest paid of $1,267,979.
Research and Development, Patents and Licenses,
Etc.
There is no intellectual property owned by us
at this moment.
We have outlined our research and development
plans to foster innovation and drive technology advancements within our robotics AI solutions business. We plan to collaborate with third-party
business partners and develop our internal R&D team’s capabilities. We have budgeted approximately $1.8 million for research
and development expenditures for 18 months from the second half of the fiscal year of 2023 through the end of the fiscal year 2024.
Trend Information
Other than as disclosed elsewhere in this annual
report, we are not aware of any trends, uncertainties, demand, commitments, or events that are reasonably likely to have a material effect
on our net revenues and income from operations, profitability, liquidity, capital resources, or would cause reported financial information
not to be indicative of future operation results or financial condition.
Off-Balance Sheet Arrangements
We do not have off balance sheet arrangements
that have or are reasonably likely to have a current or future effect on our financial condition, changes in financial position, revenues
or expenses, results of operations, liquidity, capital expenditures, or capital resources that are material.
Tabular Disclosure of Contractual Obligations
Executives/directors agreements
The Company has several employment agreements
with executives and directors with the latest expiring in August 2025. All agreements provide for automatic renewal options with varying
terms of one year or three years unless terminated by either party. Future payments for employment agreements as of June 30, 2023, are
as follows:
| | |
Amount | |
| Twelve months ending June 30: | |
| |
| 2024 | |
$ | 875,472 | |
| 2025 | |
| 740,000 | |
| 2026 | |
| 118,333 | |
| Total minimum payment required | |
$ | 1,733,805 | |
Contracted expenditure commitments
The Company’s contracted expenditures commitments
as of June 30, 2023 but not provided in the interim condensed consolidated financial statements are as follows:
| | |
| |
Payments Due by Period | |
| | |
| |
| | |
Less than | | |
1-3 | | |
4-5 | | |
More
than | |
| Contractual Obligations | |
Nature | |
Total | | |
1 year | | |
years | | |
years | | |
5 years | |
| Service fee commitments | |
(a) | |
$ | 56,644 | | |
$ | 56,644 | | |
$ | - | | |
$ | - | | |
$ | - | |
| Operating lease commitments | |
(b) | |
| 3,589,243 | | |
| 1,924,149 | | |
| 1,645,840 | | |
| 19,254 | | |
| - | |
| Purchase commitments | |
(c) | |
| 3,106,786 | | |
| 3,106,786 | | |
| - | | |
| - | | |
| - | |
| | |
| |
$ | 6,752,673 | | |
$ | 5,087,579 | | |
$ | 1,645,840 | | |
$ | 19,254 | | |
$ | - | |
| (a) | The
Company has engaged Stander Information Company Limited (“Stander”) to provide technical services relating to the cash management
systems for the Company’s secure logistics business. The service agreement with Stander comprised of a monthly fixed service fee
and certain other fees as specified in the agreement, which was expire in August 2023. In August, 2023, the Company renewed the service
agreement with Stander for 2 years. |
| (b) | From
time to time, the Company entered into various short-term lease agreements to rent warehouses and offices. In addition, the Company has
various low value items with various lease terms that the Company is committed to pay in the future. |
| (c) | AI
Hong Kong entered into various purchase agreements with Shenzhen Intelligent Guardforce Robot Technology Co., Limited and Shenzhen Kewei
Robot Technology Co., Ltd. to establish mutual contractual obligations for future purchases of robots. These agreements do not contain
the scheduled delivery dates. As of the date of filing, the Company is not intent to execute these agreements until the inventories on
hand are being sold. |
11
Exhibit 99.3

Guardforce
AI Reports Interim Financial Results for the First Half of 2023, and Provides Business Update
Announces
agreement to convert $15.91 million of debt and accrued interest into ordinary shares at $5.40 per share; expected to significantly enhance
the balance sheet
NEW
YORK, NY / October 2, 2023 / Guardforce AI Co., Limited (“Guardforce AI” or the “Company”)
(NASDAQ: GFAI, GFAIW), an integrated security provider specializing in secured logistics, Artificial Intelligence (AI) and Robot-as-a-Service
(“RaaS”), today provided a business update and announced interim financial results for the six months ended June 30, 2023
(“1H 2023”).
Additionally,
the Company announced that it has entered into an agreement expected to enhance its balance sheet by converting $13.4 million of debt
and $2.5 million of accrued and unpaid interest in exchange for 2,947,150 restricted ordinary shares at $5.40 per share on September
28, 2023. The conversion price represents an approximately 29% premium to the closing price of the prior day.
Lei
(Olivia) Wang, Chairwoman and Chief Executive Officer of Guardforce AI, stated, “We are pleased to report that revenue increased
8.7% to $18.4 million for the first half of 2023. Although we saw a decrease in our robotics AI solutions revenue due to the lasting
effects of the Covid-19 pandemic in the first half of 2023, we remain extremely confident in the outlook for our robotics AI solutions.
As we receive ongoing feedback from our clients, we are customizing our robots by implementing AI and value-added applications. We have
approximately 1,800 robots in use by our clients in the market, and we have a better understanding of our clients’ demands and
requirements. By integrating open-source AI models into our next-level solutions, we are confident that the implementation of AI increases
the service efficiency and lowers the cost for our clients.
“During
the first half of the year, we secured two long-term contracts with pre-existing clients for our secured logistics and cash handling
services in Thailand. This past month, we secured a two-year contract with a pre-existing client for our end-to-end cash management solutions
in Thailand. Furthermore, following our business strategy of diversifying our client base, in the past 6 months, half of our top 15 clients
have shifted from banks to retail and chain stores, which are our main target clients in the AI and robotics sector.
“In
the robotics AI business sector, we see a continued demand for robots that have the latest AI technology. We now have a clearer go-to-market
strategy and business model for the robotics and AI implementations. Towards that end, we recently partnered with leading security provider,
Concorde Security Pte Ltd (“Concorde”), to co-launch a new robotic security solution in Singapore. By combining Concorde’s
security solutions with our robotic AI automation, we’re further enhancing our security offerings to our clients. In the hospitality
industry, we have partnered with Blue Pin (HK) and launched the Smart AI Hotel solution, which allows customers to use our concierge
robots to make bookings online, check-in, and check-out. We were also awarded an advertising contract for our innovative Artificial Intelligence
of Things (AIoT) Robot Advertising (RA) in Macau. Our AIoT RA model enables advertisers to publish advertisements on Guardforce AI’s
robots and make more informed marketing decisions with data feedback from the Guardforce AI Intelligent Cloud Platform (GFAI ICP). We
will continue to enhance and develop our robotic solutions with innovative AI technology for the hospitality and security industries
and look forward to partnering with other companies within these markets to further accelerate growth.
“Lastly,
we strengthened our balance sheet by raising net proceeds of approximately $23 million gross proceeds in the first half of 2023. We plan
to further enhance our balance sheet by converting $13.4 million of debt and $2.5 million of accrued interest in exchange for ordinary
shares at a conversion price of $5.40 per share, which is more than a 29% premium to the previous closing price of our stock on September
28, 2023. The lender has been our long-term strategic partner and has been supportive of our business development. Given that the conversion
price is at a premium to market, we believe this transaction is in the best long-term interests of the Company and our shareholders.
We also believe this transaction illustrates the lender’s confidence in our business outlook. Overall, we are now in a much stronger
financial position, significantly improving our balance sheet, and having built a highly scalable business model that we believe will
drive significant value for shareholders.”
Financial
Overview
Net
revenue increased by $1.47 million or 8.7%, to $18.4 million for 1H 2023, compared to $16.9 million for 1H 2022. This increase was primarily
due to our Cash-In-Transit business, demand for our Guardforce Digital Machine and revenue increase from Beijing Wanjia Security System
Co., Ltd which we acquired in June 2022. Gross profit increased to $2.5 million for 1H 2023 compared to $1.9 million for the same period
last year, and gross margin increased from 11.5% for the six months ended June 30, 2022, to 13.4% for the six months ended June 30, 2023,
primarily due to cost control initiatives and higher profit margin from our robotics AI solution business.
For
the 1H 2023, total selling, distribution, and administrative (SG&A) expenses increased slightly by 0.05% to $6.98 million compared
to $6.97 million for the six months ended June 30, 2022. Our business model includes free trials to collect product feedback for new
feature development, and advertising models require a certain amount of robot deployments in place. As a result, the Company recognized
an impairment loss on robots’ assets in accordance with IFRS accounting principles. Operating loss was $11.9 million for 1H 2023,
compared to $5.5 million for 1H 2022, which included an approximate $4.7 million provision and impairment of inventory and fixed assets,
as well as a $1.3 million of impairment on goodwill. Adjusted net loss (non-IFRS) was $2.40 million compared with $3.04 million in 2022.
As of June 30, 2023, and December 31, 2022, the Company had approximately $26.0 million and $8.2 million of cash and cash equivalents
and restricted cash, respectively.
About
Guardforce AI Co., Ltd.
Guardforce
AI Co., Ltd. (NASDAQ: GFAI, GFAIW) is a global security solutions provider, building on its legacy secured logistic business, while expanding
to integrated AI and Robot-as-a-Service (RaaS) business. With more than 40 years of professional experience and a strong customer foundation,
Guardforce AI is developing RaaS solutions that improve operational efficiency, quickly establishing its presence in the Asia Pacific
region, while expanding globally. For more information, visit Twitter: @Guardforceai
Safe
Harbor Statement
This
press release contains statements that do not relate to historical facts but are “forward-looking statements” within the meaning
of the safe harbor provisions of the U.S. Private Securities Litigation Reform Act of 1995. These statements can generally (although
not always) be identified by their use of terms and phrases such as anticipate, appear, believe, continue, could, estimate, expect, indicate,
intend, may, plan, possible, predict, project, pursue, will, would and other similar terms and phrases, as well as the use of the future
tense. Forward-looking statements are neither historical facts nor assurances of future performance. Instead, they are based only on
current beliefs, expectations and assumptions regarding the future of the business of the Company, future plans and strategies, projections,
anticipated events and trends, the economy and other future conditions. Because forward-looking statements relate to the future, they
are subject to inherent uncertainties, risks and changes in circumstances that are difficult to predict and many of which are outside
of our control, including the risks described in our registration statements and reports under the heading “Risk Factors” as
filed with the Securities and Exchange Commission. Actual results and financial condition may differ materially from those indicated
in the forward-looking statements. Therefore, you should not rely on any of these forward-looking statements. Forward-looking statements
in this press release speak only as of the date hereof. Unless otherwise required by law, we undertake no obligation to publicly update
or revise these forward-looking statements, whether because of new information, future events or otherwise.
Investor
Relations:
David
Waldman or Natalya Rudman
Crescendo
Communications, LLC
Email:
gfai@crescendo-ir.com
Tel:
212-671-1020
Guardforce
AI Corporate Communications
Hu
Yu
Email:
yu.hu@guardforceai.com
(tables
follow)
Guardforce
AI Co., Limited and Subsidiaries
Unaudited
Interim Condensed Consolidated Statement of Profit or Loss
(Expressed
in U.S. Dollars)
| | |
For the six months ended
June 30, | |
| | |
2023 | | |
2022 | |
| | |
(Unaudited) | | |
(Unaudited) | |
| Revenue | |
$ | 18,413,292 | | |
$ | 16,942,522 | |
| Cost of sales | |
| (15,939,067 | ) | |
| (14,998,727 | ) |
| Gross profit | |
| 2,474,225 | | |
| 1,943,795 | |
| | |
| | | |
| | |
| Stock based compensation | |
| - | | |
| (252,095 | ) |
| Provision for and write off of withholding tax receivable | |
| (561,277 | ) | |
| (263,340 | ) |
| Provision for expected credit loss on trade and other receivables | |
| (870,408 | ) | |
| - | |
| Provision for obsolete inventories | |
| (3,090,283 | ) | |
| - | |
| Impairment loss on fixed assets | |
| (1,591,766 | ) | |
| - | |
| Impairment of goodwill | |
| (1,263,040 | ) | |
| - | |
| Selling, distribution and administrative expenses | |
| (6,981,660 | ) | |
| (6,977,996 | ) |
| Operating loss | |
| (11,884,209 | ) | |
| (5,549,636 | ) |
| | |
| | | |
| | |
| Other income, net | |
| 77,765 | | |
| 46,859 | |
| Foreign exchange losses, net | |
| (583,661 | ) | |
| (745,759 | ) |
| Finance costs | |
| (584,897 | ) | |
| (410,861 | ) |
| Loss before income tax | |
| (12,975,002 | ) | |
| (6,659,397 | ) |
| | |
| | | |
| | |
| Provision for income tax (expense) benefit | |
| (874,431 | ) | |
| 320,183 | |
| Net loss for the period | |
| (13,849,433 | ) | |
| (6,339,214 | ) |
| Less: net loss attributable to non-controlling interests | |
| 30,214 | | |
| 32,392 | |
| Net loss attributable to equity holders of the Company | |
$ | (13,819,219 | ) | |
$ | (6,306,822 | ) |
| | |
| | | |
| | |
| Loss per share | |
| | | |
| | |
| Basic and diluted loss attributable to the equity holders of the Company | |
$ | (4.35 | ) | |
$ | (7.16 | ) |
| | |
| | | |
| | |
| Weighted average number of shares used in computation: | |
| | | |
| | |
| Basic and diluted | |
| 3,174,282 | | |
| 880,618 | |
Guardforce
AI Co., Limited and Subsidiaries
Unaudited
Interim Condensed Consolidated Balance Sheets
(Expressed
in U.S. Dollars)
| | |
As of
June 30,
2023 | | |
As of
December 31,
2022 | |
| | |
(Unaudited) | | |
| |
| Assets | |
| | |
| |
| Current assets: | |
| | |
| |
| Cash and cash equivalents | |
$ | 24,738,377 | | |
$ | 6,930,639 | |
| Restricted cash | |
| 17,059 | | |
| - | |
| Trade receivables | |
| 5,127,998 | | |
| 5,400,186 | |
| Other receivables | |
| - | | |
| 817,564 | |
| Other current assets | |
| 2,380,718 | | |
| 1,743,008 | |
| Withholding tax receivable, net | |
| 536,974 | | |
| 757,024 | |
| Inventories | |
| 1,636,245 | | |
| 5,105,770 | |
| Amounts due from related parties | |
| 7,716,503 | | |
| 14,508,873 | |
| Total current assets | |
| 42,153,874 | | |
| 35,263,064 | |
| | |
| | | |
| | |
| Non-current assets: | |
| | | |
| | |
| Restricted cash | |
| 1,274,956 | | |
| 1,300,005 | |
| Property, plant and equipment | |
| 6,018,408 | | |
| 8,066,761 | |
| Right-of-use assets | |
| 3,323,870 | | |
| 4,171,409 | |
| Intangible assets, net | |
| 6,954,467 | | |
| 5,793,143 | |
| Goodwill | |
| 1,416,405 | | |
| 2,679,445 | |
| Withholding tax receivable, net | |
| 1,921,073 | | |
| 1,934,072 | |
| Deferred tax assets, net | |
| 634,619 | | |
| 1,511,753 | |
| Other non-current assets | |
| 397,030 | | |
| 447,322 | |
| Total non-current assets | |
| 21,940,828 | | |
| 25,903,910 | |
| Total assets | |
$ | 64,094,702 | | |
$ | 61,166,974 | |
| | |
| | | |
| | |
| Liabilities and Equity | |
| | | |
| | |
| Current liabilities: | |
| | | |
| | |
| Trade and other payables | |
$ | 3,065,838 | | |
$ | 2,633,995 | |
| Borrowings | |
| 3,509,709 | | |
| 3,181,616 | |
| Borrowing from a related party | |
| 1,666,846 | | |
| 3,148,500 | |
| Current portion of operating lease liabilities | |
| 1,645,233 | | |
| 1,774,192 | |
| Current portion of finance lease liabilities, net | |
| 200,383 | | |
| 398,136 | |
| Other current liabilities | |
| 2,837,287 | | |
| 2,477,369 | |
| Amounts due to related parties | |
| 3,703,038 | | |
| 3,868,691 | |
| Convertible note payables | |
| 606,786 | | |
| 1,730,267 | |
| Total current liabilities | |
| 17,235,120 | | |
| 19,212,766 | |
| | |
| | | |
| | |
| Non-current liabilities: | |
| | | |
| | |
| Borrowings | |
| 13,727,574 | | |
| 13,899,818 | |
| Operating lease liabilities | |
| 1,686,803 | | |
| 2,340,075 | |
| Borrowings from related parties | |
| 1,437,303 | | |
| 1,455,649 | |
| Finance lease liabilities | |
| 229,747 | | |
| 233,550 | |
| Other non-current liabilities | |
| - | | |
| 43,200 | |
| Provision for employee benefits | |
| 4,775,062 | | |
| 4,849,614 | |
| Total non-current liabilities | |
| 21,856,489 | | |
| 22,821,906 | |
| Total liabilities | |
| 39,091,609 | | |
| 42,034,672 | |
| | |
| | | |
| | |
| Equity | |
| | | |
| | |
| Ordinary shares – par value $0.12 authorized 300,000,000 shares, issued and outstanding 6,883,223 shares at June 30, 2023; par value $0.12 authorized 7,500,000 shares, issued and outstanding 1,618,977 shares at December 31, 2022 | |
| 826,022 | | |
| 194,313 | |
| Subscription receivable | |
| (50,000 | ) | |
| (50,000 | ) |
| Additional paid in capital | |
| 65,150,407 | | |
| 46,231,302 | |
| Legal reserve | |
| 223,500 | | |
| 223,500 | |
| Warrants reserve | |
| 251,036 | | |
| 251,036 | |
| Accumulated deficit | |
| (42,588,233 | ) | |
| (28,769,014 | ) |
| Accumulated other comprehensive income | |
| 1,281,904 | | |
| 1,112,494 | |
| Capital & reserves attributable to equity holders of the Company | |
| 25,094,636 | | |
| 19,193,631 | |
| Non-controlling interests | |
| (91,543 | ) | |
| (61,329 | ) |
| Total equity | |
| 25,003,093 | | |
| 19,132,302 | |
| Total liabilities and equity | |
$ | 64,094,702 | | |
$ | 61,166,974 | |
Guardforce
AI Co., Limited and Subsidiaries
Unaudited
Interim Condensed Consolidated Statement of Cash Flows
(Expressed
in U.S. Dollars)
| | |
For the six months ended
June 30, | |
| | |
2023 | | |
2022 | |
| | |
(Unaudited) | | |
(Unaudited) | |
| Cash flows from operating activities | |
| | |
| |
| Net loss | |
$ | (13,849,433 | ) | |
$ | (6,339,214 | ) |
| Adjustments for: | |
| | | |
| | |
| Depreciation and Amortization of fixed and intangible assets | |
| 2,619,001 | | |
| 2,697,378 | |
| Stock-based compensation | |
| - | | |
| 252,095 | |
| Provision for and write off of withholding tax receivable | |
| 561,277 | | |
| 263,340 | |
| Provision for expected credit loss on trade and other receivables | |
| 869,519 | | |
| - | |
| Provision for obsolete inventories | |
| 3,090,282 | | |
| - | |
| Impairment loss on fixed assets | |
| 1,591,766 | | |
| - | |
| Impairment on goodwill | |
| 1,263,040 | | |
| - | |
| Finance costs | |
| 584,897 | | |
| 506,818 | |
| Loss from fixed assets disposal | |
| 41,965 | | |
| 24,530 | |
| Changes in operating assets and liabilities: | |
| | | |
| | |
| Decrease (Increase) in trade and other receivables | |
| 157,279 | | |
| (205,716 | ) |
| Increase in other assets | |
| (719,595 | ) | |
| (968,103 | ) |
| Decrease (Increase) in inventories | |
| 296,824 | | |
| (5,521,429 | ) |
| Decrease (Increase) in amounts due from/to related parties | |
| 639,807 | | |
| (6,111,443 | ) |
| Decrease (Increase) in deferred tax assets | |
| 874,431 | | |
| (325,083 | ) |
| Increase in Trade and other payables and other current liabilities | |
| 1,285,317 | | |
| 1,265,752 | |
| (Decrease) Increase in withholding tax receivable | |
| (374,013 | ) | |
| 663,095 | |
| Increase (Decrease) in provision for employee benefits | |
| 20,774 | | |
| (29,812 | ) |
| Net cash used in operating activities | |
| (1,046,862 | ) | |
| (13,827,792 | ) |
| | |
| | | |
| | |
| Cash flows from investing activities | |
| | | |
| | |
| Acquisition of property, plant and equipment | |
| (829,231 | ) | |
| (2,309,334 | ) |
| Proceeds from sale of property, plant and equipment | |
| - | | |
| 4,120 | |
| Acquisition of intangible assets | |
| (217,077 | ) | |
| (3,082,880 | ) |
| Acquisition of subsidiaries, net of cash acquired | |
| - | | |
| (1,793,614 | ) |
| Deposits paid for business acquisitions | |
| - | | |
| (2,160,000 | ) |
| Net cash used in investing activities | |
| (1,046,308 | ) | |
| (9,341,708 | ) |
| | |
| | | |
| | |
| Cash flows from financing activities | |
| | | |
| | |
| Proceeds from issue of shares | |
| 20,867,386 | | |
| 18,275,728 | |
| Proceeds from exercise of warrants | |
| 506,693 | | |
| 1,423,690 | |
| Cash paid for the cancellation of fractional shares | |
| (49,664 | ) | |
| - | |
| Proceeds from borrowings | |
| 1,756,738 | | |
| - | |
| Repayment of borrowings | |
| (1,937,096 | ) | |
| (840,762 | ) |
| Payment of lease liabilities | |
| (1,267,979 | ) | |
| (1,483,203 | ) |
| Net cash generated from financing activities | |
| 19,876,078 | | |
| 17,375,453 | |
| | |
| | | |
| | |
| Net decrease in cash and cash equivalents, and restricted cash | |
| 17,782,908 | | |
| (5,794,047 | ) |
| Effect of movements in exchange rates on cash | |
| 16,840 | | |
| (519,523 | ) |
| Cash and cash equivalents, and restricted cash at January 1, | |
| 8,230,644 | | |
| 15,853,811 | |
| Cash and cash equivalents, and restricted cash at June 30, | |
$ | 26,030,392 | | |
$ | 9,540,241 | |
| | |
| | | |
| | |
| Non-cash investing and financing activities | |
| | | |
| | |
| Equity portion of purchase consideration paid for acquisition of subsidiaries | |
| - | | |
| 4,579,879 | |
| Equity portion of purchase consideration paid for acquisition of assets (Note 20) | |
| 1,848,000 | | |
| - | |
Non-IFRS
Financial Measures
To
supplement our unaudited interim condensed consolidated financial statements, which are prepared and presented in accordance with IFRS,
we use the non-IFRS adjusted EBITDA as financial measures for our consolidated results.
We
believe that adjusted EBITDA helps identify underlying trends in our business that could otherwise be distorted by the effect of certain
income or expenses that we include in loss from operations and net loss. We believe that these non-IFRS measures provide useful information
about our core operating results, enhance the overall understanding of our past performance and future prospects and allow for greater
visibility with respect to key metrics used by our management in its financial and operational decision-making. We present the non-IFRS
financial measures in order to provide more information and greater transparency to investors about our operating results.
EBITDA represents
net loss before (i) finance costs, provision for income tax benefit, depreciation of fixed assets and amortization of intangible
assets, which we do not believe are reflective of our core operating performance during the periods presented.
Non-IFRS
adjusted net loss represents net loss before (i) finance costs, income tax benefit and depreciation of fixed assets and amortization
of intangible assets, (ii) certain non-cash expenses, consisting of stock-based compensation expense and allowance for, write off
of withholding tax receivables, (iii) impairment of assets including trade and other receivables, inventories, fixed assets and goodwill.
Non-IFRS
loss per share represents non-IFRS net (loss) income attributable to ordinary shareholders
divided by the weighted average number of shares outstanding during the periods. Non-IFRS diluted (loss) earnings per
share represents non-IFRS net (loss) income attributable to ordinary shareholders divided
by the weighted average number of shares outstanding during the periods on a diluted basis.
The
table below is a reconciliation of our net loss to EBITDA and non-IFRS net loss for the periods indicated:
| | |
For the six months ended
June 30, | |
| | |
2023 | | |
2022 | |
| Net loss – IFRS | |
$ | (13,849,433 | ) | |
$ | (6,339,214 | ) |
| Finance costs | |
| 584,897 | | |
| 410,861 | |
| Provision for income tax expense (benefit) | |
| 874,431 | | |
| (320,183 | ) |
| Depreciation and amortization expense | |
| 2,619,001 | | |
| 2,697,378 | |
| EBITDA | |
| (9,771,104 | ) | |
| (3,551,158 | ) |
| Stock based compensation | |
| - | | |
| 252,095 | |
| Provision for and write off of withholding taxes receivable | |
| 561,277 | | |
| 263,340 | |
| Provision for expected credit loss on trade and other receivables | |
| 869,519 | | |
| - | |
| Provision for obsolete inventories | |
| 3,090,282 | | |
| - | |
| Impairment loss on fixed assets | |
| 1,591,766 | | |
| - | |
| Impairment of goodwill | |
| 1,263,040 | | |
| - | |
| Adjusted net loss (Non-IFRS) | |
$ | (2,395,220 | ) | |
$ | (3,035,723 | ) |
| Non-IFRS loss per share | |
| | | |
| | |
| Loss per share attributable to equity holders of the Company | |
| | | |
| | |
| Basic and diluted | |
$ | (0.75 | ) | |
$ | (3.45 | ) |
| | |
| | | |
| | |
| Weighted average number of shares used in computation: | |
| | | |
| | |
| Basic and diluted | |
| 3,174,282 | | |
| 880,618 | |
7
v3.23.3
| X |
- DefinitionBoolean flag that is true when the XBRL content amends previously-filed or accepted submission.
| Name: |
dei_AmendmentFlag |
| Namespace Prefix: |
dei_ |
| Data Type: |
xbrli:booleanItemType |
| Balance Type: |
na |
| Period Type: |
duration |
|
| X |
- DefinitionEnd date of current fiscal year in the format --MM-DD.
| Name: |
dei_CurrentFiscalYearEndDate |
| Namespace Prefix: |
dei_ |
| Data Type: |
xbrli:gMonthDayItemType |
| Balance Type: |
na |
| Period Type: |
duration |
|
| X |
- DefinitionFiscal period values are FY, Q1, Q2, and Q3. 1st, 2nd and 3rd quarter 10-Q or 10-QT statements have value Q1, Q2, and Q3 respectively, with 10-K, 10-KT or other fiscal year statements having FY.
| Name: |
dei_DocumentFiscalPeriodFocus |
| Namespace Prefix: |
dei_ |
| Data Type: |
dei:fiscalPeriodItemType |
| Balance Type: |
na |
| Period Type: |
duration |
|
| X |
- DefinitionThis is focus fiscal year of the document report in YYYY format. For a 2006 annual report, which may also provide financial information from prior periods, fiscal 2006 should be given as the fiscal year focus. Example: 2006.
| Name: |
dei_DocumentFiscalYearFocus |
| Namespace Prefix: |
dei_ |
| Data Type: |
xbrli:gYearItemType |
| Balance Type: |
na |
| Period Type: |
duration |
|
| X |
- DefinitionFor the EDGAR submission types of Form 8-K: the date of the report, the date of the earliest event reported; for the EDGAR submission types of Form N-1A: the filing date; for all other submission types: the end of the reporting or transition period. The format of the date is YYYY-MM-DD.
| Name: |
dei_DocumentPeriodEndDate |
| Namespace Prefix: |
dei_ |
| Data Type: |
xbrli:dateItemType |
| Balance Type: |
na |
| Period Type: |
duration |
|
| X |
- DefinitionThe type of document being provided (such as 10-K, 10-Q, 485BPOS, etc). The document type is limited to the same value as the supporting SEC submission type, or the word 'Other'.
| Name: |
dei_DocumentType |
| Namespace Prefix: |
dei_ |
| Data Type: |
dei:submissionTypeItemType |
| Balance Type: |
na |
| Period Type: |
duration |
|
| X |
- DefinitionA unique 10-digit SEC-issued value to identify entities that have filed disclosures with the SEC. It is commonly abbreviated as CIK. Reference 1: http://www.xbrl.org/2003/role/presentationRef
-Publisher SEC
-Name Exchange Act
-Number 240
-Section 12
-Subsection b-2
| Name: |
dei_EntityCentralIndexKey |
| Namespace Prefix: |
dei_ |
| Data Type: |
dei:centralIndexKeyItemType |
| Balance Type: |
na |
| Period Type: |
duration |
|
| X |
- DefinitionCommission file number. The field allows up to 17 characters. The prefix may contain 1-3 digits, the sequence number may contain 1-8 digits, the optional suffix may contain 1-4 characters, and the fields are separated with a hyphen.
| Name: |
dei_EntityFileNumber |
| Namespace Prefix: |
dei_ |
| Data Type: |
dei:fileNumberItemType |
| Balance Type: |
na |
| Period Type: |
duration |
|
| X |
- DefinitionThe exact name of the entity filing the report as specified in its charter, which is required by forms filed with the SEC. Reference 1: http://www.xbrl.org/2003/role/presentationRef
-Publisher SEC
-Name Exchange Act
-Number 240
-Section 12
-Subsection b-2
| Name: |
dei_EntityRegistrantName |
| Namespace Prefix: |
dei_ |
| Data Type: |
xbrli:normalizedStringItemType |
| Balance Type: |
na |
| Period Type: |
duration |
|
v3.23.3
Unaudited Interim Condensed Consolidated Balance Sheets - USD ($)
|
Jun. 30, 2023 |
Dec. 31, 2022 |
| Current assets: |
|
|
| Cash and cash equivalents |
$ 24,738,377
|
$ 6,930,639
|
| Restricted cash |
17,059
|
|
| Trade receivables |
5,127,998
|
5,400,186
|
| Other receivables |
|
817,564
|
| Other current assets |
2,380,718
|
1,743,008
|
| Withholding tax receivable, net |
536,974
|
757,024
|
| Inventories |
1,636,245
|
5,105,770
|
| Amounts due from related parties |
7,716,503
|
14,508,873
|
| Total current assets |
42,153,874
|
35,263,064
|
| Non-current assets: |
|
|
| Restricted cash |
1,274,956
|
1,300,005
|
| Property, plant and equipment |
6,018,408
|
8,066,761
|
| Right-of-use assets |
3,323,870
|
4,171,409
|
| Intangible assets, net |
6,954,467
|
5,793,143
|
| Goodwill |
1,416,405
|
2,679,445
|
| Withholding tax receivable, net |
1,921,073
|
1,934,072
|
| Deferred tax assets, net |
634,619
|
1,511,753
|
| Other non-current assets |
397,030
|
447,322
|
| Total non-current assets |
21,940,828
|
25,903,910
|
| Total assets |
64,094,702
|
61,166,974
|
| Current liabilities: |
|
|
| Trade and other payables |
3,065,838
|
2,633,995
|
| Borrowings |
3,509,709
|
3,181,616
|
| Borrowing from a related party |
1,666,846
|
3,148,500
|
| Current portion of operating lease liabilities |
1,645,233
|
1,774,192
|
| Current portion of finance lease liabilities, net |
200,383
|
398,136
|
| Other current liabilities |
2,837,287
|
2,477,369
|
| Amounts due to related parties |
3,703,038
|
3,868,691
|
| Convertible note payables |
606,786
|
1,730,267
|
| Total current liabilities |
17,235,120
|
19,212,766
|
| Non-current liabilities: |
|
|
| Borrowings |
13,727,574
|
13,899,818
|
| Operating lease liabilities |
1,686,803
|
2,340,075
|
| Borrowings from related parties |
1,437,303
|
1,455,649
|
| Finance lease liabilities |
229,747
|
233,550
|
| Other non-current liabilities |
|
43,200
|
| Provision for employee benefits |
4,775,062
|
4,849,614
|
| Total non-current liabilities |
21,856,489
|
22,821,906
|
| Total liabilities |
39,091,609
|
42,034,672
|
| Equity |
|
|
| Ordinary shares – par value $0.12 authorized 300,000,000 shares, issued and outstanding 6,883,223 shares at June 30, 2023; par value $0.12 authorized 7,500,000 shares, issued and outstanding 1,618,977 shares at December 31, 2022 |
826,022
|
194,313
|
| Subscription receivable |
(50,000)
|
(50,000)
|
| Additional paid in capital |
65,150,407
|
46,231,302
|
| Legal reserve |
223,500
|
223,500
|
| Warrants reserve |
251,036
|
251,036
|
| Accumulated deficit |
(42,588,233)
|
(28,769,014)
|
| Accumulated other comprehensive income |
1,281,904
|
1,112,494
|
| Capital & reserves attributable to equity holders of the Company |
25,094,636
|
19,193,631
|
| Non-controlling interests |
(91,543)
|
(61,329)
|
| Total equity |
25,003,093
|
19,132,302
|
| Total liabilities and equity |
$ 64,094,702
|
$ 61,166,974
|
| X |
- DefinitionThe amount of borrowings.
| Name: |
gfai_Borrowing |
| Namespace Prefix: |
gfai_ |
| Data Type: |
xbrli:monetaryItemType |
| Balance Type: |
credit |
| Period Type: |
instant |
|
| X |
- DefinitionThe amount of borrowings.
| Name: |
gfai_BorrowingsNonCurrent |
| Namespace Prefix: |
gfai_ |
| Data Type: |
xbrli:monetaryItemType |
| Balance Type: |
credit |
| Period Type: |
instant |
|
| X |
- DefinitionCapital & reserves attributable to equity holders of the Company.
| Name: |
gfai_CapitalReservesAttributableToEquityHoldersOfTheCompany |
| Namespace Prefix: |
gfai_ |
| Data Type: |
xbrli:monetaryItemType |
| Balance Type: |
credit |
| Period Type: |
instant |
|
| X |
- DefinitionA component of equity representing reserves created based on legal requirements.
| Name: |
gfai_LegalReserve |
| Namespace Prefix: |
gfai_ |
| Data Type: |
xbrli:monetaryItemType |
| Balance Type: |
credit |
| Period Type: |
instant |
|
| X |
- DefinitionFinance lease liabilities, net.
| Name: |
gfai_NoncurrentFinanceLeaseLiabilities |
| Namespace Prefix: |
gfai_ |
| Data Type: |
xbrli:monetaryItemType |
| Balance Type: |
credit |
| Period Type: |
instant |
|
| X |
- DefinitionThe amount of restricted cash.
| Name: |
gfai_RestrictedCash1 |
| Namespace Prefix: |
gfai_ |
| Data Type: |
xbrli:monetaryItemType |
| Balance Type: |
debit |
| Period Type: |
instant |
|
| X |
- DefinitionThe amount of restricted cash of non current assets.
| Name: |
gfai_RestrictedCashNonCurrentAssets |
| Namespace Prefix: |
gfai_ |
| Data Type: |
xbrli:monetaryItemType |
| Balance Type: |
debit |
| Period Type: |
instant |
|
| X |
- DefinitionThe amount of subscription receivable.
| Name: |
gfai_SubscriptionReceivable |
| Namespace Prefix: |
gfai_ |
| Data Type: |
xbrli:monetaryItemType |
| Balance Type: |
debit |
| Period Type: |
instant |
|
| X |
- DefinitionThe amount of accumulated items of income and expense (including reclassification adjustments) that are not recognised in profit or loss as required or permitted by other IFRSs. [Refer: IFRSs [member]; Other comprehensive income] Reference 1: http://www.xbrl.org/2009/role/commonPracticeRef
-Name IAS
-Number 1
-IssueDate 2023-01-01
-Paragraph 55
-URI https://taxonomy.ifrs.org/xifrs-link?type=IAS&num=1&code=ifrs-tx-2023-en-r&anchor=para_55&doctype=Standard
-URIDate 2023-03-23
| Name: |
ifrs-full_AccumulatedOtherComprehensiveIncome |
| Namespace Prefix: |
ifrs-full_ |
| Data Type: |
xbrli:monetaryItemType |
| Balance Type: |
credit |
| Period Type: |
instant |
|
| X |
- DefinitionThe amount received or receivable from the issuance of the entity's shares in excess of nominal value and amounts received from other transactions involving the entity's stock or stockholders. Reference 1: http://www.xbrl.org/2009/role/commonPracticeRef
-Name IAS
-Number 1
-IssueDate 2023-01-01
-Paragraph 55
-URI https://taxonomy.ifrs.org/xifrs-link?type=IAS&num=1&code=ifrs-tx-2023-en-r&anchor=para_55&doctype=Standard
-URIDate 2023-03-23
| Name: |
ifrs-full_AdditionalPaidinCapital |
| Namespace Prefix: |
ifrs-full_ |
| Data Type: |
xbrli:monetaryItemType |
| Balance Type: |
credit |
| Period Type: |
instant |
|
| X |
- DefinitionThe amount of a present economic resource controlled by the entity as a result of past events. Economic resource is a right that has the potential to produce economic benefits. Reference 1: http://www.xbrl.org/2003/role/disclosureRef
-Name IFRS
-Number 13
-IssueDate 2023-01-01
-Paragraph 93
-Subparagraph a
-URI https://taxonomy.ifrs.org/xifrs-link?type=IFRS&num=13&code=ifrs-tx-2023-en-r&anchor=para_93_a&doctype=Standard
-URIDate 2023-03-23
Reference 2: http://www.xbrl.org/2003/role/disclosureRef
-Name IFRS
-Number 8
-IssueDate 2023-01-01
-Paragraph 28
-Subparagraph c
-URI https://taxonomy.ifrs.org/xifrs-link?type=IFRS&num=8&code=ifrs-tx-2023-en-r&anchor=para_28_c&doctype=Standard
-URIDate 2023-03-23
Reference 3: http://www.xbrl.org/2003/role/disclosureRef
-Name IFRS
-Number 13
-IssueDate 2023-01-01
-Paragraph 93
-Subparagraph b
-URI https://taxonomy.ifrs.org/xifrs-link?type=IFRS&num=13&code=ifrs-tx-2023-en-r&anchor=para_93_b&doctype=Standard
-URIDate 2023-03-23
Reference 4: http://www.xbrl.org/2003/role/disclosureRef
-Name IFRS
-Number 13
-IssueDate 2023-01-01
-Paragraph 93
-Subparagraph e
-URI https://taxonomy.ifrs.org/xifrs-link?type=IFRS&num=13&code=ifrs-tx-2023-en-r&anchor=para_93_e&doctype=Standard
-URIDate 2023-03-23
Reference 5: http://www.xbrl.org/2003/role/disclosureRef
-Name IFRS
-Number 8
-IssueDate 2023-01-01
-Paragraph 23
-URI https://taxonomy.ifrs.org/xifrs-link?type=IFRS&num=8&code=ifrs-tx-2023-en-r&anchor=para_23&doctype=Standard
-URIDate 2023-03-23
Reference 6: http://www.xbrl.org/2003/role/disclosureRef
-Name IAS
-Number 1
-IssueDate 2023-01-01
-Paragraph 55
-URI https://taxonomy.ifrs.org/xifrs-link?type=IAS&num=1&code=ifrs-tx-2023-en-r&anchor=para_55&doctype=Standard
-URIDate 2023-03-23
| Name: |
ifrs-full_Assets |
| Namespace Prefix: |
ifrs-full_ |
| Data Type: |
xbrli:monetaryItemType |
| Balance Type: |
debit |
| Period Type: |
instant |
|
| X |
- DefinitionThe amount of cash on hand and demand deposits, along with short-term, highly liquid investments that are readily convertible to known amounts of cash and that are subject to an insignificant risk of changes in value. [Refer: Cash; Cash equivalents] Reference 1: http://www.xbrl.org/2003/role/disclosureRef
-Name IAS
-Number 7
-IssueDate 2023-01-01
-Paragraph 45
-URI https://taxonomy.ifrs.org/xifrs-link?type=IAS&num=7&code=ifrs-tx-2023-en-r&anchor=para_45&doctype=Standard
-URIDate 2023-03-23
Reference 2: http://www.xbrl.org/2003/role/disclosureRef
-Name IFRS
-Number 12
-IssueDate 2023-01-01
-Paragraph B13
-Subparagraph a
-URI https://taxonomy.ifrs.org/xifrs-link?type=IFRS&num=12&code=ifrs-tx-2023-en-r&anchor=para_B13_a&doctype=Appendix&subtype=B
-URIDate 2023-03-23
Reference 3: http://www.xbrl.org/2003/role/disclosureRef
-Name IAS
-Number 1
-IssueDate 2023-01-01
-Paragraph 54
-Subparagraph i
-URI https://taxonomy.ifrs.org/xifrs-link?type=IAS&num=1&code=ifrs-tx-2023-en-r&anchor=para_54_i&doctype=Standard
-URIDate 2023-03-23
| Name: |
ifrs-full_CashAndCashEquivalents |
| Namespace Prefix: |
ifrs-full_ |
| Data Type: |
xbrli:monetaryItemType |
| Balance Type: |
debit |
| Period Type: |
instant |
|
| X |
- DefinitionThe amount of assets that the entity (a) expects to realise or intends to sell or consume in its normal operating cycle; (b) holds primarily for the purpose of trading; (c) expects to realise within twelve months after the reporting period; or (d) classifies as cash or cash equivalents (as defined in IAS 7) unless the asset is restricted from being exchanged or used to settle a liability for at least twelve months after the reporting period. [Refer: Assets] Reference 1: http://www.xbrl.org/2003/role/exampleRef
-Name IFRS
-Number 12
-IssueDate 2023-01-01
-Paragraph B10
-Subparagraph b
-URI https://taxonomy.ifrs.org/xifrs-link?type=IFRS&num=12&code=ifrs-tx-2023-en-r&anchor=para_B10_b&doctype=Appendix&subtype=B
-URIDate 2023-03-23
Reference 2: http://www.xbrl.org/2003/role/disclosureRef
-Name IFRS
-Number 12
-IssueDate 2023-01-01
-Paragraph B12
-Subparagraph b
-Clause i
-URI https://taxonomy.ifrs.org/xifrs-link?type=IFRS&num=12&code=ifrs-tx-2023-en-r&anchor=para_B12_b_i&doctype=Appendix&subtype=B
-URIDate 2023-03-23
Reference 3: http://www.xbrl.org/2003/role/disclosureRef
-Name IAS
-Number 1
-IssueDate 2023-01-01
-Paragraph 66
-URI https://taxonomy.ifrs.org/xifrs-link?type=IAS&num=1&code=ifrs-tx-2023-en-r&anchor=para_66&doctype=Standard
-URIDate 2023-03-23
| Name: |
ifrs-full_CurrentAssets |
| Namespace Prefix: |
ifrs-full_ |
| Data Type: |
xbrli:monetaryItemType |
| Balance Type: |
debit |
| Period Type: |
instant |
|
| X |
- References
+ Details
| Name: |
ifrs-full_CurrentAssetsAbstract |
| Namespace Prefix: |
ifrs-full_ |
| Data Type: |
xbrli:stringItemType |
| Balance Type: |
na |
| Period Type: |
duration |
|
| X |
- DefinitionThe amount of current lease liabilities. [Refer: Lease liabilities] Reference 1: http://www.xbrl.org/2003/role/disclosureRef
-Name IFRS
-Number 16
-IssueDate 2023-01-01
-Paragraph 47
-Subparagraph b
-URI https://taxonomy.ifrs.org/xifrs-link?type=IFRS&num=16&code=ifrs-tx-2023-en-r&anchor=para_47_b&doctype=Standard
-URIDate 2023-03-23
| Name: |
ifrs-full_CurrentLeaseLiabilities |
| Namespace Prefix: |
ifrs-full_ |
| Data Type: |
xbrli:monetaryItemType |
| Balance Type: |
credit |
| Period Type: |
instant |
|
| X |
- DefinitionThe amount of liabilities that: (a) the entity expects to settle in its normal operating cycle; (b) the entity holds primarily for the purpose of trading; (c) are due to be settled within twelve months after the reporting period; or (d) the entity does not have the right at the end of the reporting period to defer settlement for at least twelve months after the reporting period. Reference 1: http://www.xbrl.org/2003/role/exampleRef
-Name IFRS
-Number 12
-IssueDate 2023-01-01
-Paragraph B10
-Subparagraph b
-URI https://taxonomy.ifrs.org/xifrs-link?type=IFRS&num=12&code=ifrs-tx-2023-en-r&anchor=para_B10_b&doctype=Appendix&subtype=B
-URIDate 2023-03-23
Reference 2: http://www.xbrl.org/2003/role/disclosureRef
-Name IFRS
-Number 12
-IssueDate 2023-01-01
-Paragraph B12
-Subparagraph b
-Clause iii
-URI https://taxonomy.ifrs.org/xifrs-link?type=IFRS&num=12&code=ifrs-tx-2023-en-r&anchor=para_B12_b_iii&doctype=Appendix&subtype=B
-URIDate 2023-03-23
Reference 3: http://www.xbrl.org/2003/role/disclosureRef
-Name IAS
-Number 1
-IssueDate 2023-01-01
-Paragraph 69
-URI https://taxonomy.ifrs.org/xifrs-link?type=IAS&num=1&code=ifrs-tx-2023-en-r&anchor=para_69&doctype=Standard
-URIDate 2023-03-23
| Name: |
ifrs-full_CurrentLiabilities |
| Namespace Prefix: |
ifrs-full_ |
| Data Type: |
xbrli:monetaryItemType |
| Balance Type: |
credit |
| Period Type: |
instant |
|
| X |
- References
+ Details
| Name: |
ifrs-full_CurrentLiabilitiesAbstract |
| Namespace Prefix: |
ifrs-full_ |
| Data Type: |
xbrli:stringItemType |
| Balance Type: |
na |
| Period Type: |
duration |
|
| X |
- DefinitionThe amounts of income taxes recoverable in future periods in respect of: (a) deductible temporary differences; (b) the carryforward of unused tax losses; and (c) the carryforward of unused tax credits. [Refer: Temporary differences [member]; Unused tax credits [member]; Unused tax losses [member]] Reference 1: http://www.xbrl.org/2003/role/disclosureRef
-Name IAS
-Number 12
-IssueDate 2023-01-01
-Paragraph 81
-Subparagraph g
-Clause i
-URI https://taxonomy.ifrs.org/xifrs-link?type=IAS&num=12&code=ifrs-tx-2023-en-r&anchor=para_81_g_i&doctype=Standard
-URIDate 2023-03-23
Reference 2: http://www.xbrl.org/2003/role/disclosureRef
-Name IAS
-Number 1
-IssueDate 2023-01-01
-Paragraph 54
-Subparagraph o
-URI https://taxonomy.ifrs.org/xifrs-link?type=IAS&num=1&code=ifrs-tx-2023-en-r&anchor=para_54_o&doctype=Standard
-URIDate 2023-03-23
Reference 3: http://www.xbrl.org/2003/role/disclosureRef
-Name IAS
-Number 1
-IssueDate 2023-01-01
-Paragraph 56
-URI https://taxonomy.ifrs.org/xifrs-link?type=IAS&num=1&code=ifrs-tx-2023-en-r&anchor=para_56&doctype=Standard
-URIDate 2023-03-23
| Name: |
ifrs-full_DeferredTaxAssets |
| Namespace Prefix: |
ifrs-full_ |
| Data Type: |
xbrli:monetaryItemType |
| Balance Type: |
debit |
| Period Type: |
instant |
|
| X |
- DefinitionThe amount of residual interest in the assets of the entity after deducting all its liabilities. Reference 1: http://www.xbrl.org/2003/role/disclosureRef
-Name IFRS
-Number 1
-IssueDate 2023-01-01
-Paragraph 24
-Subparagraph a
-URI https://taxonomy.ifrs.org/xifrs-link?type=IFRS&num=1&code=ifrs-tx-2023-en-r&anchor=para_24_a&doctype=Standard
-URIDate 2023-03-23
Reference 2: http://www.xbrl.org/2003/role/disclosureRef
-Name IFRS
-Number 1
-IssueDate 2023-01-01
-Paragraph 32
-Subparagraph a
-Clause i
-URI https://taxonomy.ifrs.org/xifrs-link?type=IFRS&num=1&code=ifrs-tx-2023-en-r&anchor=para_32_a_i&doctype=Standard
-URIDate 2023-03-23
Reference 3: http://www.xbrl.org/2003/role/disclosureRef
-Name IFRS
-Number 13
-IssueDate 2023-01-01
-Paragraph 93
-Subparagraph a
-URI https://taxonomy.ifrs.org/xifrs-link?type=IFRS&num=13&code=ifrs-tx-2023-en-r&anchor=para_93_a&doctype=Standard
-URIDate 2023-03-23
Reference 4: http://www.xbrl.org/2003/role/disclosureRef
-Name IFRS
-Number 13
-IssueDate 2023-01-01
-Paragraph 93
-Subparagraph b
-URI https://taxonomy.ifrs.org/xifrs-link?type=IFRS&num=13&code=ifrs-tx-2023-en-r&anchor=para_93_b&doctype=Standard
-URIDate 2023-03-23
Reference 5: http://www.xbrl.org/2003/role/disclosureRef
-Name IFRS
-Number 13
-IssueDate 2023-01-01
-Paragraph 93
-Subparagraph e
-URI https://taxonomy.ifrs.org/xifrs-link?type=IFRS&num=13&code=ifrs-tx-2023-en-r&anchor=para_93_e&doctype=Standard
-URIDate 2023-03-23
Reference 6: http://www.xbrl.org/2003/role/disclosureRef
-Name IAS
-Number 1
-IssueDate 2023-01-01
-Paragraph 55
-URI https://taxonomy.ifrs.org/xifrs-link?type=IAS&num=1&code=ifrs-tx-2023-en-r&anchor=para_55&doctype=Standard
-URIDate 2023-03-23
Reference 7: http://www.xbrl.org/2003/role/disclosureRef
-Name IAS
-Number 1
-IssueDate 2023-01-01
-Paragraph 78
-Subparagraph e
-URI https://taxonomy.ifrs.org/xifrs-link?type=IAS&num=1&code=ifrs-tx-2023-en-r&anchor=para_78_e&doctype=Standard
-URIDate 2023-03-23
| Name: |
ifrs-full_Equity |
| Namespace Prefix: |
ifrs-full_ |
| Data Type: |
xbrli:monetaryItemType |
| Balance Type: |
credit |
| Period Type: |
instant |
|
| X |
- References
+ Details
| Name: |
ifrs-full_EquityAbstract |
| Namespace Prefix: |
ifrs-full_ |
| Data Type: |
xbrli:stringItemType |
| Balance Type: |
na |
| Period Type: |
duration |
|
| X |
- DefinitionThe amount of the entity's equity and liabilities. [Refer: Equity; Liabilities] Reference 1: http://www.xbrl.org/2003/role/disclosureRef
-Name IAS
-Number 1
-IssueDate 2023-01-01
-Paragraph 55
-URI https://taxonomy.ifrs.org/xifrs-link?type=IAS&num=1&code=ifrs-tx-2023-en-r&anchor=para_55&doctype=Standard
-URIDate 2023-03-23
| Name: |
ifrs-full_EquityAndLiabilities |
| Namespace Prefix: |
ifrs-full_ |
| Data Type: |
xbrli:monetaryItemType |
| Balance Type: |
credit |
| Period Type: |
instant |
|
| X |
- DefinitionThe amount of assets representing the future economic benefits arising from other assets acquired in a business combination that are not individually identified and separately recognised. [Refer: Business combinations [member]] Reference 1: http://www.xbrl.org/2003/role/disclosureRef
-Name IAS
-Number 36
-IssueDate 2023-01-01
-Paragraph 134
-Subparagraph a
-URI https://taxonomy.ifrs.org/xifrs-link?type=IAS&num=36&code=ifrs-tx-2023-en-r&anchor=para_134_a&doctype=Standard
-URIDate 2023-03-23
Reference 2: http://www.xbrl.org/2003/role/disclosureRef
-Name IAS
-Number 36
-IssueDate 2023-01-01
-Paragraph 135
-Subparagraph a
-URI https://taxonomy.ifrs.org/xifrs-link?type=IAS&num=36&code=ifrs-tx-2023-en-r&anchor=para_135_a&doctype=Standard
-URIDate 2023-03-23
Reference 3: http://www.xbrl.org/2003/role/disclosureRef
-Name IFRS
-Number 3
-IssueDate 2023-01-01
-Paragraph B67
-Subparagraph d
-URI https://taxonomy.ifrs.org/xifrs-link?type=IFRS&num=3&code=ifrs-tx-2023-en-r&anchor=para_B67_d&doctype=Appendix&subtype=B
-URIDate 2023-03-23
Reference 4: http://www.xbrl.org/2003/role/disclosureRef
-Name IAS
-Number 1
-IssueDate 2023-01-01
-Paragraph 54
-Subparagraph c
-URI https://taxonomy.ifrs.org/xifrs-link?type=IAS&num=1&code=ifrs-tx-2023-en-r&anchor=para_54_c&doctype=Standard
-URIDate 2023-03-23
| Name: |
ifrs-full_Goodwill |
| Namespace Prefix: |
ifrs-full_ |
| Data Type: |
xbrli:monetaryItemType |
| Balance Type: |
debit |
| Period Type: |
instant |
|
| X |
- DefinitionThe amount of identifiable non-monetary assets without physical substance. This amount does not include goodwill. [Refer: Goodwill] Reference 1: http://www.xbrl.org/2003/role/disclosureRef
-Name IAS
-Number 38
-IssueDate 2023-01-01
-Paragraph 118
-Subparagraph e
-URI https://taxonomy.ifrs.org/xifrs-link?type=IAS&num=38&code=ifrs-tx-2023-en-r&anchor=para_118_e&doctype=Standard
-URIDate 2023-03-23
Reference 2: http://www.xbrl.org/2003/role/disclosureRef
-Name IAS
-Number 1
-IssueDate 2023-01-01
-Paragraph 54
-Subparagraph c
-URI https://taxonomy.ifrs.org/xifrs-link?type=IAS&num=1&code=ifrs-tx-2023-en-r&anchor=para_54_c&doctype=Standard
-URIDate 2023-03-23
| Name: |
ifrs-full_IntangibleAssetsOtherThanGoodwill |
| Namespace Prefix: |
ifrs-full_ |
| Data Type: |
xbrli:monetaryItemType |
| Balance Type: |
debit |
| Period Type: |
instant |
|
| X |
- DefinitionThe amount of current inventories. [Refer: Inventories] Reference 1: http://www.xbrl.org/2003/role/disclosureRef
-Name IAS
-Number 2
-IssueDate 2023-01-01
-Paragraph 36
-Subparagraph b
-URI https://taxonomy.ifrs.org/xifrs-link?type=IAS&num=2&code=ifrs-tx-2023-en-r&anchor=para_36_b&doctype=Standard
-URIDate 2023-03-23
Reference 2: http://www.xbrl.org/2003/role/disclosureRef
-Name IAS
-Number 1
-IssueDate 2023-01-01
-Paragraph 54
-Subparagraph g
-URI https://taxonomy.ifrs.org/xifrs-link?type=IAS&num=1&code=ifrs-tx-2023-en-r&anchor=para_54_g&doctype=Standard
-URIDate 2023-03-23
Reference 3: http://www.xbrl.org/2003/role/exampleRef
-Name IAS
-Number 1
-IssueDate 2023-01-01
-Paragraph 68
-URI https://taxonomy.ifrs.org/xifrs-link?type=IAS&num=1&code=ifrs-tx-2023-en-r&anchor=para_68&doctype=Standard
-URIDate 2023-03-23
| Name: |
ifrs-full_Inventories |
| Namespace Prefix: |
ifrs-full_ |
| Data Type: |
xbrli:monetaryItemType |
| Balance Type: |
debit |
| Period Type: |
instant |
|
| X |
- DefinitionThe nominal value of capital issued. Reference 1: http://www.xbrl.org/2003/role/exampleRef
-Name IAS
-Number 1
-IssueDate 2023-01-01
-Paragraph 78
-Subparagraph e
-URI https://taxonomy.ifrs.org/xifrs-link?type=IAS&num=1&code=ifrs-tx-2023-en-r&anchor=para_78_e&doctype=Standard
-URIDate 2023-03-23
| Name: |
ifrs-full_IssuedCapital |
| Namespace Prefix: |
ifrs-full_ |
| Data Type: |
xbrli:monetaryItemType |
| Balance Type: |
credit |
| Period Type: |
instant |
|
| X |
- DefinitionThe amount of a present obligation of the entity to transfer an economic resource as a result of past events. Economic resource is a right that has the potential to produce economic benefits. Reference 1: http://www.xbrl.org/2003/role/disclosureRef
-Name IFRS
-Number 13
-IssueDate 2023-01-01
-Paragraph 93
-Subparagraph a
-URI https://taxonomy.ifrs.org/xifrs-link?type=IFRS&num=13&code=ifrs-tx-2023-en-r&anchor=para_93_a&doctype=Standard
-URIDate 2023-03-23
Reference 2: http://www.xbrl.org/2003/role/disclosureRef
-Name IFRS
-Number 13
-IssueDate 2023-01-01
-Paragraph 93
-Subparagraph b
-URI https://taxonomy.ifrs.org/xifrs-link?type=IFRS&num=13&code=ifrs-tx-2023-en-r&anchor=para_93_b&doctype=Standard
-URIDate 2023-03-23
Reference 3: http://www.xbrl.org/2003/role/disclosureRef
-Name IFRS
-Number 13
-IssueDate 2023-01-01
-Paragraph 93
-Subparagraph e
-URI https://taxonomy.ifrs.org/xifrs-link?type=IFRS&num=13&code=ifrs-tx-2023-en-r&anchor=para_93_e&doctype=Standard
-URIDate 2023-03-23
Reference 4: http://www.xbrl.org/2003/role/disclosureRef
-Name IFRS
-Number 8
-IssueDate 2023-01-01
-Paragraph 28
-Subparagraph d
-URI https://taxonomy.ifrs.org/xifrs-link?type=IFRS&num=8&code=ifrs-tx-2023-en-r&anchor=para_28_d&doctype=Standard
-URIDate 2023-03-23
Reference 5: http://www.xbrl.org/2003/role/disclosureRef
-Name IFRS
-Number 8
-IssueDate 2023-01-01
-Paragraph 23
-URI https://taxonomy.ifrs.org/xifrs-link?type=IFRS&num=8&code=ifrs-tx-2023-en-r&anchor=para_23&doctype=Standard
-URIDate 2023-03-23
Reference 6: http://www.xbrl.org/2003/role/disclosureRef
-Name IAS
-Number 1
-IssueDate 2023-01-01
-Paragraph 55
-URI https://taxonomy.ifrs.org/xifrs-link?type=IAS&num=1&code=ifrs-tx-2023-en-r&anchor=para_55&doctype=Standard
-URIDate 2023-03-23
| Name: |
ifrs-full_Liabilities |
| Namespace Prefix: |
ifrs-full_ |
| Data Type: |
xbrli:monetaryItemType |
| Balance Type: |
credit |
| Period Type: |
instant |
|
| X |
- DefinitionThe amount of equity in a subsidiary not attributable, directly or indirectly, to a parent. [Refer: Subsidiaries [member]] Reference 1: http://www.xbrl.org/2003/role/disclosureRef
-Name IFRS
-Number 12
-IssueDate 2023-01-01
-Paragraph 12
-Subparagraph f
-URI https://taxonomy.ifrs.org/xifrs-link?type=IFRS&num=12&code=ifrs-tx-2023-en-r&anchor=para_12_f&doctype=Standard
-URIDate 2023-03-23
Reference 2: http://www.xbrl.org/2003/role/disclosureRef
-Name IFRS
-Number 10
-IssueDate 2023-01-01
-Paragraph 22
-URI https://taxonomy.ifrs.org/xifrs-link?type=IFRS&num=10&code=ifrs-tx-2023-en-r&anchor=para_22&doctype=Standard
-URIDate 2023-03-23
Reference 3: http://www.xbrl.org/2003/role/disclosureRef
-Name IAS
-Number 1
-IssueDate 2023-01-01
-Paragraph 54
-Subparagraph q
-URI https://taxonomy.ifrs.org/xifrs-link?type=IAS&num=1&code=ifrs-tx-2023-en-r&anchor=para_54_q&doctype=Standard
-URIDate 2023-03-23
| Name: |
ifrs-full_NoncontrollingInterests |
| Namespace Prefix: |
ifrs-full_ |
| Data Type: |
xbrli:monetaryItemType |
| Balance Type: |
credit |
| Period Type: |
instant |
|
| X |
- DefinitionThe amount of assets that do not meet the definition of current assets. [Refer: Current assets] Reference 1: http://www.xbrl.org/2003/role/disclosureRef
-Name IFRS
-Number 12
-IssueDate 2023-01-01
-Paragraph B12
-Subparagraph b
-Clause ii
-URI https://taxonomy.ifrs.org/xifrs-link?type=IFRS&num=12&code=ifrs-tx-2023-en-r&anchor=para_B12_b_ii&doctype=Appendix&subtype=B
-URIDate 2023-03-23
Reference 2: http://www.xbrl.org/2003/role/exampleRef
-Name IFRS
-Number 12
-IssueDate 2023-01-01
-Paragraph B10
-Subparagraph b
-URI https://taxonomy.ifrs.org/xifrs-link?type=IFRS&num=12&code=ifrs-tx-2023-en-r&anchor=para_B10_b&doctype=Appendix&subtype=B
-URIDate 2023-03-23
Reference 3: http://www.xbrl.org/2003/role/disclosureRef
-Name IAS
-Number 1
-IssueDate 2023-01-01
-Paragraph 66
-URI https://taxonomy.ifrs.org/xifrs-link?type=IAS&num=1&code=ifrs-tx-2023-en-r&anchor=para_66&doctype=Standard
-URIDate 2023-03-23
| Name: |
ifrs-full_NoncurrentAssets |
| Namespace Prefix: |
ifrs-full_ |
| Data Type: |
xbrli:monetaryItemType |
| Balance Type: |
debit |
| Period Type: |
instant |
|
| X |
- References
+ Details
| Name: |
ifrs-full_NoncurrentAssetsAbstract |
| Namespace Prefix: |
ifrs-full_ |
| Data Type: |
xbrli:stringItemType |
| Balance Type: |
na |
| Period Type: |
duration |
|
| X |
- DefinitionThe amount of non-current lease liabilities. [Refer: Lease liabilities] Reference 1: http://www.xbrl.org/2003/role/disclosureRef
-Name IFRS
-Number 16
-IssueDate 2023-01-01
-Paragraph 47
-Subparagraph b
-URI https://taxonomy.ifrs.org/xifrs-link?type=IFRS&num=16&code=ifrs-tx-2023-en-r&anchor=para_47_b&doctype=Standard
-URIDate 2023-03-23
| Name: |
ifrs-full_NoncurrentLeaseLiabilities |
| Namespace Prefix: |
ifrs-full_ |
| Data Type: |
xbrli:monetaryItemType |
| Balance Type: |
credit |
| Period Type: |
instant |
|
| X |
- DefinitionThe amount of liabilities that do not meet the definition of current liabilities. [Refer: Current liabilities] Reference 1: http://www.xbrl.org/2003/role/disclosureRef
-Name IFRS
-Number 12
-IssueDate 2023-01-01
-Paragraph B12
-Subparagraph b
-Clause iv
-URI https://taxonomy.ifrs.org/xifrs-link?type=IFRS&num=12&code=ifrs-tx-2023-en-r&anchor=para_B12_b_iv&doctype=Appendix&subtype=B
-URIDate 2023-03-23
Reference 2: http://www.xbrl.org/2003/role/exampleRef
-Name IFRS
-Number 12
-IssueDate 2023-01-01
-Paragraph B10
-Subparagraph b
-URI https://taxonomy.ifrs.org/xifrs-link?type=IFRS&num=12&code=ifrs-tx-2023-en-r&anchor=para_B10_b&doctype=Appendix&subtype=B
-URIDate 2023-03-23
Reference 3: http://www.xbrl.org/2003/role/disclosureRef
-Name IAS
-Number 1
-IssueDate 2023-01-01
-Paragraph 69
-URI https://taxonomy.ifrs.org/xifrs-link?type=IAS&num=1&code=ifrs-tx-2023-en-r&anchor=para_69&doctype=Standard
-URIDate 2023-03-23
| Name: |
ifrs-full_NoncurrentLiabilities |
| Namespace Prefix: |
ifrs-full_ |
| Data Type: |
xbrli:monetaryItemType |
| Balance Type: |
credit |
| Period Type: |
instant |
|
| X |
- References
+ Details
| Name: |
ifrs-full_NoncurrentLiabilitiesAbstract |
| Namespace Prefix: |
ifrs-full_ |
| Data Type: |
xbrli:stringItemType |
| Balance Type: |
na |
| Period Type: |
duration |
|
| X |
- DefinitionThe amount of non-current provisions for employee benefits. [Refer: Provisions for employee benefits] Reference 1: http://www.xbrl.org/2003/role/disclosureRef
-Name IAS
-Number 1
-IssueDate 2023-01-01
-Paragraph 78
-Subparagraph d
-URI https://taxonomy.ifrs.org/xifrs-link?type=IAS&num=1&code=ifrs-tx-2023-en-r&anchor=para_78_d&doctype=Standard
-URIDate 2023-03-23
| Name: |
ifrs-full_NoncurrentProvisionsForEmployeeBenefits |
| Namespace Prefix: |
ifrs-full_ |
| Data Type: |
xbrli:monetaryItemType |
| Balance Type: |
credit |
| Period Type: |
instant |
|
| X |
- DefinitionThe amount of current assets that the entity does not separately disclose in the same statement or note. [Refer: Current assets] Reference 1: http://www.xbrl.org/2009/role/commonPracticeRef
-Name IAS
-Number 1
-IssueDate 2023-01-01
-Paragraph 55
-URI https://taxonomy.ifrs.org/xifrs-link?type=IAS&num=1&code=ifrs-tx-2023-en-r&anchor=para_55&doctype=Standard
-URIDate 2023-03-23
| Name: |
ifrs-full_OtherCurrentAssets |
| Namespace Prefix: |
ifrs-full_ |
| Data Type: |
xbrli:monetaryItemType |
| Balance Type: |
debit |
| Period Type: |
instant |
|
| X |
- DefinitionThe amount of current financial liabilities that the entity does not separately disclose in the same statement or note. [Refer: Other financial liabilities; Current financial liabilities] Reference 1: http://www.xbrl.org/2003/role/disclosureRef
-Name IFRS
-Number 12
-IssueDate 2023-01-01
-Paragraph B13
-Subparagraph b
-URI https://taxonomy.ifrs.org/xifrs-link?type=IFRS&num=12&code=ifrs-tx-2023-en-r&anchor=para_B13_b&doctype=Appendix&subtype=B
-URIDate 2023-03-23
Reference 2: http://www.xbrl.org/2003/role/disclosureRef
-Name IAS
-Number 1
-IssueDate 2023-01-01
-Paragraph 54
-Subparagraph m
-URI https://taxonomy.ifrs.org/xifrs-link?type=IAS&num=1&code=ifrs-tx-2023-en-r&anchor=para_54_m&doctype=Standard
-URIDate 2023-03-23
| Name: |
ifrs-full_OtherCurrentFinancialLiabilities |
| Namespace Prefix: |
ifrs-full_ |
| Data Type: |
xbrli:monetaryItemType |
| Balance Type: |
credit |
| Period Type: |
instant |
|
| X |
- DefinitionThe amount of current liabilities that the entity does not separately disclose in the same statement or note. [Refer: Current liabilities] Reference 1: http://www.xbrl.org/2009/role/commonPracticeRef
-Name IAS
-Number 1
-IssueDate 2023-01-01
-Paragraph 55
-URI https://taxonomy.ifrs.org/xifrs-link?type=IAS&num=1&code=ifrs-tx-2023-en-r&anchor=para_55&doctype=Standard
-URIDate 2023-03-23
| Name: |
ifrs-full_OtherCurrentLiabilities |
| Namespace Prefix: |
ifrs-full_ |
| Data Type: |
xbrli:monetaryItemType |
| Balance Type: |
credit |
| Period Type: |
instant |
|
| X |
- DefinitionThe amount of current payables that the entity does not separately disclose in the same statement or note. Reference 1: http://www.xbrl.org/2009/role/commonPracticeRef
-Name IAS
-Number 1
-IssueDate 2023-01-01
-Paragraph 55
-URI https://taxonomy.ifrs.org/xifrs-link?type=IAS&num=1&code=ifrs-tx-2023-en-r&anchor=para_55&doctype=Standard
-URIDate 2023-03-23
| Name: |
ifrs-full_OtherCurrentPayables |
| Namespace Prefix: |
ifrs-full_ |
| Data Type: |
xbrli:monetaryItemType |
| Balance Type: |
credit |
| Period Type: |
instant |
|
| X |
- DefinitionThe amount of current other receivables. [Refer: Other receivables] Reference 1: http://www.xbrl.org/2003/role/exampleRef
-Name IAS
-Number 1
-IssueDate 2023-01-01
-Paragraph 78
-Subparagraph b
-URI https://taxonomy.ifrs.org/xifrs-link?type=IAS&num=1&code=ifrs-tx-2023-en-r&anchor=para_78_b&doctype=Standard
-URIDate 2023-03-23
| Name: |
ifrs-full_OtherCurrentReceivables |
| Namespace Prefix: |
ifrs-full_ |
| Data Type: |
xbrli:monetaryItemType |
| Balance Type: |
debit |
| Period Type: |
instant |
|
| X |
- DefinitionThe amount of non-current financial assets that the entity does not separately disclose in the same statement or note. [Refer: Other financial assets] Reference 1: http://www.xbrl.org/2003/role/disclosureRef
-Name IAS
-Number 1
-IssueDate 2023-01-01
-Paragraph 54
-Subparagraph d
-URI https://taxonomy.ifrs.org/xifrs-link?type=IAS&num=1&code=ifrs-tx-2023-en-r&anchor=para_54_d&doctype=Standard
-URIDate 2023-03-23
| Name: |
ifrs-full_OtherNoncurrentFinancialAssets |
| Namespace Prefix: |
ifrs-full_ |
| Data Type: |
xbrli:monetaryItemType |
| Balance Type: |
debit |
| Period Type: |
instant |
|
| X |
- DefinitionThe amount of non-current liabilities that the entity does not separately disclose in the same statement or note. [Refer: Non-current liabilities] Reference 1: http://www.xbrl.org/2009/role/commonPracticeRef
-Name IAS
-Number 1
-IssueDate 2023-01-01
-Paragraph 55
-URI https://taxonomy.ifrs.org/xifrs-link?type=IAS&num=1&code=ifrs-tx-2023-en-r&anchor=para_55&doctype=Standard
-URIDate 2023-03-23
| Name: |
ifrs-full_OtherNoncurrentLiabilities |
| Namespace Prefix: |
ifrs-full_ |
| Data Type: |
xbrli:monetaryItemType |
| Balance Type: |
credit |
| Period Type: |
instant |
|
| X |
- DefinitionThe amount of tangible assets that: (a) are held for use in the production or supply of goods or services, for rental to others, or for administrative purposes; and (b) are expected to be used during more than one period. Note that right-of-use assets are not included. [Contrast: Property, plant and equipment including right-of-use assets] Reference 1: http://www.xbrl.org/2003/role/disclosureRef
-Name IAS
-Number 16
-IssueDate 2023-01-01
-Paragraph 73
-Subparagraph e
-URI https://taxonomy.ifrs.org/xifrs-link?type=IAS&num=16&code=ifrs-tx-2023-en-r&anchor=para_73_e&doctype=Standard
-URIDate 2023-03-23
Reference 2: http://www.xbrl.org/2003/role/disclosureRef
-Name IAS
-Number 1
-IssueDate 2023-01-01
-Paragraph 54
-Subparagraph a
-URI https://taxonomy.ifrs.org/xifrs-link?type=IAS&num=1&code=ifrs-tx-2023-en-r&anchor=para_54_a&doctype=Standard
-URIDate 2023-03-23
| Name: |
ifrs-full_PropertyPlantAndEquipment |
| Namespace Prefix: |
ifrs-full_ |
| Data Type: |
xbrli:monetaryItemType |
| Balance Type: |
debit |
| Period Type: |
instant |
|
| X |
- DefinitionA component of equity representing the entity's cumulative undistributed earnings or deficit. Reference 1: http://www.xbrl.org/2003/role/exampleRef
-Name IAS
-Number 1
-IssueDate 2023-01-01
-Paragraph IG6
-URI https://taxonomy.ifrs.org/xifrs-link?type=IAS&num=1&code=ifrs-tx-2023-en-r&anchor=para_IG6&doctype=Implementation%20Guidance
-URIDate 2023-03-23
Reference 2: http://www.xbrl.org/2003/role/exampleRef
-Name IAS
-Number 1
-IssueDate 2023-01-01
-Paragraph 78
-Subparagraph e
-URI https://taxonomy.ifrs.org/xifrs-link?type=IAS&num=1&code=ifrs-tx-2023-en-r&anchor=para_78_e&doctype=Standard
-URIDate 2023-03-23
| Name: |
ifrs-full_RetainedEarnings |
| Namespace Prefix: |
ifrs-full_ |
| Data Type: |
xbrli:monetaryItemType |
| Balance Type: |
credit |
| Period Type: |
instant |
|
| X |
- DefinitionThe amount of assets that represent a lessee's right to use an underlying asset for the lease term that do not meet the definition of investment property. Underlying asset is an asset that is the subject of a lease, for which the right to use that asset has been provided by a lessor to a lessee. Reference 1: http://www.xbrl.org/2003/role/disclosureRef
-Name IFRS
-Number 16
-IssueDate 2023-01-01
-Paragraph 53
-Subparagraph j
-URI https://taxonomy.ifrs.org/xifrs-link?type=IFRS&num=16&code=ifrs-tx-2023-en-r&anchor=para_53_j&doctype=Standard
-URIDate 2023-03-23
Reference 2: http://www.xbrl.org/2003/role/disclosureRef
-Name IFRS
-Number 16
-IssueDate 2023-01-01
-Paragraph 47
-Subparagraph a
-URI https://taxonomy.ifrs.org/xifrs-link?type=IFRS&num=16&code=ifrs-tx-2023-en-r&anchor=para_47_a&doctype=Standard
-URIDate 2023-03-23
| Name: |
ifrs-full_RightofuseAssets |
| Namespace Prefix: |
ifrs-full_ |
| Data Type: |
xbrli:monetaryItemType |
| Balance Type: |
debit |
| Period Type: |
instant |
|
| X |
- DefinitionThe amount of current trade payables and current other payables. [Refer: Current trade payables; Other current payables] Reference 1: http://www.xbrl.org/2003/role/disclosureRef
-Name IAS
-Number 1
-IssueDate 2023-01-01
-Paragraph 54
-Subparagraph k
-URI https://taxonomy.ifrs.org/xifrs-link?type=IAS&num=1&code=ifrs-tx-2023-en-r&anchor=para_54_k&doctype=Standard
-URIDate 2023-03-23
| Name: |
ifrs-full_TradeAndOtherCurrentPayables |
| Namespace Prefix: |
ifrs-full_ |
| Data Type: |
xbrli:monetaryItemType |
| Balance Type: |
credit |
| Period Type: |
instant |
|
| X |
- DefinitionThe amount of current trade receivables and current other receivables. [Refer: Current trade receivables; Other current receivables] Reference 1: http://www.xbrl.org/2003/role/disclosureRef
-Name IAS
-Number 1
-IssueDate 2023-01-01
-Paragraph 54
-Subparagraph h
-URI https://taxonomy.ifrs.org/xifrs-link?type=IAS&num=1&code=ifrs-tx-2023-en-r&anchor=para_54_h&doctype=Standard
-URIDate 2023-03-23
Reference 2: http://www.xbrl.org/2003/role/disclosureRef
-Name IAS
-Number 1
-IssueDate 2023-01-01
-Paragraph 78
-Subparagraph b
-URI https://taxonomy.ifrs.org/xifrs-link?type=IAS&num=1&code=ifrs-tx-2023-en-r&anchor=para_78_b&doctype=Standard
-URIDate 2023-03-23
| Name: |
ifrs-full_TradeAndOtherCurrentReceivables |
| Namespace Prefix: |
ifrs-full_ |
| Data Type: |
xbrli:monetaryItemType |
| Balance Type: |
debit |
| Period Type: |
instant |
|
| X |
- DefinitionA component of equity resulting from issuing share purchase warrants, other than those resulting from share-based payment arrangements. [Refer: Reserve of share-based payments] Reference 1: http://www.xbrl.org/2009/role/commonPracticeRef
-Name IAS
-Number 1
-IssueDate 2023-01-01
-Paragraph 78
-Subparagraph e
-URI https://taxonomy.ifrs.org/xifrs-link?type=IAS&num=1&code=ifrs-tx-2023-en-r&anchor=para_78_e&doctype=Standard
-URIDate 2023-03-23
| Name: |
ifrs-full_WarrantReserve |
| Namespace Prefix: |
ifrs-full_ |
| Data Type: |
xbrli:monetaryItemType |
| Balance Type: |
credit |
| Period Type: |
instant |
|
v3.23.3
Unaudited Interim Condensed Consolidated Balance Sheets (Parentheticals) - $ / shares
|
Jun. 30, 2023 |
Dec. 31, 2022 |
| Statement of financial position [abstract] |
|
|
| Ordinary shares, par value (in Dollars per share) |
$ 0.12
|
$ 0.12
|
| Ordinary shares, shares authorized |
300,000,000
|
7,500,000
|
| Ordinary shares, shares issued |
6,883,223
|
1,618,977
|
| Ordinary shares, shares outstanding |
6,883,223
|
1,618,977
|
| X |
- DefinitionOrdinary shares, shares issued.
| Name: |
gfai_NumberOfShareIssued |
| Namespace Prefix: |
gfai_ |
| Data Type: |
xbrli:sharesItemType |
| Balance Type: |
na |
| Period Type: |
instant |
|
| X |
- DefinitionThe number of shares authorised. Reference 1: http://www.xbrl.org/2003/role/disclosureRef
-Name IAS
-Number 1
-IssueDate 2023-01-01
-Paragraph 79
-Subparagraph a
-Clause i
-URI https://taxonomy.ifrs.org/xifrs-link?type=IAS&num=1&code=ifrs-tx-2023-en-r&anchor=para_79_a_i&doctype=Standard
-URIDate 2023-03-23
| Name: |
ifrs-full_NumberOfSharesAuthorised |
| Namespace Prefix: |
ifrs-full_ |
| Data Type: |
xbrli:sharesItemType |
| Balance Type: |
na |
| Period Type: |
instant |
|
| X |
- DefinitionThe number of shares that have been authorised and issued, reduced by treasury shares held. [Refer: Treasury shares] Reference 1: http://www.xbrl.org/2003/role/disclosureRef
-Name IAS
-Number 1
-IssueDate 2023-01-01
-Paragraph 79
-Subparagraph a
-Clause iv
-URI https://taxonomy.ifrs.org/xifrs-link?type=IAS&num=1&code=ifrs-tx-2023-en-r&anchor=para_79_a_iv&doctype=Standard
-URIDate 2023-03-23
| Name: |
ifrs-full_NumberOfSharesOutstanding |
| Namespace Prefix: |
ifrs-full_ |
| Data Type: |
xbrli:sharesItemType |
| Balance Type: |
na |
| Period Type: |
instant |
|
| X |
- DefinitionThe nominal value per share. Reference 1: http://www.xbrl.org/2003/role/disclosureRef
-Name IAS
-Number 1
-IssueDate 2023-01-01
-Paragraph 79
-Subparagraph a
-Clause iii
-URI https://taxonomy.ifrs.org/xifrs-link?type=IAS&num=1&code=ifrs-tx-2023-en-r&anchor=para_79_a_iii&doctype=Standard
-URIDate 2023-03-23
| Name: |
ifrs-full_ParValuePerShare |
| Namespace Prefix: |
ifrs-full_ |
| Data Type: |
dtr-types:perShareItemType |
| Balance Type: |
na |
| Period Type: |
instant |
|
| X |
- References
+ Details
| Name: |
ifrs-full_StatementOfFinancialPositionAbstract |
| Namespace Prefix: |
ifrs-full_ |
| Data Type: |
xbrli:stringItemType |
| Balance Type: |
na |
| Period Type: |
duration |
|
v3.23.3
Unaudited Interim Condensed Consolidated Statement of Profit or Loss - USD ($)
|
6 Months Ended |
Jun. 30, 2023 |
Jun. 30, 2022 |
| Profit or loss [abstract] |
|
|
| Revenue |
$ 18,413,292
|
$ 16,942,522
|
| Cost of sales |
(15,939,067)
|
(14,998,727)
|
| Gross profit |
2,474,225
|
1,943,795
|
| Stock based compensation |
|
(252,095)
|
| Provision for and write off of withholding tax receivable |
(561,277)
|
(263,340)
|
| Provision for expected credit loss on trade and other receivables |
(870,408)
|
|
| Provision for obsolete inventories |
(3,090,283)
|
|
| Impairment loss on fixed assets |
(1,591,766)
|
|
| Impairment of goodwill |
(1,263,040)
|
|
| Selling, distribution and administrative expenses |
(6,981,660)
|
(6,977,996)
|
| Operating loss |
(11,884,209)
|
(5,549,636)
|
| Other income, net |
77,765
|
46,859
|
| Foreign exchange losses, net |
(583,661)
|
(745,759)
|
| Finance costs |
(584,897)
|
(410,861)
|
| Loss before income tax |
(12,975,002)
|
(6,659,397)
|
| Provision for income tax (expense) benefit |
(874,431)
|
320,183
|
| Net loss for the period |
(13,849,433)
|
(6,339,214)
|
| Less: net loss attributable to non-controlling interests |
30,214
|
32,392
|
| Net loss attributable to equity holders of the Company |
$ (13,819,219)
|
$ (6,306,822)
|
| Loss per share |
|
|
| Basic and diluted loss attributable to the equity holders of the Company (in Dollars per share) |
$ (4.35)
|
$ (7.16)
|
| Weighted average number of shares used in computation: |
|
|
| Basic (in Shares) |
3,174,282
|
880,618
|
| X |
- DefinitionNet loss attributable to non-controlling interests.
| Name: |
gfai_LessNetLossAttributableToNoncontrollingInterests |
| Namespace Prefix: |
gfai_ |
| Data Type: |
xbrli:monetaryItemType |
| Balance Type: |
credit |
| Period Type: |
duration |
|
| X |
- DefinitionProvision for and write off of withholding taxes receivable.
| Name: |
gfai_ProvisionForAndWriteOffOfWithholdingTaxesReceivable |
| Namespace Prefix: |
gfai_ |
| Data Type: |
xbrli:monetaryItemType |
| Balance Type: |
debit |
| Period Type: |
duration |
|
| X |
- DefinitionThe amount of share based compensation.
| Name: |
gfai_StockBasedCompensation |
| Namespace Prefix: |
gfai_ |
| Data Type: |
xbrli:monetaryItemType |
| Balance Type: |
debit |
| Period Type: |
duration |
|
| X |
- DefinitionThe amount of expenses that the entity classifies as being administrative. Reference 1: http://www.xbrl.org/2003/role/disclosureRef
-Name IAS
-Number 26
-IssueDate 2023-01-01
-Paragraph 35
-Subparagraph b
-Clause vi
-URI https://taxonomy.ifrs.org/xifrs-link?type=IAS&num=26&code=ifrs-tx-2023-en-r&anchor=para_35_b_vi&doctype=Standard
-URIDate 2023-03-23
Reference 2: http://www.xbrl.org/2003/role/exampleRef
-Name IAS
-Number 1
-IssueDate 2023-01-01
-Paragraph 103
-URI https://taxonomy.ifrs.org/xifrs-link?type=IAS&num=1&code=ifrs-tx-2023-en-r&anchor=para_103&doctype=Standard
-URIDate 2023-03-23
Reference 3: http://www.xbrl.org/2003/role/disclosureRef
-Name IAS
-Number 1
-IssueDate 2023-01-01
-Paragraph 99
-URI https://taxonomy.ifrs.org/xifrs-link?type=IAS&num=1&code=ifrs-tx-2023-en-r&anchor=para_99&doctype=Standard
-URIDate 2023-03-23
| Name: |
ifrs-full_AdministrativeExpense |
| Namespace Prefix: |
ifrs-full_ |
| Data Type: |
xbrli:monetaryItemType |
| Balance Type: |
debit |
| Period Type: |
duration |
|
| X |
- DefinitionThe amount of profit (loss) attributable to ordinary equity holders of the parent entity (the numerator) divided by the weighted average number of ordinary shares outstanding during the period (the denominator). Reference 1: http://www.xbrl.org/2003/role/disclosureRef
-Name IAS
-Number 33
-IssueDate 2023-01-01
-Paragraph 66
-URI https://taxonomy.ifrs.org/xifrs-link?type=IAS&num=33&code=ifrs-tx-2023-en-r&anchor=para_66&doctype=Standard
-URIDate 2023-03-23
Reference 2: http://www.xbrl.org/2003/role/disclosureRef
-Name IAS
-Number 33
-IssueDate 2023-01-01
-Paragraph 67
-URI https://taxonomy.ifrs.org/xifrs-link?type=IAS&num=33&code=ifrs-tx-2023-en-r&anchor=para_67&doctype=Standard
-URIDate 2023-03-23
| Name: |
ifrs-full_BasicEarningsLossPerShare |
| Namespace Prefix: |
ifrs-full_ |
| Data Type: |
dtr-types:perShareItemType |
| Balance Type: |
na |
| Period Type: |
duration |
|
| X |
- DefinitionThe amount of all expenses directly or indirectly attributed to the goods or services sold. Attributed expenses include, but are not limited to, costs previously included in the measurement of inventory that has now been sold, such as depreciation and maintenance of factory buildings and equipment used in the production process, unallocated production overheads, and abnormal amounts of production costs of inventories. Reference 1: http://www.xbrl.org/2003/role/disclosureRef
-Name IAS
-Number 1
-IssueDate 2023-01-01
-Paragraph 99
-URI https://taxonomy.ifrs.org/xifrs-link?type=IAS&num=1&code=ifrs-tx-2023-en-r&anchor=para_99&doctype=Standard
-URIDate 2023-03-23
Reference 2: http://www.xbrl.org/2003/role/disclosureRef
-Name IAS
-Number 1
-IssueDate 2023-01-01
-Paragraph 103
-URI https://taxonomy.ifrs.org/xifrs-link?type=IAS&num=1&code=ifrs-tx-2023-en-r&anchor=para_103&doctype=Standard
-URIDate 2023-03-23
| Name: |
ifrs-full_CostOfSales |
| Namespace Prefix: |
ifrs-full_ |
| Data Type: |
xbrli:monetaryItemType |
| Balance Type: |
debit |
| Period Type: |
duration |
|
| X |
- References
+ Details
| Name: |
ifrs-full_EarningsPerShareAbstract |
| Namespace Prefix: |
ifrs-full_ |
| Data Type: |
xbrli:stringItemType |
| Balance Type: |
na |
| Period Type: |
duration |
|
| X |
- DefinitionThe amount of costs associated with financing activities of the entity. Reference 1: http://www.xbrl.org/2003/role/disclosureRef
-Name IAS
-Number 1
-IssueDate 2023-01-01
-Paragraph 82
-Subparagraph b
-URI https://taxonomy.ifrs.org/xifrs-link?type=IAS&num=1&code=ifrs-tx-2023-en-r&anchor=para_82_b&doctype=Standard
-URIDate 2023-03-23
| Name: |
ifrs-full_FinanceCosts |
| Namespace Prefix: |
ifrs-full_ |
| Data Type: |
xbrli:monetaryItemType |
| Balance Type: |
debit |
| Period Type: |
duration |
|
| X |
- DefinitionThe amount of exchange differences recognised in profit or loss that arise from foreign currency transactions, excluding those arising on financial instruments measured at fair value through profit or loss in accordance with IFRS 9. [Refer: At fair value [member]; Financial instruments, class [member]] Reference 1: http://www.xbrl.org/2003/role/disclosureRef
-Name IAS
-Number 21
-IssueDate 2023-01-01
-Paragraph 52
-Subparagraph a
-URI https://taxonomy.ifrs.org/xifrs-link?type=IAS&num=21&code=ifrs-tx-2023-en-r&anchor=para_52_a&doctype=Standard
-URIDate 2023-03-23
Reference 2: http://www.xbrl.org/2003/role/disclosureRef
-Name IAS
-Number 1
-IssueDate 2023-01-01
-Paragraph 35
-URI https://taxonomy.ifrs.org/xifrs-link?type=IAS&num=1&code=ifrs-tx-2023-en-r&anchor=para_35&doctype=Standard
-URIDate 2023-03-23
| Name: |
ifrs-full_GainsLossesOnExchangeDifferencesOnTranslationRecognisedInProfitOrLoss |
| Namespace Prefix: |
ifrs-full_ |
| Data Type: |
xbrli:monetaryItemType |
| Balance Type: |
credit |
| Period Type: |
duration |
|
| X |
- DefinitionThe gains (losses) representing the difference resulting from the restatement of non-monetary assets, owners' equity and items in the statement of comprehensive income and the adjustment of index linked assets and liabilities in hyperinflationary reporting. Reference 1: http://www.xbrl.org/2003/role/disclosureRef
-Name IAS
-Number 29
-IssueDate 2023-01-01
-Paragraph 9
-URI https://taxonomy.ifrs.org/xifrs-link?type=IAS&num=29&code=ifrs-tx-2023-en-r&anchor=para_9&doctype=Standard
-URIDate 2023-03-23
| Name: |
ifrs-full_GainsLossesOnNetMonetaryPosition |
| Namespace Prefix: |
ifrs-full_ |
| Data Type: |
xbrli:monetaryItemType |
| Balance Type: |
credit |
| Period Type: |
duration |
|
| X |
- DefinitionThe amount of revenue less cost of sales. [Refer: Cost of sales; Revenue] Reference 1: http://www.xbrl.org/2003/role/exampleRef
-Name IAS
-Number 1
-IssueDate 2023-01-01
-Paragraph 103
-URI https://taxonomy.ifrs.org/xifrs-link?type=IAS&num=1&code=ifrs-tx-2023-en-r&anchor=para_103&doctype=Standard
-URIDate 2023-03-23
| Name: |
ifrs-full_GrossProfit |
| Namespace Prefix: |
ifrs-full_ |
| Data Type: |
xbrli:monetaryItemType |
| Balance Type: |
credit |
| Period Type: |
duration |
|
| X |
- DefinitionThe amount of impairment loss, impairment gain or reversal of impairment loss that is recognised in profit or loss in accordance with paragraph 5.5.8 of IFRS 9 and that arises from applying the impairment requirements in Section 5.5 of IFRS 9. Reference 1: http://www.xbrl.org/2003/role/disclosureRef
-Name IAS
-Number 1
-IssueDate 2023-01-01
-Paragraph 82
-Subparagraph ba
-URI https://taxonomy.ifrs.org/xifrs-link?type=IAS&num=1&code=ifrs-tx-2023-en-r&anchor=para_82_ba&doctype=Standard
-URIDate 2023-03-23
| Name: |
ifrs-full_ImpairmentLossImpairmentGainAndReversalOfImpairmentLossDeterminedInAccordanceWithIFRS9 |
| Namespace Prefix: |
ifrs-full_ |
| Data Type: |
xbrli:monetaryItemType |
| Balance Type: |
debit |
| Period Type: |
duration |
|
| X |
- References
+ Details
| Name: |
ifrs-full_IncomeStatementAbstract |
| Namespace Prefix: |
ifrs-full_ |
| Data Type: |
xbrli:stringItemType |
| Balance Type: |
na |
| Period Type: |
duration |
|
| X |
- DefinitionThe amount of income or expense from subsidiaries, jointly controlled entities and associates that the entity does not separately disclose in the same statement or note. [Refer: Associates [member]; Subsidiaries [member]] Reference 1: http://www.xbrl.org/2009/role/commonPracticeRef
-Name IAS
-Number 1
-IssueDate 2023-01-01
-Paragraph 85
-URI https://taxonomy.ifrs.org/xifrs-link?type=IAS&num=1&code=ifrs-tx-2023-en-r&anchor=para_85&doctype=Standard
-URIDate 2023-03-23
| Name: |
ifrs-full_OtherIncomeExpenseFromSubsidiariesJointlyControlledEntitiesAndAssociates |
| Namespace Prefix: |
ifrs-full_ |
| Data Type: |
xbrli:monetaryItemType |
| Balance Type: |
credit |
| Period Type: |
duration |
|
| X |
- DefinitionThe total of income less expenses from continuing and discontinued operations, excluding the components of other comprehensive income. [Refer: Other comprehensive income] Reference 1: http://www.xbrl.org/2003/role/disclosureRef
-Name IAS
-Number 7
-IssueDate 2023-01-01
-Paragraph 18
-Subparagraph b
-URI https://taxonomy.ifrs.org/xifrs-link?type=IAS&num=7&code=ifrs-tx-2023-en-r&anchor=para_18_b&doctype=Standard
-URIDate 2023-03-23
Reference 2: http://www.xbrl.org/2003/role/disclosureRef
-Name IFRS
-Number 1
-IssueDate 2023-01-01
-Paragraph 32
-Subparagraph a
-Clause ii
-URI https://taxonomy.ifrs.org/xifrs-link?type=IFRS&num=1&code=ifrs-tx-2023-en-r&anchor=para_32_a_ii&doctype=Standard
-URIDate 2023-03-23
Reference 3: http://www.xbrl.org/2003/role/disclosureRef
-Name IFRS
-Number 1
-IssueDate 2023-01-01
-Paragraph 24
-Subparagraph b
-URI https://taxonomy.ifrs.org/xifrs-link?type=IFRS&num=1&code=ifrs-tx-2023-en-r&anchor=para_24_b&doctype=Standard
-URIDate 2023-03-23
Reference 4: http://www.xbrl.org/2003/role/disclosureRef
-Name IFRS
-Number 8
-IssueDate 2023-01-01
-Paragraph 28
-Subparagraph b
-URI https://taxonomy.ifrs.org/xifrs-link?type=IFRS&num=8&code=ifrs-tx-2023-en-r&anchor=para_28_b&doctype=Standard
-URIDate 2023-03-23
Reference 5: http://www.xbrl.org/2003/role/disclosureRef
-Name IFRS
-Number 8
-IssueDate 2023-01-01
-Paragraph 23
-URI https://taxonomy.ifrs.org/xifrs-link?type=IFRS&num=8&code=ifrs-tx-2023-en-r&anchor=para_23&doctype=Standard
-URIDate 2023-03-23
Reference 6: http://www.xbrl.org/2003/role/exampleRef
-Name IFRS
-Number 12
-IssueDate 2023-01-01
-Paragraph B10
-Subparagraph b
-URI https://taxonomy.ifrs.org/xifrs-link?type=IFRS&num=12&code=ifrs-tx-2023-en-r&anchor=para_B10_b&doctype=Appendix&subtype=B
-URIDate 2023-03-23
Reference 7: http://www.xbrl.org/2003/role/exampleRef
-Name IFRS
-Number 17
-IssueDate 2023-01-01
-Paragraph 113
-Subparagraph b
-URI https://taxonomy.ifrs.org/xifrs-link?type=IFRS&num=17&code=ifrs-tx-2023-en-r&anchor=para_113_b&doctype=Standard
-URIDate 2023-03-23
Reference 8: http://www.xbrl.org/2003/role/disclosureRef
-Name IAS
-Number 1
-IssueDate 2023-01-01
-Paragraph 81A
-Subparagraph a
-URI https://taxonomy.ifrs.org/xifrs-link?type=IAS&num=1&code=ifrs-tx-2023-en-r&anchor=para_81A_a&doctype=Standard
-URIDate 2023-03-23
Reference 9: http://www.xbrl.org/2003/role/disclosureRef
-Name IAS
-Number 1
-IssueDate 2023-01-01
-Paragraph 106
-Subparagraph d
-Clause i
-URI https://taxonomy.ifrs.org/xifrs-link?type=IAS&num=1&code=ifrs-tx-2023-en-r&anchor=para_106_d_i&doctype=Standard
-URIDate 2023-03-23
| Name: |
ifrs-full_ProfitLoss |
| Namespace Prefix: |
ifrs-full_ |
| Data Type: |
xbrli:monetaryItemType |
| Balance Type: |
credit |
| Period Type: |
duration |
|
| X |
- DefinitionThe profit (loss) from continuing and discontinued operations attributable to owners of the parent. [Refer: Profit (loss)] Reference 1: http://www.xbrl.org/2003/role/disclosureRef
-Name IAS
-Number 1
-IssueDate 2023-01-01
-Paragraph 81B
-Subparagraph a
-Clause ii
-URI https://taxonomy.ifrs.org/xifrs-link?type=IAS&num=1&code=ifrs-tx-2023-en-r&anchor=para_81B_a_ii&doctype=Standard
-URIDate 2023-03-23
| Name: |
ifrs-full_ProfitLossAttributableToOwnersOfParent |
| Namespace Prefix: |
ifrs-full_ |
| Data Type: |
xbrli:monetaryItemType |
| Balance Type: |
credit |
| Period Type: |
duration |
|
| X |
- DefinitionThe profit (loss) before tax expense or income. [Refer: Profit (loss)] Reference 1: http://www.xbrl.org/2003/role/disclosureRef
-Name IFRS
-Number 5
-IssueDate 2023-01-01
-Paragraph 33
-Subparagraph b
-Clause i
-URI https://taxonomy.ifrs.org/xifrs-link?type=IFRS&num=5&code=ifrs-tx-2023-en-r&anchor=para_33_b_i&doctype=Standard
-URIDate 2023-03-23
Reference 2: http://www.xbrl.org/2003/role/exampleRef
-Name IFRS
-Number 8
-IssueDate 2023-01-01
-Paragraph 28
-Subparagraph b
-URI https://taxonomy.ifrs.org/xifrs-link?type=IFRS&num=8&code=ifrs-tx-2023-en-r&anchor=para_28_b&doctype=Standard
-URIDate 2023-03-23
Reference 3: http://www.xbrl.org/2003/role/exampleRef
-Name IFRS
-Number 8
-IssueDate 2023-01-01
-Paragraph 23
-URI https://taxonomy.ifrs.org/xifrs-link?type=IFRS&num=8&code=ifrs-tx-2023-en-r&anchor=para_23&doctype=Standard
-URIDate 2023-03-23
Reference 4: http://www.xbrl.org/2003/role/exampleRef
-Name IAS
-Number 1
-IssueDate 2023-01-01
-Paragraph 103
-URI https://taxonomy.ifrs.org/xifrs-link?type=IAS&num=1&code=ifrs-tx-2023-en-r&anchor=para_103&doctype=Standard
-URIDate 2023-03-23
Reference 5: http://www.xbrl.org/2003/role/exampleRef
-Name IAS
-Number 1
-IssueDate 2023-01-01
-Paragraph 102
-URI https://taxonomy.ifrs.org/xifrs-link?type=IAS&num=1&code=ifrs-tx-2023-en-r&anchor=para_102&doctype=Standard
-URIDate 2023-03-23
| Name: |
ifrs-full_ProfitLossBeforeTax |
| Namespace Prefix: |
ifrs-full_ |
| Data Type: |
xbrli:monetaryItemType |
| Balance Type: |
credit |
| Period Type: |
duration |
|
| X |
- DefinitionThe profit (loss) from operating activities of the entity. [Refer: Profit (loss)] Reference 1: http://www.xbrl.org/2003/role/exampleRef
-Name IAS
-Number 32
-IssueDate 2023-01-01
-Paragraph IE33
-URI https://taxonomy.ifrs.org/xifrs-link?type=IAS&num=32&code=ifrs-tx-2023-en-r&anchor=para_IE33&doctype=Illustrative%20Examples
-URIDate 2023-03-23
Reference 2: http://www.xbrl.org/2009/role/commonPracticeRef
-Name IAS
-Number 1
-IssueDate 2023-01-01
-Paragraph 85
-URI https://taxonomy.ifrs.org/xifrs-link?type=IAS&num=1&code=ifrs-tx-2023-en-r&anchor=para_85&doctype=Standard
-URIDate 2023-03-23
| Name: |
ifrs-full_ProfitLossFromOperatingActivities |
| Namespace Prefix: |
ifrs-full_ |
| Data Type: |
xbrli:monetaryItemType |
| Balance Type: |
credit |
| Period Type: |
duration |
|
| X |
- DefinitionThe amount used (ie incurred and charged against the provision) for other provisions. [Refer: Other provisions] Reference 1: http://www.xbrl.org/2003/role/disclosureRef
-Name IAS
-Number 37
-IssueDate 2023-01-01
-Paragraph 84
-Subparagraph c
-URI https://taxonomy.ifrs.org/xifrs-link?type=IAS&num=37&code=ifrs-tx-2023-en-r&anchor=para_84_c&doctype=Standard
-URIDate 2023-03-23
| Name: |
ifrs-full_ProvisionUsedOtherProvisions |
| Namespace Prefix: |
ifrs-full_ |
| Data Type: |
xbrli:monetaryItemType |
| Balance Type: |
debit |
| Period Type: |
duration |
|
| X |
- DefinitionThe income arising in the course of an entity's ordinary activities. Income is increases in assets, or decreases in liabilities, that result in increases in equity, other than those relating to contributions from holders of equity claims. Reference 1: http://www.xbrl.org/2003/role/disclosureRef
-Name IFRS
-Number 8
-IssueDate 2023-01-01
-Paragraph 28
-Subparagraph a
-URI https://taxonomy.ifrs.org/xifrs-link?type=IFRS&num=8&code=ifrs-tx-2023-en-r&anchor=para_28_a&doctype=Standard
-URIDate 2023-03-23
Reference 2: http://www.xbrl.org/2003/role/disclosureRef
-Name IFRS
-Number 8
-IssueDate 2023-01-01
-Paragraph 23
-Subparagraph a
-URI https://taxonomy.ifrs.org/xifrs-link?type=IFRS&num=8&code=ifrs-tx-2023-en-r&anchor=para_23_a&doctype=Standard
-URIDate 2023-03-23
Reference 3: http://www.xbrl.org/2003/role/disclosureRef
-Name IFRS
-Number 8
-IssueDate 2023-01-01
-Paragraph 32
-URI https://taxonomy.ifrs.org/xifrs-link?type=IFRS&num=8&code=ifrs-tx-2023-en-r&anchor=para_32&doctype=Standard
-URIDate 2023-03-23
Reference 4: http://www.xbrl.org/2003/role/disclosureRef
-Name IFRS
-Number 5
-IssueDate 2023-01-01
-Paragraph 33
-Subparagraph b
-Clause i
-URI https://taxonomy.ifrs.org/xifrs-link?type=IFRS&num=5&code=ifrs-tx-2023-en-r&anchor=para_33_b_i&doctype=Standard
-URIDate 2023-03-23
Reference 5: http://www.xbrl.org/2003/role/disclosureRef
-Name IFRS
-Number 8
-IssueDate 2023-01-01
-Paragraph 33
-Subparagraph a
-URI https://taxonomy.ifrs.org/xifrs-link?type=IFRS&num=8&code=ifrs-tx-2023-en-r&anchor=para_33_a&doctype=Standard
-URIDate 2023-03-23
Reference 6: http://www.xbrl.org/2003/role/disclosureRef
-Name IFRS
-Number 8
-IssueDate 2023-01-01
-Paragraph 34
-URI https://taxonomy.ifrs.org/xifrs-link?type=IFRS&num=8&code=ifrs-tx-2023-en-r&anchor=para_34&doctype=Standard
-URIDate 2023-03-23
Reference 7: http://www.xbrl.org/2003/role/disclosureRef
-Name IFRS
-Number 12
-IssueDate 2023-01-01
-Paragraph B12
-Subparagraph b
-Clause v
-URI https://taxonomy.ifrs.org/xifrs-link?type=IFRS&num=12&code=ifrs-tx-2023-en-r&anchor=para_B12_b_v&doctype=Appendix&subtype=B
-URIDate 2023-03-23
Reference 8: http://www.xbrl.org/2003/role/exampleRef
-Name IFRS
-Number 12
-IssueDate 2023-01-01
-Paragraph B10
-Subparagraph b
-URI https://taxonomy.ifrs.org/xifrs-link?type=IFRS&num=12&code=ifrs-tx-2023-en-r&anchor=para_B10_b&doctype=Appendix&subtype=B
-URIDate 2023-03-23
Reference 9: http://www.xbrl.org/2003/role/disclosureRef
-Name IAS
-Number 1
-IssueDate 2023-01-01
-Paragraph 82
-Subparagraph a
-URI https://taxonomy.ifrs.org/xifrs-link?type=IAS&num=1&code=ifrs-tx-2023-en-r&anchor=para_82_a&doctype=Standard
-URIDate 2023-03-23
Reference 10: http://www.xbrl.org/2003/role/exampleRef
-Name IAS
-Number 1
-IssueDate 2023-01-01
-Paragraph 103
-URI https://taxonomy.ifrs.org/xifrs-link?type=IAS&num=1&code=ifrs-tx-2023-en-r&anchor=para_103&doctype=Standard
-URIDate 2023-03-23
Reference 11: http://www.xbrl.org/2003/role/exampleRef
-Name IAS
-Number 1
-IssueDate 2023-01-01
-Paragraph 102
-URI https://taxonomy.ifrs.org/xifrs-link?type=IAS&num=1&code=ifrs-tx-2023-en-r&anchor=para_102&doctype=Standard
-URIDate 2023-03-23
| Name: |
ifrs-full_Revenue |
| Namespace Prefix: |
ifrs-full_ |
| Data Type: |
xbrli:monetaryItemType |
| Balance Type: |
credit |
| Period Type: |
duration |
|
| X |
- DefinitionThe number of ordinary shares outstanding at the beginning of the period, adjusted by the number of ordinary shares bought back or issued during the period multiplied by a time-weighting factor. Reference 1: http://www.xbrl.org/2003/role/disclosureRef
-Name IAS
-Number 33
-IssueDate 2023-01-01
-Paragraph 70
-Subparagraph b
-URI https://taxonomy.ifrs.org/xifrs-link?type=IAS&num=33&code=ifrs-tx-2023-en-r&anchor=para_70_b&doctype=Standard
-URIDate 2023-03-23
| Name: |
ifrs-full_WeightedAverageShares |
| Namespace Prefix: |
ifrs-full_ |
| Data Type: |
xbrli:sharesItemType |
| Balance Type: |
na |
| Period Type: |
duration |
|
| X |
- References
+ Details
| Name: |
ifrs-full_WeightedAverageSharesAndAdjustedWeightedAverageSharesAbstract |
| Namespace Prefix: |
ifrs-full_ |
| Data Type: |
xbrli:stringItemType |
| Balance Type: |
na |
| Period Type: |
duration |
|
v3.23.3
| X |
- DefinitionThe weighted average number of ordinary shares outstanding plus the weighted average number of ordinary shares that would be issued on the conversion of all the dilutive potential ordinary shares into ordinary shares. [Refer: Ordinary shares [member]; Weighted average [member]] Reference 1: http://www.xbrl.org/2003/role/disclosureRef
-Name IAS
-Number 33
-IssueDate 2023-01-01
-Paragraph 70
-Subparagraph b
-URI https://taxonomy.ifrs.org/xifrs-link?type=IAS&num=33&code=ifrs-tx-2023-en-r&anchor=para_70_b&doctype=Standard
-URIDate 2023-03-23
| Name: |
ifrs-full_AdjustedWeightedAverageShares |
| Namespace Prefix: |
ifrs-full_ |
| Data Type: |
xbrli:sharesItemType |
| Balance Type: |
na |
| Period Type: |
duration |
|
| X |
- DefinitionThe amount of profit (loss) attributable to ordinary equity holders of the parent entity (the numerator), divided by the weighted average number of ordinary shares outstanding during the period (the denominator), both adjusted for the effects of all dilutive potential ordinary shares. [Refer: Ordinary shares [member]; Weighted average [member]] Reference 1: http://www.xbrl.org/2003/role/disclosureRef
-Name IAS
-Number 33
-IssueDate 2023-01-01
-Paragraph 66
-URI https://taxonomy.ifrs.org/xifrs-link?type=IAS&num=33&code=ifrs-tx-2023-en-r&anchor=para_66&doctype=Standard
-URIDate 2023-03-23
Reference 2: http://www.xbrl.org/2003/role/disclosureRef
-Name IAS
-Number 33
-IssueDate 2023-01-01
-Paragraph 67
-URI https://taxonomy.ifrs.org/xifrs-link?type=IAS&num=33&code=ifrs-tx-2023-en-r&anchor=para_67&doctype=Standard
-URIDate 2023-03-23
| Name: |
ifrs-full_DilutedEarningsLossPerShare |
| Namespace Prefix: |
ifrs-full_ |
| Data Type: |
dtr-types:perShareItemType |
| Balance Type: |
na |
| Period Type: |
duration |
|
| X |
- References
+ Details
| Name: |
ifrs-full_IncomeStatementAbstract |
| Namespace Prefix: |
ifrs-full_ |
| Data Type: |
xbrli:stringItemType |
| Balance Type: |
na |
| Period Type: |
duration |
|
v3.23.3
Unaudited Interim Condensed Consolidated Statement of Comprehensive Loss - USD ($)
|
6 Months Ended |
Jun. 30, 2023 |
Jun. 30, 2022 |
| Unaudited Interim Condensed Consolidated Statement Of Comprehensive Loss Abstract |
|
|
| Net (loss) for the period |
$ (13,849,433)
|
$ (6,339,214)
|
| Currency translation differences |
169,410
|
(197,909)
|
| Total comprehensive (loss) for the period |
(13,680,023)
|
(6,537,123)
|
| Attributable to: |
|
|
| Equity holders of the Company |
(13,651,390)
|
(6,502,884)
|
| Non-controlling interests |
(28,633)
|
(34,239)
|
| Comprehensive income |
$ (13,680,023)
|
$ (6,537,123)
|
| X |
- References
+ Details
| Name: |
gfai_UnauditedInterimCondensedConsolidatedStatementOfComprehensiveLossAbstract |
| Namespace Prefix: |
gfai_ |
| Data Type: |
xbrli:stringItemType |
| Balance Type: |
na |
| Period Type: |
duration |
|
| X |
- DefinitionThe amount of change in equity resulting from transactions and other events, other than those changes resulting from transactions with owners in their capacity as owners. Reference 1: http://www.xbrl.org/2003/role/disclosureRef
-Name IFRS
-Number 1
-IssueDate 2023-01-01
-Paragraph 32
-Subparagraph a
-Clause ii
-URI https://taxonomy.ifrs.org/xifrs-link?type=IFRS&num=1&code=ifrs-tx-2023-en-r&anchor=para_32_a_ii&doctype=Standard
-URIDate 2023-03-23
Reference 2: http://www.xbrl.org/2003/role/disclosureRef
-Name IFRS
-Number 1
-IssueDate 2023-01-01
-Paragraph 24
-Subparagraph b
-URI https://taxonomy.ifrs.org/xifrs-link?type=IFRS&num=1&code=ifrs-tx-2023-en-r&anchor=para_24_b&doctype=Standard
-URIDate 2023-03-23
Reference 3: http://www.xbrl.org/2003/role/exampleRef
-Name IFRS
-Number 12
-IssueDate 2023-01-01
-Paragraph B10
-Subparagraph b
-URI https://taxonomy.ifrs.org/xifrs-link?type=IFRS&num=12&code=ifrs-tx-2023-en-r&anchor=para_B10_b&doctype=Appendix&subtype=B
-URIDate 2023-03-23
Reference 4: http://www.xbrl.org/2003/role/disclosureRef
-Name IAS
-Number 1
-IssueDate 2023-01-01
-Paragraph 81A
-Subparagraph c
-URI https://taxonomy.ifrs.org/xifrs-link?type=IAS&num=1&code=ifrs-tx-2023-en-r&anchor=para_81A_c&doctype=Standard
-URIDate 2023-03-23
Reference 5: http://www.xbrl.org/2003/role/disclosureRef
-Name IFRS
-Number 12
-IssueDate 2023-01-01
-Paragraph B12
-Subparagraph b
-Clause ix
-URI https://taxonomy.ifrs.org/xifrs-link?type=IFRS&num=12&code=ifrs-tx-2023-en-r&anchor=para_B12_b_ix&doctype=Appendix&subtype=B
-URIDate 2023-03-23
Reference 6: http://www.xbrl.org/2003/role/disclosureRef
-Name IAS
-Number 1
-IssueDate 2023-01-01
-Paragraph 106
-Subparagraph a
-URI https://taxonomy.ifrs.org/xifrs-link?type=IAS&num=1&code=ifrs-tx-2023-en-r&anchor=para_106_a&doctype=Standard
-URIDate 2023-03-23
| Name: |
ifrs-full_ComprehensiveIncome |
| Namespace Prefix: |
ifrs-full_ |
| Data Type: |
xbrli:monetaryItemType |
| Balance Type: |
credit |
| Period Type: |
duration |
|
| X |
- References
+ Details
| Name: |
ifrs-full_ComprehensiveIncomeAttributableToAbstract |
| Namespace Prefix: |
ifrs-full_ |
| Data Type: |
xbrli:stringItemType |
| Balance Type: |
na |
| Period Type: |
duration |
|
| X |
- DefinitionThe amount of comprehensive income attributable to non-controlling interests. [Refer: Comprehensive income; Non-controlling interests] Reference 1: http://www.xbrl.org/2003/role/disclosureRef
-Name IAS
-Number 1
-IssueDate 2023-01-01
-Paragraph 81B
-Subparagraph b
-Clause i
-URI https://taxonomy.ifrs.org/xifrs-link?type=IAS&num=1&code=ifrs-tx-2023-en-r&anchor=para_81B_b_i&doctype=Standard
-URIDate 2023-03-23
Reference 2: http://www.xbrl.org/2003/role/disclosureRef
-Name IAS
-Number 1
-IssueDate 2023-01-01
-Paragraph 106
-Subparagraph a
-URI https://taxonomy.ifrs.org/xifrs-link?type=IAS&num=1&code=ifrs-tx-2023-en-r&anchor=para_106_a&doctype=Standard
-URIDate 2023-03-23
| Name: |
ifrs-full_ComprehensiveIncomeAttributableToNoncontrollingInterests |
| Namespace Prefix: |
ifrs-full_ |
| Data Type: |
xbrli:monetaryItemType |
| Balance Type: |
credit |
| Period Type: |
duration |
|
| X |
- DefinitionThe amount of comprehensive income attributable to owners of the parent. [Refer: Comprehensive income] Reference 1: http://www.xbrl.org/2003/role/disclosureRef
-Name IAS
-Number 1
-IssueDate 2023-01-01
-Paragraph 81B
-Subparagraph b
-Clause ii
-URI https://taxonomy.ifrs.org/xifrs-link?type=IAS&num=1&code=ifrs-tx-2023-en-r&anchor=para_81B_b_ii&doctype=Standard
-URIDate 2023-03-23
Reference 2: http://www.xbrl.org/2003/role/disclosureRef
-Name IAS
-Number 1
-IssueDate 2023-01-01
-Paragraph 106
-Subparagraph a
-URI https://taxonomy.ifrs.org/xifrs-link?type=IAS&num=1&code=ifrs-tx-2023-en-r&anchor=para_106_a&doctype=Standard
-URIDate 2023-03-23
| Name: |
ifrs-full_ComprehensiveIncomeAttributableToOwnersOfParent |
| Namespace Prefix: |
ifrs-full_ |
| Data Type: |
xbrli:monetaryItemType |
| Balance Type: |
credit |
| Period Type: |
duration |
|
| X |
- DefinitionThe gains (losses) recognised in other comprehensive income on exchange differences on the translation of financial statements of foreign operations, net of tax, before reclassification adjustments. [Refer: Other comprehensive income] Reference 1: http://www.xbrl.org/2003/role/disclosureRef
-Name IAS
-Number 1
-IssueDate 2023-01-01
-Paragraph 91
-Subparagraph a
-URI https://taxonomy.ifrs.org/xifrs-link?type=IAS&num=1&code=ifrs-tx-2023-en-r&anchor=para_91_a&doctype=Standard
-URIDate 2023-03-23
| Name: |
ifrs-full_GainsLossesOnExchangeDifferencesOnTranslationNetOfTax |
| Namespace Prefix: |
ifrs-full_ |
| Data Type: |
xbrli:monetaryItemType |
| Balance Type: |
credit |
| Period Type: |
duration |
|
| X |
- DefinitionThe amount of other comprehensive income attributable to non-controlling interests. [Refer: Non-controlling interests; Other comprehensive income] Reference 1: http://www.xbrl.org/2009/role/commonPracticeRef
-Name IAS
-Number 1
-IssueDate 2023-01-01
-Paragraph 85
-URI https://taxonomy.ifrs.org/xifrs-link?type=IAS&num=1&code=ifrs-tx-2023-en-r&anchor=para_85&doctype=Standard
-URIDate 2023-03-23
| Name: |
ifrs-full_OtherComprehensiveIncomeAttributableToNoncontrollingInterests |
| Namespace Prefix: |
ifrs-full_ |
| Data Type: |
xbrli:monetaryItemType |
| Balance Type: |
credit |
| Period Type: |
duration |
|
| X |
- DefinitionThe total of income less expenses from continuing and discontinued operations, excluding the components of other comprehensive income. [Refer: Other comprehensive income] Reference 1: http://www.xbrl.org/2003/role/disclosureRef
-Name IAS
-Number 7
-IssueDate 2023-01-01
-Paragraph 18
-Subparagraph b
-URI https://taxonomy.ifrs.org/xifrs-link?type=IAS&num=7&code=ifrs-tx-2023-en-r&anchor=para_18_b&doctype=Standard
-URIDate 2023-03-23
Reference 2: http://www.xbrl.org/2003/role/disclosureRef
-Name IFRS
-Number 1
-IssueDate 2023-01-01
-Paragraph 32
-Subparagraph a
-Clause ii
-URI https://taxonomy.ifrs.org/xifrs-link?type=IFRS&num=1&code=ifrs-tx-2023-en-r&anchor=para_32_a_ii&doctype=Standard
-URIDate 2023-03-23
Reference 3: http://www.xbrl.org/2003/role/disclosureRef
-Name IFRS
-Number 1
-IssueDate 2023-01-01
-Paragraph 24
-Subparagraph b
-URI https://taxonomy.ifrs.org/xifrs-link?type=IFRS&num=1&code=ifrs-tx-2023-en-r&anchor=para_24_b&doctype=Standard
-URIDate 2023-03-23
Reference 4: http://www.xbrl.org/2003/role/disclosureRef
-Name IFRS
-Number 8
-IssueDate 2023-01-01
-Paragraph 28
-Subparagraph b
-URI https://taxonomy.ifrs.org/xifrs-link?type=IFRS&num=8&code=ifrs-tx-2023-en-r&anchor=para_28_b&doctype=Standard
-URIDate 2023-03-23
Reference 5: http://www.xbrl.org/2003/role/disclosureRef
-Name IFRS
-Number 8
-IssueDate 2023-01-01
-Paragraph 23
-URI https://taxonomy.ifrs.org/xifrs-link?type=IFRS&num=8&code=ifrs-tx-2023-en-r&anchor=para_23&doctype=Standard
-URIDate 2023-03-23
Reference 6: http://www.xbrl.org/2003/role/exampleRef
-Name IFRS
-Number 12
-IssueDate 2023-01-01
-Paragraph B10
-Subparagraph b
-URI https://taxonomy.ifrs.org/xifrs-link?type=IFRS&num=12&code=ifrs-tx-2023-en-r&anchor=para_B10_b&doctype=Appendix&subtype=B
-URIDate 2023-03-23
Reference 7: http://www.xbrl.org/2003/role/exampleRef
-Name IFRS
-Number 17
-IssueDate 2023-01-01
-Paragraph 113
-Subparagraph b
-URI https://taxonomy.ifrs.org/xifrs-link?type=IFRS&num=17&code=ifrs-tx-2023-en-r&anchor=para_113_b&doctype=Standard
-URIDate 2023-03-23
Reference 8: http://www.xbrl.org/2003/role/disclosureRef
-Name IAS
-Number 1
-IssueDate 2023-01-01
-Paragraph 81A
-Subparagraph a
-URI https://taxonomy.ifrs.org/xifrs-link?type=IAS&num=1&code=ifrs-tx-2023-en-r&anchor=para_81A_a&doctype=Standard
-URIDate 2023-03-23
Reference 9: http://www.xbrl.org/2003/role/disclosureRef
-Name IAS
-Number 1
-IssueDate 2023-01-01
-Paragraph 106
-Subparagraph d
-Clause i
-URI https://taxonomy.ifrs.org/xifrs-link?type=IAS&num=1&code=ifrs-tx-2023-en-r&anchor=para_106_d_i&doctype=Standard
-URIDate 2023-03-23
| Name: |
ifrs-full_ProfitLoss |
| Namespace Prefix: |
ifrs-full_ |
| Data Type: |
xbrli:monetaryItemType |
| Balance Type: |
credit |
| Period Type: |
duration |
|
v3.23.3
Unaudited Interim Condensed Consolidated Statement of Changes in Equity (Deficit) - USD ($)
|
Number of Shares |
Subscription Receivable |
Additional Paid-in Capital |
Legal Reserve |
Warrants Reserves |
Accumulated Other Comprehensive Income |
Accumulated Deficit |
Non- controlling Interests |
Total |
| Balance at Dec. 31, 2021 |
$ 63,606
|
$ (50,000)
|
$ 15,379,595
|
$ 223,500
|
$ 251,036
|
$ 821,527
|
$ (10,204,220)
|
$ 39,935
|
$ 6,524,979
|
| Balance (in Shares) at Dec. 31, 2021 |
529,766
|
|
|
|
|
|
|
|
|
| Currency translation adjustments |
|
|
|
|
|
(197,909)
|
|
|
(197,909)
|
| Stock-based compensation expenses |
$ 840
|
|
251,255
|
|
|
|
|
|
252,095
|
| Stock-based compensation expenses (in Shares) |
7,000
|
|
|
|
|
|
|
|
|
| Cancellation of shares (Note 19) |
|
|
|
|
|
|
|
|
|
| Cancellation of shares (Note 19) (in Shares) |
(2)
|
|
|
|
|
|
|
|
|
| Issuance of ordinary shares through private placements |
$ 49,978
|
|
18,225,749
|
|
|
|
|
|
18,275,727
|
| Issuance of ordinary shares through private placements (in Shares) |
416,483
|
|
|
|
|
|
|
|
|
| Issuance of ordinary shares through exercise of warrants (Note 19) |
$ 3,285
|
|
1,420,404
|
|
|
|
|
|
1,423,689
|
| Issuance of ordinary shares through exercise of warrants (Note 19) (in Shares) |
27,377
|
|
|
|
|
|
|
|
|
| Issuance of ordinary shares for acquisition of subsidiaries |
$ 17,769
|
|
4,562,111
|
|
|
|
|
|
4,579,880
|
| Issuance of ordinary shares for acquisition of subsidiaries (in Shares) |
148,071
|
|
|
|
|
|
|
|
|
| Issuance of ordinary shares for deposit paid for acquisitions of subsidiaries |
$ 29,160
|
|
4,830,840
|
|
|
|
|
|
4,860,000
|
| Issuance of ordinary shares for deposit paid for acquisitions of subsidiaries (in Shares) |
243,000
|
|
|
|
|
|
|
|
|
| Net loss for the period |
|
|
|
|
|
|
(6,306,822)
|
(32,392)
|
(6,339,214)
|
| Balance at Jun. 30, 2022 |
$ 164,638
|
(50,000)
|
44,669,954
|
223,500
|
251,036
|
623,618
|
(16,511,042)
|
7,543
|
29,379,247
|
| Balance (in Shares) at Jun. 30, 2022 |
1,371,695
|
|
|
|
|
|
|
|
|
| Balance at Dec. 31, 2022 |
$ 194,313
|
(50,000)
|
46,231,302
|
223,500
|
251,036
|
1,112,494
|
(28,769,014)
|
(61,329)
|
$ 19,132,302
|
| Balance (in Shares) at Dec. 31, 2022 |
1,618,977
|
|
|
|
|
|
|
|
1,618,977
|
| Currency translation adjustments |
|
|
|
|
|
169,410
|
|
|
$ 169,410
|
| Cancellation of shares (Note 19) |
$ (29,441)
|
|
(4,880,223)
|
|
|
|
|
|
(4,909,664)
|
| Cancellation of shares (Note 19) (in Shares) |
(245,339)
|
|
|
|
|
|
|
|
|
| Issuance of ordinary shares through CMPOs (Note 19) |
$ 593,542
|
|
20,273,844
|
|
|
|
|
|
20,867,386
|
| Issuance of ordinary shares through CMPOs (Note 19) (in Shares) |
4,946,184
|
|
|
|
|
|
|
|
|
| Issuance of ordinary shares through exercise of warrants (Note 19) |
$ 15,468
|
|
491,224
|
|
|
|
|
|
506,692
|
| Issuance of ordinary shares through exercise of warrants (Note 19) (in Shares) |
128,901
|
|
|
|
|
|
|
|
|
| Issuance of ordinary shares for acquisition of assets (Note 19) |
$ 31,500
|
|
1,816,500
|
|
|
|
|
|
1,848,000
|
| Issuance of ordinary shares for acquisition of assets (Note 19) (in Shares) |
262,500
|
|
|
|
|
|
|
|
|
| Issuance of ordinary shares for a convertible note conversion (Note 19) |
$ 20,640
|
|
1,217,760
|
|
|
|
|
|
1,238,400
|
| Issuance of ordinary shares for a convertible note conversion (Note 19) (in Shares) |
172,000
|
|
|
|
|
|
|
|
|
| Net loss for the period |
|
|
|
|
|
|
(13,819,219)
|
(30,214)
|
(13,849,433)
|
| Balance at Jun. 30, 2023 |
$ 826,022
|
$ (50,000)
|
$ 65,150,407
|
$ 223,500
|
$ 251,036
|
$ 1,281,904
|
$ (42,588,233)
|
$ (91,543)
|
$ 25,003,093
|
| Balance (in Shares) at Jun. 30, 2023 |
6,883,223
|
|
|
|
|
|
|
|
6,883,223
|
| X |
- DefinitionThe number of cancellation of shares.
| Name: |
gfai_CancellationOfSharesNote |
| Namespace Prefix: |
gfai_ |
| Data Type: |
xbrli:sharesItemType |
| Balance Type: |
na |
| Period Type: |
duration |
|
| X |
- DefinitionThe amount of cancellation of shares.
| Name: |
gfai_CancellationOfSharesNote19 |
| Namespace Prefix: |
gfai_ |
| Data Type: |
xbrli:monetaryItemType |
| Balance Type: |
credit |
| Period Type: |
duration |
|
| X |
- DefinitionIssuance of ordinary shares for a convertible note conversion.
| Name: |
gfai_IssuanceOfOrdinarySharesForAConvertibleNoteConversionNote20inShares |
| Namespace Prefix: |
gfai_ |
| Data Type: |
xbrli:sharesItemType |
| Balance Type: |
na |
| Period Type: |
duration |
|
| X |
- References
+ Details
| Name: |
gfai_IssuanceOfOrdinarySharesForAcquisitionOfAISingapore |
| Namespace Prefix: |
gfai_ |
| Data Type: |
xbrli:monetaryItemType |
| Balance Type: |
credit |
| Period Type: |
duration |
|
| X |
- DefinitionIssuance of ordinary shares for acquisition of assets.
| Name: |
gfai_IssuanceOfOrdinarySharesForAcquisitionOfAssetsNote20inShares |
| Namespace Prefix: |
gfai_ |
| Data Type: |
xbrli:sharesItemType |
| Balance Type: |
na |
| Period Type: |
duration |
|
| X |
- DefinitionIssuance of ordinary shares for acquisition of subsidiaries.
| Name: |
gfai_IssuanceOfOrdinarySharesForAcquisitionOfSubsidiaries |
| Namespace Prefix: |
gfai_ |
| Data Type: |
xbrli:sharesItemType |
| Balance Type: |
na |
| Period Type: |
duration |
|
| X |
- DefinitionThis share issuance of ordinary shares for acquisition of subsidiaries.
| Name: |
gfai_IssuanceOfOrdinarySharesForAcquisitionOfSubsidiariesseeNote3 |
| Namespace Prefix: |
gfai_ |
| Data Type: |
xbrli:monetaryItemType |
| Balance Type: |
credit |
| Period Type: |
duration |
|
| X |
- DefinitionIssuance of ordinary shares for deposit paid for subsequently terminated acquisitions of subsidiaries.
| Name: |
gfai_IssuanceOfOrdinarySharesForDepositPaidForSubsequentlyTerminatedAcquisitionsOfSubsidiari |
| Namespace Prefix: |
gfai_ |
| Data Type: |
xbrli:monetaryItemType |
| Balance Type: |
na |
| Period Type: |
duration |
|
| X |
- DefinitionIssuance of ordinary shares for deposit paid for subsequently terminated acquisitions of subsidiaries subsequently terminated.
| Name: |
gfai_IssuanceOfOrdinarySharesForDepositPaidForSubsequentlyTerminatedAcquisitionsOfSubsidiaries |
| Namespace Prefix: |
gfai_ |
| Data Type: |
xbrli:sharesItemType |
| Balance Type: |
na |
| Period Type: |
duration |
|
| X |
- DefinitionIssuance of ordinary shares through exercise of warrants.
| Name: |
gfai_IssuanceOfOrdinarySharesThroughExerciseOfWarrants |
| Namespace Prefix: |
gfai_ |
| Data Type: |
xbrli:sharesItemType |
| Balance Type: |
na |
| Period Type: |
duration |
|
| X |
- References
+ Details
| Name: |
gfai_IssuanceOfOrdinarySharesThroughInitialPublicOfferingIPO |
| Namespace Prefix: |
gfai_ |
| Data Type: |
xbrli:monetaryItemType |
| Balance Type: |
credit |
| Period Type: |
duration |
|
| X |
- DefinitionIssuance of ordinary shares through private placements.
| Name: |
gfai_IssuanceOfOrdinarySharesThroughPrivatePlacements |
| Namespace Prefix: |
gfai_ |
| Data Type: |
xbrli:sharesItemType |
| Balance Type: |
na |
| Period Type: |
duration |
|
| X |
- DefinitionIssuance of ordinary shares through private placements.
| Name: |
gfai_IssuanceOfOrdinarySharesThroughPrivatePlacementsseeNote19 |
| Namespace Prefix: |
gfai_ |
| Data Type: |
xbrli:monetaryItemType |
| Balance Type: |
credit |
| Period Type: |
duration |
|
| X |
- References
+ Details
| Name: |
gfai_ShareIssuanceOfOrdinarySharesThroughInitialPublicOfferingIPO |
| Namespace Prefix: |
gfai_ |
| Data Type: |
xbrli:sharesItemType |
| Balance Type: |
na |
| Period Type: |
duration |
|
| X |
- DefinitionStock-based compensation expenses.
| Name: |
gfai_StockbasedCompensationExpense |
| Namespace Prefix: |
gfai_ |
| Data Type: |
xbrli:sharesItemType |
| Balance Type: |
na |
| Period Type: |
duration |
|
| X |
- DefinitionStock-based compensation expenses.
| Name: |
gfai_StockbasedCompensationExpenses |
| Namespace Prefix: |
gfai_ |
| Data Type: |
xbrli:monetaryItemType |
| Balance Type: |
debit |
| Period Type: |
duration |
|
| X |
- DefinitionThe amount of residual interest in the assets of the entity after deducting all its liabilities. Reference 1: http://www.xbrl.org/2003/role/disclosureRef
-Name IFRS
-Number 1
-IssueDate 2023-01-01
-Paragraph 24
-Subparagraph a
-URI https://taxonomy.ifrs.org/xifrs-link?type=IFRS&num=1&code=ifrs-tx-2023-en-r&anchor=para_24_a&doctype=Standard
-URIDate 2023-03-23
Reference 2: http://www.xbrl.org/2003/role/disclosureRef
-Name IFRS
-Number 1
-IssueDate 2023-01-01
-Paragraph 32
-Subparagraph a
-Clause i
-URI https://taxonomy.ifrs.org/xifrs-link?type=IFRS&num=1&code=ifrs-tx-2023-en-r&anchor=para_32_a_i&doctype=Standard
-URIDate 2023-03-23
Reference 3: http://www.xbrl.org/2003/role/disclosureRef
-Name IFRS
-Number 13
-IssueDate 2023-01-01
-Paragraph 93
-Subparagraph a
-URI https://taxonomy.ifrs.org/xifrs-link?type=IFRS&num=13&code=ifrs-tx-2023-en-r&anchor=para_93_a&doctype=Standard
-URIDate 2023-03-23
Reference 4: http://www.xbrl.org/2003/role/disclosureRef
-Name IFRS
-Number 13
-IssueDate 2023-01-01
-Paragraph 93
-Subparagraph b
-URI https://taxonomy.ifrs.org/xifrs-link?type=IFRS&num=13&code=ifrs-tx-2023-en-r&anchor=para_93_b&doctype=Standard
-URIDate 2023-03-23
Reference 5: http://www.xbrl.org/2003/role/disclosureRef
-Name IFRS
-Number 13
-IssueDate 2023-01-01
-Paragraph 93
-Subparagraph e
-URI https://taxonomy.ifrs.org/xifrs-link?type=IFRS&num=13&code=ifrs-tx-2023-en-r&anchor=para_93_e&doctype=Standard
-URIDate 2023-03-23
Reference 6: http://www.xbrl.org/2003/role/disclosureRef
-Name IAS
-Number 1
-IssueDate 2023-01-01
-Paragraph 55
-URI https://taxonomy.ifrs.org/xifrs-link?type=IAS&num=1&code=ifrs-tx-2023-en-r&anchor=para_55&doctype=Standard
-URIDate 2023-03-23
Reference 7: http://www.xbrl.org/2003/role/disclosureRef
-Name IAS
-Number 1
-IssueDate 2023-01-01
-Paragraph 78
-Subparagraph e
-URI https://taxonomy.ifrs.org/xifrs-link?type=IAS&num=1&code=ifrs-tx-2023-en-r&anchor=para_78_e&doctype=Standard
-URIDate 2023-03-23
| Name: |
ifrs-full_Equity |
| Namespace Prefix: |
ifrs-full_ |
| Data Type: |
xbrli:monetaryItemType |
| Balance Type: |
credit |
| Period Type: |
instant |
|
| X |
- DefinitionThe increase (decrease) in equity resulting from the exercise of warrants. Reference 1: http://www.xbrl.org/2009/role/commonPracticeRef
-Name IAS
-Number 1
-IssueDate 2023-01-01
-Paragraph 106
-Subparagraph d
-URI https://taxonomy.ifrs.org/xifrs-link?type=IAS&num=1&code=ifrs-tx-2023-en-r&anchor=para_106_d&doctype=Standard
-URIDate 2023-03-23
| Name: |
ifrs-full_IncreaseDecreaseThroughExerciseOfWarrantsEquity |
| Namespace Prefix: |
ifrs-full_ |
| Data Type: |
xbrli:monetaryItemType |
| Balance Type: |
credit |
| Period Type: |
duration |
|
| X |
- DefinitionThe increase in equity through the issue of equity instruments. Reference 1: http://www.xbrl.org/2003/role/disclosureRef
-Name IAS
-Number 1
-IssueDate 2023-01-01
-Paragraph 106
-Subparagraph d
-Clause iii
-URI https://taxonomy.ifrs.org/xifrs-link?type=IAS&num=1&code=ifrs-tx-2023-en-r&anchor=para_106_d_iii&doctype=Standard
-URIDate 2023-03-23
| Name: |
ifrs-full_IssueOfEquity |
| Namespace Prefix: |
ifrs-full_ |
| Data Type: |
xbrli:monetaryItemType |
| Balance Type: |
credit |
| Period Type: |
duration |
|
| X |
- DefinitionThe number of shares that have been authorised and issued, reduced by treasury shares held. [Refer: Treasury shares] Reference 1: http://www.xbrl.org/2003/role/disclosureRef
-Name IAS
-Number 1
-IssueDate 2023-01-01
-Paragraph 79
-Subparagraph a
-Clause iv
-URI https://taxonomy.ifrs.org/xifrs-link?type=IAS&num=1&code=ifrs-tx-2023-en-r&anchor=para_79_a_iv&doctype=Standard
-URIDate 2023-03-23
| Name: |
ifrs-full_NumberOfSharesOutstanding |
| Namespace Prefix: |
ifrs-full_ |
| Data Type: |
xbrli:sharesItemType |
| Balance Type: |
na |
| Period Type: |
instant |
|
| X |
- DefinitionThe total of income less expenses from continuing and discontinued operations, excluding the components of other comprehensive income. [Refer: Other comprehensive income] Reference 1: http://www.xbrl.org/2003/role/disclosureRef
-Name IAS
-Number 7
-IssueDate 2023-01-01
-Paragraph 18
-Subparagraph b
-URI https://taxonomy.ifrs.org/xifrs-link?type=IAS&num=7&code=ifrs-tx-2023-en-r&anchor=para_18_b&doctype=Standard
-URIDate 2023-03-23
Reference 2: http://www.xbrl.org/2003/role/disclosureRef
-Name IFRS
-Number 1
-IssueDate 2023-01-01
-Paragraph 32
-Subparagraph a
-Clause ii
-URI https://taxonomy.ifrs.org/xifrs-link?type=IFRS&num=1&code=ifrs-tx-2023-en-r&anchor=para_32_a_ii&doctype=Standard
-URIDate 2023-03-23
Reference 3: http://www.xbrl.org/2003/role/disclosureRef
-Name IFRS
-Number 1
-IssueDate 2023-01-01
-Paragraph 24
-Subparagraph b
-URI https://taxonomy.ifrs.org/xifrs-link?type=IFRS&num=1&code=ifrs-tx-2023-en-r&anchor=para_24_b&doctype=Standard
-URIDate 2023-03-23
Reference 4: http://www.xbrl.org/2003/role/disclosureRef
-Name IFRS
-Number 8
-IssueDate 2023-01-01
-Paragraph 28
-Subparagraph b
-URI https://taxonomy.ifrs.org/xifrs-link?type=IFRS&num=8&code=ifrs-tx-2023-en-r&anchor=para_28_b&doctype=Standard
-URIDate 2023-03-23
Reference 5: http://www.xbrl.org/2003/role/disclosureRef
-Name IFRS
-Number 8
-IssueDate 2023-01-01
-Paragraph 23
-URI https://taxonomy.ifrs.org/xifrs-link?type=IFRS&num=8&code=ifrs-tx-2023-en-r&anchor=para_23&doctype=Standard
-URIDate 2023-03-23
Reference 6: http://www.xbrl.org/2003/role/exampleRef
-Name IFRS
-Number 12
-IssueDate 2023-01-01
-Paragraph B10
-Subparagraph b
-URI https://taxonomy.ifrs.org/xifrs-link?type=IFRS&num=12&code=ifrs-tx-2023-en-r&anchor=para_B10_b&doctype=Appendix&subtype=B
-URIDate 2023-03-23
Reference 7: http://www.xbrl.org/2003/role/exampleRef
-Name IFRS
-Number 17
-IssueDate 2023-01-01
-Paragraph 113
-Subparagraph b
-URI https://taxonomy.ifrs.org/xifrs-link?type=IFRS&num=17&code=ifrs-tx-2023-en-r&anchor=para_113_b&doctype=Standard
-URIDate 2023-03-23
Reference 8: http://www.xbrl.org/2003/role/disclosureRef
-Name IAS
-Number 1
-IssueDate 2023-01-01
-Paragraph 81A
-Subparagraph a
-URI https://taxonomy.ifrs.org/xifrs-link?type=IAS&num=1&code=ifrs-tx-2023-en-r&anchor=para_81A_a&doctype=Standard
-URIDate 2023-03-23
Reference 9: http://www.xbrl.org/2003/role/disclosureRef
-Name IAS
-Number 1
-IssueDate 2023-01-01
-Paragraph 106
-Subparagraph d
-Clause i
-URI https://taxonomy.ifrs.org/xifrs-link?type=IAS&num=1&code=ifrs-tx-2023-en-r&anchor=para_106_d_i&doctype=Standard
-URIDate 2023-03-23
| Name: |
ifrs-full_ProfitLoss |
| Namespace Prefix: |
ifrs-full_ |
| Data Type: |
xbrli:monetaryItemType |
| Balance Type: |
credit |
| Period Type: |
duration |
|
| X |
- DefinitionThe amount of reclassification adjustments related to exchange differences when the financial statements of foreign operations are translated, net of tax. Reclassification adjustments are amounts reclassified to profit (loss) in the current period that were recognised in other comprehensive income in the current or previous periods. [Refer: Other comprehensive income] Reference 1: http://www.xbrl.org/2003/role/disclosureRef
-Name IAS
-Number 21
-IssueDate 2023-01-01
-Paragraph 48
-URI https://taxonomy.ifrs.org/xifrs-link?type=IAS&num=21&code=ifrs-tx-2023-en-r&anchor=para_48&doctype=Standard
-URIDate 2023-03-23
Reference 2: http://www.xbrl.org/2003/role/disclosureRef
-Name IAS
-Number 1
-IssueDate 2023-01-01
-Paragraph 92
-URI https://taxonomy.ifrs.org/xifrs-link?type=IAS&num=1&code=ifrs-tx-2023-en-r&anchor=para_92&doctype=Standard
-URIDate 2023-03-23
| Name: |
ifrs-full_ReclassificationAdjustmentsOnExchangeDifferencesOnTranslationNetOfTax |
| Namespace Prefix: |
ifrs-full_ |
| Data Type: |
xbrli:monetaryItemType |
| Balance Type: |
debit |
| Period Type: |
duration |
|
v3.23.3
Unaudited Interim Condensed Consolidated Statement of Cash Flows - USD ($)
|
6 Months Ended |
Jun. 30, 2023 |
Jun. 30, 2022 |
| Cash flows from operating activities |
|
|
| Net loss |
$ (13,849,433)
|
$ (6,339,214)
|
| Adjustments for: |
|
|
| Depreciation and Amortization of fixed and intangible assets |
2,619,001
|
2,697,378
|
| Stock-based compensation |
|
252,095
|
| Provision for and write off of withholding tax receivable |
561,277
|
263,340
|
| Provision for expected credit loss on trade and other receivables |
869,519
|
|
| Provision for obsolete inventories |
3,090,282
|
|
| Impairment loss on fixed assets |
1,591,766
|
|
| Impairment on goodwill |
1,263,040
|
|
| Finance costs |
584,897
|
506,818
|
| Loss from fixed assets disposal |
41,965
|
24,530
|
| Changes in operating assets and liabilities: |
|
|
| Decrease (Increase) in trade and other receivables |
157,279
|
(205,716)
|
| Increase in other assets |
(719,595)
|
(968,103)
|
| Decrease (Increase) in inventories |
296,824
|
(5,521,429)
|
| Decrease (Increase) in amounts due from/to related parties |
639,807
|
(6,111,443)
|
| Decrease (Increase) in deferred tax assets |
874,431
|
(325,083)
|
| Increase in Trade and other payables and other current liabilities |
1,285,317
|
1,265,752
|
| (Decrease) Increase in withholding tax receivable |
(374,013)
|
663,095
|
| Increase (Decrease) in provision for employee benefits |
20,774
|
(29,812)
|
| Net cash used in operating activities |
(1,046,862)
|
(13,827,792)
|
| Cash flows from investing activities |
|
|
| Acquisition of property, plant and equipment |
(829,231)
|
(2,309,334)
|
| Proceeds from sale of property, plant and equipment |
|
4,120
|
| Acquisition of intangible assets |
(217,077)
|
(3,082,880)
|
| Acquisition of subsidiaries, net of cash acquired |
|
(1,793,614)
|
| Deposits paid for business acquisitions |
|
(2,160,000)
|
| Net cash used in investing activities |
(1,046,308)
|
(9,341,708)
|
| Cash flows from financing activities |
|
|
| Proceeds from issue of shares |
20,867,386
|
18,275,728
|
| Proceeds from exercise of warrants |
506,693
|
1,423,690
|
| Cash paid for the cancellation of fractional shares |
(49,664)
|
|
| Proceeds from borrowings |
1,756,738
|
|
| Repayment of borrowings |
(1,937,096)
|
(840,762)
|
| Payment of lease liabilities |
(1,267,979)
|
(1,483,203)
|
| Net cash generated from financing activities |
19,876,078
|
17,375,453
|
| Net decrease in cash and cash equivalents, and restricted cash |
17,782,908
|
(5,794,047)
|
| Effect of movements in exchange rates on cash |
16,840
|
(519,523)
|
| Cash and cash equivalents, and restricted cash at January 1, |
8,230,644
|
15,853,811
|
| Cash and cash equivalents, and restricted cash at June 30, |
26,030,392
|
9,540,241
|
| Non-cash investing and financing activities |
|
|
| Equity portion of purchase consideration paid for acquisition of subsidiaries |
|
4,579,879
|
| Equity portion of purchase consideration paid for acquisition of assets (Note 19) |
$ 1,848,000
|
|
| X |
- DefinitionAdjustments for decrease (increase) in withholding tax receivable.
| Name: |
gfai_AdjustmentsForDecreaseIncreaseInWithholdingTaxReceivable |
| Namespace Prefix: |
gfai_ |
| Data Type: |
xbrli:monetaryItemType |
| Balance Type: |
debit |
| Period Type: |
duration |
|
| X |
- DefinitionAmount of cash acquired from acquisition of handshake.
| Name: |
gfai_CashAcquiredFromAcquisitionOfHandshake |
| Namespace Prefix: |
gfai_ |
| Data Type: |
xbrli:monetaryItemType |
| Balance Type: |
credit |
| Period Type: |
duration |
|
| X |
- DefinitionThe amount of cash and cash equivalents and restricted cash.
| Name: |
gfai_CashAndCashEquivalentsRestrictedCash |
| Namespace Prefix: |
gfai_ |
| Data Type: |
xbrli:monetaryItemType |
| Balance Type: |
debit |
| Period Type: |
instant |
|
| X |
- DefinitionAmount of deposits paid for business acquisitions.
| Name: |
gfai_DepositsPaidForBusinessAcquisitions |
| Namespace Prefix: |
gfai_ |
| Data Type: |
xbrli:monetaryItemType |
| Balance Type: |
credit |
| Period Type: |
duration |
|
| X |
- DefinitionAmount of equity portion of purchase consideration paid for acquisition of subsidiaries.
| Name: |
gfai_LeaseholdImprovementThroughFinanceLeases |
| Namespace Prefix: |
gfai_ |
| Data Type: |
xbrli:monetaryItemType |
| Balance Type: |
debit |
| Period Type: |
duration |
|
| X |
- DefinitionLeasehold improvements through finance leases.
| Name: |
gfai_LeaseholdImprovementsThroughFinanceLeases |
| Namespace Prefix: |
gfai_ |
| Data Type: |
xbrli:monetaryItemType |
| Balance Type: |
credit |
| Period Type: |
duration |
|
| X |
- References
+ Details
| Name: |
gfai_NonCashInvestingAndFinancingActivitiesAbstract |
| Namespace Prefix: |
gfai_ |
| Data Type: |
xbrli:stringItemType |
| Balance Type: |
na |
| Period Type: |
duration |
|
| X |
- DefinitionAmount of cash paid for the cancellation of fractional shares.
| Name: |
gfai_ProceedsFromCashPaidForTheCancellationOfFractionalShares |
| Namespace Prefix: |
gfai_ |
| Data Type: |
xbrli:monetaryItemType |
| Balance Type: |
credit |
| Period Type: |
duration |
|
| X |
- DefinitionProvision for expected credit loss on trade and other receivables.
| Name: |
gfai_ProvisionForExpectedCreditLossOnTradeAndOtherReceivable |
| Namespace Prefix: |
gfai_ |
| Data Type: |
xbrli:monetaryItemType |
| Balance Type: |
debit |
| Period Type: |
duration |
|
| X |
- DefinitionWrite off of withholding taxes receivable.
| Name: |
gfai_WriteOffOfWithholdingTaxesReceivable |
| Namespace Prefix: |
gfai_ |
| Data Type: |
xbrli:monetaryItemType |
| Balance Type: |
debit |
| Period Type: |
duration |
|
| X |
- DefinitionAdjustments for decrease (increase) in inventories to reconcile profit (loss) to net cash flow from (used in) operating activities. [Refer: Inventories; Profit (loss)] Reference 1: http://www.xbrl.org/2009/role/commonPracticeRef
-Name IAS
-Number 7
-IssueDate 2023-01-01
-Paragraph 20
-Subparagraph a
-URI https://taxonomy.ifrs.org/xifrs-link?type=IAS&num=7&code=ifrs-tx-2023-en-r&anchor=para_20_a&doctype=Standard
-URIDate 2023-03-23
| Name: |
ifrs-full_AdjustmentsForDecreaseIncreaseInInventories |
| Namespace Prefix: |
ifrs-full_ |
| Data Type: |
xbrli:monetaryItemType |
| Balance Type: |
debit |
| Period Type: |
duration |
|
| X |
- DefinitionAdjustments for decrease (increase) in other current assets to reconcile profit (loss) to net cash flow from (used in) operating activities. [Refer: Other current assets; Profit (loss)] Reference 1: http://www.xbrl.org/2009/role/commonPracticeRef
-Name IAS
-Number 7
-IssueDate 2023-01-01
-Paragraph 20
-URI https://taxonomy.ifrs.org/xifrs-link?type=IAS&num=7&code=ifrs-tx-2023-en-r&anchor=para_20&doctype=Standard
-URIDate 2023-03-23
| Name: |
ifrs-full_AdjustmentsForDecreaseIncreaseInOtherCurrentAssets |
| Namespace Prefix: |
ifrs-full_ |
| Data Type: |
xbrli:monetaryItemType |
| Balance Type: |
debit |
| Period Type: |
duration |
|
| X |
- DefinitionAdjustments for decrease (increase) in other operating receivables to reconcile profit (loss) to net cash flow from (used in) operating activities. [Refer: Profit (loss)] Reference 1: http://www.xbrl.org/2009/role/commonPracticeRef
-Name IAS
-Number 7
-IssueDate 2023-01-01
-Paragraph 20
-Subparagraph a
-URI https://taxonomy.ifrs.org/xifrs-link?type=IAS&num=7&code=ifrs-tx-2023-en-r&anchor=para_20_a&doctype=Standard
-URIDate 2023-03-23
| Name: |
ifrs-full_AdjustmentsForDecreaseIncreaseInOtherOperatingReceivables |
| Namespace Prefix: |
ifrs-full_ |
| Data Type: |
xbrli:monetaryItemType |
| Balance Type: |
debit |
| Period Type: |
duration |
|
| X |
- DefinitionAdjustments for deferred tax expense to reconcile profit (loss) to net cash flow from (used in) operating activities. [Refer: Deferred tax expense (income); Profit (loss)] Reference 1: http://www.xbrl.org/2009/role/commonPracticeRef
-Name IAS
-Number 7
-IssueDate 2023-01-01
-Paragraph 20
-URI https://taxonomy.ifrs.org/xifrs-link?type=IAS&num=7&code=ifrs-tx-2023-en-r&anchor=para_20&doctype=Standard
-URIDate 2023-03-23
| Name: |
ifrs-full_AdjustmentsForDeferredTaxExpense |
| Namespace Prefix: |
ifrs-full_ |
| Data Type: |
xbrli:monetaryItemType |
| Balance Type: |
debit |
| Period Type: |
duration |
|
| X |
- DefinitionAdjustments for finance costs to reconcile profit (loss) to net cash flow from (used in) operating activities. [Refer: Finance costs; Profit (loss)] Reference 1: http://www.xbrl.org/2009/role/commonPracticeRef
-Name IAS
-Number 7
-IssueDate 2023-01-01
-Paragraph 20
-Subparagraph c
-URI https://taxonomy.ifrs.org/xifrs-link?type=IAS&num=7&code=ifrs-tx-2023-en-r&anchor=para_20_c&doctype=Standard
-URIDate 2023-03-23
| Name: |
ifrs-full_AdjustmentsForFinanceCosts |
| Namespace Prefix: |
ifrs-full_ |
| Data Type: |
xbrli:monetaryItemType |
| Balance Type: |
debit |
| Period Type: |
duration |
|
| X |
- DefinitionAdjustments for gain (loss) on disposals of property, plant and equipment to reconcile profit (loss) to net cash flow from (used in) operating activities. [Refer: Profit (loss); Property, plant and equipment; Disposals, property, plant and equipment] Reference 1: http://www.xbrl.org/2009/role/commonPracticeRef
-Name IAS
-Number 7
-IssueDate 2023-01-01
-Paragraph 20
-URI https://taxonomy.ifrs.org/xifrs-link?type=IAS&num=7&code=ifrs-tx-2023-en-r&anchor=para_20&doctype=Standard
-URIDate 2023-03-23
| Name: |
ifrs-full_AdjustmentsForGainLossOnDisposalsPropertyPlantAndEquipment |
| Namespace Prefix: |
ifrs-full_ |
| Data Type: |
xbrli:monetaryItemType |
| Balance Type: |
credit |
| Period Type: |
duration |
|
| X |
- DefinitionAdjustments for increase (decrease) in employee benefit liabilities to reconcile profit (loss) to net cash flow from (used in) operating activities. [Refer: Profit (loss)] Reference 1: http://www.xbrl.org/2009/role/commonPracticeRef
-Name IAS
-Number 7
-IssueDate 2023-01-01
-Paragraph 20
-URI https://taxonomy.ifrs.org/xifrs-link?type=IAS&num=7&code=ifrs-tx-2023-en-r&anchor=para_20&doctype=Standard
-URIDate 2023-03-23
| Name: |
ifrs-full_AdjustmentsForIncreaseDecreaseInEmployeeBenefitLiabilities |
| Namespace Prefix: |
ifrs-full_ |
| Data Type: |
xbrli:monetaryItemType |
| Balance Type: |
debit |
| Period Type: |
duration |
|
| X |
- DefinitionAdjustments for increase (decrease) in trade and other payables to reconcile profit (loss) to net cash flow from (used in) operating activities. [Refer: Trade and other payables; Profit (loss)] Reference 1: http://www.xbrl.org/2009/role/commonPracticeRef
-Name IAS
-Number 7
-IssueDate 2023-01-01
-Paragraph 20
-URI https://taxonomy.ifrs.org/xifrs-link?type=IAS&num=7&code=ifrs-tx-2023-en-r&anchor=para_20&doctype=Standard
-URIDate 2023-03-23
| Name: |
ifrs-full_AdjustmentsForIncreaseDecreaseInTradeAndOtherPayables |
| Namespace Prefix: |
ifrs-full_ |
| Data Type: |
xbrli:monetaryItemType |
| Balance Type: |
debit |
| Period Type: |
duration |
|
| X |
- DefinitionAdjustments for provisions to reconcile profit (loss) to net cash flow from (used in) operating activities. [Refer: Provisions; Profit (loss)] Reference 1: http://www.xbrl.org/2009/role/commonPracticeRef
-Name IAS
-Number 7
-IssueDate 2023-01-01
-Paragraph 20
-Subparagraph b
-URI https://taxonomy.ifrs.org/xifrs-link?type=IAS&num=7&code=ifrs-tx-2023-en-r&anchor=para_20_b&doctype=Standard
-URIDate 2023-03-23
| Name: |
ifrs-full_AdjustmentsForProvisions |
| Namespace Prefix: |
ifrs-full_ |
| Data Type: |
xbrli:monetaryItemType |
| Balance Type: |
debit |
| Period Type: |
duration |
|
| X |
- References
+ Details
| Name: |
ifrs-full_AdjustmentsForReconcileProfitLossAbstract |
| Namespace Prefix: |
ifrs-full_ |
| Data Type: |
xbrli:stringItemType |
| Balance Type: |
na |
| Period Type: |
duration |
|
| X |
- DefinitionAdjustments for share-based payments to reconcile profit (loss) to net cash flow from (used in) operating activities. [Refer: Profit (loss)] Reference 1: http://www.xbrl.org/2009/role/commonPracticeRef
-Name IAS
-Number 7
-IssueDate 2023-01-01
-Paragraph 20
-Subparagraph b
-URI https://taxonomy.ifrs.org/xifrs-link?type=IAS&num=7&code=ifrs-tx-2023-en-r&anchor=para_20_b&doctype=Standard
-URIDate 2023-03-23
| Name: |
ifrs-full_AdjustmentsForSharebasedPayments |
| Namespace Prefix: |
ifrs-full_ |
| Data Type: |
xbrli:monetaryItemType |
| Balance Type: |
debit |
| Period Type: |
duration |
|
| X |
- DefinitionThe cash flows from (used in) financing activities, which are activities that result in changes in the size and composition of the contributed equity and borrowings of the entity. Reference 1: http://www.xbrl.org/2003/role/disclosureRef
-Name IAS
-Number 7
-IssueDate 2023-01-01
-Paragraph 10
-URI https://taxonomy.ifrs.org/xifrs-link?type=IAS&num=7&code=ifrs-tx-2023-en-r&anchor=para_10&doctype=Standard
-URIDate 2023-03-23
Reference 2: http://www.xbrl.org/2003/role/disclosureRef
-Name IAS
-Number 7
-IssueDate 2023-01-01
-Paragraph 50
-Subparagraph d
-URI https://taxonomy.ifrs.org/xifrs-link?type=IAS&num=7&code=ifrs-tx-2023-en-r&anchor=para_50_d&doctype=Standard
-URIDate 2023-03-23
| Name: |
ifrs-full_CashFlowsFromUsedInFinancingActivities |
| Namespace Prefix: |
ifrs-full_ |
| Data Type: |
xbrli:monetaryItemType |
| Balance Type: |
debit |
| Period Type: |
duration |
|
| X |
- References
+ Details
| Name: |
ifrs-full_CashFlowsFromUsedInFinancingActivitiesAbstract |
| Namespace Prefix: |
ifrs-full_ |
| Data Type: |
xbrli:stringItemType |
| Balance Type: |
na |
| Period Type: |
duration |
|
| X |
- DefinitionThe cash flows from (used in) investing activities, which are the acquisition and disposal of long-term assets and other investments not included in cash equivalents. Reference 1: http://www.xbrl.org/2003/role/disclosureRef
-Name IAS
-Number 7
-IssueDate 2023-01-01
-Paragraph 10
-URI https://taxonomy.ifrs.org/xifrs-link?type=IAS&num=7&code=ifrs-tx-2023-en-r&anchor=para_10&doctype=Standard
-URIDate 2023-03-23
Reference 2: http://www.xbrl.org/2003/role/disclosureRef
-Name IAS
-Number 7
-IssueDate 2023-01-01
-Paragraph 50
-Subparagraph d
-URI https://taxonomy.ifrs.org/xifrs-link?type=IAS&num=7&code=ifrs-tx-2023-en-r&anchor=para_50_d&doctype=Standard
-URIDate 2023-03-23
| Name: |
ifrs-full_CashFlowsFromUsedInInvestingActivities |
| Namespace Prefix: |
ifrs-full_ |
| Data Type: |
xbrli:monetaryItemType |
| Balance Type: |
debit |
| Period Type: |
duration |
|
| X |
- References
+ Details
| Name: |
ifrs-full_CashFlowsFromUsedInInvestingActivitiesAbstract |
| Namespace Prefix: |
ifrs-full_ |
| Data Type: |
xbrli:stringItemType |
| Balance Type: |
na |
| Period Type: |
duration |
|
| X |
- DefinitionThe cash flows from (used in) operating activities, which are the principal revenue-producing activities of the entity and other activities that are not investing or financing activities. [Refer: Revenue] Reference 1: http://www.xbrl.org/2003/role/disclosureRef
-Name IAS
-Number 7
-IssueDate 2023-01-01
-Paragraph 10
-URI https://taxonomy.ifrs.org/xifrs-link?type=IAS&num=7&code=ifrs-tx-2023-en-r&anchor=para_10&doctype=Standard
-URIDate 2023-03-23
Reference 2: http://www.xbrl.org/2003/role/disclosureRef
-Name IAS
-Number 7
-IssueDate 2023-01-01
-Paragraph 50
-Subparagraph d
-URI https://taxonomy.ifrs.org/xifrs-link?type=IAS&num=7&code=ifrs-tx-2023-en-r&anchor=para_50_d&doctype=Standard
-URIDate 2023-03-23
| Name: |
ifrs-full_CashFlowsFromUsedInOperatingActivities |
| Namespace Prefix: |
ifrs-full_ |
| Data Type: |
xbrli:monetaryItemType |
| Balance Type: |
na |
| Period Type: |
duration |
|
| X |
- References
+ Details
| Name: |
ifrs-full_CashFlowsFromUsedInOperatingActivitiesAbstract |
| Namespace Prefix: |
ifrs-full_ |
| Data Type: |
xbrli:stringItemType |
| Balance Type: |
na |
| Period Type: |
duration |
|
| X |
- References
+ Details
| Name: |
ifrs-full_ClassesOfCashPaymentsAbstract |
| Namespace Prefix: |
ifrs-full_ |
| Data Type: |
xbrli:stringItemType |
| Balance Type: |
na |
| Period Type: |
duration |
|
| X |
- DefinitionThe amount of depreciation and amortisation expense. Depreciation and amortisation are the systematic allocations of depreciable amounts of assets over their useful lives. Reference 1: http://www.xbrl.org/2003/role/disclosureRef
-Name IFRS
-Number 8
-IssueDate 2023-01-01
-Paragraph 28
-Subparagraph e
-URI https://taxonomy.ifrs.org/xifrs-link?type=IFRS&num=8&code=ifrs-tx-2023-en-r&anchor=para_28_e&doctype=Standard
-URIDate 2023-03-23
Reference 2: http://www.xbrl.org/2003/role/disclosureRef
-Name IFRS
-Number 8
-IssueDate 2023-01-01
-Paragraph 23
-Subparagraph e
-URI https://taxonomy.ifrs.org/xifrs-link?type=IFRS&num=8&code=ifrs-tx-2023-en-r&anchor=para_23_e&doctype=Standard
-URIDate 2023-03-23
Reference 3: http://www.xbrl.org/2003/role/disclosureRef
-Name IFRS
-Number 12
-IssueDate 2023-01-01
-Paragraph B13
-Subparagraph d
-URI https://taxonomy.ifrs.org/xifrs-link?type=IFRS&num=12&code=ifrs-tx-2023-en-r&anchor=para_B13_d&doctype=Appendix&subtype=B
-URIDate 2023-03-23
Reference 4: http://www.xbrl.org/2003/role/exampleRef
-Name IAS
-Number 1
-IssueDate 2023-01-01
-Paragraph 102
-URI https://taxonomy.ifrs.org/xifrs-link?type=IAS&num=1&code=ifrs-tx-2023-en-r&anchor=para_102&doctype=Standard
-URIDate 2023-03-23
Reference 5: http://www.xbrl.org/2003/role/disclosureRef
-Name IAS
-Number 1
-IssueDate 2023-01-01
-Paragraph 99
-URI https://taxonomy.ifrs.org/xifrs-link?type=IAS&num=1&code=ifrs-tx-2023-en-r&anchor=para_99&doctype=Standard
-URIDate 2023-03-23
Reference 6: http://www.xbrl.org/2003/role/disclosureRef
-Name IAS
-Number 1
-IssueDate 2023-01-01
-Paragraph 104
-URI https://taxonomy.ifrs.org/xifrs-link?type=IAS&num=1&code=ifrs-tx-2023-en-r&anchor=para_104&doctype=Standard
-URIDate 2023-03-23
| Name: |
ifrs-full_DepreciationAndAmortisationExpense |
| Namespace Prefix: |
ifrs-full_ |
| Data Type: |
xbrli:monetaryItemType |
| Balance Type: |
debit |
| Period Type: |
duration |
|
| X |
- DefinitionThe effect of exchange rate changes on cash and cash equivalents held or due in a foreign currency. [Refer: Cash and cash equivalents] Reference 1: http://www.xbrl.org/2003/role/disclosureRef
-Name IAS
-Number 7
-IssueDate 2023-01-01
-Paragraph 25
-URI https://taxonomy.ifrs.org/xifrs-link?type=IAS&num=7&code=ifrs-tx-2023-en-r&anchor=para_25&doctype=Standard
-URIDate 2023-03-23
Reference 2: http://www.xbrl.org/2003/role/disclosureRef
-Name IAS
-Number 7
-IssueDate 2023-01-01
-Paragraph 28
-URI https://taxonomy.ifrs.org/xifrs-link?type=IAS&num=7&code=ifrs-tx-2023-en-r&anchor=para_28&doctype=Standard
-URIDate 2023-03-23
| Name: |
ifrs-full_EffectOfExchangeRateChangesOnCashAndCashEquivalents |
| Namespace Prefix: |
ifrs-full_ |
| Data Type: |
xbrli:monetaryItemType |
| Balance Type: |
debit |
| Period Type: |
duration |
|
| X |
- DefinitionThe amount of impairment loss, impairment gain or reversal of impairment loss that is recognised in profit or loss in accordance with paragraph 5.5.8 of IFRS 9 and that arises from applying the impairment requirements in Section 5.5 of IFRS 9. Reference 1: http://www.xbrl.org/2003/role/disclosureRef
-Name IAS
-Number 1
-IssueDate 2023-01-01
-Paragraph 82
-Subparagraph ba
-URI https://taxonomy.ifrs.org/xifrs-link?type=IAS&num=1&code=ifrs-tx-2023-en-r&anchor=para_82_ba&doctype=Standard
-URIDate 2023-03-23
| Name: |
ifrs-full_ImpairmentLossImpairmentGainAndReversalOfImpairmentLossDeterminedInAccordanceWithIFRS9 |
| Namespace Prefix: |
ifrs-full_ |
| Data Type: |
xbrli:monetaryItemType |
| Balance Type: |
debit |
| Period Type: |
duration |
|
| X |
- DefinitionThe increase (decrease) in cash and cash equivalents after the effect of exchange rate changes on cash and cash equivalents held in foreign currencies. [Refer: Cash and cash equivalents; Effect of exchange rate changes on cash and cash equivalents] Reference 1: http://www.xbrl.org/2003/role/disclosureRef
-Name IAS
-Number 7
-IssueDate 2023-01-01
-Paragraph 45
-URI https://taxonomy.ifrs.org/xifrs-link?type=IAS&num=7&code=ifrs-tx-2023-en-r&anchor=para_45&doctype=Standard
-URIDate 2023-03-23
| Name: |
ifrs-full_IncreaseDecreaseInCashAndCashEquivalents |
| Namespace Prefix: |
ifrs-full_ |
| Data Type: |
xbrli:monetaryItemType |
| Balance Type: |
debit |
| Period Type: |
duration |
|
| X |
- DefinitionThe cash outflow for payment of lease liabilities, classified as financing activities. [Refer: Lease liabilities] Reference 1: http://www.xbrl.org/2003/role/exampleRef
-Name IAS
-Number 7
-IssueDate 2023-01-01
-Paragraph 17
-Subparagraph e
-URI https://taxonomy.ifrs.org/xifrs-link?type=IAS&num=7&code=ifrs-tx-2023-en-r&anchor=para_17_e&doctype=Standard
-URIDate 2023-03-23
| Name: |
ifrs-full_PaymentsOfLeaseLiabilitiesClassifiedAsFinancingActivities |
| Namespace Prefix: |
ifrs-full_ |
| Data Type: |
xbrli:monetaryItemType |
| Balance Type: |
credit |
| Period Type: |
duration |
|
| X |
- DefinitionThe cash inflow from borrowings obtained. [Refer: Borrowings] Reference 1: http://www.xbrl.org/2003/role/exampleRef
-Name IAS
-Number 7
-IssueDate 2023-01-01
-Paragraph 17
-Subparagraph c
-URI https://taxonomy.ifrs.org/xifrs-link?type=IAS&num=7&code=ifrs-tx-2023-en-r&anchor=para_17_c&doctype=Standard
-URIDate 2023-03-23
| Name: |
ifrs-full_ProceedsFromBorrowingsClassifiedAsFinancingActivities |
| Namespace Prefix: |
ifrs-full_ |
| Data Type: |
xbrli:monetaryItemType |
| Balance Type: |
debit |
| Period Type: |
duration |
|
| X |
- DefinitionThe cash inflow from the exercise of share purchase warrants. Reference 1: http://www.xbrl.org/2009/role/commonPracticeRef
-Name IAS
-Number 7
-IssueDate 2023-01-01
-Paragraph 17
-URI https://taxonomy.ifrs.org/xifrs-link?type=IAS&num=7&code=ifrs-tx-2023-en-r&anchor=para_17&doctype=Standard
-URIDate 2023-03-23
| Name: |
ifrs-full_ProceedsFromExerciseOfWarrants |
| Namespace Prefix: |
ifrs-full_ |
| Data Type: |
xbrli:monetaryItemType |
| Balance Type: |
debit |
| Period Type: |
duration |
|
| X |
- DefinitionThe cash inflow from issuing shares. Reference 1: http://www.xbrl.org/2003/role/exampleRef
-Name IAS
-Number 7
-IssueDate 2023-01-01
-Paragraph 17
-Subparagraph a
-URI https://taxonomy.ifrs.org/xifrs-link?type=IAS&num=7&code=ifrs-tx-2023-en-r&anchor=para_17_a&doctype=Standard
-URIDate 2023-03-23
| Name: |
ifrs-full_ProceedsFromIssuingShares |
| Namespace Prefix: |
ifrs-full_ |
| Data Type: |
xbrli:monetaryItemType |
| Balance Type: |
debit |
| Period Type: |
duration |
|
| X |
- DefinitionThe cash inflow from sales of property, plant and equipment, classified as investing activities. [Refer: Property, plant and equipment] Reference 1: http://www.xbrl.org/2003/role/exampleRef
-Name IAS
-Number 7
-IssueDate 2023-01-01
-Paragraph 16
-Subparagraph b
-URI https://taxonomy.ifrs.org/xifrs-link?type=IAS&num=7&code=ifrs-tx-2023-en-r&anchor=para_16_b&doctype=Standard
-URIDate 2023-03-23
| Name: |
ifrs-full_ProceedsFromSalesOfPropertyPlantAndEquipmentClassifiedAsInvestingActivities |
| Namespace Prefix: |
ifrs-full_ |
| Data Type: |
xbrli:monetaryItemType |
| Balance Type: |
debit |
| Period Type: |
duration |
|
| X |
- DefinitionThe total of income less expenses from continuing and discontinued operations, excluding the components of other comprehensive income. [Refer: Other comprehensive income] Reference 1: http://www.xbrl.org/2003/role/disclosureRef
-Name IAS
-Number 7
-IssueDate 2023-01-01
-Paragraph 18
-Subparagraph b
-URI https://taxonomy.ifrs.org/xifrs-link?type=IAS&num=7&code=ifrs-tx-2023-en-r&anchor=para_18_b&doctype=Standard
-URIDate 2023-03-23
Reference 2: http://www.xbrl.org/2003/role/disclosureRef
-Name IFRS
-Number 1
-IssueDate 2023-01-01
-Paragraph 32
-Subparagraph a
-Clause ii
-URI https://taxonomy.ifrs.org/xifrs-link?type=IFRS&num=1&code=ifrs-tx-2023-en-r&anchor=para_32_a_ii&doctype=Standard
-URIDate 2023-03-23
Reference 3: http://www.xbrl.org/2003/role/disclosureRef
-Name IFRS
-Number 1
-IssueDate 2023-01-01
-Paragraph 24
-Subparagraph b
-URI https://taxonomy.ifrs.org/xifrs-link?type=IFRS&num=1&code=ifrs-tx-2023-en-r&anchor=para_24_b&doctype=Standard
-URIDate 2023-03-23
Reference 4: http://www.xbrl.org/2003/role/disclosureRef
-Name IFRS
-Number 8
-IssueDate 2023-01-01
-Paragraph 28
-Subparagraph b
-URI https://taxonomy.ifrs.org/xifrs-link?type=IFRS&num=8&code=ifrs-tx-2023-en-r&anchor=para_28_b&doctype=Standard
-URIDate 2023-03-23
Reference 5: http://www.xbrl.org/2003/role/disclosureRef
-Name IFRS
-Number 8
-IssueDate 2023-01-01
-Paragraph 23
-URI https://taxonomy.ifrs.org/xifrs-link?type=IFRS&num=8&code=ifrs-tx-2023-en-r&anchor=para_23&doctype=Standard
-URIDate 2023-03-23
Reference 6: http://www.xbrl.org/2003/role/exampleRef
-Name IFRS
-Number 12
-IssueDate 2023-01-01
-Paragraph B10
-Subparagraph b
-URI https://taxonomy.ifrs.org/xifrs-link?type=IFRS&num=12&code=ifrs-tx-2023-en-r&anchor=para_B10_b&doctype=Appendix&subtype=B
-URIDate 2023-03-23
Reference 7: http://www.xbrl.org/2003/role/exampleRef
-Name IFRS
-Number 17
-IssueDate 2023-01-01
-Paragraph 113
-Subparagraph b
-URI https://taxonomy.ifrs.org/xifrs-link?type=IFRS&num=17&code=ifrs-tx-2023-en-r&anchor=para_113_b&doctype=Standard
-URIDate 2023-03-23
Reference 8: http://www.xbrl.org/2003/role/disclosureRef
-Name IAS
-Number 1
-IssueDate 2023-01-01
-Paragraph 81A
-Subparagraph a
-URI https://taxonomy.ifrs.org/xifrs-link?type=IAS&num=1&code=ifrs-tx-2023-en-r&anchor=para_81A_a&doctype=Standard
-URIDate 2023-03-23
Reference 9: http://www.xbrl.org/2003/role/disclosureRef
-Name IAS
-Number 1
-IssueDate 2023-01-01
-Paragraph 106
-Subparagraph d
-Clause i
-URI https://taxonomy.ifrs.org/xifrs-link?type=IAS&num=1&code=ifrs-tx-2023-en-r&anchor=para_106_d_i&doctype=Standard
-URIDate 2023-03-23
| Name: |
ifrs-full_ProfitLoss |
| Namespace Prefix: |
ifrs-full_ |
| Data Type: |
xbrli:monetaryItemType |
| Balance Type: |
credit |
| Period Type: |
duration |
|
| X |
- DefinitionThe cash outflow for the purchases of intangible assets, classified as investing activities. [Refer: Intangible assets other than goodwill] Reference 1: http://www.xbrl.org/2003/role/exampleRef
-Name IAS
-Number 7
-IssueDate 2023-01-01
-Paragraph 16
-Subparagraph a
-URI https://taxonomy.ifrs.org/xifrs-link?type=IAS&num=7&code=ifrs-tx-2023-en-r&anchor=para_16_a&doctype=Standard
-URIDate 2023-03-23
| Name: |
ifrs-full_PurchaseOfIntangibleAssetsClassifiedAsInvestingActivities |
| Namespace Prefix: |
ifrs-full_ |
| Data Type: |
xbrli:monetaryItemType |
| Balance Type: |
credit |
| Period Type: |
duration |
|
| X |
- DefinitionThe cash outflow for the purchases of property, plant and equipment, classified as investing activities. [Refer: Property, plant and equipment] Reference 1: http://www.xbrl.org/2003/role/exampleRef
-Name IAS
-Number 7
-IssueDate 2023-01-01
-Paragraph 16
-Subparagraph a
-URI https://taxonomy.ifrs.org/xifrs-link?type=IAS&num=7&code=ifrs-tx-2023-en-r&anchor=para_16_a&doctype=Standard
-URIDate 2023-03-23
| Name: |
ifrs-full_PurchaseOfPropertyPlantAndEquipmentClassifiedAsInvestingActivities |
| Namespace Prefix: |
ifrs-full_ |
| Data Type: |
xbrli:monetaryItemType |
| Balance Type: |
credit |
| Period Type: |
duration |
|
| X |
- DefinitionThe cash outflow to settle borrowings, classified as financing activities. [Refer: Borrowings] Reference 1: http://www.xbrl.org/2003/role/exampleRef
-Name IAS
-Number 7
-IssueDate 2023-01-01
-Paragraph 17
-Subparagraph d
-URI https://taxonomy.ifrs.org/xifrs-link?type=IAS&num=7&code=ifrs-tx-2023-en-r&anchor=para_17_d&doctype=Standard
-URIDate 2023-03-23
| Name: |
ifrs-full_RepaymentsOfBorrowingsClassifiedAsFinancingActivities |
| Namespace Prefix: |
ifrs-full_ |
| Data Type: |
xbrli:monetaryItemType |
| Balance Type: |
credit |
| Period Type: |
duration |
|
v3.23.3
Nature of Operations
|
6 Months Ended |
Jun. 30, 2023 |
|---|
| Nature of Operations [Abstract] |
|
| NATURE OF OPERATIONS |
Guardforce AI Co., Limited (“Guardforce”)
is a company incorporated and domiciled in the Cayman Islands under the Cayman Islands Companies Act on April 20, 2018. The Company’s
ordinary shares and warrants are listed under the symbol “GFAI” and “GFAIW”, respectively, on the Nasdaq Capital
Market upon the completion of an initial public offering on September 28, 2021.
Guardforce AI Holding Limited (“AI
Holdings”) was incorporated in the British Virgin Islands under the BVI Business Companies Act, 2004, on May 22, 2018. AI Holdings
is a 100% owned subsidiary of Guardforce. AI Holdings is an investment holding company.
Guardforce AI Robots Limited (“AI
Robots”) was incorporated in the British Virgin Islands under the BVI Business Companies Act, 2004, on May 22, 2018. AI Robots is
a 100% owned subsidiary of Guardforce. AI Robots is an investment holding company.
Guardforce AI (Hong Kong) Co., Limited
(“AI Hong Kong”) was incorporated in Hong Kong under the Hong Kong Companies’ Ordinance (Chapter 622), on May 30, 2018.
AI Hong Kong is a 100% owned subsidiary of Guardforce. Beginning March 2020, AI Hong Kong commenced robotic AI solution business of selling
and leasing robots.
Southern Ambition Limited (“Southern
Ambition”) was incorporated in the British Virgin Islands under the BVI Business Companies Act, 2004, on August 3, 2018. Southern
Ambition is a 100% owned subsidiary of AI Robots. Southern Ambition is an investment holding company.
Horizon Dragon Limited (“Horizon
Dragon”) was incorporated in the British Virgin Islands under the BVI Business Companies Act, 2004, on July 3, 2018. Horizon Dragon
is a 100% owned subsidiary of AI Holdings. Horizon Dragon is an investment holding company.
Guardforce AI Group Co., Limited (“AI
Thailand”) was incorporated in Thailand under the Civil and Commercial Code at the Registry of partnerships and Companies, Bangkok
Metropolis, Thailand, on September 21, 2018 and has 100,000 ordinary plus preferred shares outstanding. 48,999 of the shares in AI Thailand
are owned by Southern Ambition Limited, with one share being held by Horizon Dragon Limited, for an aggregate of 49,000 ordinary shares,
or 49%, and 51,000 cumulative preferred shares are owned by two individuals of Thailand. The two individuals owned in aggregate 49,000
ordinary shares with a value of approximately $16,000. The cumulative preferred shares are entitled to dividends of USD$0.03 per share
when declared. The cumulative unpaid dividends of the preferred shares as of June 30, 2023 and December 31, 2022 is approximately $1,700.
Pursuant to article of associates of AI Thailand, the holder of an ordinary share may cast one vote per share at a general meeting of
shareholders, the holder of preferred shares may cast one vote for every 20 preferred shares held at a general meeting of shareholders.
Southern Ambition is entitled to cast more than 95% of the votes at a general meeting of shareholders. No dividends were declared for
the six months ended June 30, 2023 and 2022.
Guardforce Cash Solutions Security Thailand
Co., Limited (“GF Cash (CIT)”) was incorporated in Thailand under the Civil and Commercial Code at the Registry of partnerships
and Companies, Bangkok Metropolis, Thailand, on July 27, 1982 and has 3,857,144 outstanding shares. 3,799,544 ordinary shares and 21,599
preferred shares of the outstanding shares in GF Cash (CIT) (approximately 99.07% of the shares in GF Cash (CIT)) are owned by AI Thailand
with one preferred share being held by Southern Ambition and 33,600 ordinary shares and 2,400 preferred shares (approximately 0.933% of
the shares in GF Cash (CIT)) being held by Bangkok Bank Public Company Limited. Pursuant to the articles of association a shareholder
may cast one vote per one share at a general meeting of shareholders. AI Thailand is entitled to cast 99.07% of the votes at a general
meeting of shareholders. No dividends were declared for the six months ended June 30, 2023 and 2022. The Company engages principally in
providing cash management and handling services located in Thailand. On March 25, 2021, the Company acquired
51% majority stake in information security consultants Handshake Networking Ltd (“Handshake”), a Hong Kong-based company
specializing in penetration testing and forensics analysis in Hong Kong and the Asia Pacific region since 2004.
On November 1, 2021, the Company entered
into a Transfer Agreement (the “Singapore Agreement”) to acquire 100% of the equity interests in Guardforce AI Singapore Pte.
Ltd. (“AI Singapore”), a company incorporated in Singapore. Pursuant to the Agreement, AI Singapore became a wholly owned
subsidiary of the Company. AI Singapore commenced robotic AI solution business of selling and leasing robots.
On November 18, 2021, the Company entered
into a Transfer Agreement (the “Macau Agreement”) to acquire 100% of the equity interests in Macau GF Robotics Limited,
a company incorporated in Macau (“AI Macau”). The consideration is approximately $3,205 (MOP25,000). AI Macau commenced robotic
AI solution business of selling and leasing robots. The acquisition was closed on February 9, 2022. AI Macau is a 100% owned subsidiary
of AI Robotics.
On November 18, 2021, the Company entered
into another Transfer Agreement (the “Malaysia Agreement”) to acquire 100% of the equity interests in GF Robotics
Malaysia Sdn. Bhd., a company incorporated in Malaysia (“AI Malaysia”). The consideration is approximately $1 (RM1). AI Malaysia
commenced robotic AI solution business of selling and leasing robots. The acquisition was closed on January 20, 2022. AI Malaysia is a
100% owned subsidiary of AI Robotics.
GFAI Robotics Group Co., Limited (“AI
Robotics”) was incorporated in the British Virgin Islands under the BVI Business Companies Act, 2004, on December 6, 2021. AI Robotics
is a 100% owned subsidiary of Guardforce. AI Robotics is an investment holding company.
GFAI Robot Service (Hong Kong) Limited
(“AI Robot Service”) was incorporated in Hong Kong under the Hong Kong Companies’ Ordinance (Chapter 622), on January
18, 2022. AI Robot Service is an investment holding company. AI Robot Service is a 100% owned subsidiary of AI Robotics.
Guardforce AI Robot Service (Shenzhen)
Co., Limited (“AI Shenzhen”) was incorporated in the People’s Republic of China (“PRC”) on February 23,
2022. AI Shenzhen is an investment holding company. AI Shenzhen is a 100% owned subsidiary of AI Robot Service.
GFAI Robotics Services LLC (“AI
US”) was incorporated in the State of Delaware on February 28, 2022. AI US commenced robotic AI solution business of selling and
leasing robots. AI US is a 100% owned subsidiary of AI Robotics.
GFAI Robot Service (Australia) Pty Ltd.
(“AI Australia”) was incorporated in Australia on February 28, 2022. AI Australia commenced robotic AI solution business of
selling and leasing robots. AI Australia is a 100% owned subsidiary of AI Robot Service.
GFAI Robot & Smart Machines Trading
LLC (“AI Dubai”) was incorporated in the United Arab Emirates (UAE) on March 13, 2022. AI Dubai commenced robotic AI
solution business of selling and leasing robots. AI Dubai is a 100% owned subsidiary of AI Robot Service.
GFAI Robotic and Innovation Solution
(Thailand) Company Limited (“AI R&I”) was incorporated in Thailand on March 30, 2022. AI R&I commenced robotic AI
solution business of selling and leasing robots. AI R&I is 98% owned by AI Thailand, 1% owned by Horizon Dragon and 1% owned by Southern
Ambition.
GFAI Robot Service (UK) Limited (“AI
UK”) was incorporated in the United Kingdom on April 29, 2022. AI UK commenced robotic AI solution business of selling and leasing
robots. AI UK is a 100% owned subsidiary of AI Robot Service. GFAI Robot Service Limited (“AI
Canada”) was incorporated in Canada on May 6, 2022. AI Canada commenced robotic AI solution business of selling and leasing robots.
AI Canada is a 100% owned subsidiary of AI Robot Service.
Guardforce AI Robot (Jian) Co., Limited
(“AI Jian”) was incorporated in the People’s Republic of China (“PRC”) on May 16, 2022. AI Jian is an investment
holding company. AI Jian is a 100% owned subsidiary of AI Robot Service.
GFAI Robot Service GK (“AI Japan”)
was incorporated in Japan on May 24, 2022. AI Japan commenced robotic AI solution business of selling and leasing robots. AI Japan is
a 100% owned subsidiary of AI Hong Kong.
GFAI Robot Service Co., Ltd. (“AI
Korea”) was incorporated in South Korea on June 17, 2022. AI Korea commenced robotic AI solution business of selling and leasing
robots. AI Korea is a 100% owned subsidiary of AI Hong Kong.
On March 11, 2022, the Company entered
into a Sale and Purchase Agreement (the “Kewei Agreement”) with Shenzhen Kewei Robot Technology Co., Limited (“Shenzhen
Kewei”) to acquire 100% of the equity interests in Shenzhen Keweien Robot Service Co., Ltd. (“Shenzhen GFAI”) and Guangzhou
Kewei Robot Technology Co., Ltd. (“Guangzhou GFAI”) from Shenzhen Kewei. Both acquirees are PRC-based companies. The
acquisition serves an integral role in the growth of the Company’s robotic AI solution business as a service (RaaS) business initiative.
The acquisition was closed on March 22, 2022. The acquisition purchase price of $10,000,000 was paid in a mix of cash (10%) and restricted
ordinary shares of the Company (90%). On March 14, 2022, the Company issued 53,571 (post-consolidation) restricted Ordinary Shares to
the sellers’ designated parties.
On May 24, 2022, the Company entered
into a Sale and Purchase Agreement (the “Yeantec Agreement”) with Shenzhen Yeantec Co., Limited (“Yeantec”) to
acquire 100% of the equity interests in Beijing Wanjia Security System Co., Ltd. (“Beijing Wanjia”) from Yeantec. Beijing
Wanjia is a PRC-based company with more than 25 years of experience in providing integrated security solution, focusing on fire alarm
security systems, and a well-established customer base among retail businesses. The acquisition serves the growth of the Company’s
other security business. The acquisition was closed on June 22, 2022. The acquisition purchase price of $8,400,000 was paid in a mix of
cash (10%) and restricted ordinary shares of the Company (90%). On June 16, 2022, the Company issued 94,500 (post-consolidation) restricted
Ordinary Shares to the sellers’ designated parties.
GFAI Robot Service (Vietnam) Co.,
Ltd (“AI Vietnam”) was incorporated in Vietnam on July 8, 2022. AI Vietnam is a dormant company and is a 100% owned subsidiary
of AI Hong Kong. On March 22, 2023, the Company deregistered AI Vietnam.
On December 21, 2022, the Company entered
into an asset purchase agreement (“Agreement”) with Shenzhen Kewei Robot Technology Co., Limited (“Shenzhen Kewei”)
to purchase certain of Shenzhen Kewei’s robot-related business assets in China. The Company will acquire, and Yeantec will transfer
to the Company, select robotic equipment assets and Kewei’s technology platform. The purchase price for these assets is $2,100,000,
which will be fully paid in the form of 262,500 (post-consolidation) restricted ordinary shares of the Company based on a price of $8.0
(post-consolidation) per share. The Company issued 262,500 shares to Shenzhen Kewei on March 1, 2023. The following diagram illustrates the
Company’s legal entity ownership structure as of June 30, 2023:
|
| X |
- References
+ Details
| Name: |
gfai_NatureOfOperationsAbstract |
| Namespace Prefix: |
gfai_ |
| Data Type: |
xbrli:stringItemType |
| Balance Type: |
na |
| Period Type: |
duration |
|
| X |
- DefinitionThe disclosure of expenses by nature. [Refer: Expenses, by nature] Reference 1: http://www.xbrl.org/2009/role/commonPracticeRef
-Name IAS
-Number 1
-IssueDate 2023-01-01
-Paragraph 10
-Subparagraph e
-URI https://taxonomy.ifrs.org/xifrs-link?type=IAS&num=1&code=ifrs-tx-2023-en-r&anchor=para_10_e&doctype=Standard
-URIDate 2023-03-23
| Name: |
ifrs-full_DisclosureOfExpensesByNatureExplanatory |
| Namespace Prefix: |
ifrs-full_ |
| Data Type: |
dtr-types:textBlockItemType |
| Balance Type: |
na |
| Period Type: |
duration |
|
v3.23.3
Significant Accounting Policies
|
6 Months Ended |
Jun. 30, 2023 |
|---|
| Disclosure of Significant Accounting Policies [Abstract] |
|
| SIGNIFICANT ACCOUNTING POLICIES |
| 2. |
SIGNIFICANT ACCOUNTING POLICIES |
The accounting policies applied for the
six months ended June 30, 2023 and 2022 are consistent with those of the audited consolidated financial statements for the years ended
December 31, 2022, 2021 and 2020, as described in those audited consolidated financial statements, except for the adoption of new and
amended International Financial Reporting Standards (“IFRS”) effective for the year ending December 31, 2022 which are relevant
to the preparation of the June 30, 2023 and 2022 interim condensed consolidated financial statements.
On
September 25, 2023, the interim condensed consolidated financial statements were approved by the board of directors and authorized for
issuance.
| 2.1 | Basis of presentation |
The accompanying interim condensed consolidated
financial statements have been prepared in accordance with International Accounting Standard (“IAS”) 34, “Interim Financial
Reporting”. These statements should be read in conjunction with the audited consolidated financial statements for the years ended
December 31, 2022, 2021 and 2020, which have been prepared in accordance with International Financial Reporting Standards (“IFRS”)
as issued by the International Accounting Standards Board (“IASB”). The interim condensed consolidated financial statements
have been prepared on a historical cost basis. In the opinion of management, all adjustments necessary for a fair presentation have
been included in the accompanying unaudited condensed consolidated financial statements. The results of operations for the six months
ended June 30, 2023 are not necessarily indicative of the results that may be expected for the full year ended December 31, 2023.
All amounts are presented in United States
dollars (“USD”) and have been rounded to the nearest USD.
In addition, the accompanying condensed
consolidated interim financial statements are presented on the basis that the Company is a going concern. The going concern assumption
contemplates the realization of assets and the satisfaction of liabilities in the normal course of business. The Company’s operating losses
and net current liability position may raise substantial doubt on the Company’s ability to continue as a going concern.
In assessing the going concern, management
and the Board has considered:
| | - | As of June 30, 2023, the current and non-current portion of loan outstanding with WK Venture Success Limited (“WK Venture”) were approximately $2.5 million and $13.6 million, respectively, which will be due on December 31, 2024 (Note 14). On September 28, 2023, WK Venture agreed to convert the principal and accrued interest of this loan in an aggregate amount of $15,914,615 at the conversion price of $5.40 into restricted ordinary shares of the Company. Thus, the loan with WK Venture has no impact on the Company’s liquidity and on the Company’s ability to meet its short-term financial obligations. |
| - | As of June 30, 2023, the Company has a convertible note payable of $606,786 with Streeterville Capital,
LLC ( “CVP”), which will be due on October 24, 2023 (Note 15). Management believes this convertible note payable will be settled
before the maturity date, either CVP will convert the outstanding balance into restricted ordinary shares or the Company will repay the
amount owed in cash. |
| - | Based on the budget and financial plans of the Company, management is satisfied that the receipt of an
aggregate of approximately $21.0 million, after deducting underwriting discounts and other offering expenses from the two underwritten
public offering proceeds (Note 19) has provided the Company adequate financial resources to continue in operational existence for the
foreseeable future, a period of at least 12 months from the date of this report. |
On January 31, 2023, the Company completed
a 1 for 40 share consolidation of its authorized and issued ordinary shares whereby every forty shares were consolidated into one share.
In addition, the par value of each ordinary share increased from $0.003 to $0.12. Immediately following the completion of the share consolidation,
the Company increased its authorized ordinary shares from 7,500,000 ordinary shares to 300,000,000 ordinary shares. The accompanying interim
condensed consolidated financial statements for the six months ended June 30, 2022 have been retroactively adjusted to reflect the effect
of the share consolidation.
| 2.2 | Basis of consolidation |
The consolidated statements of
profit or loss and other comprehensive loss, statements of changes in equity and statements of cash flows of the Company for the
relevant periods include the results and cash flows of all companies now comprising the Company from the earliest date presented or
since the date when the subsidiaries and/or businesses first came under the common control of the controlling shareholders, wherever
the period is shorter.
The interim condensed consolidated balance
sheet of the Company as of June 30, 2023 has been prepared to present the assets and liabilities of the subsidiaries under the historical
cost convention.
Equity interests in subsidiaries held
by parties other than the controlling shareholders are presented as non-controlling interests in equity.
All intra-group and inter-company transactions
and balances have been eliminated on consolidation.
Segment information is consistent with
how management reviews the businesses, makes investing and resource allocation decisions and assesses operating performance. Transfers
and sales between reportable segments, if any, are recorded at cost. The Company reports financial and operating
information in the following five segments (Note 23):
| |
(ii) |
Information security; |
| |
(iii) |
Robotics AI solutions; |
| |
(iv) |
General security solutions; and |
| 2.4 | Business combinations |
The Company accounts for business combinations
using the acquisition method when control is transferred to the Company, other than those between and among entities under common control.
The consideration transferred in the acquisition is generally measured at fair value, as are the identifiable net assets acquired. Any
goodwill that arises is tested annually for impairment. Any gain on the bargain purchase is recognized in the statement of profit or loss
immediately. Transaction costs are expensed as incurred, except if related to the issue of debt or equity securities.
| 2.5 | Critical accounting estimate and judgements |
The preparation of the consolidated financial
statements in conformity with IFRS requires management to make estimates and judgments that affect the reported amounts of assets and
liabilities and disclosure of contingent assets and liabilities at the date of the financial statements and the reported amounts of revenues
and expenses during the reporting periods. Actual results could differ from these estimates.
In preparing the interim condensed consolidated
financial statements, the significant judgments made by management in applying the Company’s accounting policies and the key sources
of estimation uncertainty were the same as those that applied to the consolidated financial statements for the year ended December 31,
2022.
| 2.6 | Foreign currency translation |
The presentational currency of the Company
is the U.S. dollar (“USD”). The functional currency of Guardforce, AI Holdings, AI Robots, Horizon Dragon, Southern Ambition,
AI Singapore, AI Robotics, AI Robots Service, AI Malaysia, AI Macau, AI US, AI Australia, AI Dubai, AI UK, AI Korea, AI Japan, AI Canada
and AI Vietnam is the USD. The functional currency of AI Hong Kong and Handshake is the Hong Kong dollar (“HKD”). The functional
currency of AI Thailand, GF Cash (CIT) and AI R&I is the Thai Baht (“Baht” or “THB”). The functional currency
of AI Shenzhen, AI Jian, Shenzhen GFAI, Guangzhou GFAI and Beijing Wanjia is the Chinese Renminbi (“RMB”).
The currency exchange rates that impact
our business are shown in the following table:
| | |
Period End Rate | | |
Average Rate | |
| | |
June 30, | | |
December 31, | | |
For the six months ended
June 30, | |
| | |
2023 | | |
2022 | | |
2023 | | |
2022 | |
| Thai Baht | |
| 0.0283 | | |
| 0.0289 | | |
| 0.0293 | | |
| 0.0295 | |
| Hong Kong Dollar | |
| 0.1282 | | |
| 0.1282 | | |
| 0.1282 | | |
| 0.1282 | |
| Chinese Renminbi | |
| 0.1379 | | |
| 0.1447 | | |
| 0.1444 | | |
| 0.1544 | |
| 2.7 | Financial risk management |
| 2.7.1 |
Financial risk factors |
The Company’s activities expose
it to a variety of financial risks: foreign exchange risk, interest rate risk and liquidity risk. The Company’s overall risk management
program focuses on the unpredictability of financial markets and seeks to minimize potential adverse effects on the Company’s financial
performance. The interim condensed consolidated financial
statements do not include all financial risk management information and disclosures required in the audited financial statements, and
should be read in conjunction with the Company’s audited consolidated financial statements as of December 31, 2022, 2021 and 2020.
Prudent liquidity management implies
maintaining sufficient cash and cash equivalents and the availability of funding through an adequate amount of committed credit facilities.
The Company’s primary cash requirements
are for operating expenses and purchases of fixed assets. The Company mainly finances its working capital requirements from cash generated
from funds raised from the public offerings, operations, proceeds from the exercise of warrants, bank borrowings and finance leases.
The Company’s policy is to regularly
monitor current and expected liquidity requirements to ensure it maintains sufficient cash and cash equivalents and an adequate amount
of committed credit facilities to meet its liquidity requirements in the short and long term.
At the reporting date, the contractual
undiscounted cash flows of the Company’s current financial liabilities approximate their respective carrying amounts due to their
short maturities.
| 2.7.3 |
Capital risk management |
The Company’s objectives on managing
capital are to safeguard the Company’s ability to continue as a going concern and support the sustainable growth of the Company
in order to provide returns for shareholders and benefits for other stakeholders and to maintain an optimal capital structure to enhance
shareholders’ value in the long term.
In order to maintain or adjust the capital
structure, the Company may adjust the amount of dividends paid to shareholders, return of capital to shareholders, issue new shares or
sell assets to reduce debt.
The COVID-19 pandemic developed rapidly
in 2020. The resulting impact of the virus on the operations and measures taken by various governments to contain the virus have negatively
affected the Company’s financial performance in the fiscal year 2022. The regulatory measures in response to the pandemic were relaxed
and travel restrictions in most countries was lifted in late 2022, the Company might be recovered through the increase in economic activity
in the fiscal year 2023. The Company is monitoring the situation closely and conscientiously managing its costs by adopting an operating
cost reduction strategy and conserving liquidity by working with major creditors to align repayment obligations with receivable collections.
Inventories consist of robots and security
equipment which are stated at the lower of cost, determined on a weighted average basis, or net realizable value. Net realizable value
is the estimated selling price in the ordinary course of business less the estimated cost of completion and the estimated costs necessary
to make the sale. When inventory is sold, their carrying amount is charged to expense in the period in which the revenue is recognized.
Write-downs for declines in net realizable value or for losses of inventories are recognized as an expense in the period the impairment
or loss occurs. The Company recorded an allowance for slow-moving or obsolete robot inventories of $3,090,283 and nil for the six months
ended June 30, 2023 and 2022, respectively.
During the six months ended June 30,
2023 and 2022, all robot inventories were purchased from the related parties (Note 22), and all security equipment’s inventories
were purchased from third parties.
Parties are considered to be related
if one party has the ability, directly or indirectly, to control the other party or exercise significant influence over the other party
in making financial and operating decisions. Parties are also considered to be related if they are subject to common control or significant
influence, such as a family member or relative, shareholder, or a related corporation.
The Company recognizes the contractual
right to receive money or products from related parties as amounts due from related parties. For those that the contractual maturity date
is less than one year, the Company records as current assets.
| 2.10 | Assets under construction |
Assets under construction recorded
in property, plant and equipment and intangible assets are stated at cost less impairment losses, if any. Cost comprises direct
costs of construction as well as interest expense and exchange differences capitalized during the periods of construction and
installation. Capitalization of these costs ceases and the construction in progress is transferred to property, plant and equipment
when substantially all the activities necessary to prepare the assets for their intended use are completed. No depreciation is
provided for assets under construction until they are completed and ready for intended use.
Following initial recognition, goodwill
is stated at cost less any accumulated impairment losses. Goodwill is reviewed for impairment annually or more frequently if events or
changes in circumstances indicate that the carrying value may be impaired.
At the acquisition date, any
goodwill acquired is allocated to the cash-generating units (CGU) which are expected to benefit from the combination’s
synergies. Impairment is determined by assessing the recoverable amount of the CGU to which the goodwill related. Where the
recoverable amount of the CGU is less than the carrying amount, an impairment loss is recognized. Where goodwill forms part of a CGU
and part of the operation within that unit is disposed of, the goodwill associated with the operation disposed of is included in the
carrying amount of the operation when determining the gain or loss on disposal of the operation. Goodwill disposed of In these
circumstances is measured on the basis of the relative values of the operation disposed of and the portion of the CGU retained. The
Company recorded a goodwill impairment of 1,263,040 and nil for the six months ended June 30, 2023 and 2022, respectively.
| 2.11 | Impairment of long-lived assets |
At the end of each reporting period,
the Company reviews the carrying amounts of its long-lived assets to determine whether there is any indication that those assets have
suffered an impairment loss. If any such indication exists, the recoverable amount of the asset is estimated in order to determine the
extent of the impairment loss (if any). Where it is not possible to estimate the recoverable amount of an individual asset, the Company
estimates the recoverable amount of the cash-generating unit to which the asset belongs. For the six months ended June 30, 2023, an impairment
loss on the robot assets of $1,591,766 was recognized when the carrying amount was greater than the value in use. Management estimated
the value in use by estimating the expected cash flows from the cash-generating unit as well as a suitable discount rate in order to calculate
the present value of those cash flows. The basis of impairment is determined based on the result of assessment. The Company did not incur
any impairment loss for the six months ended June 30, 2022.
| 2.12 | Offsetting Assets and Liabilities |
During the six months ended June 30,
2023, the Company engaged in offsetting arrangements for certain financial assets and financial liabilities. These arrangements primarily
involve the offsetting of related party receivables, related party payables and borrowings from a related party. The Company has established
legally enforceable rights to offset financial assets and financial liabilities subject to offsetting arrangements. These rights may arise
from agreements, netting arrangements, or a combination of legal and contractual rights. | 2.13 | Revenue from contracts with customers |
The Company generates its revenue primarily
from four service lines: (1) Secure logistics; (2) Robotics AI resolutions; (3) Information security; and (4) General security solutions.
Each service line primarily renders the
following services:
| |
(i) |
Cash-In-Transit – Non Dedicated Vehicle (CIT Non-DV); (ii) Cash-In-Transit – Dedicated Vehicle (CIT DV); (iii) ATM management; (iv) Cash Processing (CPC); (v) Cash Center Operations (CCT); (vi) Consolidate Cash Center (CCC); (vii) Cheque Center Service (CDC); (viii) Express Cash; (ix) Coin Processing Service; and (x) Cash Deposit Management Solutions |
| |
(2) |
Robotics AI solutions |
| |
(i) |
Sale of robots and (ii) Rental of robots |
| |
(i) |
Penetration test; (ii) PCI ASV Scan and (iii) Rapid7 Sales |
| |
(4) |
General security solutions |
| |
(i) |
Installation of fire alarm security systems; (ii) Sale of security equipment |
The Company recognizes revenue at a point
in time as products are delivered and services are performed. Consultancy fees typically covers a period of time, the revenue is recognized
on a ratable basis over the contract term. The Company applies the following five-step model in order to determine the amount:
| |
● |
To identify the contract or quotation with the agreed service price. |
| |
● |
To evaluate the services engaged in the customer’s contract and identify the related performance obligations. |
| |
● |
To consider the contract terms and commonly accepted practices in the business to determine the transaction price. The transaction price is the consideration that the Company expects to be entitled for delivering the services engaged with the customer. The consideration engaged in a customer’s contract is generally a fixed amount. |
| |
● |
To allocate the transaction price, if necessary, to each performance obligation (to each good or service that is different) for an amount that represents the part of the benefit that the Company expects to receive in exchange for the right of delivering the services engaged with the customer. |
| |
● |
To recognize revenue when the Company satisfies the performance obligation through the rendering of services engaged. |
All of the conditions mentioned above
are accomplished normally when the services are rendered to the customer and this moment is considered a point in time. The reported revenue
reflects services delivered at the contract or agreed-upon price.
Contract liabilities consist of deferred
revenue related to prepaid fees received from customers for future information security service over the term of the service agreement.
The Company expects to recognize revenue of $428,839 within the next 12 months and $nil after 12 months to 36 months.
Revenue is recognized when the related
performance obligation is satisfied. Disaggregation information of revenue
by service type which was recognized based on the nature of performance obligation disclosed above is as follows:
| | |
For the six months ended June
30, | |
| | |
2023 | | |
Percentage of
Total | | |
2022 | | |
Percentage of
Total | |
| Service Type | |
$ | | |
Revenue | | |
$ | | |
Revenue | |
| | |
(Unaudited) | | |
| | |
(Unaudited) | | |
| |
| Cash-In-Transit – Non-Dedicated Vehicles (CIT Non-DV) | |
$ | 5,988,087 | | |
| 32.5 | % | |
$ | 5,377,474 | | |
| 31.8 | % |
| Cash-In-Transit – Dedicated Vehicle to Banks (CIT DV) | |
| 1,961,464 | | |
| 10.7 | % | |
| 2,135,199 | | |
| 12.6 | % |
| ATM Management | |
| 3,895,708 | | |
| 21.2 | % | |
| 4,731,015 | | |
| 27.9 | % |
| Cash Processing (CPC) | |
| 1,613,933 | | |
| 8.8 | % | |
| 1,410,902 | | |
| 8.3 | % |
| Cash Center Operations (CCT) | |
| 958,760 | | |
| 5.2 | % | |
| 1,202,214 | | |
| 7.1 | % |
| Consolidate Cash Center (CCC) | |
| 395,105 | | |
| 2.1 | % | |
| 225,513 | | |
| 1.3 | % |
| Cheque Center Service (CDC) | |
| - | | |
| - | % | |
| 4,729 | | |
| 0.05 | % |
| Others ** | |
| 4,332 | | |
| 0.02 | % | |
| 4,399 | | |
| 0.05 | % |
| Cash Deposit Management Solutions (GDM) | |
| 1,125,767 | | |
| 6.1 | % | |
| 869,102 | | |
| 5.1 | % |
| Robotics AI solutions | |
| 440,229 | | |
| 2.4 | % | |
| 719,041 | | |
| 4.2 | % |
| Information security | |
| 407,689 | | |
| 2.2 | % | |
| 262,934 | | |
| 1.6 | % |
| General security solutions | |
| 1,622,218 | | |
| 8.8 | % | |
| - | | |
| - | % |
| Total | |
$ | 18,413,292 | | |
| 100.0 | % | |
$ | 16,942,522 | | |
| 100.0 | % |
| ** | Others
include primarily revenue from express cash and coin processing services. |
During the six months ended June 30,
2022, revenues amounting to $16,808,399 were generated from third parties; and $134,123 were generated from a related party (Note 22).
During the six months ended June 30,
2023 all revenues were generated from third parties.
Cost of sales consists primarily
of internal labor costs and related benefits, and other overhead costs that are directly attributable to services provided.
| 2.15 | New and amended accounting standards |
All new standards and amendments that
are effective for annual reporting period commencing January 1, 2023 have been applied by the Company for the six months ended June 30,
2023. The adoption of these new and amended standards did not have material impact on the interim condensed consolidated financial statements
of the Company. A number of new standards and amendments to standards have not come into effect for the year beginning January 1, 2023,
and they have not been early adopted by the Company in preparing these interim condensed consolidated financial statements. None of these
new standards and amendments to standards is expected to have a significant effect on the interim condensed consolidated financial statements
of the Company.
|
| X |
- References
+ Details
| Name: |
gfai_DisclosureOfSignificantAccountingPoliciesAbstract |
| Namespace Prefix: |
gfai_ |
| Data Type: |
xbrli:stringItemType |
| Balance Type: |
na |
| Period Type: |
duration |
|
| X |
- DefinitionThe disclosure of changes made to accounting policies by the entity. Reference 1: http://www.xbrl.org/2009/role/commonPracticeRef
-Name IAS
-Number 1
-IssueDate 2023-01-01
-Paragraph 10
-Subparagraph e
-URI https://taxonomy.ifrs.org/xifrs-link?type=IAS&num=1&code=ifrs-tx-2023-en-r&anchor=para_10_e&doctype=Standard
-URIDate 2023-03-23
| Name: |
ifrs-full_DisclosureOfChangesInAccountingPoliciesExplanatory |
| Namespace Prefix: |
ifrs-full_ |
| Data Type: |
dtr-types:textBlockItemType |
| Balance Type: |
na |
| Period Type: |
duration |
|
v3.23.3
Business Combinations
|
6 Months Ended |
Jun. 30, 2023 |
|---|
| Business Combination [Abstract] |
|
| BUSINESS COMBINATIONS |
In 2021 and 2022, the Company acquired
a total of five subsidiaries, these acquisitions have been accounted for in accordance with IFRS 3 guidelines under acquisition accounting,
whereby the Company recognized the assets and liabilities transferred at their carrying amounts with carry-over basis.
A Purchase Price Allocation exercise
has been undertaken to establish the constituent parts of the acquired companies’ balance sheet at fair value on acquisition. As
is customary in these circumstances, this will remain under review and subject to change during the twelve-month hindsight period. The
interim condensed consolidated financial statements condensed the information and disclosures of all the acquired subsidiaries required
in the audited financial statements, and should be read in conjunction with the Company’s audited consolidated financial statements
as of December 31, 2022, 2021 and 2020.
The following represents the
purchase price allocation at the dates of the acquisitions:
| | |
Handshake
on March 25,
2021 | | |
AI Macau
on February 9,
2022 | | |
AI
Malaysia
on January 20,
2022 | | |
Beijing
Wanjia on
June 22,
2022 | | |
Shenzhen
GFAI and
Guangzhou
GFAI on
March 22,
2022 | |
| Cash and cash equivalents | |
$ | 24,276 | | |
$ | 21,038 | | |
$ | 12,500 | | |
$ | 38,342 | | |
$ | 2,187 | |
| Other current assets | |
| 32,250 | | |
| 4,162 | | |
| - | | |
| 2,219,318 | | |
| 2,393,558 | |
| Property, plant and equipment | |
| - | | |
| - | | |
| - | | |
| 20,488 | | |
| 2,055,610 | |
| Intangible assets | |
| - | | |
| - | | |
| - | | |
| 1,593,398 | | |
| 1,592,783 | |
| Other non-current assets | |
| - | | |
| - | | |
| - | | |
| 203,765 | | |
| 23,566 | |
| Current liabilities | |
| (58,297 | ) | |
| (92,350 | ) | |
| (13,184 | ) | |
| (1,681,573 | ) | |
| (4,320,434 | ) |
| Goodwill | |
| 329,534 | | |
| 70,355 | | |
| 685 | | |
| 411,862 | | |
| 1,867,009 | |
| Total purchase price | |
$ | 327,763 | | |
$ | 3,205 | | |
$ | 1 | | |
$ | 2,805,600 | | |
$ | 3,614,279 | |
During the six months ended June 30,
2023, the Company recorded impairment losses on Handshake of $329,534 and on Shenzhen GFAI and Guangzhou GFAI of $933,506.
|
| X |
- DefinitionThe disclosure of contingent liabilities in a business combination. [Refer: Contingent liabilities [member]; Business combinations [member]] Reference 1: http://www.xbrl.org/2003/role/disclosureRef
-Name IFRS
-Number 3
-IssueDate 2023-01-01
-Paragraph B64
-Subparagraph j
-URI https://taxonomy.ifrs.org/xifrs-link?type=IFRS&num=3&code=ifrs-tx-2023-en-r&anchor=para_B64_j&doctype=Appendix&subtype=B
-URIDate 2023-03-23
| Name: |
ifrs-full_DisclosureOfContingentLiabilitiesInBusinessCombinationExplanatory |
| Namespace Prefix: |
ifrs-full_ |
| Data Type: |
dtr-types:textBlockItemType |
| Balance Type: |
na |
| Period Type: |
duration |
|
v3.23.3
Cash, Cash Equivalents and Restricted Cash
|
6 Months Ended |
Jun. 30, 2023 |
|---|
| Cash, Cash Equivalents and Restricted Cash [Abstract] |
|
| CASH, CASH EQUIVALENTS AND RESTRICTED CASH |
| 4. |
CASH, CASH EQUIVALENTS AND RESTRICTED CASH |
| | |
As of
June 30,
2023 | | |
As of
December 31,
2022 | |
| | |
(Unaudited) | | |
| |
| Cash on hand | |
$ | 465,853 | | |
$ | 471,408 | |
| Cash in bank | |
| 24,272,524 | | |
| 6,459,231 | |
| Subtotal | |
| 24,783,377 | | |
| 6,930,639 | |
| Restricted cash – current (a) | |
| 17,059 | | |
| - | |
| Restricted cash – non-current (b) | |
| 1,274,956 | | |
| 1,300,005 | |
| Cash, cash equivalents, and restricted cash | |
$ | 26,030,392 | | |
$ | 8,230,644 | |
| (a) | During the six months ended June 30, 2023, with regards to various labor-related lawsuits in the PRC,
the PRC Court issued an order to freeze one of the Company’s bank accounts which restricted or prohibited the transfer and use of
deposited funds by the Company. The sum will be released when the Company has paid to satisfy the claims. |
| (b) | The non-current restricted cash represents cash pledged with a local bank in Thailand as collateral for
bank guarantees issued by those banks in respect of the Company’s Cash-In-Transit projects. |
|
| X |
- References
+ Details
| Name: |
ifrs-full_CashAndCashEquivalentsAbstract |
| Namespace Prefix: |
ifrs-full_ |
| Data Type: |
xbrli:stringItemType |
| Balance Type: |
na |
| Period Type: |
duration |
|
| X |
- DefinitionThe disclosure of restricted cash and cash equivalents. [Refer: Restricted cash and cash equivalents] Reference 1: http://www.xbrl.org/2009/role/commonPracticeRef
-Name IAS
-Number 1
-IssueDate 2023-01-01
-Paragraph 10
-Subparagraph e
-URI https://taxonomy.ifrs.org/xifrs-link?type=IAS&num=1&code=ifrs-tx-2023-en-r&anchor=para_10_e&doctype=Standard
-URIDate 2023-03-23
| Name: |
ifrs-full_DisclosureOfRestrictedCashAndCashEquivalentsExplanatory |
| Namespace Prefix: |
ifrs-full_ |
| Data Type: |
dtr-types:textBlockItemType |
| Balance Type: |
na |
| Period Type: |
duration |
|
v3.23.3
Inventories
|
6 Months Ended |
Jun. 30, 2023 |
|---|
| Inventory [Abstract] |
|
| INVENTORIES |
| | |
As of
June 30,
2023 | | |
As of
December 31,
2022 | |
| | |
(Unaudited) | | |
| |
| Robots in warehouse | |
$ | 4,976,219 | | |
$ | 5,553,859 | |
| Robots in transit | |
| 46,950 | | |
| - | |
| Security equipment | |
| 415,036 | | |
| 494,793 | |
| Impairment provision for inventories | |
| (3,801,960 | ) | |
| (942,882 | ) |
| Inventories | |
$ | 1,636,245 | | |
$ | 5,105,770 | |
The Company recorded an allowance for
slow-moving or obsolete robot inventories of $3,090,283 and nil for the six months ended June 30, 2023 and 2022, respectively.
|
| X |
- References
+ Details
| Name: |
ifrs-full_ClassesOfInventoriesAbstract |
| Namespace Prefix: |
ifrs-full_ |
| Data Type: |
xbrli:stringItemType |
| Balance Type: |
na |
| Period Type: |
duration |
|
| X |
- DefinitionThe entire disclosure for inventories. Reference 1: http://www.xbrl.org/2003/role/disclosureRef
-Name IAS
-Number 2
-IssueDate 2023-01-01
-Section Disclosure
-URI https://taxonomy.ifrs.org/xifrs-link?type=IAS&num=2&code=ifrs-tx-2023-en-r&doctype=Standard&dita_xref=IAS02_g36-39_TI
-URIDate 2023-03-23
| Name: |
ifrs-full_DisclosureOfInventoriesExplanatory |
| Namespace Prefix: |
ifrs-full_ |
| Data Type: |
dtr-types:textBlockItemType |
| Balance Type: |
na |
| Period Type: |
duration |
|
v3.23.3
Trade Receivables, Net
|
6 Months Ended |
Jun. 30, 2023 |
|---|
| Trade Receivables, Net [Abstract] |
|
| TRADE RECEIVABLES, NET |
| 6. |
TRADE RECEIVABLES, NET |
| | |
As of
June 30,
2023 | | |
As of
December 31,
2022 | |
| | |
(Unaudited) | | |
| |
| Trade receivable | |
$ | 5,160,600 | | |
$ | 5,392,720 | |
| (Impairment provision) recovery of doubtful accounts | |
| (32,602 | ) | |
| 7,466 | |
| Trade receivable, net | |
$ | 5,127,998 | | |
$ | 5,400,186 | |
The Company recorded an allowance for
doubtful accounts of $45,932 and $nil for the six months ended June 30, 2023 and 2022, respectively.
|
| X |
- References
+ Details
| Name: |
gfai_TradeReceivablesNetAbstract |
| Namespace Prefix: |
gfai_ |
| Data Type: |
xbrli:stringItemType |
| Balance Type: |
na |
| Period Type: |
duration |
|
| X |
- DefinitionThe disclosure of receivables acquired in a business combination. [Refer: Business combinations [member]] Reference 1: http://www.xbrl.org/2003/role/disclosureRef
-Name IFRS
-Number 3
-IssueDate 2023-01-01
-Paragraph B64
-Subparagraph h
-URI https://taxonomy.ifrs.org/xifrs-link?type=IFRS&num=3&code=ifrs-tx-2023-en-r&anchor=para_B64_h&doctype=Appendix&subtype=B
-URIDate 2023-03-23
| Name: |
ifrs-full_DisclosureOfAcquiredReceivablesExplanatory |
| Namespace Prefix: |
ifrs-full_ |
| Data Type: |
dtr-types:textBlockItemType |
| Balance Type: |
na |
| Period Type: |
duration |
|
v3.23.3
Withholding Tax Receivable
|
6 Months Ended |
Jun. 30, 2023 |
|---|
| Withholding Tax Receivable [Abstract] |
|
| WITHHOLDING TAX RECEIVABLE |
| 7. |
WITHHOLDING TAX RECEIVABLE |
| | |
2023 | | |
2022 | |
| | |
(Unaudited) | | |
(Unaudited) | |
| Balance at January 1, | |
$ | 2,691,096 | | |
$ | 3,531,953 | |
| Addition | |
| 401,941 | | |
| 381,966 | |
| Collection | |
| - | | |
| (1,045,061 | ) |
| Write off/ Allowance for uncollectible | |
| (561,277 | ) | |
| (263,340 | ) |
| Exchange difference | |
| (73,713 | ) | |
| (153,902 | ) |
| Balance at June 30, | |
$ | 2,458,047 | | |
$ | 2,451,616 | |
| | |
As of
June 30,
2023 | | |
As of
December 31,
2022 | |
| | |
(Unaudited) | | |
| |
| Current portion | |
$ | 536,974 | | |
$ | 757,024 | |
| Non-current portion | |
| 1,921,073 | | |
| 1,934,072 | |
| Withholding tax receivable | |
$ | 2,458,047 | | |
$ | 2,691,096 | |
On July 12, 2023, the Company received
a withholding tax refund of THB18,959,514 (approximately $0.5 million) in connection with the Company’s 2018 withholding tax refund
applications of THB29,188,153 (approximately $0.8 million). The Company wrote off approximately $0.3 million, representing the difference
between the receivable recorded and the amount of refund subsequently received from the Thai Revenue Department. During the six months ended June 30,
2022, the Company received a withholding tax refund of THB35,312,291 (approximately $1.0 million) in connection with the Company’s
2016 to 2017 withholding tax refund applications (totaled THB56,107,574 or approximately $1.6 million). The Company wrote off approximately
$0.6 million, representing the difference between the receivable recorded and the amount of refund received from the Thai Revenue Department.
Out of prudence, based on amount refunded
and written off for the receivable related to years 2013 to 2018, the Company recorded an allowance of approximately $0.3 million and
$0.1 million for the six months ended June 30, 2023 and 2022, respectively. As of June 30, 2023 and December 31, 2022, an allowance balance
of $1.2 million and $0.9 million, respectively were maintained against its withholding tax receivable.
|
| X |
- DefinitionSchedule disclosing information related to withholding taxes receivables, net.
| Name: |
gfai_DisclosureOfWithholdingTaxesReceivablesNet |
| Namespace Prefix: |
gfai_ |
| Data Type: |
dtr:textBlockItemType |
| Balance Type: |
na |
| Period Type: |
duration |
|
| X |
- References
+ Details
| Name: |
gfai_WithholdingTaxReceivableAbstract |
| Namespace Prefix: |
gfai_ |
| Data Type: |
xbrli:stringItemType |
| Balance Type: |
na |
| Period Type: |
duration |
|
v3.23.3
Other Receivables
|
6 Months Ended |
Jun. 30, 2023 |
|---|
| Other Receivables [Abstract] |
|
| OTHER RECEIVABLES |
| | |
As of
June 30,
2023 | | |
As of
December 31,
2022 | |
| | |
(Unaudited) | | |
| |
| Cash advance to a third-party vendor | |
$ | 778,724 | | |
$ | 817,564 | |
| Impairment provision for other receivables | |
| (778,724 | ) | |
| - | |
| | |
$ | - | | |
$ | 817,564 | |
The Company recorded an allowance
for doubtful accounts of $815,887 and $nil for the six months ended June 30, 2023 and 2022, respectively.
|
| X |
- DefinitionThe disclosure of trade and other receivables. [Refer: Trade and other receivables] Reference 1: http://www.xbrl.org/2009/role/commonPracticeRef
-Name IAS
-Number 1
-IssueDate 2023-01-01
-Paragraph 10
-Subparagraph e
-URI https://taxonomy.ifrs.org/xifrs-link?type=IAS&num=1&code=ifrs-tx-2023-en-r&anchor=para_10_e&doctype=Standard
-URIDate 2023-03-23
| Name: |
ifrs-full_DisclosureOfTradeAndOtherReceivablesExplanatory |
| Namespace Prefix: |
ifrs-full_ |
| Data Type: |
dtr-types:textBlockItemType |
| Balance Type: |
na |
| Period Type: |
duration |
|
| X |
- References
+ Details
| Name: |
ifrs-full_TradeAndOtherReceivablesAbstract |
| Namespace Prefix: |
ifrs-full_ |
| Data Type: |
xbrli:stringItemType |
| Balance Type: |
na |
| Period Type: |
duration |
|
v3.23.3
Other Current and Other Non-Current Assets
|
6 Months Ended |
Jun. 30, 2023 |
|---|
| Other Current and Other Non-Current Assets [Abstract] |
|
| OTHER CURRENT AND OTHER NON-CURRENT ASSETS |
| 9. |
OTHER CURRENT AND OTHER NON-CURRENT ASSETS |
| | |
As of
June 30,
2023 | | |
As of
December 31,
2022 | |
| | |
(Unaudited) | | |
| |
| Input VAT and other taxes receivable | |
$ | 314,855 | | |
$ | 293,429 | |
| Prepayments – office and warehouse rental | |
| 1,240,967 | | |
| 780,279 | |
| Prepayments - insurance | |
| 375,985 | | |
| 106,167 | |
| Prepayments - others | |
| 166,165 | | |
| 91,926 | |
| Uniforms | |
| 14,781 | | |
| 24,699 | |
| Tools and supplies | |
| 152,035 | | |
| 155,642 | |
| Deferred costs | |
| 90,555 | | |
| 219,782 | |
| Cash advances to employees | |
| 25,375 | | |
| 71,084 | |
| Other current assets | |
$ | 2,380,718 | | |
$ | 1,743,008 | |
| | |
| | | |
| | |
| Deposits | |
$ | 397,030 | | |
$ | 437,602 | |
| Deferred costs | |
| - | | |
| 9,720 | |
| Other non-current assets | |
$ | 397,030 | | |
$ | 447,322 | |
The Company recorded an allowance for
doubtful accounts of $8,589 and $nil for the six months ended June 30, 2023 and 2022, respectively.
|
| X |
- References
+ Details
| Name: |
gfai_DisclosureOfOtherCurrentAndNoncurrentAssetsTextBlock |
| Namespace Prefix: |
gfai_ |
| Data Type: |
dtr:textBlockItemType |
| Balance Type: |
na |
| Period Type: |
duration |
|
| X |
- References
+ Details
| Name: |
gfai_OtherCurrentAndOtherNonCurrentAssetsAbstract |
| Namespace Prefix: |
gfai_ |
| Data Type: |
xbrli:stringItemType |
| Balance Type: |
na |
| Period Type: |
duration |
|
v3.23.3
Property, Plant and Equipment
|
6 Months Ended |
Jun. 30, 2023 |
|---|
| Property, Plant and Equipment [Abstract] |
|
| PROPERTY, PLANT AND EQUIPMENT |
| 10. |
PROPERTY, PLANT and EQUIPMENT |
| | |
Leasehold
improvements | | |
Machinery
and
equipment | | |
Office
decoration
and
equipment | | |
Vehicles | | |
Assets
under
construction | | |
GDM
machines | | |
Robots | | |
Total | |
| Cost | |
| | |
| | |
| | |
| | |
| | |
| | |
| | |
| |
| At December 31, 2021 | |
$ | 3,239,683 | | |
$ | 5,108,501 | | |
$ | 5,412,444 | | |
$ | 16,233,868 | | |
$ | 248,686 | | |
$ | 1,713,926 | | |
$ | 5,369,070 | | |
$ | 37,326,178 | |
| Acquisitions through business combinations | |
| - | | |
| - | | |
| 205,070 | | |
| 141,619 | | |
| - | | |
| - | | |
| 2,571,013 | | |
| 2,917,702 | |
| Additions | |
| 26,342 | | |
| 18,698 | | |
| 18,603 | | |
| 80,350 | | |
| - | | |
| 318,905 | | |
| 2,178,914 | | |
| 2,641,812 | |
| Disposals | |
| (101,834 | ) | |
| (7,437 | ) | |
| (15,463 | ) | |
| (344,818 | ) | |
| (211,659 | ) | |
| (15,892 | ) | |
| (12,273 | ) | |
| (709,376 | ) |
| Exchange differences | |
| (173,963 | ) | |
| (281,325 | ) | |
| (298,630 | ) | |
| (880,949 | ) | |
| (4,472 | ) | |
| (107,391 | ) | |
| (392,122 | ) | |
| (2,138,852 | ) |
| At June 30, 2022 (Unaudited) | |
| 2,990,228 | | |
| 4,838,437 | | |
| 5,322,024 | | |
| 15,230,070 | | |
| 32,555 | | |
| 1,909,548 | | |
| 9,714,602 | | |
| 40,037,464 | |
| | |
| | | |
| | | |
| | | |
| | | |
| | | |
| | | |
| | | |
| | |
| At December 31, 2022 | |
$ | 3,146,864 | | |
$ | 4,868,015 | | |
$ | 5,354,351 | | |
$ | 15,518,987 | | |
$ | 33,222 | | |
$ | 1,948,698 | | |
$ | 7,194,815 | | |
$ | 38,064,952 | |
| Additions | |
| - | | |
| 1,750 | | |
| 6,964 | | |
| - | | |
| - | | |
| 624,126 | | |
| 273,779 | | |
| 906,619 | |
| Disposals | |
| (104,773 | ) | |
| (105,939 | ) | |
| (48,955 | ) | |
| (47,155 | ) | |
| - | | |
| - | | |
| (56,389 | ) | |
| (363,211 | ) |
| Impairment of fixed assets | |
| - | | |
| - | | |
| - | | |
| - | | |
| - | | |
| - | | |
| (1,591,766 | ) | |
| (1,591,766 | ) |
| Exchange differences | |
| (60,518 | ) | |
| (95,521 | ) | |
| (106,807 | ) | |
| (353,552 | ) | |
| (652 | ) | |
| (38,238 | ) | |
| (141,241 | ) | |
| (796,529 | ) |
| At June 30, 2023 (Unaudited) | |
| 2,981,573 | | |
| 4,668,305 | | |
| 5,205,553 | | |
| 15,118,280 | | |
| 32,570 | | |
| 2,534,586 | | |
| 5,679,198 | | |
| 36,220,065 | |
| | |
| | | |
| | | |
| | | |
| | | |
| | | |
| | | |
| | | |
| | |
| Accumulated Depreciation | |
| | | |
| | | |
| | | |
| | | |
| | | |
| | | |
| | | |
| | |
| At December 31, 2021 | |
$ | 2,693,472 | | |
$ | 4,906,277 | | |
$ | 4,799,149 | | |
$ | 13,447,168 | | |
$ | - | | |
$ | 891,378 | | |
$ | 691,433 | | |
$ | 27,428,877 | |
| Acquisitions through business combinations | |
| - | | |
| - | | |
| 184,364 | | |
| 136,723 | | |
| - | | |
| - | | |
| 520,516 | | |
| 841,603 | |
| Depreciation charged for the period | |
| 51,903 | | |
| 57,623 | | |
| 96,235 | | |
| 416,775 | | |
| - | | |
| 188,620 | | |
| 762,874 | | |
| 1,574,030 | |
| Disposals | |
| (99,439 | ) | |
| (7,396 | ) | |
| (15,432 | ) | |
| (330,993 | ) | |
| - | | |
| (5,303 | ) | |
| (461 | ) | |
| (459,024 | ) |
| Exchange differences | |
| (146,005 | ) | |
| (271,901 | ) | |
| (268,318 | ) | |
| (742,974 | ) | |
| - | | |
| (56,970 | ) | |
| (81,330 | ) | |
| (1,567,498 | ) |
| As June 30, 2022 (Unaudited) | |
| 2,499,931 | | |
| 4,684,603 | | |
| 4,795,998 | | |
| 12,926,699 | | |
| - | | |
| 1,017,725 | | |
| 1,893,032 | | |
| 27,817,988 | |
| | |
| | | |
| | | |
| | | |
| | | |
| | | |
| | | |
| | | |
| | |
| At December 31, 2022 | |
$ | 2,577,341 | | |
$ | 4,748,031 | | |
$ | 4,889,742 | | |
$ | 13,493,656 | | |
$ | - | | |
$ | 1,230,247 | | |
$ | 3,059,174 | | |
$ | 29,998,191 | |
| Depreciation charged for the period | |
| 48,922 | | |
| 34,180 | | |
| 87,164 | | |
| 263,962 | | |
| - | | |
| 202,983 | | |
| 516,626 | | |
| 1,153,837 | |
| Disposals | |
| (108,213 | ) | |
| (109,514 | ) | |
| (44,542 | ) | |
| (48,748 | ) | |
| | | |
| - | | |
| (14,847 | ) | |
| (325,864 | ) |
| Exchange differences | |
| (48,443 | ) | |
| (90,705 | ) | |
| (101,287 | ) | |
| (275,519 | ) | |
| - | | |
| (30,774 | ) | |
| (77,779 | ) | |
| (624,507 | ) |
| As June 30, 2023 (Unaudited) | |
| 2,469,607 | | |
| 4,581,992 | | |
| 4,831,077 | | |
| 13,433,351 | | |
| - | | |
| 1,402,456 | | |
| 3,483,174 | | |
| 30,201,657 | |
| | |
| | | |
| | | |
| | | |
| | | |
| | | |
| | | |
| | | |
| | |
| Net book value | |
| | | |
| | | |
| | | |
| | | |
| | | |
| | | |
| | | |
| | |
| At June 30, 2022 (Unaudited) | |
$ | 490,298 | | |
$ | 153,834 | | |
$ | 526,026 | | |
$ | 2,303,371 | | |
$ | 32,555 | | |
$ | 891,822 | | |
$ | 7,821,570 | | |
$ | 12,219,476 | |
| At June 30, 2023 (Unaudited) | |
$ | 511,966 | | |
$ | 86,313 | | |
$ | 374,476 | | |
$ | 1,684,929 | | |
$ | 32,570 | | |
$ | 1,132,130 | | |
$ | 2,196,024 | | |
$ | 6,018,408 | |
Depreciation expense related to property,
plant and equipment was $1,057,117 and $1,460,187, respectively for the six months ended June 30, 2023 and 2022.
For the six months ended June 30, 2023
and 2022, the Company recorded an impairment loss on robot assets of $1,591,766 and $nil, respectively.
As of June 30, 2023 and 2022, net book
value of robot assets of approximately $695,000 and $1,145,000, respectively were leased out to third parties and the robot assets were
held and used by the lessee.
|
| X |
- DefinitionThe entire disclosure for property, plant and equipment. Reference 1: http://www.xbrl.org/2003/role/disclosureRef
-Name IAS
-Number 16
-IssueDate 2023-01-01
-Section Disclosure
-URI https://taxonomy.ifrs.org/xifrs-link?type=IAS&num=16&code=ifrs-tx-2023-en-r&doctype=Standard&dita_xref=IAS16_g73-79_TI
-URIDate 2023-03-23
| Name: |
ifrs-full_DisclosureOfPropertyPlantAndEquipmentExplanatory |
| Namespace Prefix: |
ifrs-full_ |
| Data Type: |
dtr-types:textBlockItemType |
| Balance Type: |
na |
| Period Type: |
duration |
|
| X |
- References
+ Details
| Name: |
ifrs-full_PropertyPlantAndEquipmentAbstract |
| Namespace Prefix: |
ifrs-full_ |
| Data Type: |
xbrli:stringItemType |
| Balance Type: |
na |
| Period Type: |
duration |
|
v3.23.3
Right-of-Use Assets and Operating Lease Liabilities
|
6 Months Ended |
Jun. 30, 2023 |
|---|
| Right-of-Use Assets and Operating Lease Liabilities [Abstract] |
|
| RIGHT-OF-USE ASSETS AND OPERATING LEASE LIABILITIES |
| 11. |
RIGHT-OF-USE ASSETS AND OPERATING LEASE LIABILITIES |
The carrying amounts of right-of-use assets are
as below:
| | |
2023 | | |
2022 | |
| | |
(Unaudited) | | |
(Unaudited) | |
| Balance at January 1, | |
$ | 4,171,409 | | |
$ | 2,364,993 | |
| New leases | |
| 271,004 | | |
| 804,500 | |
| New leases acquired through business combinations | |
| - | | |
| 167,597 | |
| Depreciation expense | |
| (1,042,981 | ) | |
| (1,095,227 | ) |
| Exchange difference | |
| (75,562 | ) | |
| (108,566 | ) |
| Balance at June 30, | |
$ | 3,323,870 | | |
$ | 2,133,297 | |
Lease liabilities were measured at the
present value of the remaining lease payments, discounted using the lessee’s incremental borrowing rate. The weighted average incremental
borrowing rate applied to new leases during the six months ended June 30, 2023 was 3.52%. The weighted average incremental borrowing rate
applied to new leases during the six months ended June 30, 2022 varies from 3.49% to 5% in different regions.
For the six months ended June 30, 2023
and 2022, interest expense of $58,602 and $41,211 arising from lease liabilities was included in finance costs, respectively. Depreciation
expense related to right-of-use assets was $1,026,316 and $1,064,623, respectively for the six months ended June 30, 2023 and 2022.
|
| X |
- References
+ Details
| Name: |
gfai_RightofUseAssetsAndOperatingLeaseLiabilitiesAbstract |
| Namespace Prefix: |
gfai_ |
| Data Type: |
xbrli:stringItemType |
| Balance Type: |
na |
| Period Type: |
duration |
|
| X |
- DefinitionThe entire disclosure for non-current assets held for sale and discontinued operations. Reference 1: http://www.xbrl.org/2003/role/disclosureRef
-Name IFRS
-Number 5
-IssueDate 2023-01-01
-Section Presentation and disclosure
-URI https://taxonomy.ifrs.org/xifrs-link?type=IFRS&num=5&code=ifrs-tx-2023-en-r&doctype=Standard&dita_xref=IFRS05_g30-42_TI
-URIDate 2023-03-23
| Name: |
ifrs-full_DisclosureOfNoncurrentAssetsHeldForSaleAndDiscontinuedOperationsExplanatory |
| Namespace Prefix: |
ifrs-full_ |
| Data Type: |
dtr-types:textBlockItemType |
| Balance Type: |
na |
| Period Type: |
duration |
|
v3.23.3
Intangible Assets
|
6 Months Ended |
Jun. 30, 2023 |
|---|
| Intangible Assets [Abstract] |
|
| INTANGIBLE ASSETS |
| | |
| | |
| | |
| | |
| | |
| | |
Assets under construction | | |
| | |
| |
| | |
Computer
software | | |
Right-of-use
Platform | | |
Customer
base | | |
Technical
know-how | | |
Security
Surveillance
system | | |
Cash
Management
Systems | | |
Intelligent
Cloud
Platform | | |
Intelligent
Cloud
Platforms | | |
Total | |
| Cost | |
| | |
| | |
| | |
| | |
| | |
| | |
| | |
| | |
| |
| At December 31, 2021 | |
$ | 907,304 | | |
$ | - | | |
$ | - | | |
$ | - | | |
$ | - | | |
$ | - | | |
$ | - | | |
$ | - | | |
$ | 907,304 | |
| Acquisitions through business combinations | |
| - | | |
| 733,311 | | |
| 1,120,688 | | |
| 514,968 | | |
| 1,102,647 | | |
| - | | |
| - | | |
| - | | |
| 3,471,614 | |
| Additions | |
| 1,761 | | |
| - | | |
| | | |
| - | | |
| - | | |
| 81,119 | | |
| 3,000,000 | | |
| | | |
| 3,082,880 | |
| Exchange differences | |
| (49,955 | ) | |
| - | | |
| - | | |
| - | | |
| - | | |
| (3,525 | ) | |
| | | |
| - | | |
| (53,480 | ) |
| At June 30, 2022 (Unaudited) | |
| 859,110 | | |
| 733,311 | | |
| 1,120,688 | | |
| 514,968 | | |
| 1,102,647 | | |
| 77,594 | | |
| 3,000,000 | | |
| - | | |
| 7,408,318 | |
| | |
| | | |
| | | |
| | | |
| | | |
| | | |
| | | |
| | | |
| | | |
| | |
| At December 31, 2022 | |
$ | 887,745 | | |
$ | 673,029 | | |
$ | 1,042,110 | | |
$ | 499,344 | | |
$ | 1,360,898 | | |
$ | 194,495 | | |
$ | 3,000,000 | | |
$ | - | | |
$ | 7,657,621 | |
| Additions | |
| - | | |
| - | | |
| - | | |
| - | | |
| 195,087 | | |
| - | | |
| - | | |
| 1,597,754 | | |
| 1,792,841 | |
| Transfer | |
| - | | |
| - | | |
| - | | |
| - | | |
| - | | |
| - | | |
| (2,821,882 | ) | |
| 2,821,882 | | |
| - | |
| Exchange differences | |
| (17,419 | ) | |
| (31,974 | ) | |
| (49,509 | ) | |
| (23,723 | ) | |
| (306,604 | ) | |
| (3,816 | ) | |
| - | | |
| - | | |
| (433,045 | ) |
| At June 30, 2023 (Unaudited) | |
| 870,326 | | |
| 641,055 | | |
| 992,601 | | |
| 475,621 | | |
| 1,249,381 | | |
| 190,679 | | |
| 178,118 | | |
| 4,419,636 | | |
| 9,017,417 | |
| | |
| | | |
| | | |
| | | |
| | | |
| | | |
| | | |
| | | |
| | | |
| | |
| Accumulated amortization | |
| | | |
| | | |
| | | |
| | | |
| | | |
| | | |
| | | |
| | | |
| | |
| At December 31, 2021 | |
$ | 742,988 | | |
$ | - | | |
$ | - | | |
$ | - | | |
$ | - | | |
$ | - | | |
$ | - | | |
$ | - | | |
$ | 742,988 | |
| Acquisitions through business combinations | |
| - | | |
| - | | |
| - | | |
| - | | |
| 285,433 | | |
| - | | |
| - | | |
| - | | |
| 285,433 | |
| Amortization charged for the period | |
| 25,290 | | |
| 17,951 | | |
| 129,327 | | |
| - | | |
| - | | |
| - | | |
| - | | |
| - | | |
| 172,568 | |
| Exchange differences | |
| (41,944 | ) | |
| | | |
| - | | |
| - | | |
| - | | |
| - | | |
| - | | |
| - | | |
| (41,944 | ) |
| As June 30, 2022 (Unaudited) | |
| 726,334 | | |
| 17,951 | | |
| 129,327 | | |
| - | | |
| 285,433 | | |
| - | | |
| - | | |
| - | | |
| 1,159,045 | |
| | |
| | | |
| | | |
| | | |
| | | |
| | | |
| | | |
| | | |
| | | |
| | |
| At December 31, 2022 | |
$ | 767,168 | | |
$ | 50,477 | | |
$ | 405,868 | | |
$ | 28,405 | | |
$ | 612,560 | | |
$ | - | | |
$ | - | | |
$ | - | | |
$ | 1,864,478 | |
| Amortization charged for the period | |
| 26,139 | | |
| 33,582 | | |
| 201,013 | | |
| 28,346 | | |
| 63,817 | | |
| - | | |
| - | | |
| 182,671 | | |
| 535,568 | |
| Exchange differences | |
| (15,908 | ) | |
| (3,927 | ) | |
| (28,438 | ) | |
| (2,641 | ) | |
| (286,182 | ) | |
| - | | |
| - | | |
| - | | |
| (337,096 | ) |
| As June 30, 2023 (Unaudited) | |
| 777,399 | | |
| 80,132 | | |
| 578,443 | | |
| 54,110 | | |
| 390,195 | | |
| - | | |
| - | | |
| 182,671 | | |
| 2,062,950 | |
| | |
| | | |
| | | |
| | | |
| | | |
| | | |
| | | |
| | | |
| | | |
| | |
| Net book value | |
| | | |
| | | |
| | | |
| | | |
| | | |
| | | |
| | | |
| | | |
| | |
| At June 30, 2022 (Unaudited) | |
$ | 132,776 | | |
$ | 715,360 | | |
$ | 991,361 | | |
$ | 514,968 | | |
$ | 817,214 | | |
$ | 77,594 | | |
$ | 3,000,000 | | |
$ | - | | |
$ | 6,249,273 | |
| At June 30, 2023 (Unaudited) | |
$ | 92,927 | | |
$ | 560,923 | | |
$ | 414,158 | | |
$ | 421,511 | | |
$ | 859,186 | | |
$ | 190,679 | | |
$ | 178,118 | | |
$ | 4,236,965 | | |
$ | 6,954,467 | |
Amortization expense related to intangible
assets was $535,568 and $172,568, respectively for the six months ended June 30, 2023 and 2022.
|
| X |
- References
+ Details
| Name: |
ifrs-full_IntangibleAssetsAndGoodwillAbstract |
| Namespace Prefix: |
ifrs-full_ |
| Data Type: |
xbrli:stringItemType |
| Balance Type: |
na |
| Period Type: |
duration |
|
v3.23.3
Trade and Other payables and Other Current Liabilities
|
6 Months Ended |
Jun. 30, 2023 |
|---|
| Trade and Other payables and Other Current Liabilities [Abstract] |
|
| TRADE AND OTHER PAYABLES AND OTHER CURRENT LIABILITIES |
| 13. |
TRADE AND OTHER PAYABLES AND OTHER CURRENT LIABILITIES |
| | |
As of
June 30,
2023 | | |
As of
December 31,
2022 | |
| | |
(Unaudited) | | |
| |
| Trade payables – third parties | |
$ | 2,596,576 | | |
$ | 2,060,856 | |
| Accrued salaries and bonus | |
| 454,218 | | |
| 515,758 | |
| Accrued customer claims, cash loss and shortage ** | |
| 15,044 | | |
| 57,381 | |
| Trade and other payables | |
$ | 3,065,838 | | |
$ | 2,633,995 | |
| | |
| | | |
| | |
| Output VAT | |
$ | 74,171 | | |
$ | 118,125 | |
| Accrued expenses | |
| 389,318 | | |
| 522,059 | |
| Payroll payable | |
| 1,776,907 | | |
| 979,027 | |
| Other payables | |
| 168,052 | | |
| 289,494 | |
| Deferred revenue | |
| 428,839 | | |
| 568,664 | |
| Other current liabilities | |
$ | 2,837,287 | | |
$ | 2,477,369 | |
| | ** | Includes a provision for penalty for failure to meet performance indicators as stipulated in certain customer contracts for approximately $7,108 and $11,800 as of June 30, 2023 and 2022, respectively. |
|
| X |
- References
+ Details
| Name: |
gfai_TradeAndOtherPayablesAndOtherCurrentLiabilitiesAbstract |
| Namespace Prefix: |
gfai_ |
| Data Type: |
xbrli:stringItemType |
| Balance Type: |
na |
| Period Type: |
duration |
|
| X |
- DefinitionThe disclosure of trade and other payables and other current liabilities.
| Name: |
gfai_TradeAndOtherPayablesAndOtherCurrentLiabilitiesTextBlock |
| Namespace Prefix: |
gfai_ |
| Data Type: |
dtr:textBlockItemType |
| Balance Type: |
na |
| Period Type: |
duration |
|
v3.23.3
Borrowings
|
6 Months Ended |
Jun. 30, 2023 |
|---|
| Borrowings [Abstract] |
|
| BORROWINGS |
| |
|
As of
June 30,
2023 |
|
|
As of
December 31,
2022 |
|
| |
|
(Unaudited) |
|
|
|
|
| Current portion of long-term bank borrowings |
|
$ |
1,039,988 |
|
|
$ |
947,559 |
|
| Current portion of long-term third-party borrowing |
|
|
2,469,721 |
|
|
|
2,234,057 |
|
| Long-term bank borrowings |
|
|
138,212 |
|
|
|
432,179 |
|
| Long-term third-party borrowing |
|
|
13,589,362 |
|
|
|
13,467,639 |
|
| Total borrowings |
|
$ |
17,237,283 |
|
|
$ |
17,081,434 |
|
The Company maintains two borrowings
with one financial institution. The borrowings are used for working capital purposes to support its business operations in Thailand. Those
borrowings carry interest at the rates of 4.72% and 4.69% per annum. The borrowings mature on July 29, 2023 and April 7, 2025. For the
six months ended June 30, 2023 and 2022, the interest expense was $33,394 and $33,745, respectively.
As of June 30, 2023, the Company has
unused bank overdraft availability of approximately $283,000 (THB10 million) and no unused trust receipts availability.
The Company obtained a loan in the principal amount of $13.42 million
from WK Venture Success Limited (“WK Venture”), a third party on April 25, 2018.
The Loan bears interest at 4% and is due on December 31, 2024. In accordance with the terms of the Agreements, the Company is required
to pay the full principal amount of the Loan, along with accrued interest, on December 31, 2024 and the Company is not required to make
monthly payments on this obligation. For the six months ended June 30, 2023 and 2022, interest expense was $411,270 and $400,920, respectively.
The accrued interest portion of this loan is classified as short-term borrowing and the principal portion of this loan is classified as
long-term borrowing. On September 28, 2023, WK Venture agreed to convert the principal and accrued interest of this loan in an aggregate
amount of $15,914,615 at the conversion price of $5.40 into restricted ordinary shares of the Company.
|
| X |
- References
+ Details
| Name: |
ifrs-full_BorrowingsAbstract |
| Namespace Prefix: |
ifrs-full_ |
| Data Type: |
xbrli:stringItemType |
| Balance Type: |
na |
| Period Type: |
duration |
|
v3.23.3
Convertible Note Payable
|
6 Months Ended |
Jun. 30, 2023 |
|---|
| Convertible Note Payable [Abstract] |
|
| CONVERTIBLE NOTE PAYABLE |
| 15. |
CONVERTIBLE NOTE PAYABLE |
On October
25, 2022, the Company entered into a securities purchase agreement with Streeterville Capital, LLC ( “CVP”), pursuant to which
the Company issued CVP an unsecured convertible promissory note on October 25, 2022 in the original principal amount of $1,707,500.00
(the “Note”), convertible into the Company’s ordinary shares.
The Note bears simple interest at a
rate of 8% per annum. All outstanding principal and accrued interest on the Note will become due and payable on the maturity date, which
is twelve months after the purchase price of the Note is delivered by Investor to the Company. Subject to the occurrence of any triggering
events as defined in the Note, the Investor shall have the right to increase the balance of the Note by 5% or 10%. The Company may pay
all or any portion of the amount owed earlier than it is due; provided that in the event the Company elects to prepay all or any portion
of the outstanding balance, the Company shall pay to the Investor 120% of the portion of the outstanding balance the Company elects to
prepay. Early payments of less than all principal, fees and interest outstanding will not, unless agreed to by Investor in writing, relieve
the Company of the Company’s remaining obligations hereunder. On April 17, 2023, CVP delivered to
the Company a conversion notice informing the Company that CVP had elected to convert a portion of the Note balance $1,238,400 at the
conversion price of $7.20 into restricted ordinary shares of the Company. In connection with this conversion, the Company issued 172,000
restricted ordinary shares to CVP on April 19, 2023. As of April 17, 2023, the date of conversion notice, $534,744 remained outstanding
under the Note. For the six months ended June 30, 2023, the interest expense was $65,644.
|
| X |
- References
+ Details
| Name: |
gfai_ConvertibleNotePayableAbstract |
| Namespace Prefix: |
gfai_ |
| Data Type: |
xbrli:stringItemType |
| Balance Type: |
na |
| Period Type: |
duration |
|
| X |
- DefinitionThe disclosure of trade and other payables. [Refer: Trade and other payables] Reference 1: http://www.xbrl.org/2009/role/commonPracticeRef
-Name IAS
-Number 1
-IssueDate 2023-01-01
-Paragraph 10
-Subparagraph e
-URI https://taxonomy.ifrs.org/xifrs-link?type=IAS&num=1&code=ifrs-tx-2023-en-r&anchor=para_10_e&doctype=Standard
-URIDate 2023-03-23
| Name: |
ifrs-full_DisclosureOfTradeAndOtherPayablesExplanatory |
| Namespace Prefix: |
ifrs-full_ |
| Data Type: |
dtr-types:textBlockItemType |
| Balance Type: |
na |
| Period Type: |
duration |
|
v3.23.3
Finance Lease Liabilities
|
6 Months Ended |
Jun. 30, 2023 |
|---|
| Finance Lease Liabilities [Abstract] |
|
| FINANCE LEASE LIABILITIES |
| 16. |
FINANCE LEASE LIABILITIES |
| | |
As of
June 30,
2023 | | |
As of
December 31,
2022 | |
| | |
(Unaudited) | | |
| |
| Current portion | |
$ | 200,383 | | |
$ | 398,136 | |
| Non-current portion | |
| 229,747 | | |
| 233,550 | |
| Finance lease liabilities | |
$ | 430,130 | | |
$ | 631,686 | |
For the six months ended June 30, 2023
and 2022, interest expense was $15,987 and $30,942, respectively.
The minimum lease payments under finance
lease agreements are as follows:
| | |
As of
June 30,
2023 | | |
As of
December 31,
2022 | |
| | |
(Unaudited) | | |
| |
| Within 1 year | |
$ | 212,173 | | |
$ | 423,514 | |
| After 1 year but within 5 years | |
| 248,490 | | |
| 253,448 | |
| Less: Finance charges | |
| (30,533 | ) | |
| (45,276 | ) |
| Present value of finance lease liabilities, net | |
$ | 430,130 | | |
$ | 631,686 | |
Finance lease assets comprise primarily
vehicles and office equipment as follow:
| | |
As of
June 30,
2023 | | |
As of
December 31,
2022 | |
| | |
(Unaudited) | | |
| |
| Cost | |
$ | 1,540,416 | | |
$ | 1,571,075 | |
| Less: Accumulated depreciation | |
| (618,097 | ) | |
| (564,844 | ) |
| Net book value | |
$ | 922,319 | | |
$ | 1,006,231 | |
|
| X |
- DefinitionDisclosure of finance lease liabilities.
| Name: |
gfai_FinanceLeaseLiabilitiesTextBlock |
| Namespace Prefix: |
gfai_ |
| Data Type: |
dtr:textBlockItemType |
| Balance Type: |
na |
| Period Type: |
duration |
|
| X |
- References
+ Details
| Name: |
ifrs-full_LeaseLiabilitiesAbstract |
| Namespace Prefix: |
ifrs-full_ |
| Data Type: |
xbrli:stringItemType |
| Balance Type: |
na |
| Period Type: |
duration |
|
v3.23.3
Taxation
|
6 Months Ended |
Jun. 30, 2023 |
|---|
| Taxation [Abstract] |
|
| TAXATION |
Value added tax (“VAT”)
GF Cash (CIT) and AI R&I are subsidiaries
operating in Thailand, which are subject to a statutory VAT of 7% for services in Thailand. Shenzhen GFAI, Guangzhou GFAI and Beijing
Wanjia are subsidiaries operating in the PRC, which are subject to a statutory VAT of 13% for goods delivered and rental provided, 6%
for services provided and 9% for construction projects in the PRC. The output VAT is charged to customers who receive services from the
Company and the input VAT is paid when the Company purchases goods and services from its vendors. The input VAT can be offset against
the output VAT. The VAT payable is presented on the balance sheets when input VAT is less than the output VAT. A recoverable balance is
presented on the balance sheets when input VAT is larger than the output VAT. Income tax
Current income tax is provided on the
basis of net income for financial reporting purposes, adjusted for income and expense items which are not assessable or deductible for
income tax purposes, in accordance with the regulations of the relevant tax jurisdictions. Deferred income tax is accounted for using
an asset and liability method. Under this method, deferred income tax is recognized for the tax consequences of temporary differences
by applying enacted statutory rates applicable to future years to differences between the financial statement carrying amounts and the
tax bases of existing assets and liabilities. The tax base of an asset or liability is the amount attributed to that asset or liability
for tax purposes. The effect on deferred tax of a change in tax rates is recognized in the consolidated statements of profit or loss in
the period of change. A valuation allowance is provided to reduce the amount of deferred tax assets if it is considered more likely than
not that some portion of, or all of the deferred tax assets will not be realized.
The Company offsets deferred tax assets
and deferred tax liabilities if and only if it has a legally enforceable right to set off current tax assets and current tax liabilities
and the deferred tax assets and deferred tax liabilities relate to income tax levied by the same taxation authority on either the same
taxable entity or different taxable entities which intend either to settle current tax liabilities and assets on a net basis, or to realize
the assets and settle the liabilities simultaneously, in each future period in which significant amounts of deferred tax liabilities or
assets are expected to be settled or recovered. During the six months ended June 30, 2023 and 2022, the Company made a valuation allowance
of $874,431 and $nil on the portion of deferred tax assets not expected to be realized.
|
| X |
- References
+ Details
| Name: |
gfai_TaxationAbstract |
| Namespace Prefix: |
gfai_ |
| Data Type: |
xbrli:stringItemType |
| Balance Type: |
na |
| Period Type: |
duration |
|
v3.23.3
Provision for Employee Benefits
|
6 Months Ended |
Jun. 30, 2023 |
|---|
| Provision for Employee Benefits [Abstract] |
|
| PROVISION FOR EMPLOYEE BENEFITS |
| 18. |
PROVISION FOR EMPLOYEE BENEFITS |
Prior to March 30, 2022, the Company
had only one retired benefit plan (“Plan A”), on March 30, 2022, the Company established an additional retired benefit plan
(“Plan B”). Both plans are based on the requirements of the Thailand Labor Protection Act B.E.2541 (1988) to provide retirement
benefits to employees based on pensionable remuneration and length of service which are considered as unfunded. The plan asset is unfunded
and the Company will pay benefits when needed.
| | |
Provision for
employee benefits | |
| | |
2023 | | |
2022 | |
| | |
(Unaudited) | | |
(Unaudited) | |
| Defined benefit obligations at January 1, | |
$ | 4,849,614 | | |
$ | 5,819,132 | |
| Estimate for the six months period* | |
| (74,552 | ) | |
| (348,418 | ) |
| Defined benefit obligations at June 30, | |
$ | 4,775,062 | | |
$ | 5,470,714 | |
| * | The estimate represents the difference between the Company’s estimated defined benefit obligations based on employees’ past service and expected future salary at the beginning of the fiscal year and the end of the six months period. |
|
| X |
- References
+ Details
| Name: |
ifrs-full_ClassesOfEmployeeBenefitsExpenseAbstract |
| Namespace Prefix: |
ifrs-full_ |
| Data Type: |
xbrli:stringItemType |
| Balance Type: |
na |
| Period Type: |
duration |
|
| X |
- DefinitionThe entire disclosure for employee benefits. Reference 1: http://www.xbrl.org/2003/role/disclosureRef
-Name IAS
-Number 19
-IssueDate 2023-01-01
-Section Scope
-URI https://taxonomy.ifrs.org/xifrs-link?type=IAS&num=19&code=ifrs-tx-2023-en-r&doctype=Standard&dita_xref=IAS19_g2-7_TI
-URIDate 2023-03-23
| Name: |
ifrs-full_DisclosureOfEmployeeBenefitsExplanatory |
| Namespace Prefix: |
ifrs-full_ |
| Data Type: |
dtr-types:textBlockItemType |
| Balance Type: |
na |
| Period Type: |
duration |
|
v3.23.3
Shareholders’ Equity
|
6 Months Ended |
Jun. 30, 2023 |
|---|
| Shareholders’ Equity [Abstract] |
|
| SHAREHOLDERS’ EQUITY |
On January 31, 2023, the Company completed
a 1 for 40 share consolidation of its authorized and issued ordinary shares whereby every forty shares were consolidated into one share.
In addition, the par value of each ordinary share increased from $0.003 to $0.12. Immediately following the completion of the share consolidation,
the Company increased its authorized ordinary shares from 7,500,000 ordinary shares to 300,000,000 ordinary shares.
On February 17, 2023, a total of 2,339
fractional shares were canceled as a result of the share consolidation.
In connection with the restricted ordinary
shares issued on June 16, 2022 as a deposit to acquire 100% of the equity interests in seven Kewei Group companies, such acquisition was
terminated on September 13, 2022 (Note 22) and on February 13, a total of 243,000 shares were returned and cancelled. In connection with an asset purchase
agreement entered between the Company and Shenzhen Kewei Robot Technology Co., Limited (“Shenzhen Kewei”) on December
21, 2022 to purchase certain of Shenzhen Kewei’s robot-related business assets in China (Note 1), on March 1, 2023, a total of 262,500
restricted ordinary shares were issued to the shareholders of Shenzhen Kewei.
In connection with the conversion of
the convertible note with Streeterville Capital, LLC (“CVP”) (Note 15), the Company issued 172,000 restricted ordinary shares
to CVP on April 19, 2023.
A total of 128,901 warrants were exercised
during the six months ended June 30, 2023. No warrants were exercised subsequently from July 1, 2023 to the date of this filing. As of
June 30, 2023, we have an aggregate of 2,013,759 warrants issued and outstanding. On March 8, 2023, the Company issued a Notice regarding
Adjustment of Exercise Price (for Public Warrants) after share consolidation to the Company’s public warrant holders. As a result
of the share consolidation, the exercise price under the public warrant was proportionately increased from $0.16 to $6.40, the exercise
price under the private warrant was proportionately increased from $0.18 to $7.20. If any holder exercises one warrant, one-40th (1/40)
ordinary share will be received in cash (by Cash in Lieu), holders must exercise at least 40 warrants to receive 1 ordinary share.
On May 5, 2023, the Company completed
an underwritten public offering (“CMPO 1”) to issue 1,720,430 ordinary shares and an additional 258,064 ordinary shares for
the exercise of an over-allotment option at the time of the closing at a public offering price of $4.65 per share for aggregate gross
proceeds of approximately $9.2 million. On May 12, 2023, the Company completed another underwritten public offering (“CMPO 2”) to issue 2,580,600 ordinary shares and an additional 387,090 ordinary shares for the exercise of an over-allotment
option at the time of the closing at a public offering price of $4.65 per share for aggregate gross proceeds of approximately $13.8 million.
|
| X |
- References
+ Details
| Name: |
gfai_StockholdersEquityDisclosureTextBlock |
| Namespace Prefix: |
gfai_ |
| Data Type: |
dtr:textBlockItemType |
| Balance Type: |
na |
| Period Type: |
duration |
|
| X |
- References
+ Details
| Name: |
ifrs-full_EquityAbstract |
| Namespace Prefix: |
ifrs-full_ |
| Data Type: |
xbrli:stringItemType |
| Balance Type: |
na |
| Period Type: |
duration |
|
v3.23.3
Selling, Distribution and Administrative Expenses
|
6 Months Ended |
Jun. 30, 2023 |
|---|
| Selling, Distribution and Administrative Expenses [Abstract] |
|
| SELLING, DISTRIBUTION AND ADMINISTRATIVE EXPENSES |
| 20. |
SELLING, DISTRIBUTION AND ADMINISTRATIVE EXPENSES |
| | |
For the six months ended
June 30, | |
| | |
2023 | | |
2022 | |
| | |
(Unaudited) | | |
(Unaudited) | |
| Staff expense | |
$ | 3,602,127 | | |
$ | 2,988,331 | |
| Rental expense | |
| 345,026 | | |
| 77,999 | |
| Depreciation and amortization expense | |
| 1,251,359 | | |
| 1,176,705 | |
| Utilities expense | |
| 53,015 | | |
| 30,021 | |
| Travelling and entertainment expense | |
| 135,186 | | |
| 216,633 | |
| Marketing expense | |
| 150,203 | | |
| 228,054 | |
| Professional fees | |
| 774,553 | | |
| 1,262,085 | |
| Repairs and maintenance | |
| 35,298 | | |
| 26,835 | |
| Employee benefits | |
| 29,316 | | |
| 228,506 | |
| Research and development expense | |
| 95,322 | | |
| 68,946 | |
| Other expenses** | |
| 510,255 | | |
| 673,881 | |
| | |
$ | 6,981,660 | | |
$ | 6,977,996 | |
| ** | Other
expenses mainly comprised of office expenses, stamp duties, training costs, transportation costs for robots, etc. |
|
| X |
- DefinitionThe disclosure of general and administrative expenses. [Refer: Administrative expenses] Reference 1: http://www.xbrl.org/2009/role/commonPracticeRef
-Name IAS
-Number 1
-IssueDate 2023-01-01
-Paragraph 10
-Subparagraph e
-URI https://taxonomy.ifrs.org/xifrs-link?type=IAS&num=1&code=ifrs-tx-2023-en-r&anchor=para_10_e&doctype=Standard
-URIDate 2023-03-23
| Name: |
ifrs-full_DisclosureOfGeneralAndAdministrativeExpenseExplanatory |
| Namespace Prefix: |
ifrs-full_ |
| Data Type: |
dtr-types:textBlockItemType |
| Balance Type: |
na |
| Period Type: |
duration |
|
| X |
- References
+ Details
| Name: |
ifrs-full_SellingGeneralAndAdministrativeExpenseAbstract |
| Namespace Prefix: |
ifrs-full_ |
| Data Type: |
xbrli:stringItemType |
| Balance Type: |
na |
| Period Type: |
duration |
|
v3.23.3
Legal Reserve
|
6 Months Ended |
Jun. 30, 2023 |
|---|
| Legal Reserve [Abstract] |
|
| LEGAL RESERVE |
Thailand
Under the provisions of the Civil and
Commercial Code, GF Cash (CIT) is required to set aside as a legal reserve at least 5% of the profits arising from the business of the
Company at each dividend distribution until the reserve is at least 10% of the registered share capital. The legal reserve is non-distributable.
The Company reserve has met the legal reserve requirement of $223,500 as of June 30, 2023 and December 31, 2022. The
PRC
Pursuant to
the laws applicable to the PRC’s Foreign Investment Enterprises, the Company must make appropriations from after-tax profit to non-distributable
reserve funds. Subject to certain cumulative limits, the general reserve requires annual appropriations of 10% of after-tax profits as
determined under the PRC laws and regulations at each year-end until the balance reaches 50% of the PRC entity registered capital; the
other reserve appropriations are at the Company’s discretion. These reserves can only be used for specific purposes of enterprise
expansion and are not distributable as cash dividends. For the six months ended June 30, 2023, the Company did not accrue any legal reserve.
|
| X |
- References
+ Details
| Name: |
gfai_LegalReserveAbstract |
| Namespace Prefix: |
gfai_ |
| Data Type: |
xbrli:stringItemType |
| Balance Type: |
na |
| Period Type: |
duration |
|
| X |
- DefinitionThe disclosure of reserves within equity. [Refer: Other reserves [member]] Reference 1: http://www.xbrl.org/2003/role/disclosureRef
-Name IAS
-Number 1
-IssueDate 2023-01-01
-Paragraph 79
-Subparagraph b
-URI https://taxonomy.ifrs.org/xifrs-link?type=IAS&num=1&code=ifrs-tx-2023-en-r&anchor=para_79_b&doctype=Standard
-URIDate 2023-03-23
| Name: |
ifrs-full_DisclosureOfReservesAndOtherEquityInterestExplanatory |
| Namespace Prefix: |
ifrs-full_ |
| Data Type: |
dtr-types:textBlockItemType |
| Balance Type: |
na |
| Period Type: |
duration |
|
v3.23.3
Related Party Transactions
|
6 Months Ended |
Jun. 30, 2023 |
|---|
| Related Party Transactions [Abstract] |
|
| RELATED PARTY TRANSACTIONS |
| 22. |
RELATED PARTY TRANSACTIONS |
The principal related party balances
as of June 30, 2023 and December 31, 2022 are as follows:
Amounts due from related parties:
| | |
| |
As of
June 30,
2023 | | |
As of
December 31,
2022 | |
| | |
| |
(Unaudited) | | |
| |
| Guardforce TH Group Company Limited | |
(c) | |
$ | 1,749 | | |
$ | 894 | |
| Guardforce AI Technology Limited | |
(c) | |
| 423 | | |
| 423 | |
| Guardforce AI Service Limited | |
(c) | |
| 423 | | |
| 423 | |
| Shenzhen Intelligent Guardforce Robot Technology Co., Limited | |
(a) | |
| 5,544,156 | | |
| 7,312,883 | |
| Shareholders’ of Shenzhen Kewei Robot Technology Co., Limited and its subsidiaries | |
(b) | |
| 2,160,000 | | |
| 7,020,000 | |
| Nanjing Zhongzhi Yonghao Robot Co., Ltd. | |
(c) | |
| - | | |
| 7,297 | |
| Nanchang Zongkun Intelligent Technology Co., Ltd. | |
(c) | |
| - | | |
| 7,310 | |
| Sichuan Qiantu Guardforce Robot Technology Co., Ltd. | |
(c) | |
| - | | |
| 3,777 | |
| Shanghai Nanshao Fire Engineering and Equipment Co., Ltd. | |
(c) | |
| - | | |
| 144,737 | |
| CSF Mingda Technology Co., Ltd | |
(c) | |
| 9,752 | | |
| 11,129 | |
| | |
| |
$ | 7,716,503 | | |
$ | 14,508,873 | |
| (a) | Amounts due from Shenzhen Intelligent Guardforce Robot Technology Co., Limited (“CIOT”) comprised of $4,481,346 representing prepayments for the purchase of robots from a related party and $1,062,809 receivables in connection with the robots returned to a related party. On May 25, 2023, following the repayment plan provided by Tu Jingyi (“Mr. Tu”) to the Company on March 1, 2023 in connection with the settlement of the outstanding balance of the receivables due from the related parties under Mr. Tu’s control, the Company entered into an agreement with Mr. Tu, Shenzhen Intelligent Guardforce Robot Technology Co., Limited (“CIOT”), Shenzhen Kewei Robot Technology Co., Limited and its subsidiaries (“Shenzhen Kewei”) and Guardforce Holdings (HK) Limited (“GF Holdings”) to legally enforce the right to set-off certain recognized related party receivable and payable amounts on a net basis (“Netting Arrangement”). Mr. Tu agreed to waive the Company’s repayment of the borrowings from Guardforce Holdings (HK) Limited in an aggregate amount of $1,500,000 to offset the same amount of related party receivables with CIOT. As of the date of this filing, the Company is negotiating with Mr. Tu on the settlement of the second installment of $1,500,000 which is due on September 30, 2023 in accordance with the repayment plan. |
| (b) | On May 24, 2022, the Company entered into a securities purchase agreement with Shenzhen Kewei Robot Technology Co., Limited (“Shenzhen Kewei”) to acquire 100% of the equity interests in seven Kewei Group companies from Shenzhen Kewei. The acquisition purchase price of $21,600,000 in a mix of cash (10%) and restricted ordinary shares of the Company (90%) were fully paid during the year ended December 31, 2022. Based on the market share price at the issuance date, the equity portion of the deposit paid for business acquisitions was valued at $4,860,000. | On September 13, 2022, the Company terminated the securities purchase agreement, the cash paid to Shenzhen Kewei was agreed to be refunded and the shares issued to Shenzhen Kewei was agreed to be returned. On February 13, 2023, 243,000 restricted ordinary shares amounting to $4,860,000 were returned to and canceled by the Company.
On March 31, 2023, shareholders’ of Shenzhen Kewei repaid RMB2,000,000 (approximately $291,000) to the Company. On May 25, 2023, an amount of $1,500,000 due was offset with the borrowings from Guardforce Holdings (HK) Limited under the Netting Arrangement.
| (c) | Amounts due from these related parties represent business advances for operational purposes. |
Amounts due to related parties:
| | |
| |
As of
June 30,
2023 | | |
As of
December 31,
2022 | |
| | |
| |
(Unaudited) | | |
| |
| Tu Jingyi | |
(a) | |
$ | 220,808 | | |
$ | 210,028 | |
| Guardforce Holdings (HK) Limited | |
(b) | |
| 423,184 | | |
| 394,016 | |
| Guardforce Security (Thailand) Company Limited | |
(c) | |
| 68,897 | | |
| 77,413 | |
| Shenzhen Kewei Robot Technology Co., Limited and its subsidiaries | |
(d) | |
| 2,569,448 | | |
| 2,403,555 | |
| Shenzhen Zhongzhi Yonghao Robot Co., Ltd. | |
| |
| 376,391 | | |
| 394,151 | |
| Shenzhen Qianban Technology Co., Ltd. | |
(d) | |
| - | | |
| 99,733 | |
| Guardforce Security Service (Shanghai) Co., Ltd. | |
(e) | |
| 34,465 | | |
| 267,764 | |
| Shenzhen Guardforce Qiyun Technology Co., Ltd. | |
(e) | |
| - | | |
| 189 | |
| Shanghai Yongan Security Alarm System Co., Ltd. | |
(e) | |
| 9,650 | | |
| 21,842 | |
| Guardforce Aviation Security Company Limited | |
(c) | |
| 195 | | |
| - | |
| | |
| |
$ | 3,703,038 | | |
$ | 3,868,691 | |
| (a) | Amounts due to Tu Jingyi represented interest accrued on the respective loans. |
| (b) | Amounts due to Guardforce Holdings (HK) Limited comprised of $195,398 advances made and $227,786 accrued interests on the loans. |
| (c) | Amounts due to Guardforce Security (Thailand) Company Limited and Guardforce Aviation Security Company Limited represent accounts payable for services provided by a related party. |
| (d) | Amounts due to Shenzhen Kewei Robot Technology Co., Limited and its subsidiaries comprised of $2,590,621 representing trade payables for the purchase of robots from a related party and $22,173 expense paid on behalf by a related party. |
| (e) | Amounts due to related parties represent business advances for operational purposes. | Short-term borrowings from related parties:
| | |
| |
As of
June 30,
2023 | | |
As of
December 31,
2022 | |
| | |
| |
(Unaudited) | | |
| |
| Guardforce Holdings (HK) Limited | |
(a) | |
$ | 1,666,846 | | |
$ | 3,148,500 | |
Long-term borrowings from related parties:
| | |
| |
As of
June 30,
2023 | | |
As of
December 31,
2022 | |
| | |
| |
(Unaudited) | | |
| |
| Guardforce Holdings (HK) Limited | |
(b) | |
$ | - | | |
$ | 18,346 | |
| Tu Jingyi | |
(c) | |
| 1,437,303 | | |
| 1,437,303 | |
| | |
| |
$ | 1,437,303 | | |
$ | 1,455,649 | |
| (a) | On April 17, 2020, the Company borrowed $2,735,000 from Guardforce Holdings (HK) Limited. As of December 31, 2022, the outstanding balance of this loan was $2,735,000. The loan is unsecured and bears an interest rate at 2%. The loan was due on April 16, 2023 and was verbally agreed to extend with the same terms and conditions until this loan is scheduled to be settled in late 2023. For the six months ended June 30, 2023 and 2022, interest expense on this loan was $25,570 and $27,350, respectively. This loan is classified as short-term borrowing from a related party. On May 25, 2023, the principal amount of this loan of $1,068,154 was settled under the Netting Arrangement. On September 9, 2020, the Company borrowed $413,500 from Guardforce Holdings (HK) Limited. The loan is unsecured and it bears interest at 2%. The loan is due on September 8, 2023. For the six months ended June 30, 2023 and 2022, interest expense on this loan was $3,446 and $4,135, respectively. On May 25, 2023, the principal amount of this loan of $413,500 was settled under the Netting Arrangement. |
| (b) | On December 31, 2019, the Company borrowed $1,499,998 from Guardforce Holdings (HK) Limited. As of December 31, 2022, the outstanding balance of this loan was $18,346. The loan is unsecured and it bears an interest rate of 2%. The loan is due on June 30,2025. For the six months ended June 30, 2023 and 2022, interest expense on this loan was $153 and $770, respectively. On May 25, 2023, the principal amount of this loan of $18,346 was settled under the Netting Arrangement. |
| (c) | On September 1, 2018, the Company entered into an agreement with Tu Jingyi whereby Tu Jingyi loaned $1,437,303 (RMB10 million) to the Company. The loan is unsecured with an interest rate at 1.5%. The loan is due on June 30, 2025. For the six months ended June 30, 2023 and 2022, interest expense on this loan was $10,780 and $nil, respectively. This loan is classified as long-term borrowing from a related party. |
The principal related party
transactions for the six months ended June 30, 2023 and 2022 are as follows:
Related party transactions:
| | |
| |
For the six months ended
June 30, | |
| Nature | |
| |
2023 | | |
2022 | |
| | |
| |
(Unaudited) | | |
(Unaudited) | |
| Service/ Products received from related parties: | |
| |
| | |
| |
| Guardforce Security (Thailand) Company Limited | |
(a) | |
$ | 68,897 | | |
$ | 67,864 | |
| Guardforce Aviation Security Company Limited | |
(b) | |
| 600 | | |
| - | |
| Shenzhen Intelligent Guardforce Robot Technology Co., Limited – Purchases | |
(c) | |
| - | | |
| 7,008,322 | |
| Shenzhen Kewei Robot Technology Co., Ltd. – Purchases | |
(c) | |
| 141,569 | | |
| 844,255 | |
| Shenzhen Kewei Robot Technology Co., Limited – ICP | |
(d) | |
| - | | |
| 3,000,000 | |
| | |
| |
$ | 211,066 | | |
$ | 10,920,441 | |
| | |
| |
| | | |
| | |
| Service/ Products delivered to related parties: | |
| |
| | | |
| | |
| GF Technovation Company Limited – Sales | |
(e) | |
$ | - | | |
$ | 134,123 | |
Nature of transactions:
| (a) | Guardforce Security (Thailand) Company Limited provided security guard services to the Company; |
| (b) | Guardforce Aviation Security Company Limited provided escort services to the Company; | | | | | (c) | The Company purchased robots from Shenzhen Intelligent Guardforce Robot Technology Co., Limited and Shenzhen Kewei Robot Technology Co., Ltd. During the six months ended June 30, 2023, the Company purchased 207 robots amounting to $229,162 through an asset purchase agreement (Note 1) and $50,927 through placing standard purchase orders. In addition, 124 robots amounting to $138,520 were returned by the Company. | | | | | (d) | On February 8, 2022, the Company entered into a Commissioned Development Agreement with Shenzhen Kewei Robot Technology Co., Limited (“Shenzhen Kewei”) for the development of a robotics management platform named GFAI Intelligent Cloud Platform V2.0 (“ICP”). The contract amount was $3,000,000 which was paid as a one-time lump sum payment after the execution of the agreement. | | | | | (e) | The Company sold robots and spare parts to GF Technovation Company Limited. |
|
v3.23.3
Consolidated Segment Data
|
6 Months Ended |
Jun. 30, 2023 |
|---|
| Consolidated Segment Data [Abstract] |
|
| CONSOLIDATED SEGMENT DATA |
| 23. |
CONSOLIDATED SEGMENT DATA |
Selected information by segment is presented in the following
tables for the six months ended June 30, 2023 and 2022:
| | |
For the six months ended
June 30, | |
| Revenues(1) | |
2023 | | |
2022 | |
| | |
(Unaudited) | | |
(Unaudited) | |
| Secured logistics | |
$ | 15,943,156 | | |
$ | 15,960,547 | |
| Information security | |
| 407,689 | | |
| 262,934 | |
| Robotics AI solutions | |
| 440,229 | | |
| 719,041 | |
| General security solutions | |
| 1,622,218 | | |
| - | |
| | |
$ | 18,413,292 | | |
$ | 16,942,522 | |
| (1) | Revenue
excludes intercompany sales. |
| | |
For the six months ended
June 30, | |
| Operating loss | |
2023 | | |
2022 | |
| | |
(Unaudited) | | |
(Unaudited) | |
| Secured logistics | |
$ | (1,101,369 | ) | |
$ | (962,310 | ) |
| Information security | |
| (311,916 | ) | |
| (19,041 | ) |
| Robotics AI solutions | |
| (8,320,982 | ) | |
| (1,977,324 | ) |
| General security solutions | |
| (542,569 | ) | |
| - | |
| Corporate and others (2) | |
| (1,607,373 | ) | |
| (2,590,961 | ) |
| Operating loss | |
| (11,884,209 | ) | |
| (5,549,636 | ) |
| Total other income from five segments | |
| 77,765 | | |
| 46,859 | |
| Foreign exchange losses, net: | |
| | | |
| | |
| - Secured logistics | |
| (598,053 | ) | |
| (751,622 | ) |
| - Information security | |
| 432 | | |
| 44 | |
| - Robotics AI solutions | |
| 13,150 | | |
| 5,973 | |
| - Corporate and others | |
| 810 | | |
| (154 | ) |
| Finance costs: | |
| | | |
| | |
| - Secured logistics | |
| (423,440 | ) | |
| (405,365 | ) |
| - Information security | |
| (6,589 | ) | |
| (1,648 | ) |
| - Corporate and others | |
| (154,868 | ) | |
| (3,848 | ) |
| Loss before income tax | |
| (12,975,002 | ) | |
| (6,659,397 | ) |
| Provision for income tax (expense) benefit | |
| (874,431 | ) | |
| 320,183 | |
| Net loss for the period | |
| (13,849,433 | ) | |
| (6,339,214 | ) |
| Less: Loss attributable to the non-controlling interest | |
| 30,214 | | |
| 32,392 | |
| Net loss attributable to equity holders of the Company | |
$ | (13,819,219 | ) | |
$ | (6,306,822 | ) |
| (2) | Includes
non-cash compensation, legal and professional fees and consultancy fees for the Company. |
For the six months ended June 30, 2023 and 2022, non-cash
compensation of $nil and $252,095, respectively was solely attributable the Corporate and others segment. Depreciation and amortization by segment for six
months ended June 30, 2023 and 2022 are as follows:
| | |
For the six months ended
June 30, | |
| Depreciation and amortization: | |
2023 | | |
2022 | |
| | |
(Unaudited) | | |
(Unaudited) | |
| Secured logistics | |
$ | 1,570,069 | | |
$ | 1,887,059 | |
| Robotics AI solutions | |
| 741,548 | | |
| 810,319 | |
| General security solutions | |
| 124,713 | | |
| - | |
| | |
$ | 2,436,330 | | |
$ | 2,697,378 | |
Total assets by segment as of June 30, 2023 and
December 31, 2022 are as follows:
| Total assets | |
As of
June 30,
2023 | | |
As of
December 31,
2022 | |
| | |
(Unaudited) | | |
(Audited) | |
| Secured logistics | |
$ | 22,854,857 | | |
$ | 25,315,845 | |
| Information security | |
| 199,259 | | |
| 615,517 | |
| Robotics AI solutions | |
| 17,330,745 | | |
| 23,577,547 | |
| General security solutions | |
| 2,296,882 | | |
| 4,260,811 | |
| Corporate and others | |
| 21,412,959 | | |
| 7,397,254 | |
| | |
$ | 64,094,702 | | |
$ | 61,166,974 | |
Total non-current assets by geographical segment
as of December 31, 2022 and 2021 are as follows:
| Total non-current assets | |
As of
June 30,
2023 | | |
As of
December 31,
2022 | |
| | |
(Unaudited) | | |
(Audited) | |
| The PRC (including Hong Kong and Macau) | |
$ | 11,762,228 | | |
$ | 11,234,176 | |
| Thailand | |
| 9,774,623 | | |
| 14,223,714 | |
| Other countries | |
| 403,977 | | |
| 446,020 | |
| | |
$ | 21,940,828 | | |
$ | 25,903,910 | |
Total liabilities by segment as of June 30, 2023
and December 31, 2022 are as follows:
| Total liabilities | |
As of
June 30,
2023 | | |
As of
December 31,
2022 | |
| | |
(Unaudited) | | |
(Audited) | |
| Secured logistics | |
$ | 12,850,116 | | |
$ | 28,789,053 | |
| Information security | |
| 143,919 | | |
| 238,229 | |
| Robotics AI solutions | |
| 4,477,486 | | |
| 4,580,740 | |
| General security solutions | |
| 1,425,037 | | |
| 1,661,469 | |
| Corporate and others | |
| 20,195,051 | | |
| 6,765,181 | |
| | |
$ | 39,091,609 | | |
$ | 42,034,672 | |
|
| X |
- References
+ Details
| Name: |
gfai_ConsolidatedSegmentDataAbstract |
| Namespace Prefix: |
gfai_ |
| Data Type: |
xbrli:stringItemType |
| Balance Type: |
na |
| Period Type: |
duration |
|
| X |
- DefinitionThe entire disclosure for operating segments. Reference 1: http://www.xbrl.org/2003/role/disclosureRef
-Name IFRS
-Number 8
-IssueDate 2023-01-01
-Section Disclosure
-URI https://taxonomy.ifrs.org/xifrs-link?type=IFRS&num=8&code=ifrs-tx-2023-en-r&doctype=Standard&dita_xref=IFRS08_g20-24_TI
-URIDate 2023-03-23
| Name: |
ifrs-full_DisclosureOfEntitysReportableSegmentsExplanatory |
| Namespace Prefix: |
ifrs-full_ |
| Data Type: |
dtr-types:textBlockItemType |
| Balance Type: |
na |
| Period Type: |
duration |
|
v3.23.3
Commitments and Contingencies
|
6 Months Ended |
Jun. 30, 2023 |
|---|
| Commitments and Contingencies [Abstract] |
|
| COMMITMENTS AND CONTINGENCIES |
| 24. |
COMMITMENTS AND CONTINGENCIES |
Executives/directors agreements
The Company has several employment agreements
with executives and directors with the latest expiring in August 2025. All agreements provide for automatic renewal options with varying
terms of one year or three years unless terminated by either party. Future payments for employment agreements as of June 30, 2023, are
as follows:
| | |
Amount | |
| Twelve months ending June 30: | |
| |
| 2024 | |
$ | 875,472 | |
| 2025 | |
| 740,000 | |
| 2026 | |
| 118,333 | |
| Total minimum payment required | |
$ | 1,733,805 | |
Contracted expenditure commitments
The Company’s contracted expenditures
commitments as of June 30, 2023 but not provided in the interim condensed consolidated financial statements are as follows:
| | |
| |
Payments Due by Period | |
| | |
| |
| | |
Less than | | |
1-3 | | |
4-5 | | |
More
than | |
| Contractual Obligations | |
Nature | |
Total | | |
1 year | | |
years | | |
years | | |
5 years | |
| Service fee commitments | |
(a) | |
$ | 56,644 | | |
$ | 56,644 | | |
$ | - | | |
$ | - | | |
$ | - | |
| Operating lease commitments | |
(b) | |
| 3,589,243 | | |
| 1,924,149 | | |
| 1,645,840 | | |
| 19,254 | | |
| - | |
| Purchase commitments | |
(c) | |
| 3,106,786 | | |
| 3,106,786 | | |
| - | | |
| - | | |
| - | |
| | |
| |
$ | 6,752,673 | | |
$ | 5,087,579 | | |
$ | 1,645,840 | | |
$ | 19,254 | | |
$ | - | |
| (a) | The Company has engaged Stander Information Company Limited (“Stander”) to provide technical services relating to the cash management systems for the Company’s secure logistics business. The service agreement with Stander comprised of a monthly fixed service fee and certain other fees as specified in the agreement, which expired in August 2023. In August, 2023, the Company renewed the service agreement with Stander for 2 years. |
| (b) | From time to time, the Company entered into various short-term lease agreements to rent warehouses and offices. In addition, the Company has various low value items with various lease terms that the Company is committed to pay in the future. |
| (c) | AI Hong Kong entered into various purchase agreements with Shenzhen Intelligent Guardforce Robot Technology Co., Limited and Shenzhen Kewei Robot Technology Co., Ltd. to establish mutual contractual obligations for future purchases of robots. These agreements do not contain the scheduled delivery dates. As of the date of filing, the Company does not intend to execute these agreements until the robot inventories on hand are being sold. | Bank guarantees
As of June 30, 2023, the Company had
commitments with banks for bank guarantees in favor of government agencies and others of approximately $3,700,000.
Litigation
As of the date of filing, the Company
is a defendant in various labor-related lawsuits totaling approximately $400,593. Management believes sufficient provision has been made
for these liabilities in this interim condensed consolidated financial statements.
|
| X |
- References
+ Details
| Name: |
gfai_CommitmentsAndContingenciesAbstract |
| Namespace Prefix: |
gfai_ |
| Data Type: |
xbrli:stringItemType |
| Balance Type: |
na |
| Period Type: |
duration |
|
| X |
- DefinitionThe disclosure of commitments and contingent liabilities. [Refer: Contingent liabilities [member]] Reference 1: http://www.xbrl.org/2009/role/commonPracticeRef
-Name IAS
-Number 1
-IssueDate 2023-01-01
-Paragraph 10
-Subparagraph e
-URI https://taxonomy.ifrs.org/xifrs-link?type=IAS&num=1&code=ifrs-tx-2023-en-r&anchor=para_10_e&doctype=Standard
-URIDate 2023-03-23
| Name: |
ifrs-full_DisclosureOfCommitmentsAndContingentLiabilitiesExplanatory |
| Namespace Prefix: |
ifrs-full_ |
| Data Type: |
dtr-types:textBlockItemType |
| Balance Type: |
na |
| Period Type: |
duration |
|
v3.23.3
Subsequent Events
|
6 Months Ended |
Jun. 30, 2023 |
|---|
| Subsequent Events [Abstract] |
|
| SUBSEQUENT EVENTS |
Numerous subsequent events disclosures
are being made elsewhere in this interim condensed consolidated financial statements. Subsequent events have been reviewed through the
date of filing and required no adjustments or disclosures.
|
| X |
- DefinitionThe entire disclosure for events after the reporting period. Reference 1: http://www.xbrl.org/2003/role/disclosureRef
-Name IAS
-Number 10
-IssueDate 2023-01-01
-Section Disclosure
-URI https://taxonomy.ifrs.org/xifrs-link?type=IAS&num=10&code=ifrs-tx-2023-en-r&doctype=Standard&dita_xref=IAS10_g17-22_TI
-URIDate 2023-03-23
| Name: |
ifrs-full_DisclosureOfEventsAfterReportingPeriodExplanatory |
| Namespace Prefix: |
ifrs-full_ |
| Data Type: |
dtr-types:textBlockItemType |
| Balance Type: |
na |
| Period Type: |
duration |
|
| X |
- References
+ Details
| Name: |
ifrs-full_DisclosureOfNonadjustingEventsAfterReportingPeriodAbstract |
| Namespace Prefix: |
ifrs-full_ |
| Data Type: |
xbrli:stringItemType |
| Balance Type: |
na |
| Period Type: |
duration |
|
v3.23.3
Accounting Policies, by Policy (Policies)
|
6 Months Ended |
Jun. 30, 2023 |
|---|
| Accounting Policies [Abstract] |
|
| Basis of presentation |
| 2.1 | Basis of presentation | The accompanying interim condensed consolidated
financial statements have been prepared in accordance with International Accounting Standard (“IAS”) 34, “Interim Financial
Reporting”. These statements should be read in conjunction with the audited consolidated financial statements for the years ended
December 31, 2022, 2021 and 2020, which have been prepared in accordance with International Financial Reporting Standards (“IFRS”)
as issued by the International Accounting Standards Board (“IASB”). The interim condensed consolidated financial statements
have been prepared on a historical cost basis. In the opinion of management, all adjustments necessary for a fair presentation have
been included in the accompanying unaudited condensed consolidated financial statements. The results of operations for the six months
ended June 30, 2023 are not necessarily indicative of the results that may be expected for the full year ended December 31, 2023. All amounts are presented in United States
dollars (“USD”) and have been rounded to the nearest USD. In addition, the accompanying condensed
consolidated interim financial statements are presented on the basis that the Company is a going concern. The going concern assumption
contemplates the realization of assets and the satisfaction of liabilities in the normal course of business. The Company’s operating losses
and net current liability position may raise substantial doubt on the Company’s ability to continue as a going concern. In assessing the going concern, management
and the Board has considered: | | - | As of June 30, 2023, the current and non-current portion of loan outstanding with WK Venture Success Limited (“WK Venture”) were approximately $2.5 million and $13.6 million, respectively, which will be due on December 31, 2024 (Note 14). On September 28, 2023, WK Venture agreed to convert the principal and accrued interest of this loan in an aggregate amount of $15,914,615 at the conversion price of $5.40 into restricted ordinary shares of the Company. Thus, the loan with WK Venture has no impact on the Company’s liquidity and on the Company’s ability to meet its short-term financial obligations. |
| - | As of June 30, 2023, the Company has a convertible note payable of $606,786 with Streeterville Capital,
LLC ( “CVP”), which will be due on October 24, 2023 (Note 15). Management believes this convertible note payable will be settled
before the maturity date, either CVP will convert the outstanding balance into restricted ordinary shares or the Company will repay the
amount owed in cash. |
| - | Based on the budget and financial plans of the Company, management is satisfied that the receipt of an
aggregate of approximately $21.0 million, after deducting underwriting discounts and other offering expenses from the two underwritten
public offering proceeds (Note 19) has provided the Company adequate financial resources to continue in operational existence for the
foreseeable future, a period of at least 12 months from the date of this report. |
On January 31, 2023, the Company completed
a 1 for 40 share consolidation of its authorized and issued ordinary shares whereby every forty shares were consolidated into one share.
In addition, the par value of each ordinary share increased from $0.003 to $0.12. Immediately following the completion of the share consolidation,
the Company increased its authorized ordinary shares from 7,500,000 ordinary shares to 300,000,000 ordinary shares. The accompanying interim
condensed consolidated financial statements for the six months ended June 30, 2022 have been retroactively adjusted to reflect the effect
of the share consolidation.
|
| Basis of consolidation |
| 2.2 | Basis of consolidation | The consolidated statements of
profit or loss and other comprehensive loss, statements of changes in equity and statements of cash flows of the Company for the
relevant periods include the results and cash flows of all companies now comprising the Company from the earliest date presented or
since the date when the subsidiaries and/or businesses first came under the common control of the controlling shareholders, wherever
the period is shorter. The interim condensed consolidated balance
sheet of the Company as of June 30, 2023 has been prepared to present the assets and liabilities of the subsidiaries under the historical
cost convention. Equity interests in subsidiaries held
by parties other than the controlling shareholders are presented as non-controlling interests in equity. All intra-group and inter-company transactions
and balances have been eliminated on consolidation.
|
| Segment reporting |
Segment information is consistent with
how management reviews the businesses, makes investing and resource allocation decisions and assesses operating performance. Transfers
and sales between reportable segments, if any, are recorded at cost. The Company reports financial and operating
information in the following five segments (Note 23):
| |
(ii) |
Information security; |
| |
(iii) |
Robotics AI solutions; |
| |
(iv) |
General security solutions; and |
|
| Business combinations |
| 2.4 | Business combinations | The Company accounts for business combinations
using the acquisition method when control is transferred to the Company, other than those between and among entities under common control.
The consideration transferred in the acquisition is generally measured at fair value, as are the identifiable net assets acquired. Any
goodwill that arises is tested annually for impairment. Any gain on the bargain purchase is recognized in the statement of profit or loss
immediately. Transaction costs are expensed as incurred, except if related to the issue of debt or equity securities.
|
| Critical accounting estimate and judgements |
| 2.5 | Critical accounting estimate and judgements | The preparation of the consolidated financial
statements in conformity with IFRS requires management to make estimates and judgments that affect the reported amounts of assets and
liabilities and disclosure of contingent assets and liabilities at the date of the financial statements and the reported amounts of revenues
and expenses during the reporting periods. Actual results could differ from these estimates. In preparing the interim condensed consolidated
financial statements, the significant judgments made by management in applying the Company’s accounting policies and the key sources
of estimation uncertainty were the same as those that applied to the consolidated financial statements for the year ended December 31,
2022.
|
| Foreign currency translation |
| 2.6 | Foreign currency translation | The presentational currency of the Company
is the U.S. dollar (“USD”). The functional currency of Guardforce, AI Holdings, AI Robots, Horizon Dragon, Southern Ambition,
AI Singapore, AI Robotics, AI Robots Service, AI Malaysia, AI Macau, AI US, AI Australia, AI Dubai, AI UK, AI Korea, AI Japan, AI Canada
and AI Vietnam is the USD. The functional currency of AI Hong Kong and Handshake is the Hong Kong dollar (“HKD”). The functional
currency of AI Thailand, GF Cash (CIT) and AI R&I is the Thai Baht (“Baht” or “THB”). The functional currency
of AI Shenzhen, AI Jian, Shenzhen GFAI, Guangzhou GFAI and Beijing Wanjia is the Chinese Renminbi (“RMB”). The currency exchange rates that impact
our business are shown in the following table:
| | |
Period End Rate | | |
Average Rate | |
| | |
June 30, | | |
December 31, | | |
For the six months ended
June 30, | |
| | |
2023 | | |
2022 | | |
2023 | | |
2022 | |
| Thai Baht | |
| 0.0283 | | |
| 0.0289 | | |
| 0.0293 | | |
| 0.0295 | |
| Hong Kong Dollar | |
| 0.1282 | | |
| 0.1282 | | |
| 0.1282 | | |
| 0.1282 | |
| Chinese Renminbi | |
| 0.1379 | | |
| 0.1447 | | |
| 0.1444 | | |
| 0.1544 | |
|
| Financial risk management |
| 2.7 | Financial risk management |
| 2.7.1 |
Financial risk factors |
The Company’s activities expose
it to a variety of financial risks: foreign exchange risk, interest rate risk and liquidity risk. The Company’s overall risk management
program focuses on the unpredictability of financial markets and seeks to minimize potential adverse effects on the Company’s financial
performance. The interim condensed consolidated financial
statements do not include all financial risk management information and disclosures required in the audited financial statements, and
should be read in conjunction with the Company’s audited consolidated financial statements as of December 31, 2022, 2021 and 2020. Prudent liquidity management implies
maintaining sufficient cash and cash equivalents and the availability of funding through an adequate amount of committed credit facilities. The Company’s primary cash requirements
are for operating expenses and purchases of fixed assets. The Company mainly finances its working capital requirements from cash generated
from funds raised from the public offerings, operations, proceeds from the exercise of warrants, bank borrowings and finance leases. The Company’s policy is to regularly
monitor current and expected liquidity requirements to ensure it maintains sufficient cash and cash equivalents and an adequate amount
of committed credit facilities to meet its liquidity requirements in the short and long term. At the reporting date, the contractual
undiscounted cash flows of the Company’s current financial liabilities approximate their respective carrying amounts due to their
short maturities.
| 2.7.3 |
Capital risk management |
The Company’s objectives on managing
capital are to safeguard the Company’s ability to continue as a going concern and support the sustainable growth of the Company
in order to provide returns for shareholders and benefits for other stakeholders and to maintain an optimal capital structure to enhance
shareholders’ value in the long term. In order to maintain or adjust the capital
structure, the Company may adjust the amount of dividends paid to shareholders, return of capital to shareholders, issue new shares or
sell assets to reduce debt.
|
| Impact of COVID-19 |
The COVID-19 pandemic developed rapidly
in 2020. The resulting impact of the virus on the operations and measures taken by various governments to contain the virus have negatively
affected the Company’s financial performance in the fiscal year 2022. The regulatory measures in response to the pandemic were relaxed
and travel restrictions in most countries was lifted in late 2022, the Company might be recovered through the increase in economic activity
in the fiscal year 2023. The Company is monitoring the situation closely and conscientiously managing its costs by adopting an operating
cost reduction strategy and conserving liquidity by working with major creditors to align repayment obligations with receivable collections.
|
| Inventories |
Inventories consist of robots and security
equipment which are stated at the lower of cost, determined on a weighted average basis, or net realizable value. Net realizable value
is the estimated selling price in the ordinary course of business less the estimated cost of completion and the estimated costs necessary
to make the sale. When inventory is sold, their carrying amount is charged to expense in the period in which the revenue is recognized.
Write-downs for declines in net realizable value or for losses of inventories are recognized as an expense in the period the impairment
or loss occurs. The Company recorded an allowance for slow-moving or obsolete robot inventories of $3,090,283 and nil for the six months
ended June 30, 2023 and 2022, respectively. During the six months ended June 30,
2023 and 2022, all robot inventories were purchased from the related parties (Note 22), and all security equipment’s inventories
were purchased from third parties.
|
| Related parties |
Parties are considered to be related
if one party has the ability, directly or indirectly, to control the other party or exercise significant influence over the other party
in making financial and operating decisions. Parties are also considered to be related if they are subject to common control or significant
influence, such as a family member or relative, shareholder, or a related corporation. The Company recognizes the contractual
right to receive money or products from related parties as amounts due from related parties. For those that the contractual maturity date
is less than one year, the Company records as current assets.
|
| Assets under construction |
| 2.10 | Assets under construction | Assets under construction recorded
in property, plant and equipment and intangible assets are stated at cost less impairment losses, if any. Cost comprises direct
costs of construction as well as interest expense and exchange differences capitalized during the periods of construction and
installation. Capitalization of these costs ceases and the construction in progress is transferred to property, plant and equipment
when substantially all the activities necessary to prepare the assets for their intended use are completed. No depreciation is
provided for assets under construction until they are completed and ready for intended use.
|
| Goodwill |
Following initial recognition, goodwill
is stated at cost less any accumulated impairment losses. Goodwill is reviewed for impairment annually or more frequently if events or
changes in circumstances indicate that the carrying value may be impaired. At the acquisition date, any
goodwill acquired is allocated to the cash-generating units (CGU) which are expected to benefit from the combination’s
synergies. Impairment is determined by assessing the recoverable amount of the CGU to which the goodwill related. Where the
recoverable amount of the CGU is less than the carrying amount, an impairment loss is recognized. Where goodwill forms part of a CGU
and part of the operation within that unit is disposed of, the goodwill associated with the operation disposed of is included in the
carrying amount of the operation when determining the gain or loss on disposal of the operation. Goodwill disposed of In these
circumstances is measured on the basis of the relative values of the operation disposed of and the portion of the CGU retained. The
Company recorded a goodwill impairment of 1,263,040 and nil for the six months ended June 30, 2023 and 2022, respectively.
|
| Impairment of long-lived assets |
| 2.11 | Impairment of long-lived assets | At the end of each reporting period,
the Company reviews the carrying amounts of its long-lived assets to determine whether there is any indication that those assets have
suffered an impairment loss. If any such indication exists, the recoverable amount of the asset is estimated in order to determine the
extent of the impairment loss (if any). Where it is not possible to estimate the recoverable amount of an individual asset, the Company
estimates the recoverable amount of the cash-generating unit to which the asset belongs. For the six months ended June 30, 2023, an impairment
loss on the robot assets of $1,591,766 was recognized when the carrying amount was greater than the value in use. Management estimated
the value in use by estimating the expected cash flows from the cash-generating unit as well as a suitable discount rate in order to calculate
the present value of those cash flows. The basis of impairment is determined based on the result of assessment. The Company did not incur
any impairment loss for the six months ended June 30, 2022.
|
| Offsetting Assets and Liabilities |
| 2.12 | Offsetting Assets and Liabilities | During the six months ended June 30,
2023, the Company engaged in offsetting arrangements for certain financial assets and financial liabilities. These arrangements primarily
involve the offsetting of related party receivables, related party payables and borrowings from a related party. The Company has established
legally enforceable rights to offset financial assets and financial liabilities subject to offsetting arrangements. These rights may arise
from agreements, netting arrangements, or a combination of legal and contractual rights.
|
| Revenue from contracts with customers |
| 2.13 | Revenue from contracts with customers | The Company generates its revenue primarily
from four service lines: (1) Secure logistics; (2) Robotics AI resolutions; (3) Information security; and (4) General security solutions. Each service line primarily renders the
following services:
| |
(i) |
Cash-In-Transit – Non Dedicated Vehicle (CIT Non-DV); (ii) Cash-In-Transit – Dedicated Vehicle (CIT DV); (iii) ATM management; (iv) Cash Processing (CPC); (v) Cash Center Operations (CCT); (vi) Consolidate Cash Center (CCC); (vii) Cheque Center Service (CDC); (viii) Express Cash; (ix) Coin Processing Service; and (x) Cash Deposit Management Solutions |
| |
(2) |
Robotics AI solutions |
| |
(i) |
Sale of robots and (ii) Rental of robots |
| |
(i) |
Penetration test; (ii) PCI ASV Scan and (iii) Rapid7 Sales |
| |
(4) |
General security solutions |
| |
(i) |
Installation of fire alarm security systems; (ii) Sale of security equipment |
The Company recognizes revenue at a point
in time as products are delivered and services are performed. Consultancy fees typically covers a period of time, the revenue is recognized
on a ratable basis over the contract term. The Company applies the following five-step model in order to determine the amount:
| |
● |
To identify the contract or quotation with the agreed service price. |
| |
● |
To evaluate the services engaged in the customer’s contract and identify the related performance obligations. |
| |
● |
To consider the contract terms and commonly accepted practices in the business to determine the transaction price. The transaction price is the consideration that the Company expects to be entitled for delivering the services engaged with the customer. The consideration engaged in a customer’s contract is generally a fixed amount. |
| |
● |
To allocate the transaction price, if necessary, to each performance obligation (to each good or service that is different) for an amount that represents the part of the benefit that the Company expects to receive in exchange for the right of delivering the services engaged with the customer. |
| |
● |
To recognize revenue when the Company satisfies the performance obligation through the rendering of services engaged. |
All of the conditions mentioned above
are accomplished normally when the services are rendered to the customer and this moment is considered a point in time. The reported revenue
reflects services delivered at the contract or agreed-upon price. Contract liabilities consist of deferred
revenue related to prepaid fees received from customers for future information security service over the term of the service agreement.
The Company expects to recognize revenue of $428,839 within the next 12 months and $nil after 12 months to 36 months. Revenue is recognized when the related
performance obligation is satisfied. Disaggregation information of revenue
by service type which was recognized based on the nature of performance obligation disclosed above is as follows:
| | |
For the six months ended June
30, | |
| | |
2023 | | |
Percentage of
Total | | |
2022 | | |
Percentage of
Total | |
| Service Type | |
$ | | |
Revenue | | |
$ | | |
Revenue | |
| | |
(Unaudited) | | |
| | |
(Unaudited) | | |
| |
| Cash-In-Transit – Non-Dedicated Vehicles (CIT Non-DV) | |
$ | 5,988,087 | | |
| 32.5 | % | |
$ | 5,377,474 | | |
| 31.8 | % |
| Cash-In-Transit – Dedicated Vehicle to Banks (CIT DV) | |
| 1,961,464 | | |
| 10.7 | % | |
| 2,135,199 | | |
| 12.6 | % |
| ATM Management | |
| 3,895,708 | | |
| 21.2 | % | |
| 4,731,015 | | |
| 27.9 | % |
| Cash Processing (CPC) | |
| 1,613,933 | | |
| 8.8 | % | |
| 1,410,902 | | |
| 8.3 | % |
| Cash Center Operations (CCT) | |
| 958,760 | | |
| 5.2 | % | |
| 1,202,214 | | |
| 7.1 | % |
| Consolidate Cash Center (CCC) | |
| 395,105 | | |
| 2.1 | % | |
| 225,513 | | |
| 1.3 | % |
| Cheque Center Service (CDC) | |
| - | | |
| - | % | |
| 4,729 | | |
| 0.05 | % |
| Others ** | |
| 4,332 | | |
| 0.02 | % | |
| 4,399 | | |
| 0.05 | % |
| Cash Deposit Management Solutions (GDM) | |
| 1,125,767 | | |
| 6.1 | % | |
| 869,102 | | |
| 5.1 | % |
| Robotics AI solutions | |
| 440,229 | | |
| 2.4 | % | |
| 719,041 | | |
| 4.2 | % |
| Information security | |
| 407,689 | | |
| 2.2 | % | |
| 262,934 | | |
| 1.6 | % |
| General security solutions | |
| 1,622,218 | | |
| 8.8 | % | |
| - | | |
| - | % |
| Total | |
$ | 18,413,292 | | |
| 100.0 | % | |
$ | 16,942,522 | | |
| 100.0 | % |
| ** | Others
include primarily revenue from express cash and coin processing services. |
During the six months ended June 30,
2022, revenues amounting to $16,808,399 were generated from third parties; and $134,123 were generated from a related party (Note 22). During the six months ended June 30,
2023 all revenues were generated from third parties.
|
| Cost of sales |
Cost of sales consists primarily
of internal labor costs and related benefits, and other overhead costs that are directly attributable to services provided.
|
| New and amended accounting standards |
| 2.15 | New and amended accounting standards | All new standards and amendments that
are effective for annual reporting period commencing January 1, 2023 have been applied by the Company for the six months ended June 30,
2023. The adoption of these new and amended standards did not have material impact on the interim condensed consolidated financial statements
of the Company. A number of new standards and amendments to standards have not come into effect for the year beginning January 1, 2023,
and they have not been early adopted by the Company in preparing these interim condensed consolidated financial statements. None of these
new standards and amendments to standards is expected to have a significant effect on the interim condensed consolidated financial statements
of the Company.
|
| X |
- References
+ Details
| Name: |
gfai_DescriptionOfAccountingPolicyForCostOfSalesPolicyTextBlock |
| Namespace Prefix: |
gfai_ |
| Data Type: |
dtr:textBlockItemType |
| Balance Type: |
na |
| Period Type: |
duration |
|
| X |
- References
+ Details
| Name: |
gfai_DescriptionOfAccountingPolicyForNewAndAmendedAccountingStandardsExplanatory |
| Namespace Prefix: |
gfai_ |
| Data Type: |
dtr:textBlockItemType |
| Balance Type: |
na |
| Period Type: |
duration |
|
| X |
- DefinitionThe description of inventory explanatory.
| Name: |
gfai_DescriptionOfInventoryExplanatory |
| Namespace Prefix: |
gfai_ |
| Data Type: |
dtr:textBlockItemType |
| Balance Type: |
na |
| Period Type: |
duration |
|
| X |
- References
+ Details
| Name: |
gfai_DisclosureOfFinancialRiskFactorPolicyTextBlock |
| Namespace Prefix: |
gfai_ |
| Data Type: |
dtr:textBlockItemType |
| Balance Type: |
na |
| Period Type: |
duration |
|
| X |
- DefinitionThe policy of impact of covid-19.
| Name: |
gfai_DisclosureOfImpactOfCovid19PolicyTextBlock |
| Namespace Prefix: |
gfai_ |
| Data Type: |
dtr:textBlockItemType |
| Balance Type: |
na |
| Period Type: |
duration |
|
| X |
- DefinitionThe description of the entity's material accounting policy information for business combinations. [Refer: Business combinations [member]] Reference 1: http://www.xbrl.org/2009/role/commonPracticeRef
-Name IAS
-Number 1
-IssueDate 2023-01-01
-Paragraph 117
-URI https://taxonomy.ifrs.org/xifrs-link?type=IAS&num=1&code=ifrs-tx-2023-en-r&anchor=para_117&doctype=Standard
-URIDate 2023-03-23
| Name: |
ifrs-full_DescriptionOfAccountingPolicyForBusinessCombinationsExplanatory |
| Namespace Prefix: |
ifrs-full_ |
| Data Type: |
dtr-types:textBlockItemType |
| Balance Type: |
na |
| Period Type: |
duration |
|
| X |
- DefinitionThe description of the entity's material accounting policy information for construction in progress. [Refer: Construction in progress] Reference 1: http://www.xbrl.org/2009/role/commonPracticeRef
-Name IAS
-Number 1
-IssueDate 2023-01-01
-Paragraph 117
-URI https://taxonomy.ifrs.org/xifrs-link?type=IAS&num=1&code=ifrs-tx-2023-en-r&anchor=para_117&doctype=Standard
-URIDate 2023-03-23
| Name: |
ifrs-full_DescriptionOfAccountingPolicyForConstructionInProgressExplanatory |
| Namespace Prefix: |
ifrs-full_ |
| Data Type: |
dtr-types:textBlockItemType |
| Balance Type: |
na |
| Period Type: |
duration |
|
| X |
- DefinitionThe description of the entity's material accounting policy information for foreign currency translation. Reference 1: http://www.xbrl.org/2009/role/commonPracticeRef
-Name IAS
-Number 1
-IssueDate 2023-01-01
-Paragraph 117
-URI https://taxonomy.ifrs.org/xifrs-link?type=IAS&num=1&code=ifrs-tx-2023-en-r&anchor=para_117&doctype=Standard
-URIDate 2023-03-23
| Name: |
ifrs-full_DescriptionOfAccountingPolicyForForeignCurrencyTranslationExplanatory |
| Namespace Prefix: |
ifrs-full_ |
| Data Type: |
dtr-types:textBlockItemType |
| Balance Type: |
na |
| Period Type: |
duration |
|
| X |
- DefinitionThe description of the entity's material accounting policy information for recognising revenue. [Refer: Revenue] Reference 1: http://www.xbrl.org/2009/role/commonPracticeRef
-Name IAS
-Number 1
-IssueDate 2023-01-01
-Paragraph 117
-URI https://taxonomy.ifrs.org/xifrs-link?type=IAS&num=1&code=ifrs-tx-2023-en-r&anchor=para_117&doctype=Standard
-URIDate 2023-03-23
| Name: |
ifrs-full_DescriptionOfAccountingPolicyForRecognitionOfRevenue |
| Namespace Prefix: |
ifrs-full_ |
| Data Type: |
dtr-types:textBlockItemType |
| Balance Type: |
na |
| Period Type: |
duration |
|
| X |
- DefinitionThe description of the entity's material accounting policy information for segment reporting. Reference 1: http://www.xbrl.org/2009/role/commonPracticeRef
-Name IAS
-Number 1
-IssueDate 2023-01-01
-Paragraph 117
-URI https://taxonomy.ifrs.org/xifrs-link?type=IAS&num=1&code=ifrs-tx-2023-en-r&anchor=para_117&doctype=Standard
-URIDate 2023-03-23
| Name: |
ifrs-full_DescriptionOfAccountingPolicyForSegmentReportingExplanatory |
| Namespace Prefix: |
ifrs-full_ |
| Data Type: |
dtr-types:textBlockItemType |
| Balance Type: |
na |
| Period Type: |
duration |
|
| X |
- DefinitionThe disclosure of judgements that management has made in the process of applying the entity's accounting policies that have the most significant effect on amounts recognised in the financial statements along with information about the assumptions that the entity makes about the future, and other major sources of estimation uncertainty at the end of the reporting period, that have a significant risk of resulting in a material adjustment to the carrying amounts of assets and liabilities within the next year. [Refer: Carrying amount [member]] Reference 1: http://www.xbrl.org/2009/role/commonPracticeRef
-Name IAS
-Number 1
-IssueDate 2023-01-01
-Paragraph 10
-Subparagraph e
-URI https://taxonomy.ifrs.org/xifrs-link?type=IAS&num=1&code=ifrs-tx-2023-en-r&anchor=para_10_e&doctype=Standard
-URIDate 2023-03-23
| Name: |
ifrs-full_DisclosureOfAccountingJudgementsAndEstimatesExplanatory |
| Namespace Prefix: |
ifrs-full_ |
| Data Type: |
dtr-types:textBlockItemType |
| Balance Type: |
na |
| Period Type: |
duration |
|
| X |
- DefinitionThe disclosure of the basis used for consolidation. Reference 1: http://www.xbrl.org/2009/role/commonPracticeRef
-Name IAS
-Number 1
-IssueDate 2023-01-01
-Paragraph 10
-Subparagraph e
-URI https://taxonomy.ifrs.org/xifrs-link?type=IAS&num=1&code=ifrs-tx-2023-en-r&anchor=para_10_e&doctype=Standard
-URIDate 2023-03-23
| Name: |
ifrs-full_DisclosureOfBasisOfConsolidationExplanatory |
| Namespace Prefix: |
ifrs-full_ |
| Data Type: |
dtr-types:textBlockItemType |
| Balance Type: |
na |
| Period Type: |
duration |
|
| X |
- DefinitionThe disclosure of the basis used for the preparation of the financial statements. Reference 1: http://www.xbrl.org/2009/role/commonPracticeRef
-Name IAS
-Number 1
-IssueDate 2023-01-01
-Paragraph 10
-Subparagraph e
-URI https://taxonomy.ifrs.org/xifrs-link?type=IAS&num=1&code=ifrs-tx-2023-en-r&anchor=para_10_e&doctype=Standard
-URIDate 2023-03-23
| Name: |
ifrs-full_DisclosureOfBasisOfPreparationOfFinancialStatementsExplanatory |
| Namespace Prefix: |
ifrs-full_ |
| Data Type: |
dtr-types:textBlockItemType |
| Balance Type: |
na |
| Period Type: |
duration |
|
| X |
- DefinitionThe disclosure of goodwill. [Refer: Goodwill] Reference 1: http://www.xbrl.org/2009/role/commonPracticeRef
-Name IAS
-Number 1
-IssueDate 2023-01-01
-Paragraph 10
-Subparagraph e
-URI https://taxonomy.ifrs.org/xifrs-link?type=IAS&num=1&code=ifrs-tx-2023-en-r&anchor=para_10_e&doctype=Standard
-URIDate 2023-03-23
| Name: |
ifrs-full_DisclosureOfGoodwillExplanatory |
| Namespace Prefix: |
ifrs-full_ |
| Data Type: |
dtr-types:textBlockItemType |
| Balance Type: |
na |
| Period Type: |
duration |
|
| X |
- DefinitionThe entire disclosure for the impairment of assets. Reference 1: http://www.xbrl.org/2003/role/disclosureRef
-Name IAS
-Number 36
-IssueDate 2023-01-01
-Section Disclosure
-URI https://taxonomy.ifrs.org/xifrs-link?type=IAS&num=36&code=ifrs-tx-2023-en-r&doctype=Standard&dita_xref=IAS36_g126-137_TI
-URIDate 2023-03-23
| Name: |
ifrs-full_DisclosureOfImpairmentOfAssetsExplanatory |
| Namespace Prefix: |
ifrs-full_ |
| Data Type: |
dtr-types:textBlockItemType |
| Balance Type: |
na |
| Period Type: |
duration |
|
| X |
- DefinitionThe disclosure of the offsetting of financial assets and financial liabilities. [Refer: Financial assets; Financial liabilities] Reference 1: http://www.xbrl.org/2003/role/disclosureRef
-Name IFRS
-Number 7
-IssueDate 2023-01-01
-Section Offsetting financial assets and financial liabilities
-URI https://taxonomy.ifrs.org/xifrs-link?type=IFRS&num=7&code=ifrs-tx-2023-en-r&doctype=Standard&dita_xref=IFRS07_g13A-13F_TI
-URIDate 2023-03-23
| Name: |
ifrs-full_DisclosureOfOffsettingOfFinancialAssetsAndFinancialLiabilitiesExplanatory |
| Namespace Prefix: |
ifrs-full_ |
| Data Type: |
dtr-types:textBlockItemType |
| Balance Type: |
na |
| Period Type: |
duration |
|
| X |
- References
+ Details
| Name: |
us-gaap_AccountingPoliciesAbstract |
| Namespace Prefix: |
us-gaap_ |
| Data Type: |
xbrli:stringItemType |
| Balance Type: |
na |
| Period Type: |
duration |
|
v3.23.3
Significant Accounting Policies (Tables)
|
6 Months Ended |
Jun. 30, 2023 |
|---|
| Disclosure of Significant Accounting Policies [Abstract] |
|
| Schedule of Currency Exchange Rates Impact |
The currency exchange rates that impact
our business are shown in the following table:
| | |
Period End Rate | | |
Average Rate | |
| | |
June 30, | | |
December 31, | | |
For the six months ended
June 30, | |
| | |
2023 | | |
2022 | | |
2023 | | |
2022 | |
| Thai Baht | |
| 0.0283 | | |
| 0.0289 | | |
| 0.0293 | | |
| 0.0295 | |
| Hong Kong Dollar | |
| 0.1282 | | |
| 0.1282 | | |
| 0.1282 | | |
| 0.1282 | |
| Chinese Renminbi | |
| 0.1379 | | |
| 0.1447 | | |
| 0.1444 | | |
| 0.1544 | |
|
| Schedule of Disaggregation Information of Revenue by Service Type |
Disaggregation information of revenue
by service type which was recognized based on the nature of performance obligation disclosed above is as follows:
| | |
For the six months ended June
30, | |
| | |
2023 | | |
Percentage of
Total | | |
2022 | | |
Percentage of
Total | |
| Service Type | |
$ | | |
Revenue | | |
$ | | |
Revenue | |
| | |
(Unaudited) | | |
| | |
(Unaudited) | | |
| |
| Cash-In-Transit – Non-Dedicated Vehicles (CIT Non-DV) | |
$ | 5,988,087 | | |
| 32.5 | % | |
$ | 5,377,474 | | |
| 31.8 | % |
| Cash-In-Transit – Dedicated Vehicle to Banks (CIT DV) | |
| 1,961,464 | | |
| 10.7 | % | |
| 2,135,199 | | |
| 12.6 | % |
| ATM Management | |
| 3,895,708 | | |
| 21.2 | % | |
| 4,731,015 | | |
| 27.9 | % |
| Cash Processing (CPC) | |
| 1,613,933 | | |
| 8.8 | % | |
| 1,410,902 | | |
| 8.3 | % |
| Cash Center Operations (CCT) | |
| 958,760 | | |
| 5.2 | % | |
| 1,202,214 | | |
| 7.1 | % |
| Consolidate Cash Center (CCC) | |
| 395,105 | | |
| 2.1 | % | |
| 225,513 | | |
| 1.3 | % |
| Cheque Center Service (CDC) | |
| - | | |
| - | % | |
| 4,729 | | |
| 0.05 | % |
| Others ** | |
| 4,332 | | |
| 0.02 | % | |
| 4,399 | | |
| 0.05 | % |
| Cash Deposit Management Solutions (GDM) | |
| 1,125,767 | | |
| 6.1 | % | |
| 869,102 | | |
| 5.1 | % |
| Robotics AI solutions | |
| 440,229 | | |
| 2.4 | % | |
| 719,041 | | |
| 4.2 | % |
| Information security | |
| 407,689 | | |
| 2.2 | % | |
| 262,934 | | |
| 1.6 | % |
| General security solutions | |
| 1,622,218 | | |
| 8.8 | % | |
| - | | |
| - | % |
| Total | |
$ | 18,413,292 | | |
| 100.0 | % | |
$ | 16,942,522 | | |
| 100.0 | % |
| ** | Others
include primarily revenue from express cash and coin processing services. |
|
| X |
- References
+ Details
| Name: |
gfai_DisclosureOfSignificantAccountingPoliciesAbstract |
| Namespace Prefix: |
gfai_ |
| Data Type: |
xbrli:stringItemType |
| Balance Type: |
na |
| Period Type: |
duration |
|
| X |
- References
+ Details
| Name: |
gfai_ScheduleOfCurrencyExchangeRatesImpactTableTextBlock |
| Namespace Prefix: |
gfai_ |
| Data Type: |
dtr:textBlockItemType |
| Balance Type: |
na |
| Period Type: |
duration |
|
| X |
- DefinitionSchedule of disaggregation information of revenue by service type.
| Name: |
gfai_ScheduleOfDisaggregationInformationOfRevenueByServiceTypeTableTextBlock |
| Namespace Prefix: |
gfai_ |
| Data Type: |
dtr:textBlockItemType |
| Balance Type: |
na |
| Period Type: |
duration |
|
v3.23.3
Business Combinations (Tables)
|
6 Months Ended |
Jun. 30, 2023 |
|---|
| Business Combination [Abstract] |
|
| Schedule of Purchase Price Allocation |
The following represents the
purchase price allocation at the dates of the acquisitions:
| | |
Handshake
on March 25,
2021 | | |
AI Macau
on February 9,
2022 | | |
AI
Malaysia
on January 20,
2022 | | |
Beijing
Wanjia on
June 22,
2022 | | |
Shenzhen
GFAI and
Guangzhou
GFAI on
March 22,
2022 | |
| Cash and cash equivalents | |
$ | 24,276 | | |
$ | 21,038 | | |
$ | 12,500 | | |
$ | 38,342 | | |
$ | 2,187 | |
| Other current assets | |
| 32,250 | | |
| 4,162 | | |
| - | | |
| 2,219,318 | | |
| 2,393,558 | |
| Property, plant and equipment | |
| - | | |
| - | | |
| - | | |
| 20,488 | | |
| 2,055,610 | |
| Intangible assets | |
| - | | |
| - | | |
| - | | |
| 1,593,398 | | |
| 1,592,783 | |
| Other non-current assets | |
| - | | |
| - | | |
| - | | |
| 203,765 | | |
| 23,566 | |
| Current liabilities | |
| (58,297 | ) | |
| (92,350 | ) | |
| (13,184 | ) | |
| (1,681,573 | ) | |
| (4,320,434 | ) |
| Goodwill | |
| 329,534 | | |
| 70,355 | | |
| 685 | | |
| 411,862 | | |
| 1,867,009 | |
| Total purchase price | |
$ | 327,763 | | |
$ | 3,205 | | |
$ | 1 | | |
$ | 2,805,600 | | |
$ | 3,614,279 | |
|
| X |
- DefinitionDisclouser of schedule of represents the purchase price allocation at the dates of the acquisition.
| Name: |
gfai_ScheduleOfRepresentsThePurchasePriceAllocationAtTheDatesOfTheAcquisition |
| Namespace Prefix: |
gfai_ |
| Data Type: |
dtr:textBlockItemType |
| Balance Type: |
na |
| Period Type: |
duration |
|
v3.23.3
Cash, Cash Equivalents and Restricted Cash (Tables)
|
6 Months Ended |
Jun. 30, 2023 |
|---|
| Cash, Cash Equivalents and Restricted Cash [Abstract] |
|
| Schedule of Cash Equivalents and Restricted Cash |
| | |
As of
June 30,
2023 | | |
As of
December 31,
2022 | |
| | |
(Unaudited) | | |
| |
| Cash on hand | |
$ | 465,853 | | |
$ | 471,408 | |
| Cash in bank | |
| 24,272,524 | | |
| 6,459,231 | |
| Subtotal | |
| 24,783,377 | | |
| 6,930,639 | |
| Restricted cash – current (a) | |
| 17,059 | | |
| - | |
| Restricted cash – non-current (b) | |
| 1,274,956 | | |
| 1,300,005 | |
| Cash, cash equivalents, and restricted cash | |
$ | 26,030,392 | | |
$ | 8,230,644 | |
| (a) | During the six months ended June 30, 2023, with regards to various labor-related lawsuits in the PRC,
the PRC Court issued an order to freeze one of the Company’s bank accounts which restricted or prohibited the transfer and use of
deposited funds by the Company. The sum will be released when the Company has paid to satisfy the claims. |
| (b) | The non-current restricted cash represents cash pledged with a local bank in Thailand as collateral for
bank guarantees issued by those banks in respect of the Company’s Cash-In-Transit projects. |
|
| X |
- References
+ Details
| Name: |
ifrs-full_CashAndCashEquivalentsAbstract |
| Namespace Prefix: |
ifrs-full_ |
| Data Type: |
xbrli:stringItemType |
| Balance Type: |
na |
| Period Type: |
duration |
|
v3.23.3
Inventories (Tables)
|
6 Months Ended |
Jun. 30, 2023 |
|---|
| Disclosure of Inventories Table [Abstract] |
|
| Schedule of Inventories |
| | |
As of
June 30,
2023 | | |
As of
December 31,
2022 | |
| | |
(Unaudited) | | |
| |
| Robots in warehouse | |
$ | 4,976,219 | | |
$ | 5,553,859 | |
| Robots in transit | |
| 46,950 | | |
| - | |
| Security equipment | |
| 415,036 | | |
| 494,793 | |
| Impairment provision for inventories | |
| (3,801,960 | ) | |
| (942,882 | ) |
| Inventories | |
$ | 1,636,245 | | |
$ | 5,105,770 | |
|
| X |
- References
+ Details
| Name: |
gfai_DisclosureOfInventoryTableTextBlock |
| Namespace Prefix: |
gfai_ |
| Data Type: |
dtr:textBlockItemType |
| Balance Type: |
na |
| Period Type: |
duration |
|
| X |
- References
+ Details
| Name: |
gfai_InventoriesTablesLineItems |
| Namespace Prefix: |
gfai_ |
| Data Type: |
xbrli:stringItemType |
| Balance Type: |
na |
| Period Type: |
duration |
|
v3.23.3
Trade Receivables, Net (Tables)
|
6 Months Ended |
Jun. 30, 2023 |
|---|
| Trade Receivables, Net [Abstract] |
|
| Schedule of Trade Receivable |
| | |
As of
June 30,
2023 | | |
As of
December 31,
2022 | |
| | |
(Unaudited) | | |
| |
| Trade receivable | |
$ | 5,160,600 | | |
$ | 5,392,720 | |
| (Impairment provision) recovery of doubtful accounts | |
| (32,602 | ) | |
| 7,466 | |
| Trade receivable, net | |
$ | 5,127,998 | | |
$ | 5,400,186 | |
|
| X |
- References
+ Details
| Name: |
gfai_TradeReceivablesNetAbstract |
| Namespace Prefix: |
gfai_ |
| Data Type: |
xbrli:stringItemType |
| Balance Type: |
na |
| Period Type: |
duration |
|
v3.23.3
Withholding Tax Receivable (Tables)
|
6 Months Ended |
Jun. 30, 2023 |
|---|
| Withholding Tax Receivable [Abstract] |
|
| Schedule of Withholding Tax Receivables |
| | |
2023 | | |
2022 | |
| | |
(Unaudited) | | |
(Unaudited) | |
| Balance at January 1, | |
$ | 2,691,096 | | |
$ | 3,531,953 | |
| Addition | |
| 401,941 | | |
| 381,966 | |
| Collection | |
| - | | |
| (1,045,061 | ) |
| Write off/ Allowance for uncollectible | |
| (561,277 | ) | |
| (263,340 | ) |
| Exchange difference | |
| (73,713 | ) | |
| (153,902 | ) |
| Balance at June 30, | |
$ | 2,458,047 | | |
$ | 2,451,616 | |
|
| Schedule of Current and Non Current Portion of Tax Receivables |
| | |
As of
June 30,
2023 | | |
As of
December 31,
2022 | |
| | |
(Unaudited) | | |
| |
| Current portion | |
$ | 536,974 | | |
$ | 757,024 | |
| Non-current portion | |
| 1,921,073 | | |
| 1,934,072 | |
| Withholding tax receivable | |
$ | 2,458,047 | | |
$ | 2,691,096 | |
|
| X |
- References
+ Details
| Name: |
gfai_DisclosureOfWithholdingTaxReceivablesExplanatoryTableTextBlock |
| Namespace Prefix: |
gfai_ |
| Data Type: |
dtr:textBlockItemType |
| Balance Type: |
na |
| Period Type: |
duration |
|
| X |
- References
+ Details
| Name: |
gfai_ScheduleOfCurrentAndNonCurrentPortionOfTaxReceivablesTableTextBlock |
| Namespace Prefix: |
gfai_ |
| Data Type: |
dtr:textBlockItemType |
| Balance Type: |
na |
| Period Type: |
duration |
|
| X |
- References
+ Details
| Name: |
gfai_WithholdingTaxReceivableAbstract |
| Namespace Prefix: |
gfai_ |
| Data Type: |
xbrli:stringItemType |
| Balance Type: |
na |
| Period Type: |
duration |
|
v3.23.3
Other Receivables (Tables)
|
6 Months Ended |
Jun. 30, 2023 |
|---|
| Other Receivables [Abstract] |
|
| Schedule of Other Receivables |
| | |
As of
June 30,
2023 | | |
As of
December 31,
2022 | |
| | |
(Unaudited) | | |
| |
| Cash advance to a third-party vendor | |
$ | 778,724 | | |
$ | 817,564 | |
| Impairment provision for other receivables | |
| (778,724 | ) | |
| - | |
| | |
$ | - | | |
$ | 817,564 | |
|
| X |
- Definition
+ References
+ Details
| Name: |
gfai_OtherReceivablesTableTextBlock |
| Namespace Prefix: |
gfai_ |
| Data Type: |
dtr:textBlockItemType |
| Balance Type: |
na |
| Period Type: |
duration |
|
| X |
- References
+ Details
| Name: |
ifrs-full_TradeAndOtherReceivablesAbstract |
| Namespace Prefix: |
ifrs-full_ |
| Data Type: |
xbrli:stringItemType |
| Balance Type: |
na |
| Period Type: |
duration |
|
v3.23.3
Other Current and Other Non-Current Assets (Tables)
|
6 Months Ended |
Jun. 30, 2023 |
|---|
| Other Current and Other Non-Current Assets [Abstract] |
|
| Schedule of Other Current and Other Non-Current Assets |
| | |
As of
June 30,
2023 | | |
As of
December 31,
2022 | |
| | |
(Unaudited) | | |
| |
| Input VAT and other taxes receivable | |
$ | 314,855 | | |
$ | 293,429 | |
| Prepayments – office and warehouse rental | |
| 1,240,967 | | |
| 780,279 | |
| Prepayments - insurance | |
| 375,985 | | |
| 106,167 | |
| Prepayments - others | |
| 166,165 | | |
| 91,926 | |
| Uniforms | |
| 14,781 | | |
| 24,699 | |
| Tools and supplies | |
| 152,035 | | |
| 155,642 | |
| Deferred costs | |
| 90,555 | | |
| 219,782 | |
| Cash advances to employees | |
| 25,375 | | |
| 71,084 | |
| Other current assets | |
$ | 2,380,718 | | |
$ | 1,743,008 | |
| | |
| | | |
| | |
| Deposits | |
$ | 397,030 | | |
$ | 437,602 | |
| Deferred costs | |
| - | | |
| 9,720 | |
| Other non-current assets | |
$ | 397,030 | | |
$ | 447,322 | |
|
| X |
- References
+ Details
| Name: |
gfai_OtherCurrentAndOtherNonCurrentAssetsAbstract |
| Namespace Prefix: |
gfai_ |
| Data Type: |
xbrli:stringItemType |
| Balance Type: |
na |
| Period Type: |
duration |
|
| X |
- References
+ Details
| Name: |
gfai_ScheduleOtherCurrentAndNoncurrentAssetsTableTextBlock |
| Namespace Prefix: |
gfai_ |
| Data Type: |
dtr:textBlockItemType |
| Balance Type: |
na |
| Period Type: |
duration |
|
v3.23.3
Property, Plant and Equipment (Tables)
|
6 Months Ended |
Jun. 30, 2023 |
|---|
| Property ,plant and equipment [Member] |
|
| Property, Plant and Equipment (Tables) [Line Items] |
|
| Schedule of Property, Plant and Equipment |
| | |
Leasehold
improvements | | |
Machinery
and
equipment | | |
Office
decoration
and
equipment | | |
Vehicles | | |
Assets
under
construction | | |
GDM
machines | | |
Robots | | |
Total | |
| Cost | |
| | |
| | |
| | |
| | |
| | |
| | |
| | |
| |
| At December 31, 2021 | |
$ | 3,239,683 | | |
$ | 5,108,501 | | |
$ | 5,412,444 | | |
$ | 16,233,868 | | |
$ | 248,686 | | |
$ | 1,713,926 | | |
$ | 5,369,070 | | |
$ | 37,326,178 | |
| Acquisitions through business combinations | |
| - | | |
| - | | |
| 205,070 | | |
| 141,619 | | |
| - | | |
| - | | |
| 2,571,013 | | |
| 2,917,702 | |
| Additions | |
| 26,342 | | |
| 18,698 | | |
| 18,603 | | |
| 80,350 | | |
| - | | |
| 318,905 | | |
| 2,178,914 | | |
| 2,641,812 | |
| Disposals | |
| (101,834 | ) | |
| (7,437 | ) | |
| (15,463 | ) | |
| (344,818 | ) | |
| (211,659 | ) | |
| (15,892 | ) | |
| (12,273 | ) | |
| (709,376 | ) |
| Exchange differences | |
| (173,963 | ) | |
| (281,325 | ) | |
| (298,630 | ) | |
| (880,949 | ) | |
| (4,472 | ) | |
| (107,391 | ) | |
| (392,122 | ) | |
| (2,138,852 | ) |
| At June 30, 2022 (Unaudited) | |
| 2,990,228 | | |
| 4,838,437 | | |
| 5,322,024 | | |
| 15,230,070 | | |
| 32,555 | | |
| 1,909,548 | | |
| 9,714,602 | | |
| 40,037,464 | |
| | |
| | | |
| | | |
| | | |
| | | |
| | | |
| | | |
| | | |
| | |
| At December 31, 2022 | |
$ | 3,146,864 | | |
$ | 4,868,015 | | |
$ | 5,354,351 | | |
$ | 15,518,987 | | |
$ | 33,222 | | |
$ | 1,948,698 | | |
$ | 7,194,815 | | |
$ | 38,064,952 | |
| Additions | |
| - | | |
| 1,750 | | |
| 6,964 | | |
| - | | |
| - | | |
| 624,126 | | |
| 273,779 | | |
| 906,619 | |
| Disposals | |
| (104,773 | ) | |
| (105,939 | ) | |
| (48,955 | ) | |
| (47,155 | ) | |
| - | | |
| - | | |
| (56,389 | ) | |
| (363,211 | ) |
| Impairment of fixed assets | |
| - | | |
| - | | |
| - | | |
| - | | |
| - | | |
| - | | |
| (1,591,766 | ) | |
| (1,591,766 | ) |
| Exchange differences | |
| (60,518 | ) | |
| (95,521 | ) | |
| (106,807 | ) | |
| (353,552 | ) | |
| (652 | ) | |
| (38,238 | ) | |
| (141,241 | ) | |
| (796,529 | ) |
| At June 30, 2023 (Unaudited) | |
| 2,981,573 | | |
| 4,668,305 | | |
| 5,205,553 | | |
| 15,118,280 | | |
| 32,570 | | |
| 2,534,586 | | |
| 5,679,198 | | |
| 36,220,065 | |
| | |
| | | |
| | | |
| | | |
| | | |
| | | |
| | | |
| | | |
| | |
| Accumulated Depreciation | |
| | | |
| | | |
| | | |
| | | |
| | | |
| | | |
| | | |
| | |
| At December 31, 2021 | |
$ | 2,693,472 | | |
$ | 4,906,277 | | |
$ | 4,799,149 | | |
$ | 13,447,168 | | |
$ | - | | |
$ | 891,378 | | |
$ | 691,433 | | |
$ | 27,428,877 | |
| Acquisitions through business combinations | |
| - | | |
| - | | |
| 184,364 | | |
| 136,723 | | |
| - | | |
| - | | |
| 520,516 | | |
| 841,603 | |
| Depreciation charged for the period | |
| 51,903 | | |
| 57,623 | | |
| 96,235 | | |
| 416,775 | | |
| - | | |
| 188,620 | | |
| 762,874 | | |
| 1,574,030 | |
| Disposals | |
| (99,439 | ) | |
| (7,396 | ) | |
| (15,432 | ) | |
| (330,993 | ) | |
| - | | |
| (5,303 | ) | |
| (461 | ) | |
| (459,024 | ) |
| Exchange differences | |
| (146,005 | ) | |
| (271,901 | ) | |
| (268,318 | ) | |
| (742,974 | ) | |
| - | | |
| (56,970 | ) | |
| (81,330 | ) | |
| (1,567,498 | ) |
| As June 30, 2022 (Unaudited) | |
| 2,499,931 | | |
| 4,684,603 | | |
| 4,795,998 | | |
| 12,926,699 | | |
| - | | |
| 1,017,725 | | |
| 1,893,032 | | |
| 27,817,988 | |
| | |
| | | |
| | | |
| | | |
| | | |
| | | |
| | | |
| | | |
| | |
| At December 31, 2022 | |
$ | 2,577,341 | | |
$ | 4,748,031 | | |
$ | 4,889,742 | | |
$ | 13,493,656 | | |
$ | - | | |
$ | 1,230,247 | | |
$ | 3,059,174 | | |
$ | 29,998,191 | |
| Depreciation charged for the period | |
| 48,922 | | |
| 34,180 | | |
| 87,164 | | |
| 263,962 | | |
| - | | |
| 202,983 | | |
| 516,626 | | |
| 1,153,837 | |
| Disposals | |
| (108,213 | ) | |
| (109,514 | ) | |
| (44,542 | ) | |
| (48,748 | ) | |
| | | |
| - | | |
| (14,847 | ) | |
| (325,864 | ) |
| Exchange differences | |
| (48,443 | ) | |
| (90,705 | ) | |
| (101,287 | ) | |
| (275,519 | ) | |
| - | | |
| (30,774 | ) | |
| (77,779 | ) | |
| (624,507 | ) |
| As June 30, 2023 (Unaudited) | |
| 2,469,607 | | |
| 4,581,992 | | |
| 4,831,077 | | |
| 13,433,351 | | |
| - | | |
| 1,402,456 | | |
| 3,483,174 | | |
| 30,201,657 | |
| | |
| | | |
| | | |
| | | |
| | | |
| | | |
| | | |
| | | |
| | |
| Net book value | |
| | | |
| | | |
| | | |
| | | |
| | | |
| | | |
| | | |
| | |
| At June 30, 2022 (Unaudited) | |
$ | 490,298 | | |
$ | 153,834 | | |
$ | 526,026 | | |
$ | 2,303,371 | | |
$ | 32,555 | | |
$ | 891,822 | | |
$ | 7,821,570 | | |
$ | 12,219,476 | |
| At June 30, 2023 (Unaudited) | |
$ | 511,966 | | |
$ | 86,313 | | |
$ | 374,476 | | |
$ | 1,684,929 | | |
$ | 32,570 | | |
$ | 1,132,130 | | |
$ | 2,196,024 | | |
$ | 6,018,408 | |
|
| X |
- References
+ Details
| Name: |
gfai_PropertyPlantandEquipmentTablesLineItems |
| Namespace Prefix: |
gfai_ |
| Data Type: |
xbrli:stringItemType |
| Balance Type: |
na |
| Period Type: |
duration |
|
| X |
- DefinitionSchedule of property, plant and equipment.
| Name: |
gfai_ScheduleOfPropertyPlantAndEquipmentTableTextBlock |
| Namespace Prefix: |
gfai_ |
| Data Type: |
dtr:textBlockItemType |
| Balance Type: |
na |
| Period Type: |
duration |
|
| X |
- Details
| Name: |
ifrs-full_CarryingAmountAccumulatedDepreciationAmortisationAndImpairmentAndGrossCarryingAmountAxis=ifrs-full_AccumulatedDepreciationAndAmortisationMember |
| Namespace Prefix: |
|
| Data Type: |
na |
| Balance Type: |
|
| Period Type: |
|
|
v3.23.3
Right-of-Use Assets and Operating Lease Liabilities (Tables)
|
6 Months Ended |
Jun. 30, 2023 |
|---|
| Right-of-Use Assets and Operating Lease Liabilities [Abstract] |
|
| Schedule of Carrying Amounts of Right-of-Use Assets |
The carrying amounts of right-of-use assets are
as below:
| | |
2023 | | |
2022 | |
| | |
(Unaudited) | | |
(Unaudited) | |
| Balance at January 1, | |
$ | 4,171,409 | | |
$ | 2,364,993 | |
| New leases | |
| 271,004 | | |
| 804,500 | |
| New leases acquired through business combinations | |
| - | | |
| 167,597 | |
| Depreciation expense | |
| (1,042,981 | ) | |
| (1,095,227 | ) |
| Exchange difference | |
| (75,562 | ) | |
| (108,566 | ) |
| Balance at June 30, | |
$ | 3,323,870 | | |
$ | 2,133,297 | |
|
| X |
- References
+ Details
| Name: |
gfai_RightofUseAssetsAndOperatingLeaseLiabilitiesAbstract |
| Namespace Prefix: |
gfai_ |
| Data Type: |
xbrli:stringItemType |
| Balance Type: |
na |
| Period Type: |
duration |
|
| X |
- References
+ Details
| Name: |
gfai_ScheduleOfCarryingAmountsOfRightofuseAssetTableTextBlock |
| Namespace Prefix: |
gfai_ |
| Data Type: |
dtr:textBlockItemType |
| Balance Type: |
na |
| Period Type: |
duration |
|
v3.23.3
Intangible Assets (Tables)
|
6 Months Ended |
Jun. 30, 2023 |
|---|
| Intangible Assets [Abstract] |
|
| Schedule of Intangible Assets |
| | |
| | |
| | |
| | |
| | |
| | |
Assets under construction | | |
| | |
| |
| | |
Computer
software | | |
Right-of-use
Platform | | |
Customer
base | | |
Technical
know-how | | |
Security
Surveillance
system | | |
Cash
Management
Systems | | |
Intelligent
Cloud
Platform | | |
Intelligent
Cloud
Platforms | | |
Total | |
| Cost | |
| | |
| | |
| | |
| | |
| | |
| | |
| | |
| | |
| |
| At December 31, 2021 | |
$ | 907,304 | | |
$ | - | | |
$ | - | | |
$ | - | | |
$ | - | | |
$ | - | | |
$ | - | | |
$ | - | | |
$ | 907,304 | |
| Acquisitions through business combinations | |
| - | | |
| 733,311 | | |
| 1,120,688 | | |
| 514,968 | | |
| 1,102,647 | | |
| - | | |
| - | | |
| - | | |
| 3,471,614 | |
| Additions | |
| 1,761 | | |
| - | | |
| | | |
| - | | |
| - | | |
| 81,119 | | |
| 3,000,000 | | |
| | | |
| 3,082,880 | |
| Exchange differences | |
| (49,955 | ) | |
| - | | |
| - | | |
| - | | |
| - | | |
| (3,525 | ) | |
| | | |
| - | | |
| (53,480 | ) |
| At June 30, 2022 (Unaudited) | |
| 859,110 | | |
| 733,311 | | |
| 1,120,688 | | |
| 514,968 | | |
| 1,102,647 | | |
| 77,594 | | |
| 3,000,000 | | |
| - | | |
| 7,408,318 | |
| | |
| | | |
| | | |
| | | |
| | | |
| | | |
| | | |
| | | |
| | | |
| | |
| At December 31, 2022 | |
$ | 887,745 | | |
$ | 673,029 | | |
$ | 1,042,110 | | |
$ | 499,344 | | |
$ | 1,360,898 | | |
$ | 194,495 | | |
$ | 3,000,000 | | |
$ | - | | |
$ | 7,657,621 | |
| Additions | |
| - | | |
| - | | |
| - | | |
| - | | |
| 195,087 | | |
| - | | |
| - | | |
| 1,597,754 | | |
| 1,792,841 | |
| Transfer | |
| - | | |
| - | | |
| - | | |
| - | | |
| - | | |
| - | | |
| (2,821,882 | ) | |
| 2,821,882 | | |
| - | |
| Exchange differences | |
| (17,419 | ) | |
| (31,974 | ) | |
| (49,509 | ) | |
| (23,723 | ) | |
| (306,604 | ) | |
| (3,816 | ) | |
| - | | |
| - | | |
| (433,045 | ) |
| At June 30, 2023 (Unaudited) | |
| 870,326 | | |
| 641,055 | | |
| 992,601 | | |
| 475,621 | | |
| 1,249,381 | | |
| 190,679 | | |
| 178,118 | | |
| 4,419,636 | | |
| 9,017,417 | |
| | |
| | | |
| | | |
| | | |
| | | |
| | | |
| | | |
| | | |
| | | |
| | |
| Accumulated amortization | |
| | | |
| | | |
| | | |
| | | |
| | | |
| | | |
| | | |
| | | |
| | |
| At December 31, 2021 | |
$ | 742,988 | | |
$ | - | | |
$ | - | | |
$ | - | | |
$ | - | | |
$ | - | | |
$ | - | | |
$ | - | | |
$ | 742,988 | |
| Acquisitions through business combinations | |
| - | | |
| - | | |
| - | | |
| - | | |
| 285,433 | | |
| - | | |
| - | | |
| - | | |
| 285,433 | |
| Amortization charged for the period | |
| 25,290 | | |
| 17,951 | | |
| 129,327 | | |
| - | | |
| - | | |
| - | | |
| - | | |
| - | | |
| 172,568 | |
| Exchange differences | |
| (41,944 | ) | |
| | | |
| - | | |
| - | | |
| - | | |
| - | | |
| - | | |
| - | | |
| (41,944 | ) |
| As June 30, 2022 (Unaudited) | |
| 726,334 | | |
| 17,951 | | |
| 129,327 | | |
| - | | |
| 285,433 | | |
| - | | |
| - | | |
| - | | |
| 1,159,045 | |
| | |
| | | |
| | | |
| | | |
| | | |
| | | |
| | | |
| | | |
| | | |
| | |
| At December 31, 2022 | |
$ | 767,168 | | |
$ | 50,477 | | |
$ | 405,868 | | |
$ | 28,405 | | |
$ | 612,560 | | |
$ | - | | |
$ | - | | |
$ | - | | |
$ | 1,864,478 | |
| Amortization charged for the period | |
| 26,139 | | |
| 33,582 | | |
| 201,013 | | |
| 28,346 | | |
| 63,817 | | |
| - | | |
| - | | |
| 182,671 | | |
| 535,568 | |
| Exchange differences | |
| (15,908 | ) | |
| (3,927 | ) | |
| (28,438 | ) | |
| (2,641 | ) | |
| (286,182 | ) | |
| - | | |
| - | | |
| - | | |
| (337,096 | ) |
| As June 30, 2023 (Unaudited) | |
| 777,399 | | |
| 80,132 | | |
| 578,443 | | |
| 54,110 | | |
| 390,195 | | |
| - | | |
| - | | |
| 182,671 | | |
| 2,062,950 | |
| | |
| | | |
| | | |
| | | |
| | | |
| | | |
| | | |
| | | |
| | | |
| | |
| Net book value | |
| | | |
| | | |
| | | |
| | | |
| | | |
| | | |
| | | |
| | | |
| | |
| At June 30, 2022 (Unaudited) | |
$ | 132,776 | | |
$ | 715,360 | | |
$ | 991,361 | | |
$ | 514,968 | | |
$ | 817,214 | | |
$ | 77,594 | | |
$ | 3,000,000 | | |
$ | - | | |
$ | 6,249,273 | |
| At June 30, 2023 (Unaudited) | |
$ | 92,927 | | |
$ | 560,923 | | |
$ | 414,158 | | |
$ | 421,511 | | |
$ | 859,186 | | |
$ | 190,679 | | |
$ | 178,118 | | |
$ | 4,236,965 | | |
$ | 6,954,467 | |
|
| X |
- References
+ Details
| Name: |
gfai_ScheduleOfIntangibleAssetNetTableTextBlock |
| Namespace Prefix: |
gfai_ |
| Data Type: |
dtr:textBlockItemType |
| Balance Type: |
na |
| Period Type: |
duration |
|
| X |
- References
+ Details
| Name: |
ifrs-full_IntangibleAssetsAndGoodwillAbstract |
| Namespace Prefix: |
ifrs-full_ |
| Data Type: |
xbrli:stringItemType |
| Balance Type: |
na |
| Period Type: |
duration |
|
v3.23.3
Trade and Other payables and Other Current Liabilities (Tables)
|
6 Months Ended |
Jun. 30, 2023 |
|---|
| Trade and Other payables and Other Current Liabilities [Abstract] |
|
| Schedule of Trade and Other Payables and Other Current Liabilities |
| | |
As of
June 30,
2023 | | |
As of
December 31,
2022 | |
| | |
(Unaudited) | | |
| |
| Trade payables – third parties | |
$ | 2,596,576 | | |
$ | 2,060,856 | |
| Accrued salaries and bonus | |
| 454,218 | | |
| 515,758 | |
| Accrued customer claims, cash loss and shortage ** | |
| 15,044 | | |
| 57,381 | |
| Trade and other payables | |
$ | 3,065,838 | | |
$ | 2,633,995 | |
| | |
| | | |
| | |
| Output VAT | |
$ | 74,171 | | |
$ | 118,125 | |
| Accrued expenses | |
| 389,318 | | |
| 522,059 | |
| Payroll payable | |
| 1,776,907 | | |
| 979,027 | |
| Other payables | |
| 168,052 | | |
| 289,494 | |
| Deferred revenue | |
| 428,839 | | |
| 568,664 | |
| Other current liabilities | |
$ | 2,837,287 | | |
$ | 2,477,369 | |
| | ** | Includes a provision for penalty for failure to meet performance indicators as stipulated in certain customer contracts for approximately $7,108 and $11,800 as of June 30, 2023 and 2022, respectively. |
|
| X |
- DefinitionTabular disclosure for trade and other payables and other current liabilities.
| Name: |
gfai_ScheduleOfTradeAndOtherPayablesAndOtherCurrentLiabilitiesTableTextBlock |
| Namespace Prefix: |
gfai_ |
| Data Type: |
dtr:textBlockItemType |
| Balance Type: |
na |
| Period Type: |
duration |
|
| X |
- References
+ Details
| Name: |
gfai_TradeAndOtherPayablesAndOtherCurrentLiabilitiesAbstract |
| Namespace Prefix: |
gfai_ |
| Data Type: |
xbrli:stringItemType |
| Balance Type: |
na |
| Period Type: |
duration |
|
v3.23.3
Borrowings (Tables)
|
6 Months Ended |
Jun. 30, 2023 |
|---|
| Borrowings [Abstract] |
|
| Schedule of Borrowings |
| |
|
As of
June 30,
2023 |
|
|
As of
December 31,
2022 |
|
| |
|
(Unaudited) |
|
|
|
|
| Current portion of long-term bank borrowings |
|
$ |
1,039,988 |
|
|
$ |
947,559 |
|
| Current portion of long-term third-party borrowing |
|
|
2,469,721 |
|
|
|
2,234,057 |
|
| Long-term bank borrowings |
|
|
138,212 |
|
|
|
432,179 |
|
| Long-term third-party borrowing |
|
|
13,589,362 |
|
|
|
13,467,639 |
|
| Total borrowings |
|
$ |
17,237,283 |
|
|
$ |
17,081,434 |
|
|
| X |
- References
+ Details
| Name: |
gfai_BorrowingsFromFinancialInstitutionsTableTextBlock |
| Namespace Prefix: |
gfai_ |
| Data Type: |
dtr:textBlockItemType |
| Balance Type: |
na |
| Period Type: |
duration |
|
| X |
- References
+ Details
| Name: |
ifrs-full_BorrowingsAbstract |
| Namespace Prefix: |
ifrs-full_ |
| Data Type: |
xbrli:stringItemType |
| Balance Type: |
na |
| Period Type: |
duration |
|
v3.23.3
Finance Lease Liabilities (Tables)
|
6 Months Ended |
Jun. 30, 2023 |
|---|
| Finance Lease Liabilities [Abstract] |
|
| Schedule of Finance Lease Liabilities |
| | |
As of
June 30,
2023 | | |
As of
December 31,
2022 | |
| | |
(Unaudited) | | |
| |
| Current portion | |
$ | 200,383 | | |
$ | 398,136 | |
| Non-current portion | |
| 229,747 | | |
| 233,550 | |
| Finance lease liabilities | |
$ | 430,130 | | |
$ | 631,686 | |
|
| Schedule of Minimum Lease Payments Under Finance Lease Agreements |
The minimum lease payments under finance
lease agreements are as follows:
| | |
As of
June 30,
2023 | | |
As of
December 31,
2022 | |
| | |
(Unaudited) | | |
| |
| Within 1 year | |
$ | 212,173 | | |
$ | 423,514 | |
| After 1 year but within 5 years | |
| 248,490 | | |
| 253,448 | |
| Less: Finance charges | |
| (30,533 | ) | |
| (45,276 | ) |
| Present value of finance lease liabilities, net | |
$ | 430,130 | | |
$ | 631,686 | |
|
| Schedule of Finance Lease Assets Comprise Primarily Vehicles and Office Equipment |
Finance lease assets comprise primarily
vehicles and office equipment as follow:
| | |
As of
June 30,
2023 | | |
As of
December 31,
2022 | |
| | |
(Unaudited) | | |
| |
| Cost | |
$ | 1,540,416 | | |
$ | 1,571,075 | |
| Less: Accumulated depreciation | |
| (618,097 | ) | |
| (564,844 | ) |
| Net book value | |
$ | 922,319 | | |
$ | 1,006,231 | |
|
| X |
- DefinitionTabular disclosure for finance lease liabilities.
| Name: |
gfai_ScheduleOfFinancialLeaseLiabilitiesTableTextBlock |
| Namespace Prefix: |
gfai_ |
| Data Type: |
dtr:textBlockItemType |
| Balance Type: |
na |
| Period Type: |
duration |
|
| X |
- DefinitionTabular disclosure for leased assets under a finance lease.
| Name: |
gfai_ScheduleOfLeasedAssetsUnderFinanceLeaseTableTextBlock |
| Namespace Prefix: |
gfai_ |
| Data Type: |
dtr:textBlockItemType |
| Balance Type: |
na |
| Period Type: |
duration |
|
| X |
- DefinitionTabular disclosure for minimum lease payments under finance lease agreements.
| Name: |
gfai_ScheduleOfMinimumLeasePaymentsUnderFinanceLeaseAgreementsTableTextBlock |
| Namespace Prefix: |
gfai_ |
| Data Type: |
dtr:textBlockItemType |
| Balance Type: |
na |
| Period Type: |
duration |
|
| X |
- References
+ Details
| Name: |
ifrs-full_LeaseLiabilitiesAbstract |
| Namespace Prefix: |
ifrs-full_ |
| Data Type: |
xbrli:stringItemType |
| Balance Type: |
na |
| Period Type: |
duration |
|
v3.23.3
Provision for Employee Benefits (Tables)
|
6 Months Ended |
Jun. 30, 2023 |
|---|
| Provision for Employee Benefits [Abstract] |
|
| Schedule of Retired Benefit Plan |
The plan asset is unfunded
and the Company will pay benefits when needed.
| | |
Provision for
employee benefits | |
| | |
2023 | | |
2022 | |
| | |
(Unaudited) | | |
(Unaudited) | |
| Defined benefit obligations at January 1, | |
$ | 4,849,614 | | |
$ | 5,819,132 | |
| Estimate for the six months period* | |
| (74,552 | ) | |
| (348,418 | ) |
| Defined benefit obligations at June 30, | |
$ | 4,775,062 | | |
$ | 5,470,714 | |
| * | The estimate represents the difference between the Company’s estimated defined benefit obligations based on employees’ past service and expected future salary at the beginning of the fiscal year and the end of the six months period. |
|
| X |
- References
+ Details
| Name: |
gfai_ScheduleOfPresentValueOfDefinedBenefitObligationTableTextBlock |
| Namespace Prefix: |
gfai_ |
| Data Type: |
dtr:textBlockItemType |
| Balance Type: |
na |
| Period Type: |
duration |
|
| X |
- References
+ Details
| Name: |
ifrs-full_ClassesOfEmployeeBenefitsExpenseAbstract |
| Namespace Prefix: |
ifrs-full_ |
| Data Type: |
xbrli:stringItemType |
| Balance Type: |
na |
| Period Type: |
duration |
|
v3.23.3
Selling, Distribution and Administrative Expenses (Tables)
|
6 Months Ended |
Jun. 30, 2023 |
|---|
| Selling, Distribution and Administrative Expenses [Abstract] |
|
| Schedule of Administrative Expenses |
| | |
For the six months ended
June 30, | |
| | |
2023 | | |
2022 | |
| | |
(Unaudited) | | |
(Unaudited) | |
| Staff expense | |
$ | 3,602,127 | | |
$ | 2,988,331 | |
| Rental expense | |
| 345,026 | | |
| 77,999 | |
| Depreciation and amortization expense | |
| 1,251,359 | | |
| 1,176,705 | |
| Utilities expense | |
| 53,015 | | |
| 30,021 | |
| Travelling and entertainment expense | |
| 135,186 | | |
| 216,633 | |
| Marketing expense | |
| 150,203 | | |
| 228,054 | |
| Professional fees | |
| 774,553 | | |
| 1,262,085 | |
| Repairs and maintenance | |
| 35,298 | | |
| 26,835 | |
| Employee benefits | |
| 29,316 | | |
| 228,506 | |
| Research and development expense | |
| 95,322 | | |
| 68,946 | |
| Other expenses** | |
| 510,255 | | |
| 673,881 | |
| | |
$ | 6,981,660 | | |
$ | 6,977,996 | |
| ** | Other
expenses mainly comprised of office expenses, stamp duties, training costs, transportation costs for robots, etc. |
|
| X |
- References
+ Details
| Name: |
gfai_ScheduleOfAdministrativeExpensesTableTextBlock |
| Namespace Prefix: |
gfai_ |
| Data Type: |
dtr:textBlockItemType |
| Balance Type: |
na |
| Period Type: |
duration |
|
| X |
- References
+ Details
| Name: |
ifrs-full_SellingGeneralAndAdministrativeExpenseAbstract |
| Namespace Prefix: |
ifrs-full_ |
| Data Type: |
xbrli:stringItemType |
| Balance Type: |
na |
| Period Type: |
duration |
|
v3.23.3
Related Party Transactions (Tables)
|
6 Months Ended |
Jun. 30, 2023 |
|---|
| Related Party Transactions [Abstract] |
|
| Schedule of Amounts Due from Related Parties |
Amounts due from related parties:
| | |
| |
As of
June 30,
2023 | | |
As of
December 31,
2022 | |
| | |
| |
(Unaudited) | | |
| |
| Guardforce TH Group Company Limited | |
(c) | |
$ | 1,749 | | |
$ | 894 | |
| Guardforce AI Technology Limited | |
(c) | |
| 423 | | |
| 423 | |
| Guardforce AI Service Limited | |
(c) | |
| 423 | | |
| 423 | |
| Shenzhen Intelligent Guardforce Robot Technology Co., Limited | |
(a) | |
| 5,544,156 | | |
| 7,312,883 | |
| Shareholders’ of Shenzhen Kewei Robot Technology Co., Limited and its subsidiaries | |
(b) | |
| 2,160,000 | | |
| 7,020,000 | |
| Nanjing Zhongzhi Yonghao Robot Co., Ltd. | |
(c) | |
| - | | |
| 7,297 | |
| Nanchang Zongkun Intelligent Technology Co., Ltd. | |
(c) | |
| - | | |
| 7,310 | |
| Sichuan Qiantu Guardforce Robot Technology Co., Ltd. | |
(c) | |
| - | | |
| 3,777 | |
| Shanghai Nanshao Fire Engineering and Equipment Co., Ltd. | |
(c) | |
| - | | |
| 144,737 | |
| CSF Mingda Technology Co., Ltd | |
(c) | |
| 9,752 | | |
| 11,129 | |
| | |
| |
$ | 7,716,503 | | |
$ | 14,508,873 | |
| (a) | Amounts due from Shenzhen Intelligent Guardforce Robot Technology Co., Limited (“CIOT”) comprised of $4,481,346 representing prepayments for the purchase of robots from a related party and $1,062,809 receivables in connection with the robots returned to a related party. On May 25, 2023, following the repayment plan provided by Tu Jingyi (“Mr. Tu”) to the Company on March 1, 2023 in connection with the settlement of the outstanding balance of the receivables due from the related parties under Mr. Tu’s control, the Company entered into an agreement with Mr. Tu, Shenzhen Intelligent Guardforce Robot Technology Co., Limited (“CIOT”), Shenzhen Kewei Robot Technology Co., Limited and its subsidiaries (“Shenzhen Kewei”) and Guardforce Holdings (HK) Limited (“GF Holdings”) to legally enforce the right to set-off certain recognized related party receivable and payable amounts on a net basis (“Netting Arrangement”). Mr. Tu agreed to waive the Company’s repayment of the borrowings from Guardforce Holdings (HK) Limited in an aggregate amount of $1,500,000 to offset the same amount of related party receivables with CIOT. As of the date of this filing, the Company is negotiating with Mr. Tu on the settlement of the second installment of $1,500,000 which is due on September 30, 2023 in accordance with the repayment plan. | | (b) | On May 24, 2022, the Company entered into a securities purchase agreement with Shenzhen Kewei Robot Technology Co., Limited (“Shenzhen Kewei”) to acquire 100% of the equity interests in seven Kewei Group companies from Shenzhen Kewei. The acquisition purchase price of $21,600,000 in a mix of cash (10%) and restricted ordinary shares of the Company (90%) were fully paid during the year ended December 31, 2022. Based on the market share price at the issuance date, the equity portion of the deposit paid for business acquisitions was valued at $4,860,000. | On September 13, 2022, the Company terminated the securities purchase agreement, the cash paid to Shenzhen Kewei was agreed to be refunded and the shares issued to Shenzhen Kewei was agreed to be returned. On February 13, 2023, 243,000 restricted ordinary shares amounting to $4,860,000 were returned to and canceled by the Company. On March 31, 2023, shareholders’ of Shenzhen Kewei repaid RMB2,000,000 (approximately $291,000) to the Company. On May 25, 2023, an amount of $1,500,000 due was offset with the borrowings from Guardforce Holdings (HK) Limited under the Netting Arrangement. | (c) | Amounts due from these related parties represent business advances for operational purposes. |
|
| Schedule of Amounts Due to Related Parties |
Amounts due to related parties:
| | |
| |
As of
June 30,
2023 | | |
As of
December 31,
2022 | |
| | |
| |
(Unaudited) | | |
| |
| Tu Jingyi | |
(a) | |
$ | 220,808 | | |
$ | 210,028 | |
| Guardforce Holdings (HK) Limited | |
(b) | |
| 423,184 | | |
| 394,016 | |
| Guardforce Security (Thailand) Company Limited | |
(c) | |
| 68,897 | | |
| 77,413 | |
| Shenzhen Kewei Robot Technology Co., Limited and its subsidiaries | |
(d) | |
| 2,569,448 | | |
| 2,403,555 | |
| Shenzhen Zhongzhi Yonghao Robot Co., Ltd. | |
| |
| 376,391 | | |
| 394,151 | |
| Shenzhen Qianban Technology Co., Ltd. | |
(d) | |
| - | | |
| 99,733 | |
| Guardforce Security Service (Shanghai) Co., Ltd. | |
(e) | |
| 34,465 | | |
| 267,764 | |
| Shenzhen Guardforce Qiyun Technology Co., Ltd. | |
(e) | |
| - | | |
| 189 | |
| Shanghai Yongan Security Alarm System Co., Ltd. | |
(e) | |
| 9,650 | | |
| 21,842 | |
| Guardforce Aviation Security Company Limited | |
(c) | |
| 195 | | |
| - | |
| | |
| |
$ | 3,703,038 | | |
$ | 3,868,691 | |
| (a) | Amounts due to Tu Jingyi represented interest accrued on the respective loans. | | (b) | Amounts due to Guardforce Holdings (HK) Limited comprised of $195,398 advances made and $227,786 accrued interests on the loans. | | (c) | Amounts due to Guardforce Security (Thailand) Company Limited and Guardforce Aviation Security Company Limited represent accounts payable for services provided by a related party. | | (d) | Amounts due to Shenzhen Kewei Robot Technology Co., Limited and its subsidiaries comprised of $2,590,621 representing trade payables for the purchase of robots from a related party and $22,173 expense paid on behalf by a related party. | | (e) | Amounts due to related parties represent business advances for operational purposes. |
|
| Schedule of Short-Term Borrowings from Related Parties |
Short-term borrowings from related parties:
| | |
| |
As of
June 30,
2023 | | |
As of
December 31,
2022 | |
| | |
| |
(Unaudited) | | |
| |
| Guardforce Holdings (HK) Limited | |
(a) | |
$ | 1,666,846 | | |
$ | 3,148,500 | |
| (a) | On April 17, 2020, the Company borrowed $2,735,000 from Guardforce Holdings (HK) Limited. As of December 31, 2022, the outstanding balance of this loan was $2,735,000. The loan is unsecured and bears an interest rate at 2%. The loan was due on April 16, 2023 and was verbally agreed to extend with the same terms and conditions until this loan is scheduled to be settled in late 2023. For the six months ended June 30, 2023 and 2022, interest expense on this loan was $25,570 and $27,350, respectively. This loan is classified as short-term borrowing from a related party. On May 25, 2023, the principal amount of this loan of $1,068,154 was settled under the Netting Arrangement. On September 9, 2020, the Company borrowed $413,500 from Guardforce Holdings (HK) Limited. The loan is unsecured and it bears interest at 2%. The loan is due on September 8, 2023. For the six months ended June 30, 2023 and 2022, interest expense on this loan was $3,446 and $4,135, respectively. On May 25, 2023, the principal amount of this loan of $413,500 was settled under the Netting Arrangement. |
|
| Schedule of Long-Term Borrowings from Related Parties |
Long-term borrowings from related parties:
| | |
| |
As of
June 30,
2023 | | |
As of
December 31,
2022 | |
| | |
| |
(Unaudited) | | |
| |
| Guardforce Holdings (HK) Limited | |
(b) | |
$ | - | | |
$ | 18,346 | |
| Tu Jingyi | |
(c) | |
| 1,437,303 | | |
| 1,437,303 | |
| | |
| |
$ | 1,437,303 | | |
$ | 1,455,649 | |
| (b) | On December 31, 2019, the Company borrowed $1,499,998 from Guardforce Holdings (HK) Limited. As of December 31, 2022, the outstanding balance of this loan was $18,346. The loan is unsecured and it bears an interest rate of 2%. The loan is due on June 30,2025. For the six months ended June 30, 2023 and 2022, interest expense on this loan was $153 and $770, respectively. On May 25, 2023, the principal amount of this loan of $18,346 was settled under the Netting Arrangement. | | (c) | On September 1, 2018, the Company entered into an agreement with Tu Jingyi whereby Tu Jingyi loaned $1,437,303 (RMB10 million) to the Company. The loan is unsecured with an interest rate at 1.5%. The loan is due on June 30, 2025. For the six months ended June 30, 2023 and 2022, interest expense on this loan was $10,780 and $nil, respectively. This loan is classified as long-term borrowing from a related party. |
|
| Schedule of Related Party Transactions |
Related party transactions:
| | |
| |
For the six months ended
June 30, | |
| Nature | |
| |
2023 | | |
2022 | |
| | |
| |
(Unaudited) | | |
(Unaudited) | |
| Service/ Products received from related parties: | |
| |
| | |
| |
| Guardforce Security (Thailand) Company Limited | |
(a) | |
$ | 68,897 | | |
$ | 67,864 | |
| Guardforce Aviation Security Company Limited | |
(b) | |
| 600 | | |
| - | |
| Shenzhen Intelligent Guardforce Robot Technology Co., Limited – Purchases | |
(c) | |
| - | | |
| 7,008,322 | |
| Shenzhen Kewei Robot Technology Co., Ltd. – Purchases | |
(c) | |
| 141,569 | | |
| 844,255 | |
| Shenzhen Kewei Robot Technology Co., Limited – ICP | |
(d) | |
| - | | |
| 3,000,000 | |
| | |
| |
$ | 211,066 | | |
$ | 10,920,441 | |
| | |
| |
| | | |
| | |
| Service/ Products delivered to related parties: | |
| |
| | | |
| | |
| GF Technovation Company Limited – Sales | |
(e) | |
$ | - | | |
$ | 134,123 | |
| (a) | Guardforce Security (Thailand) Company Limited provided security guard services to the Company; |
| (b) | Guardforce Aviation Security Company Limited provided escort services to the Company; | | | | | (c) | The Company purchased robots from Shenzhen Intelligent Guardforce Robot Technology Co., Limited and Shenzhen Kewei Robot Technology Co., Ltd. During the six months ended June 30, 2023, the Company purchased 207 robots amounting to $229,162 through an asset purchase agreement (Note 1) and $50,927 through placing standard purchase orders. In addition, 124 robots amounting to $138,520 were returned by the Company. | | | | | (d) | On February 8, 2022, the Company entered into a Commissioned Development Agreement with Shenzhen Kewei Robot Technology Co., Limited (“Shenzhen Kewei”) for the development of a robotics management platform named GFAI Intelligent Cloud Platform V2.0 (“ICP”). The contract amount was $3,000,000 which was paid as a one-time lump sum payment after the execution of the agreement. | | | | | (e) | The Company sold robots and spare parts to GF Technovation Company Limited. |
|
| X |
- References
+ Details
| Name: |
gfai_RelatedPartyTransactionsTebleTextBlock |
| Namespace Prefix: |
gfai_ |
| Data Type: |
dtr:textBlockItemType |
| Balance Type: |
na |
| Period Type: |
duration |
|
| X |
- References
+ Details
| Name: |
gfai_ScheduleOfAmountDueToRelatedPartiesTableTextBlock |
| Namespace Prefix: |
gfai_ |
| Data Type: |
dtr:textBlockItemType |
| Balance Type: |
na |
| Period Type: |
duration |
|
| X |
- References
+ Details
| Name: |
gfai_ScheduleOfAmountsDueFromRelatedPartiesTableTextBlock |
| Namespace Prefix: |
gfai_ |
| Data Type: |
dtr:textBlockItemType |
| Balance Type: |
na |
| Period Type: |
duration |
|
| X |
- References
+ Details
| Name: |
gfai_ScheduleOfLongtermBorrowingsFromRelatedPartyTableTextBlock |
| Namespace Prefix: |
gfai_ |
| Data Type: |
dtr:textBlockItemType |
| Balance Type: |
na |
| Period Type: |
duration |
|
| X |
- References
+ Details
| Name: |
gfai_ScheduleOfShorttermBorrowingFromARelatedPartyTableTextBlock |
| Namespace Prefix: |
gfai_ |
| Data Type: |
dtr:textBlockItemType |
| Balance Type: |
na |
| Period Type: |
duration |
|
v3.23.3
Consolidated Segment Data (Tables)
|
6 Months Ended |
Jun. 30, 2023 |
|---|
| Consolidated Segment Data [Abstract] |
|
| Schedule of Selected Information by Segment |
Selected information by segment is presented in the following
tables for the six months ended June 30, 2023 and 2022:
| | |
For the six months ended
June 30, | |
| Revenues(1) | |
2023 | | |
2022 | |
| | |
(Unaudited) | | |
(Unaudited) | |
| Secured logistics | |
$ | 15,943,156 | | |
$ | 15,960,547 | |
| Information security | |
| 407,689 | | |
| 262,934 | |
| Robotics AI solutions | |
| 440,229 | | |
| 719,041 | |
| General security solutions | |
| 1,622,218 | | |
| - | |
| | |
$ | 18,413,292 | | |
$ | 16,942,522 | |
| (1) | Revenue
excludes intercompany sales. |
| | |
For the six months ended
June 30, | |
| Operating loss | |
2023 | | |
2022 | |
| | |
(Unaudited) | | |
(Unaudited) | |
| Secured logistics | |
$ | (1,101,369 | ) | |
$ | (962,310 | ) |
| Information security | |
| (311,916 | ) | |
| (19,041 | ) |
| Robotics AI solutions | |
| (8,320,982 | ) | |
| (1,977,324 | ) |
| General security solutions | |
| (542,569 | ) | |
| - | |
| Corporate and others (2) | |
| (1,607,373 | ) | |
| (2,590,961 | ) |
| Operating loss | |
| (11,884,209 | ) | |
| (5,549,636 | ) |
| Total other income from five segments | |
| 77,765 | | |
| 46,859 | |
| Foreign exchange losses, net: | |
| | | |
| | |
| - Secured logistics | |
| (598,053 | ) | |
| (751,622 | ) |
| - Information security | |
| 432 | | |
| 44 | |
| - Robotics AI solutions | |
| 13,150 | | |
| 5,973 | |
| - Corporate and others | |
| 810 | | |
| (154 | ) |
| Finance costs: | |
| | | |
| | |
| - Secured logistics | |
| (423,440 | ) | |
| (405,365 | ) |
| - Information security | |
| (6,589 | ) | |
| (1,648 | ) |
| - Corporate and others | |
| (154,868 | ) | |
| (3,848 | ) |
| Loss before income tax | |
| (12,975,002 | ) | |
| (6,659,397 | ) |
| Provision for income tax (expense) benefit | |
| (874,431 | ) | |
| 320,183 | |
| Net loss for the period | |
| (13,849,433 | ) | |
| (6,339,214 | ) |
| Less: Loss attributable to the non-controlling interest | |
| 30,214 | | |
| 32,392 | |
| Net loss attributable to equity holders of the Company | |
$ | (13,819,219 | ) | |
$ | (6,306,822 | ) |
| (2) | Includes
non-cash compensation, legal and professional fees and consultancy fees for the Company. |
|
| Schedule of Depreciation and Amortization by Segment |
Depreciation and amortization by segment for six
months ended June 30, 2023 and 2022 are as follows:
| | |
For the six months ended
June 30, | |
| Depreciation and amortization: | |
2023 | | |
2022 | |
| | |
(Unaudited) | | |
(Unaudited) | |
| Secured logistics | |
$ | 1,570,069 | | |
$ | 1,887,059 | |
| Robotics AI solutions | |
| 741,548 | | |
| 810,319 | |
| General security solutions | |
| 124,713 | | |
| - | |
| | |
$ | 2,436,330 | | |
$ | 2,697,378 | |
|
| Schedule of Total Assets by Segment |
Total assets by segment as of June 30, 2023 and
December 31, 2022 are as follows:
| Total assets | |
As of
June 30,
2023 | | |
As of
December 31,
2022 | |
| | |
(Unaudited) | | |
(Audited) | |
| Secured logistics | |
$ | 22,854,857 | | |
$ | 25,315,845 | |
| Information security | |
| 199,259 | | |
| 615,517 | |
| Robotics AI solutions | |
| 17,330,745 | | |
| 23,577,547 | |
| General security solutions | |
| 2,296,882 | | |
| 4,260,811 | |
| Corporate and others | |
| 21,412,959 | | |
| 7,397,254 | |
| | |
$ | 64,094,702 | | |
$ | 61,166,974 | |
|
| Schedule of Total Non-current Assets by Geographical Segment |
Total non-current assets by geographical segment
as of December 31, 2022 and 2021 are as follows:
| Total non-current assets | |
As of
June 30,
2023 | | |
As of
December 31,
2022 | |
| | |
(Unaudited) | | |
(Audited) | |
| The PRC (including Hong Kong and Macau) | |
$ | 11,762,228 | | |
$ | 11,234,176 | |
| Thailand | |
| 9,774,623 | | |
| 14,223,714 | |
| Other countries | |
| 403,977 | | |
| 446,020 | |
| | |
$ | 21,940,828 | | |
$ | 25,903,910 | |
|
| Schedule of Total liabilities by Segment |
Total liabilities by segment as of June 30, 2023
and December 31, 2022 are as follows:
| Total liabilities | |
As of
June 30,
2023 | | |
As of
December 31,
2022 | |
| | |
(Unaudited) | | |
(Audited) | |
| Secured logistics | |
$ | 12,850,116 | | |
$ | 28,789,053 | |
| Information security | |
| 143,919 | | |
| 238,229 | |
| Robotics AI solutions | |
| 4,477,486 | | |
| 4,580,740 | |
| General security solutions | |
| 1,425,037 | | |
| 1,661,469 | |
| Corporate and others | |
| 20,195,051 | | |
| 6,765,181 | |
| | |
$ | 39,091,609 | | |
$ | 42,034,672 | |
|
| X |
- References
+ Details
| Name: |
gfai_ConsolidatedSegmentDataAbstract |
| Namespace Prefix: |
gfai_ |
| Data Type: |
xbrli:stringItemType |
| Balance Type: |
na |
| Period Type: |
duration |
|
| X |
- DefinitionTabular disclosure of the carrying amounts of other assets. This disclosure includes other current assets and other noncurrent assets.
| Name: |
gfai_ScheduleOfOtherAssetTableTextBlock |
| Namespace Prefix: |
gfai_ |
| Data Type: |
dtr:textBlockItemType |
| Balance Type: |
na |
| Period Type: |
duration |
|
| X |
- References
+ Details
| Name: |
gfai_ScheduleOfSelectedInformationBySegmentTableTextBlock |
| Namespace Prefix: |
gfai_ |
| Data Type: |
dtr:textBlockItemType |
| Balance Type: |
na |
| Period Type: |
duration |
|
| X |
- DefinitionThe disclosure of depreciation and amortisation expense. [Refer: Depreciation and amortisation expense] Reference 1: http://www.xbrl.org/2009/role/commonPracticeRef
-Name IAS
-Number 1
-IssueDate 2023-01-01
-Paragraph 10
-Subparagraph e
-URI https://taxonomy.ifrs.org/xifrs-link?type=IAS&num=1&code=ifrs-tx-2023-en-r&anchor=para_10_e&doctype=Standard
-URIDate 2023-03-23
| Name: |
ifrs-full_DisclosureOfDepreciationAndAmortisationExpenseExplanatory |
| Namespace Prefix: |
ifrs-full_ |
| Data Type: |
dtr-types:textBlockItemType |
| Balance Type: |
na |
| Period Type: |
duration |
|
| X |
- DefinitionThe disclosure of financial liabilities. [Refer: Financial liabilities] Reference 1: http://www.xbrl.org/2003/role/disclosureRef
-Name IFRS
-Number 7
-IssueDate 2023-01-01
-Paragraph 7
-URI https://taxonomy.ifrs.org/xifrs-link?type=IFRS&num=7&code=ifrs-tx-2023-en-r&anchor=para_7&doctype=Standard
-URIDate 2023-03-23
| Name: |
ifrs-full_DisclosureOfFinancialLiabilitiesExplanatory |
| Namespace Prefix: |
ifrs-full_ |
| Data Type: |
dtr-types:textBlockItemType |
| Balance Type: |
na |
| Period Type: |
duration |
|
| X |
- DefinitionThe disclosure of operating segments. [Refer: Operating segments [member]] Reference 1: http://www.xbrl.org/2003/role/disclosureRef
-Name IFRS
-Number 8
-IssueDate 2023-01-01
-Paragraph 23
-URI https://taxonomy.ifrs.org/xifrs-link?type=IFRS&num=8&code=ifrs-tx-2023-en-r&anchor=para_23&doctype=Standard
-URIDate 2023-03-23
| Name: |
ifrs-full_DisclosureOfOperatingSegmentsExplanatory |
| Namespace Prefix: |
ifrs-full_ |
| Data Type: |
dtr-types:textBlockItemType |
| Balance Type: |
na |
| Period Type: |
duration |
|
v3.23.3
Commitments and Contingencies (Tables)
|
6 Months Ended |
Jun. 30, 2023 |
|---|
| Commitments and Contingencies [Abstract] |
|
| Schedule of Future Payments for Employment Agreements |
The Company has several employment agreements
with executives and directors with the latest expiring in August 2025. All agreements provide for automatic renewal options with varying
terms of one year or three years unless terminated by either party. Future payments for employment agreements as of June 30, 2023, are
as follows:
| | |
Amount | |
| Twelve months ending June 30: | |
| |
| 2024 | |
$ | 875,472 | |
| 2025 | |
| 740,000 | |
| 2026 | |
| 118,333 | |
| Total minimum payment required | |
$ | 1,733,805 | |
|
| Schedule of Contracted Expenditures Commitments |
The Company’s contracted expenditures
commitments as of June 30, 2023 but not provided in the interim condensed consolidated financial statements are as follows:
| | |
| |
Payments Due by Period | |
| | |
| |
| | |
Less than | | |
1-3 | | |
4-5 | | |
More
than | |
| Contractual Obligations | |
Nature | |
Total | | |
1 year | | |
years | | |
years | | |
5 years | |
| Service fee commitments | |
(a) | |
$ | 56,644 | | |
$ | 56,644 | | |
$ | - | | |
$ | - | | |
$ | - | |
| Operating lease commitments | |
(b) | |
| 3,589,243 | | |
| 1,924,149 | | |
| 1,645,840 | | |
| 19,254 | | |
| - | |
| Purchase commitments | |
(c) | |
| 3,106,786 | | |
| 3,106,786 | | |
| - | | |
| - | | |
| - | |
| | |
| |
$ | 6,752,673 | | |
$ | 5,087,579 | | |
$ | 1,645,840 | | |
$ | 19,254 | | |
$ | - | |
| (a) | The Company has engaged Stander Information Company Limited (“Stander”) to provide technical services relating to the cash management systems for the Company’s secure logistics business. The service agreement with Stander comprised of a monthly fixed service fee and certain other fees as specified in the agreement, which expired in August 2023. In August, 2023, the Company renewed the service agreement with Stander for 2 years. | | (b) | From time to time, the Company entered into various short-term lease agreements to rent warehouses and offices. In addition, the Company has various low value items with various lease terms that the Company is committed to pay in the future. | | (c) | AI Hong Kong entered into various purchase agreements with Shenzhen Intelligent Guardforce Robot Technology Co., Limited and Shenzhen Kewei Robot Technology Co., Ltd. to establish mutual contractual obligations for future purchases of robots. These agreements do not contain the scheduled delivery dates. As of the date of filing, the Company does not intend to execute these agreements until the robot inventories on hand are being sold. |
|
| X |
- References
+ Details
| Name: |
gfai_CommitmentsAndContingenciesAbstract |
| Namespace Prefix: |
gfai_ |
| Data Type: |
xbrli:stringItemType |
| Balance Type: |
na |
| Period Type: |
duration |
|
| X |
- DefinitionSchedule of capital expenditure commitments.
| Name: |
gfai_ScheduleOfCapitalExpenditureCommitments |
| Namespace Prefix: |
gfai_ |
| Data Type: |
dtr:textBlockItemType |
| Balance Type: |
na |
| Period Type: |
duration |
|
| X |
- DefinitionSchedule of future payments for employment agreements.
| Name: |
gfai_ScheduleOfFuturePaymentsForEmploymentAgreements |
| Namespace Prefix: |
gfai_ |
| Data Type: |
dtr:textBlockItemType |
| Balance Type: |
na |
| Period Type: |
duration |
|
v3.23.3
Nature of Operations (Details)
|
1 Months Ended |
6 Months Ended |
12 Months Ended |
|
|
|
|
|
|
Jun. 16, 2022
shares
|
Sep. 21, 2018
USD ($)
$ / shares
shares
|
Jun. 30, 2023
USD ($)
$ / shares
shares
|
Dec. 31, 2022
USD ($)
|
Jun. 30, 2023
DKK (kr)
shares
|
Mar. 11, 2022 |
Nov. 18, 2021 |
Nov. 01, 2021 |
Mar. 25, 2021 |
| Nature of Operations (Details) [Line Items] |
|
|
|
|
|
|
|
|
|
| Ordinary plus preferred shares outstanding (in Shares) |
|
100,000
|
|
|
|
|
|
|
|
| Shares owned by southern ambition limited (in Shares) |
|
48,999
|
|
|
|
|
|
|
|
| Aggregate ordinary shares (in Shares) |
|
49,000
|
|
|
|
|
|
|
|
| Aggregate ordinary shares percentage |
|
49.00%
|
|
|
|
|
|
|
|
| Cumulative preferred shares (in Shares) |
|
51,000
|
|
|
|
|
|
|
|
| Approximately ordinary shares amount (in Dollars) | $ |
|
$ 16,000
|
|
|
|
|
|
|
|
| Dividends per share (in Dollars per share) | $ / shares |
|
$ 0.03
|
|
|
|
|
|
|
|
| Cumulative unpaid dividends of the preferred shares (in Dollars) | $ |
|
|
$ 1,700
|
$ 1,700
|
|
|
|
|
|
| Votes percentage |
|
|
99.07%
|
99.07%
|
99.07%
|
|
|
|
|
| Outstanding shares (in Shares) |
|
|
3,857,144
|
|
|
|
|
|
|
| Ordinary shares (in Shares) |
|
|
33,600
|
|
|
|
|
|
|
| Preferred shares outstanding shares (in Shares) |
|
|
21,599
|
|
|
|
|
|
|
| Preferred shares outstanding shares percentage |
|
|
99.07%
|
|
|
|
|
|
|
| Preferred shares (in Shares) |
|
|
2,400
|
|
|
|
|
|
|
| Preferred shares percentage |
|
|
0.933%
|
|
|
|
|
|
|
| Acquired majority percentage |
|
|
|
|
|
|
|
|
51.00%
|
| Consideration amount |
|
|
$ 0
|
|
kr 3,205
|
|
|
|
|
| Owned subsidiary percentage |
|
|
100.00%
|
|
100.00%
|
|
|
|
|
| Acquisition purchase price paid amount (in Dollars) | $ |
|
|
$ 10,000,000
|
|
|
|
|
|
|
| Mix of cash percentage |
|
|
10.00%
|
|
|
|
|
|
|
| Percentage of restricted ordinary shares |
|
|
90.00%
|
|
|
|
|
|
|
| Restricted ordinary shares (in Shares) |
|
|
262,500
|
|
|
|
|
|
|
| Purchase price of assets (in Dollars) | $ |
|
|
$ 2,100,000
|
|
|
|
|
|
|
| Restricted ordinary shares per share (in Dollars per share) | $ / shares |
|
|
$ 8
|
|
|
|
|
|
|
| Shenzhen Kewei [Member] |
|
|
|
|
|
|
|
|
|
| Nature of Operations (Details) [Line Items] |
|
|
|
|
|
|
|
|
|
| Restricted ordinary shares (in Shares) |
|
|
53,571
|
|
|
|
|
|
|
| Beijing Wanjia [Member] |
|
|
|
|
|
|
|
|
|
| Nature of Operations (Details) [Line Items] |
|
|
|
|
|
|
|
|
|
| Acquire equity interest |
|
|
100.00%
|
|
100.00%
|
|
|
|
|
| Acquisition purchase price paid amount (in Dollars) | $ |
|
|
$ 8,400,000
|
|
|
|
|
|
|
| Mix of cash percentage |
|
|
10.00%
|
|
|
|
|
|
|
| Restricted ordinary shares (in Shares) |
94,500
|
|
|
|
|
|
|
|
|
| Restricted ordinary shares percentage |
|
|
90.00%
|
|
|
|
|
|
|
| AI Thailand [Member] |
|
|
|
|
|
|
|
|
|
| Nature of Operations (Details) [Line Items] |
|
|
|
|
|
|
|
|
|
| Ordinary shares (in Shares) |
|
|
3,799,544
|
|
|
|
|
|
|
| Owned subsidiary percentage |
|
|
98.00%
|
|
98.00%
|
|
|
|
|
| AI Malaysia [Member] |
|
|
|
|
|
|
|
|
|
| Nature of Operations (Details) [Line Items] |
|
|
|
|
|
|
|
|
|
| Owned subsidiary percentage |
|
|
100.00%
|
|
100.00%
|
|
|
|
|
| AI Holding Limited [Member] |
|
|
|
|
|
|
|
|
|
| Nature of Operations (Details) [Line Items] |
|
|
|
|
|
|
|
|
|
| Proportion of ownership interest in subsidiary |
|
|
100.00%
|
|
|
|
|
|
|
| AI Robotics [Member] |
|
|
|
|
|
|
|
|
|
| Nature of Operations (Details) [Line Items] |
|
|
|
|
|
|
|
|
|
| Proportion of ownership interest in subsidiary |
|
|
100.00%
|
|
|
|
|
|
|
| Owned subsidiary percentage |
|
|
100.00%
|
|
100.00%
|
|
100.00%
|
|
|
| AI Hong Kong Limited [Member] |
|
|
|
|
|
|
|
|
|
| Nature of Operations (Details) [Line Items] |
|
|
|
|
|
|
|
|
|
| Proportion of ownership interest in subsidiary |
|
|
100.00%
|
|
|
|
|
|
|
| Southern Ambition [Member] |
|
|
|
|
|
|
|
|
|
| Nature of Operations (Details) [Line Items] |
|
|
|
|
|
|
|
|
|
| Proportion of ownership interest in subsidiary |
|
|
100.00%
|
|
|
|
|
|
|
| Votes percentage |
|
|
95.00%
|
95.00%
|
95.00%
|
|
|
|
|
| Owned subsidiary percentage |
|
|
1.00%
|
|
1.00%
|
|
|
|
|
| Horizon Dragon Limited [Member] |
|
|
|
|
|
|
|
|
|
| Nature of Operations (Details) [Line Items] |
|
|
|
|
|
|
|
|
|
| Proportion of ownership interest in subsidiary |
|
|
100.00%
|
|
|
|
|
|
|
| Aggregate ordinary shares (in Shares) |
|
49,000
|
|
|
|
|
|
|
|
| Owned subsidiary percentage |
|
|
1.00%
|
|
1.00%
|
|
|
|
|
| Singapore Agreement [Member] |
|
|
|
|
|
|
|
|
|
| Nature of Operations (Details) [Line Items] |
|
|
|
|
|
|
|
|
|
| Acquire equity interest |
|
|
|
|
|
|
|
100.00%
|
|
| Macau Agreement [Member] |
|
|
|
|
|
|
|
|
|
| Nature of Operations (Details) [Line Items] |
|
|
|
|
|
|
|
|
|
| Acquire equity interest |
|
|
|
|
|
|
100.00%
|
|
|
| Owned subsidiary percentage |
|
|
|
|
|
|
100.00%
|
|
|
| Malaysia Agreement [Member] |
|
|
|
|
|
|
|
|
|
| Nature of Operations (Details) [Line Items] |
|
|
|
|
|
|
|
|
|
| Acquire equity interest |
|
|
|
|
|
|
100.00%
|
|
|
| Consideration amount | $ |
|
|
$ 1
|
|
|
|
|
|
|
| AI Robot Service [Member] |
|
|
|
|
|
|
|
|
|
| Nature of Operations (Details) [Line Items] |
|
|
|
|
|
|
|
|
|
| Owned subsidiary percentage |
|
|
100.00%
|
|
100.00%
|
|
|
|
|
| AI Robot Service [Member] | AI Jian [Member] |
|
|
|
|
|
|
|
|
|
| Nature of Operations (Details) [Line Items] |
|
|
|
|
|
|
|
|
|
| Owned subsidiary percentage |
|
|
100.00%
|
|
100.00%
|
|
|
|
|
| AI Robot Service [Member] | AUSTRIA |
|
|
|
|
|
|
|
|
|
| Nature of Operations (Details) [Line Items] |
|
|
|
|
|
|
|
|
|
| Owned subsidiary percentage |
|
|
100.00%
|
|
100.00%
|
|
|
|
|
| AI Robot Service [Member] | Dubai [Member] |
|
|
|
|
|
|
|
|
|
| Nature of Operations (Details) [Line Items] |
|
|
|
|
|
|
|
|
|
| Owned subsidiary percentage |
|
|
100.00%
|
|
100.00%
|
|
|
|
|
| AI Robot Service [Member] | United kingdom [Member] |
|
|
|
|
|
|
|
|
|
| Nature of Operations (Details) [Line Items] |
|
|
|
|
|
|
|
|
|
| Owned subsidiary percentage |
|
|
100.00%
|
|
100.00%
|
|
|
|
|
| AI Robot Service [Member] | Canada [Member] |
|
|
|
|
|
|
|
|
|
| Nature of Operations (Details) [Line Items] |
|
|
|
|
|
|
|
|
|
| Owned subsidiary percentage |
|
|
100.00%
|
|
100.00%
|
|
|
|
|
| AI Robot Service [Member] | JAPAN |
|
|
|
|
|
|
|
|
|
| Nature of Operations (Details) [Line Items] |
|
|
|
|
|
|
|
|
|
| Owned subsidiary percentage |
|
|
100.00%
|
|
100.00%
|
|
|
|
|
| AI Robot Service [Member] | Korea (North), Won |
|
|
|
|
|
|
|
|
|
| Nature of Operations (Details) [Line Items] |
|
|
|
|
|
|
|
|
|
| Owned subsidiary percentage |
|
|
100.00%
|
|
100.00%
|
|
|
|
|
| AI Shenzhen [Member] |
|
|
|
|
|
|
|
|
|
| Nature of Operations (Details) [Line Items] |
|
|
|
|
|
|
|
|
|
| Owned subsidiary percentage |
|
|
100.00%
|
|
100.00%
|
|
|
|
|
| Kewei Agreement [Member] |
|
|
|
|
|
|
|
|
|
| Nature of Operations (Details) [Line Items] |
|
|
|
|
|
|
|
|
|
| Acquire equity interest |
|
|
|
|
|
100.00%
|
|
|
|
| Shenzhen Kewei [Member] |
|
|
|
|
|
|
|
|
|
| Nature of Operations (Details) [Line Items] |
|
|
|
|
|
|
|
|
|
| Number of shares issued (in Shares) |
|
|
262,500
|
|
262,500
|
|
|
|
|
| X |
- DefinitionThe percentage of acquire equity interest.
| Name: |
gfai_AcquireEquityInterest |
| Namespace Prefix: |
gfai_ |
| Data Type: |
dtr:percentItemType |
| Balance Type: |
na |
| Period Type: |
instant |
|
| X |
- DefinitionThe company acquired majority percentage.
| Name: |
gfai_AcquiredMajorityPercentage |
| Namespace Prefix: |
gfai_ |
| Data Type: |
dtr:percentItemType |
| Balance Type: |
na |
| Period Type: |
instant |
|
| X |
- DefinitionPercentage of acquisition owned subsidiary.
| Name: |
gfai_AcquisitionOwnedSubsidiaryPercentage |
| Namespace Prefix: |
gfai_ |
| Data Type: |
dtr:percentItemType |
| Balance Type: |
na |
| Period Type: |
instant |
|
| X |
- DefinitionThe amount of acquisition purchase price paid amount.
| Name: |
gfai_AcquisitionPurchasePricePaidAmount |
| Namespace Prefix: |
gfai_ |
| Data Type: |
xbrli:monetaryItemType |
| Balance Type: |
credit |
| Period Type: |
duration |
|
| X |
- References
+ Details
| Name: |
gfai_AcquisitionPurchasePricePaidAmountInMixOfCashPercentage |
| Namespace Prefix: |
gfai_ |
| Data Type: |
dtr:percentItemType |
| Balance Type: |
na |
| Period Type: |
duration |
|
| X |
- DefinitionNumber of aggregate ordinary shares.
| Name: |
gfai_AggregateOrdinaryShares |
| Namespace Prefix: |
gfai_ |
| Data Type: |
xbrli:sharesItemType |
| Balance Type: |
na |
| Period Type: |
duration |
|
| X |
- DefinitionThe percentage of aggregate ordinary shares.
| Name: |
gfai_AggregateOrdinarySharesPercentage |
| Namespace Prefix: |
gfai_ |
| Data Type: |
dtr:percentItemType |
| Balance Type: |
na |
| Period Type: |
duration |
|
| X |
- DefinitionThe amount of approximately ordinary shares.
| Name: |
gfai_ApproximatelyOrdinarySharesAmount |
| Namespace Prefix: |
gfai_ |
| Data Type: |
xbrli:monetaryItemType |
| Balance Type: |
credit |
| Period Type: |
duration |
|
| X |
- DefinitionThe amount of consideration amount.
| Name: |
gfai_ConsiderationAmount |
| Namespace Prefix: |
gfai_ |
| Data Type: |
xbrli:monetaryItemType |
| Balance Type: |
na |
| Period Type: |
instant |
|
| X |
- DefinitionNumber of cumulative preferred shares.
| Name: |
gfai_CumulativePreferredShares |
| Namespace Prefix: |
gfai_ |
| Data Type: |
xbrli:sharesItemType |
| Balance Type: |
na |
| Period Type: |
duration |
|
| X |
- References
+ Details
| Name: |
gfai_NatureofOperationsDetailsLineItems |
| Namespace Prefix: |
gfai_ |
| Data Type: |
xbrli:stringItemType |
| Balance Type: |
na |
| Period Type: |
duration |
|
| X |
- DefinitionNumber of ordinary plus preferred shares outstanding.
| Name: |
gfai_OrdinaryPlusPreferredSharesOutstanding |
| Namespace Prefix: |
gfai_ |
| Data Type: |
xbrli:sharesItemType |
| Balance Type: |
na |
| Period Type: |
instant |
|
| X |
- DefinitionOutstanding ordinary shares.
| Name: |
gfai_OutstandingOrdinaryShares |
| Namespace Prefix: |
gfai_ |
| Data Type: |
xbrli:sharesItemType |
| Balance Type: |
na |
| Period Type: |
duration |
|
| X |
- DefinitionThe number of outstanding shares.
| Name: |
gfai_OutstandingShares |
| Namespace Prefix: |
gfai_ |
| Data Type: |
xbrli:sharesItemType |
| Balance Type: |
na |
| Period Type: |
duration |
|
| X |
- DefinitionPercentage of restricted ordinary shares.
| Name: |
gfai_PercentageOfRestrictedOrdinaryShares |
| Namespace Prefix: |
gfai_ |
| Data Type: |
dtr:percentItemType |
| Balance Type: |
na |
| Period Type: |
duration |
|
| X |
- References
+ Details
| Name: |
gfai_PreferredShares |
| Namespace Prefix: |
gfai_ |
| Data Type: |
xbrli:sharesItemType |
| Balance Type: |
na |
| Period Type: |
duration |
|
| X |
- DefinitionNumber of preferred shares outstanding shares.
| Name: |
gfai_PreferredSharesOutstandingShares |
| Namespace Prefix: |
gfai_ |
| Data Type: |
xbrli:sharesItemType |
| Balance Type: |
na |
| Period Type: |
duration |
|
| X |
- DefinitionThe percentage of preferred shares outstanding shares.
| Name: |
gfai_PreferredSharesOutstandingSharesPercentage |
| Namespace Prefix: |
gfai_ |
| Data Type: |
dtr:percentItemType |
| Balance Type: |
na |
| Period Type: |
duration |
|
| X |
- References
+ Details
| Name: |
gfai_PreferredSharesPercentage |
| Namespace Prefix: |
gfai_ |
| Data Type: |
dtr:percentItemType |
| Balance Type: |
na |
| Period Type: |
duration |
|
| X |
- DefinitionThe amount of purchase price of assets.
| Name: |
gfai_PurchasePriceOfAssets |
| Namespace Prefix: |
gfai_ |
| Data Type: |
xbrli:monetaryItemType |
| Balance Type: |
credit |
| Period Type: |
duration |
|
| X |
- References
+ Details
| Name: |
gfai_RestrictedOrdinaryShare |
| Namespace Prefix: |
gfai_ |
| Data Type: |
xbrli:sharesItemType |
| Balance Type: |
na |
| Period Type: |
duration |
|
| X |
- References
+ Details
| Name: |
gfai_RestrictedOrdinarySharePerShare |
| Namespace Prefix: |
gfai_ |
| Data Type: |
dtr:perShareItemType |
| Balance Type: |
na |
| Period Type: |
duration |
|
| X |
- References
+ Details
| Name: |
gfai_RestrictedOrdinaryShares |
| Namespace Prefix: |
gfai_ |
| Data Type: |
dtr:percentItemType |
| Balance Type: |
na |
| Period Type: |
duration |
|
| X |
- DefinitionNumber of shares by southern ambition limited.
| Name: |
gfai_SharesOwnedBySouthernAmbitionLimited |
| Namespace Prefix: |
gfai_ |
| Data Type: |
xbrli:sharesItemType |
| Balance Type: |
na |
| Period Type: |
duration |
|
| X |
- DefinitionThe amount of dividends paid by the entity on shares other than ordinary shares. [Refer: Ordinary shares [member]] Reference 1: http://www.xbrl.org/2003/role/disclosureRef
-Name IAS
-Number 34
-IssueDate 2023-01-01
-Paragraph 16A
-Subparagraph f
-URI https://taxonomy.ifrs.org/xifrs-link?type=IAS&num=34&code=ifrs-tx-2023-en-r&anchor=para_16A_f&doctype=Standard
-URIDate 2023-03-23
| Name: |
ifrs-full_DividendsPaidOtherShares |
| Namespace Prefix: |
ifrs-full_ |
| Data Type: |
xbrli:monetaryItemType |
| Balance Type: |
debit |
| Period Type: |
duration |
|
| X |
- DefinitionThe amount, per share, of dividends recognised as distributions to owners. Reference 1: http://www.xbrl.org/2003/role/disclosureRef
-Name IAS
-Number 1
-IssueDate 2023-01-01
-Paragraph 107
-URI https://taxonomy.ifrs.org/xifrs-link?type=IAS&num=1&code=ifrs-tx-2023-en-r&anchor=para_107&doctype=Standard
-URIDate 2023-03-23
| Name: |
ifrs-full_DividendsRecognisedAsDistributionsToOwnersPerShare |
| Namespace Prefix: |
ifrs-full_ |
| Data Type: |
dtr-types:perShareItemType |
| Balance Type: |
na |
| Period Type: |
duration |
|
| X |
- DefinitionThe number of shares issued by the entity. Reference 1: http://www.xbrl.org/2009/role/commonPracticeRef
-Name IAS
-Number 1
-IssueDate 2023-01-01
-Paragraph 106
-Subparagraph d
-URI https://taxonomy.ifrs.org/xifrs-link?type=IAS&num=1&code=ifrs-tx-2023-en-r&anchor=para_106_d&doctype=Standard
-URIDate 2023-03-23
| Name: |
ifrs-full_NumberOfSharesIssued |
| Namespace Prefix: |
ifrs-full_ |
| Data Type: |
xbrli:sharesItemType |
| Balance Type: |
na |
| Period Type: |
instant |
|
| X |
- DefinitionThe percentage of voting equity interests acquired in a business combination. [Refer: Business combinations [member]] Reference 1: http://www.xbrl.org/2003/role/disclosureRef
-Name IFRS
-Number 3
-IssueDate 2023-01-01
-Paragraph B64
-Subparagraph c
-URI https://taxonomy.ifrs.org/xifrs-link?type=IFRS&num=3&code=ifrs-tx-2023-en-r&anchor=para_B64_c&doctype=Appendix&subtype=B
-URIDate 2023-03-23
| Name: |
ifrs-full_PercentageOfVotingEquityInterestsAcquired |
| Namespace Prefix: |
ifrs-full_ |
| Data Type: |
dtr-types:percentItemType |
| Balance Type: |
na |
| Period Type: |
instant |
|
| X |
- DefinitionThe proportion of ownership interest in a subsidiary attributable to the entity. [Refer: Subsidiaries [member]] Reference 1: http://www.xbrl.org/2003/role/disclosureRef
-Name IAS
-Number 27
-IssueDate 2023-01-01
-Paragraph 17
-Subparagraph b
-Clause iii
-URI https://taxonomy.ifrs.org/xifrs-link?type=IAS&num=27&code=ifrs-tx-2023-en-r&anchor=para_17_b_iii&doctype=Standard
-URIDate 2023-03-23
Reference 2: http://www.xbrl.org/2003/role/disclosureRef
-Name IAS
-Number 27
-IssueDate 2023-01-01
-Paragraph 16
-Subparagraph b
-Clause iii
-URI https://taxonomy.ifrs.org/xifrs-link?type=IAS&num=27&code=ifrs-tx-2023-en-r&anchor=para_16_b_iii&doctype=Standard
-URIDate 2023-03-23
Reference 3: http://www.xbrl.org/2003/role/disclosureRef
-Name IFRS
-Number 12
-IssueDate 2023-01-01
-Paragraph 19B
-Subparagraph c
-URI https://taxonomy.ifrs.org/xifrs-link?type=IFRS&num=12&code=ifrs-tx-2023-en-r&anchor=para_19B_c&doctype=Standard
-URIDate 2023-03-23
| Name: |
ifrs-full_ProportionOfOwnershipInterestInSubsidiary |
| Namespace Prefix: |
ifrs-full_ |
| Data Type: |
dtr-types:percentItemType |
| Balance Type: |
na |
| Period Type: |
duration |
|
| X |
- Details
| Name: |
ifrs-full_GeographicalAreasAxis=gfai_AIThailandMember |
| Namespace Prefix: |
|
| Data Type: |
na |
| Balance Type: |
|
| Period Type: |
|
|
| X |
- Details
| Name: |
ifrs-full_GeographicalAreasAxis=gfai_AIMalaysiaMember |
| Namespace Prefix: |
|
| Data Type: |
na |
| Balance Type: |
|
| Period Type: |
|
|
| X |
- Details
| Name: |
ifrs-full_SignificantInvestmentsInSubsidiariesAxis=gfai_AIHoldingLimitedMember |
| Namespace Prefix: |
|
| Data Type: |
na |
| Balance Type: |
|
| Period Type: |
|
|
| X |
- Details
| Name: |
ifrs-full_SignificantInvestmentsInSubsidiariesAxis=gfai_AIRoboticsMember |
| Namespace Prefix: |
|
| Data Type: |
na |
| Balance Type: |
|
| Period Type: |
|
|
| X |
- Details
| Name: |
ifrs-full_SignificantInvestmentsInSubsidiariesAxis=gfai_AIHongKongLimitedMember |
| Namespace Prefix: |
|
| Data Type: |
na |
| Balance Type: |
|
| Period Type: |
|
|
| X |
- Details
| Name: |
ifrs-full_SignificantInvestmentsInSubsidiariesAxis=gfai_SouthernAmbitionLimitedMember |
| Namespace Prefix: |
|
| Data Type: |
na |
| Balance Type: |
|
| Period Type: |
|
|
| X |
- Details
| Name: |
ifrs-full_SignificantInvestmentsInSubsidiariesAxis=gfai_HorizonDragonLimitedMember |
| Namespace Prefix: |
|
| Data Type: |
na |
| Balance Type: |
|
| Period Type: |
|
|
| X |
- Details
| Name: |
ifrs-full_SignificantInvestmentsInSubsidiariesAxis=gfai_SingaporeAgreementMember |
| Namespace Prefix: |
|
| Data Type: |
na |
| Balance Type: |
|
| Period Type: |
|
|
| X |
- Details
| Name: |
ifrs-full_SignificantInvestmentsInSubsidiariesAxis=gfai_MacauAgreementMember |
| Namespace Prefix: |
|
| Data Type: |
na |
| Balance Type: |
|
| Period Type: |
|
|
| X |
- Details
| Name: |
ifrs-full_SignificantInvestmentsInSubsidiariesAxis=gfai_MalaysiaAgreementMember |
| Namespace Prefix: |
|
| Data Type: |
na |
| Balance Type: |
|
| Period Type: |
|
|
| X |
- Details
| Name: |
ifrs-full_SignificantInvestmentsInSubsidiariesAxis=gfai_AIRobotServiceMember |
| Namespace Prefix: |
|
| Data Type: |
na |
| Balance Type: |
|
| Period Type: |
|
|
| X |
- Details
| Name: |
ifrs-full_GeographicalAreasAxis=country_AT |
| Namespace Prefix: |
|
| Data Type: |
na |
| Balance Type: |
|
| Period Type: |
|
|
| X |
- Details
| Name: |
ifrs-full_GeographicalAreasAxis=gfai_DubaiMember |
| Namespace Prefix: |
|
| Data Type: |
na |
| Balance Type: |
|
| Period Type: |
|
|
| X |
- Details
| Name: |
ifrs-full_GeographicalAreasAxis=gfai_UKMember |
| Namespace Prefix: |
|
| Data Type: |
na |
| Balance Type: |
|
| Period Type: |
|
|
| X |
- Details
| Name: |
ifrs-full_GeographicalAreasAxis=country_CA |
| Namespace Prefix: |
|
| Data Type: |
na |
| Balance Type: |
|
| Period Type: |
|
|
| X |
- Details
| Name: |
ifrs-full_GeographicalAreasAxis=country_JP |
| Namespace Prefix: |
|
| Data Type: |
na |
| Balance Type: |
|
| Period Type: |
|
|
| X |
- Details
| Name: |
ifrs-full_GeographicalAreasAxis=currency_KPW |
| Namespace Prefix: |
|
| Data Type: |
na |
| Balance Type: |
|
| Period Type: |
|
|
| X |
- Details
| Name: |
ifrs-full_SignificantInvestmentsInSubsidiariesAxis=gfai_AIShenzhenMember |
| Namespace Prefix: |
|
| Data Type: |
na |
| Balance Type: |
|
| Period Type: |
|
|
| X |
- Details
| Name: |
ifrs-full_SignificantInvestmentsInSubsidiariesAxis=gfai_KeweiAgreementMember |
| Namespace Prefix: |
|
| Data Type: |
na |
| Balance Type: |
|
| Period Type: |
|
|
| X |
- Details
| Name: |
ifrs-full_NonadjustingEventsAfterReportingPeriodAxis=gfai_ShenzhenKeweiMember |
| Namespace Prefix: |
|
| Data Type: |
na |
| Balance Type: |
|
| Period Type: |
|
|
v3.23.3
Significant Accounting Policies (Details) - USD ($)
|
|
1 Months Ended |
6 Months Ended |
12 Months Ended |
Sep. 28, 2023 |
Jan. 31, 2023 |
Jun. 30, 2023 |
Jun. 30, 2022 |
Dec. 31, 2022 |
| Significant Accounting Policies (Details) [Line Items] |
|
|
|
|
|
| Current loan outstanding |
|
|
$ 2.5
|
|
|
| Non current portion of loan outstanding |
|
|
13.6
|
|
|
| Loan aggregate amount |
$ 15,914,615
|
|
|
|
|
| Conversion price per share (in Dollars per share) |
$ 5.4
|
|
|
|
|
| Convertible note payable |
|
|
606,786
|
|
|
| Underwriting discounts |
|
|
$ 21,000,000
|
|
|
| Ordinary shares consolidation authorized and issued, description |
|
|
On January 31, 2023, the Company completed
a 1 for 40 share consolidation of its authorized and issued ordinary shares whereby every forty shares were consolidated into one share.
|
|
|
| Ordinary shares authorized (in Shares) |
|
|
300,000,000
|
|
7,500,000
|
| Inventories |
|
|
$ 3,090,283
|
|
|
| Impairment loss |
|
|
1,263,040
|
|
|
| Impairment loss on robot assets |
|
|
$ 1,591,766
|
|
|
| Revenues amount |
|
|
|
16,808,399
|
|
| Revenue from related party |
|
|
|
$ 134,123
|
|
| Maximum [Member] |
|
|
|
|
|
| Significant Accounting Policies (Details) [Line Items] |
|
|
|
|
|
| Ordinary shares, par value (in Dollars per share) |
|
$ 0.003
|
|
|
|
| Ordinary shares authorized (in Shares) |
|
7,500,000
|
|
|
|
| Revenue recognize |
|
|
|
|
|
| Minimum [Member] |
|
|
|
|
|
| Significant Accounting Policies (Details) [Line Items] |
|
|
|
|
|
| Ordinary shares, par value (in Dollars per share) |
|
$ 0.12
|
|
|
|
| Ordinary shares authorized (in Shares) |
|
300,000,000
|
|
|
|
| Revenue recognize |
|
|
|
|
$ 428,839
|
| X |
- DefinitionConversion price per share
| Name: |
gfai_ConversionPricePerShares |
| Namespace Prefix: |
gfai_ |
| Data Type: |
dtr:perShareItemType |
| Balance Type: |
na |
| Period Type: |
duration |
|
| X |
- Definition
+ References
+ Details
| Name: |
gfai_CurrentLoanOutstanding |
| Namespace Prefix: |
gfai_ |
| Data Type: |
xbrli:monetaryItemType |
| Balance Type: |
debit |
| Period Type: |
duration |
|
| X |
- DefinitionNon current portion of loan outstanding.
| Name: |
gfai_NonCurrentPortionOfLoanOutstanding |
| Namespace Prefix: |
gfai_ |
| Data Type: |
xbrli:monetaryItemType |
| Balance Type: |
debit |
| Period Type: |
duration |
|
| X |
- DefinitionThe amount of revenue recognize.
| Name: |
gfai_RevenueRecognize |
| Namespace Prefix: |
gfai_ |
| Data Type: |
xbrli:monetaryItemType |
| Balance Type: |
credit |
| Period Type: |
duration |
|
| X |
- References
+ Details
| Name: |
gfai_SignificantAccountingPoliciesDetailsLineItems |
| Namespace Prefix: |
gfai_ |
| Data Type: |
xbrli:stringItemType |
| Balance Type: |
na |
| Period Type: |
duration |
|
| X |
- DefinitionThe present value, without deducting any plan assets, of expected future payments required to settle the obligation resulting from employee service in the current and prior periods. [Refer: Plan assets, at fair value] Reference 1: http://www.xbrl.org/2009/role/commonPracticeRef
-Name IAS
-Number 19
-IssueDate 2023-01-01
-Paragraph 57
-Subparagraph a
-URI https://taxonomy.ifrs.org/xifrs-link?type=IAS&num=19&code=ifrs-tx-2023-en-r&anchor=para_57_a&doctype=Standard
-URIDate 2023-03-23
| Name: |
ifrs-full_DefinedBenefitObligationAtPresentValue |
| Namespace Prefix: |
ifrs-full_ |
| Data Type: |
xbrli:monetaryItemType |
| Balance Type: |
credit |
| Period Type: |
instant |
|
| X |
- DefinitionThe description of terms of shares reserved for issue under options and contracts for the sale of shares. Reference 1: http://www.xbrl.org/2003/role/disclosureRef
-Name IAS
-Number 1
-IssueDate 2023-01-01
-Paragraph 79
-Subparagraph a
-Clause vii
-URI https://taxonomy.ifrs.org/xifrs-link?type=IAS&num=1&code=ifrs-tx-2023-en-r&anchor=para_79_a_vii&doctype=Standard
-URIDate 2023-03-23
| Name: |
ifrs-full_DescriptionOfTermsOfSharesReservedForIssueUnderOptionsAndContractsForSaleOfShares |
| Namespace Prefix: |
ifrs-full_ |
| Data Type: |
xbrli:stringItemType |
| Balance Type: |
na |
| Period Type: |
duration |
|
| X |
- DefinitionThe amount of dividends paid per other share. Reference 1: http://www.xbrl.org/2003/role/disclosureRef
-Name IAS
-Number 34
-IssueDate 2023-01-01
-Paragraph 16A
-Subparagraph f
-URI https://taxonomy.ifrs.org/xifrs-link?type=IAS&num=34&code=ifrs-tx-2023-en-r&anchor=para_16A_f&doctype=Standard
-URIDate 2023-03-23
| Name: |
ifrs-full_DividendsPaidOtherSharesPerShare |
| Namespace Prefix: |
ifrs-full_ |
| Data Type: |
dtr-types:perShareItemType |
| Balance Type: |
na |
| Period Type: |
duration |
|
| X |
- DefinitionThe amount recognised as a reduction of the carrying amount of an asset or cash-generating unit to its recoverable amount. [Refer: Carrying amount [member]] Reference 1: http://www.xbrl.org/2003/role/disclosureRef
-Name IAS
-Number 36
-IssueDate 2023-01-01
-Paragraph 130
-Subparagraph d
-Clause ii
-URI https://taxonomy.ifrs.org/xifrs-link?type=IAS&num=36&code=ifrs-tx-2023-en-r&anchor=para_130_d_ii&doctype=Standard
-URIDate 2023-03-23
Reference 2: http://www.xbrl.org/2003/role/disclosureRef
-Name IAS
-Number 36
-IssueDate 2023-01-01
-Paragraph 130
-Subparagraph b
-URI https://taxonomy.ifrs.org/xifrs-link?type=IAS&num=36&code=ifrs-tx-2023-en-r&anchor=para_130_b&doctype=Standard
-URIDate 2023-03-23
| Name: |
ifrs-full_ImpairmentLoss |
| Namespace Prefix: |
ifrs-full_ |
| Data Type: |
xbrli:monetaryItemType |
| Balance Type: |
debit |
| Period Type: |
duration |
|
| X |
- DefinitionThe amount of impairment loss on financial assets. [Refer: Financial assets; Impairment loss] Reference 1: http://www.xbrl.org/2003/role/disclosureRef
-Note Expired 2023-01-01
-Name IFRS
-Number 7
-IssueDate 2023-01-01
-Paragraph 20
-Subparagraph e
-URI https://taxonomy.ifrs.org/xifrs-link?type=IFRS&num=7&code=ifrs-tx-2017-en-b&anchor=para_20_e&doctype=Standard&book=b
-URIDate 2023-03-23
| Name: |
ifrs-full_ImpairmentLossOnFinancialAssets |
| Namespace Prefix: |
ifrs-full_ |
| Data Type: |
xbrli:monetaryItemType |
| Balance Type: |
debit |
| Period Type: |
duration |
|
| X |
- DefinitionThe amount of assets: (a) held for sale in the ordinary course of business; (b) in the process of production for such sale; or (c) in the form of materials or supplies to be consumed in the production process or in the rendering of services. Inventories encompass goods purchased and held for resale including, for example, merchandise purchased by a retailer and held for resale, or land and other property held for resale. Inventories also encompass finished goods produced, or work in progress being produced, by the entity and include materials and supplies awaiting use in the production process. [Refer: Current finished goods; Current merchandise; Current work in progress; Land] Reference 1: http://www.xbrl.org/2003/role/disclosureRef
-Name IAS
-Number 1
-IssueDate 2023-01-01
-Paragraph 54
-Subparagraph g
-URI https://taxonomy.ifrs.org/xifrs-link?type=IAS&num=1&code=ifrs-tx-2023-en-r&anchor=para_54_g&doctype=Standard
-URIDate 2023-03-23
| Name: |
ifrs-full_InventoriesTotal |
| Namespace Prefix: |
ifrs-full_ |
| Data Type: |
xbrli:monetaryItemType |
| Balance Type: |
debit |
| Period Type: |
instant |
|
| X |
- DefinitionThe number of shares authorised. Reference 1: http://www.xbrl.org/2003/role/disclosureRef
-Name IAS
-Number 1
-IssueDate 2023-01-01
-Paragraph 79
-Subparagraph a
-Clause i
-URI https://taxonomy.ifrs.org/xifrs-link?type=IAS&num=1&code=ifrs-tx-2023-en-r&anchor=para_79_a_i&doctype=Standard
-URIDate 2023-03-23
| Name: |
ifrs-full_NumberOfSharesAuthorised |
| Namespace Prefix: |
ifrs-full_ |
| Data Type: |
xbrli:sharesItemType |
| Balance Type: |
na |
| Period Type: |
instant |
|
| X |
- DefinitionThe amount of borrowings that the entity does not separately disclose in the same statement or note. [Refer: Borrowings] Reference 1: http://www.xbrl.org/2009/role/commonPracticeRef
-Name IAS
-Number 1
-IssueDate 2023-01-01
-Paragraph 112
-Subparagraph c
-URI https://taxonomy.ifrs.org/xifrs-link?type=IAS&num=1&code=ifrs-tx-2023-en-r&anchor=para_112_c&doctype=Standard
-URIDate 2023-03-23
| Name: |
ifrs-full_OtherBorrowings |
| Namespace Prefix: |
ifrs-full_ |
| Data Type: |
xbrli:monetaryItemType |
| Balance Type: |
credit |
| Period Type: |
instant |
|
| X |
- DefinitionAmounts payable that the entity does not separately disclose in the same statement or note. Reference 1: http://www.xbrl.org/2009/role/commonPracticeRef
-Name IAS
-Number 1
-IssueDate 2023-01-01
-Paragraph 55
-URI https://taxonomy.ifrs.org/xifrs-link?type=IAS&num=1&code=ifrs-tx-2023-en-r&anchor=para_55&doctype=Standard
-URIDate 2023-03-23
| Name: |
ifrs-full_OtherPayables |
| Namespace Prefix: |
ifrs-full_ |
| Data Type: |
xbrli:monetaryItemType |
| Balance Type: |
credit |
| Period Type: |
instant |
|
| X |
- DefinitionThe amount of revenue arising from sources that the entity does not separately disclose in the same statement or note. [Refer: Revenue] Reference 1: http://www.xbrl.org/2009/role/commonPracticeRef
-Name IAS
-Number 1
-IssueDate 2023-01-01
-Paragraph 112
-Subparagraph c
-URI https://taxonomy.ifrs.org/xifrs-link?type=IAS&num=1&code=ifrs-tx-2023-en-r&anchor=para_112_c&doctype=Standard
-URIDate 2023-03-23
| Name: |
ifrs-full_OtherRevenue |
| Namespace Prefix: |
ifrs-full_ |
| Data Type: |
xbrli:monetaryItemType |
| Balance Type: |
credit |
| Period Type: |
duration |
|
| X |
- Details
| Name: |
ifrs-full_RangeAxis=ifrs-full_TopOfRangeMember |
| Namespace Prefix: |
|
| Data Type: |
na |
| Balance Type: |
|
| Period Type: |
|
|
| X |
- Details
| Name: |
ifrs-full_RangeAxis=ifrs-full_BottomOfRangeMember |
| Namespace Prefix: |
|
| Data Type: |
na |
| Balance Type: |
|
| Period Type: |
|
|
v3.23.3
| X |
- References
+ Details
| Name: |
gfai_SignificantAccountingPoliciesDetailsScheduleofCurrencyExchangeRatesImpactLineItems |
| Namespace Prefix: |
gfai_ |
| Data Type: |
xbrli:stringItemType |
| Balance Type: |
na |
| Period Type: |
duration |
|
| X |
- DefinitionThe average exchange rate used by the entity. Exchange rate is the ratio of exchange for two currencies. Reference 1: http://www.xbrl.org/2009/role/commonPracticeRef
-Name IAS
-Number 1
-IssueDate 2023-01-01
-Paragraph 112
-Subparagraph c
-URI https://taxonomy.ifrs.org/xifrs-link?type=IAS&num=1&code=ifrs-tx-2023-en-r&anchor=para_112_c&doctype=Standard
-URIDate 2023-03-23
| Name: |
ifrs-full_AverageForeignExchangeRate |
| Namespace Prefix: |
ifrs-full_ |
| Data Type: |
xbrli:decimalItemType |
| Balance Type: |
na |
| Period Type: |
duration |
|
| X |
- DefinitionThe spot exchange rate at the end of the reporting period. Exchange rate is the ratio of exchange for two currencies. Spot exchange rate is the exchange rate for immediate delivery. Reference 1: http://www.xbrl.org/2009/role/commonPracticeRef
-Name IAS
-Number 1
-IssueDate 2023-01-01
-Paragraph 112
-Subparagraph c
-URI https://taxonomy.ifrs.org/xifrs-link?type=IAS&num=1&code=ifrs-tx-2023-en-r&anchor=para_112_c&doctype=Standard
-URIDate 2023-03-23
| Name: |
ifrs-full_ClosingForeignExchangeRate |
| Namespace Prefix: |
ifrs-full_ |
| Data Type: |
xbrli:decimalItemType |
| Balance Type: |
na |
| Period Type: |
instant |
|
| X |
- Details
| Name: |
gfai_TypeOfCurrenciesAxis=gfai_ThaiBahtMember |
| Namespace Prefix: |
|
| Data Type: |
na |
| Balance Type: |
|
| Period Type: |
|
|
| X |
- Details
| Name: |
gfai_TypeOfCurrenciesAxis=gfai_HongKongDollarMember |
| Namespace Prefix: |
|
| Data Type: |
na |
| Balance Type: |
|
| Period Type: |
|
|
| X |
- Details
| Name: |
gfai_TypeOfCurrenciesAxis=gfai_ChineseRenminbiMember |
| Namespace Prefix: |
|
| Data Type: |
na |
| Balance Type: |
|
| Period Type: |
|
|
v3.23.3
Significant Accounting Policies (Details) - Schedule of Disaggregation Information of Revenue by Service Type - USD ($)
|
6 Months Ended |
Jun. 30, 2023 |
Jun. 30, 2022 |
| Disclosure of Significant Accounting Policies [Abstract] |
|
|
|
| Total |
|
$ 18,413,292
|
$ 16,942,522
|
| Percentage of Total Revenue |
|
100.00%
|
100.00%
|
| Cash-In-Transit – Non-Dedicated Vehicles (CIT Non-DV) [Member] |
|
|
|
| Disclosure of Significant Accounting Policies [Abstract] |
|
|
|
| Total |
|
$ 5,988,087
|
$ 5,377,474
|
| Percentage of Total Revenue |
|
32.50%
|
31.80%
|
| Cash-In-Transit - Dedicated Vehicle to Banks (CIT DV) [Member] |
|
|
|
| Disclosure of Significant Accounting Policies [Abstract] |
|
|
|
| Total |
|
$ 1,961,464
|
$ 2,135,199
|
| Percentage of Total Revenue |
|
10.70%
|
12.60%
|
| ATM Management [Member] |
|
|
|
| Disclosure of Significant Accounting Policies [Abstract] |
|
|
|
| Total |
|
$ 3,895,708
|
$ 4,731,015
|
| Percentage of Total Revenue |
|
21.20%
|
27.90%
|
| Cash Processing (CPC) [Member] |
|
|
|
| Disclosure of Significant Accounting Policies [Abstract] |
|
|
|
| Total |
|
$ 1,613,933
|
$ 1,410,902
|
| Percentage of Total Revenue |
|
8.80%
|
8.30%
|
| Cash Center Operations (CCT) [Member] |
|
|
|
| Disclosure of Significant Accounting Policies [Abstract] |
|
|
|
| Total |
|
$ 958,760
|
$ 1,202,214
|
| Percentage of Total Revenue |
|
5.20%
|
7.10%
|
| Consolidate Cash Center (CCC) [Member] |
|
|
|
| Disclosure of Significant Accounting Policies [Abstract] |
|
|
|
| Total |
|
$ 395,105
|
$ 225,513
|
| Percentage of Total Revenue |
|
2.10%
|
1.30%
|
| Cheque Center Service (CDC) [Member] |
|
|
|
| Disclosure of Significant Accounting Policies [Abstract] |
|
|
|
| Total |
|
|
$ 4,729
|
| Percentage of Total Revenue |
|
|
0.05%
|
| Others [Member] |
|
|
|
| Disclosure of Significant Accounting Policies [Abstract] |
|
|
|
| Total |
[1] |
$ 4,332
|
$ 4,399
|
| Percentage of Total Revenue |
[1] |
0.02%
|
0.05%
|
| Cash Deposit Management Solutions (GDM) [Member] |
|
|
|
| Disclosure of Significant Accounting Policies [Abstract] |
|
|
|
| Total |
|
$ 1,125,767
|
$ 869,102
|
| Percentage of Total Revenue |
|
6.10%
|
5.10%
|
| Robotic AI solutions [Member] |
|
|
|
| Disclosure of Significant Accounting Policies [Abstract] |
|
|
|
| Total |
|
$ 440,229
|
$ 719,041
|
| Percentage of Total Revenue |
|
2.40%
|
4.20%
|
| Information security [Member] |
|
|
|
| Disclosure of Significant Accounting Policies [Abstract] |
|
|
|
| Total |
|
$ 407,689
|
$ 262,934
|
| Percentage of Total Revenue |
|
2.20%
|
1.60%
|
| General security solutions [Member] |
|
|
|
| Disclosure of Significant Accounting Policies [Abstract] |
|
|
|
| Total |
|
$ 1,622,218
|
|
| Percentage of Total Revenue |
|
8.80%
|
|
|
|
| X |
- References
+ Details
| Name: |
gfai_PercentageOfTotalRevenue |
| Namespace Prefix: |
gfai_ |
| Data Type: |
dtr:percentItemType |
| Balance Type: |
na |
| Period Type: |
duration |
|
| X |
- References
+ Details
| Name: |
gfai_TotalRevenue |
| Namespace Prefix: |
gfai_ |
| Data Type: |
xbrli:monetaryItemType |
| Balance Type: |
credit |
| Period Type: |
duration |
|
| X |
- Details
| Name: |
gfai_TypeOfServiceAxis=gfai_CashInTransitNonDedicatedVehiclesCITNonDVMember |
| Namespace Prefix: |
|
| Data Type: |
na |
| Balance Type: |
|
| Period Type: |
|
|
| X |
- Details
| Name: |
gfai_TypeOfServiceAxis=gfai_CashInTransitDedicatedVehicleToBanksCITDVMember |
| Namespace Prefix: |
|
| Data Type: |
na |
| Balance Type: |
|
| Period Type: |
|
|
| X |
- Details
| Name: |
gfai_TypeOfServiceAxis=gfai_ATMManagementMember |
| Namespace Prefix: |
|
| Data Type: |
na |
| Balance Type: |
|
| Period Type: |
|
|
| X |
- Details
| Name: |
gfai_TypeOfServiceAxis=gfai_CashProcessingCPCMember |
| Namespace Prefix: |
|
| Data Type: |
na |
| Balance Type: |
|
| Period Type: |
|
|
| X |
- Details
| Name: |
gfai_TypeOfServiceAxis=gfai_CashCenterOperationsCCTMember |
| Namespace Prefix: |
|
| Data Type: |
na |
| Balance Type: |
|
| Period Type: |
|
|
| X |
- Details
| Name: |
gfai_TypeOfServiceAxis=gfai_ConsolidateCashCenterCCCMember |
| Namespace Prefix: |
|
| Data Type: |
na |
| Balance Type: |
|
| Period Type: |
|
|
| X |
- Details
| Name: |
gfai_TypeOfServiceAxis=gfai_ChequeCenterServiceCDCMember |
| Namespace Prefix: |
|
| Data Type: |
na |
| Balance Type: |
|
| Period Type: |
|
|
| X |
- Details
| Name: |
gfai_TypeOfServiceAxis=gfai_OthersMember |
| Namespace Prefix: |
|
| Data Type: |
na |
| Balance Type: |
|
| Period Type: |
|
|
| X |
- Details
| Name: |
gfai_TypeOfServiceAxis=gfai_CashDepositManagementSolutionsGDMMember |
| Namespace Prefix: |
|
| Data Type: |
na |
| Balance Type: |
|
| Period Type: |
|
|
| X |
- Details
| Name: |
gfai_TypeOfServiceAxis=gfai_RoboticAISolutionsMember |
| Namespace Prefix: |
|
| Data Type: |
na |
| Balance Type: |
|
| Period Type: |
|
|
| X |
- Details
| Name: |
gfai_TypeOfServiceAxis=gfai_GeneralSecuritySolutionsMember |
| Namespace Prefix: |
|
| Data Type: |
na |
| Balance Type: |
|
| Period Type: |
|
|
v3.23.3
| X |
- References
+ Details
| Name: |
gfai_BusinessCombinationsDetailsLineItems |
| Namespace Prefix: |
gfai_ |
| Data Type: |
xbrli:stringItemType |
| Balance Type: |
na |
| Period Type: |
duration |
|
| X |
- DefinitionThe amount recognised as a reduction of the carrying amount of an asset or cash-generating unit to its recoverable amount. [Refer: Carrying amount [member]] Reference 1: http://www.xbrl.org/2003/role/disclosureRef
-Name IAS
-Number 36
-IssueDate 2023-01-01
-Paragraph 130
-Subparagraph d
-Clause ii
-URI https://taxonomy.ifrs.org/xifrs-link?type=IAS&num=36&code=ifrs-tx-2023-en-r&anchor=para_130_d_ii&doctype=Standard
-URIDate 2023-03-23
Reference 2: http://www.xbrl.org/2003/role/disclosureRef
-Name IAS
-Number 36
-IssueDate 2023-01-01
-Paragraph 130
-Subparagraph b
-URI https://taxonomy.ifrs.org/xifrs-link?type=IAS&num=36&code=ifrs-tx-2023-en-r&anchor=para_130_b&doctype=Standard
-URIDate 2023-03-23
| Name: |
ifrs-full_ImpairmentLoss |
| Namespace Prefix: |
ifrs-full_ |
| Data Type: |
xbrli:monetaryItemType |
| Balance Type: |
debit |
| Period Type: |
duration |
|
v3.23.3
Business Combinations (Details) - Schedule of Purchase Price Allocation - Business Combimations [Member] - USD ($)
|
1 Months Ended |
Jun. 22, 2022 |
Mar. 22, 2022 |
Feb. 09, 2022 |
Jan. 20, 2022 |
Mar. 25, 2021 |
| Business Combinations (Details) - Schedule of Purchase Price Allocation [Line Items] |
|
|
|
|
|
| Cash and cash equivalents |
$ 38,342
|
$ 2,187
|
$ 21,038
|
$ 12,500
|
$ 24,276
|
| Other current assets |
2,219,318
|
2,393,558
|
4,162
|
|
32,250
|
| Property, plant and equipment |
20,488
|
2,055,610
|
|
|
|
| Intangible assets |
1,593,398
|
1,592,783
|
|
|
|
| Other non-current assets |
203,765
|
23,566
|
|
|
|
| Current liabilities |
(1,681,573)
|
(4,320,434)
|
(92,350)
|
(13,184)
|
(58,297)
|
| Goodwill |
411,862
|
1,867,009
|
70,355
|
685
|
329,534
|
| Total purchase price |
$ 2,805,600
|
$ 3,614,279
|
$ 3,205
|
$ 1
|
$ 327,763
|
| X |
- References
+ Details
| Name: |
gfai_BusinessCombinationsDetailsScheduleofPurchasePriceAllocationLineItems |
| Namespace Prefix: |
gfai_ |
| Data Type: |
xbrli:stringItemType |
| Balance Type: |
na |
| Period Type: |
duration |
|
| X |
- DefinitionThe amount recognised as of the acquisition date for cash and cash equivalents acquired in a business combination. [Refer: Cash and cash equivalents; Business combinations [member]] Reference 1: http://www.xbrl.org/2009/role/commonPracticeRef
-Name IFRS
-Number 3
-IssueDate 2023-01-01
-Paragraph B64
-Subparagraph i
-URI https://taxonomy.ifrs.org/xifrs-link?type=IFRS&num=3&code=ifrs-tx-2023-en-r&anchor=para_B64_i&doctype=Appendix&subtype=B
-URIDate 2023-03-23
| Name: |
ifrs-full_CashAndCashEquivalentsRecognisedAsOfAcquisitionDate |
| Namespace Prefix: |
ifrs-full_ |
| Data Type: |
xbrli:monetaryItemType |
| Balance Type: |
debit |
| Period Type: |
instant |
|
| X |
- DefinitionThe amount of liabilities that: (a) the entity expects to settle in its normal operating cycle; (b) the entity holds primarily for the purpose of trading; (c) are due to be settled within twelve months after the reporting period; or (d) the entity does not have the right at the end of the reporting period to defer settlement for at least twelve months after the reporting period. Reference 1: http://www.xbrl.org/2003/role/exampleRef
-Name IFRS
-Number 12
-IssueDate 2023-01-01
-Paragraph B10
-Subparagraph b
-URI https://taxonomy.ifrs.org/xifrs-link?type=IFRS&num=12&code=ifrs-tx-2023-en-r&anchor=para_B10_b&doctype=Appendix&subtype=B
-URIDate 2023-03-23
Reference 2: http://www.xbrl.org/2003/role/disclosureRef
-Name IFRS
-Number 12
-IssueDate 2023-01-01
-Paragraph B12
-Subparagraph b
-Clause iii
-URI https://taxonomy.ifrs.org/xifrs-link?type=IFRS&num=12&code=ifrs-tx-2023-en-r&anchor=para_B12_b_iii&doctype=Appendix&subtype=B
-URIDate 2023-03-23
Reference 3: http://www.xbrl.org/2003/role/disclosureRef
-Name IAS
-Number 1
-IssueDate 2023-01-01
-Paragraph 69
-URI https://taxonomy.ifrs.org/xifrs-link?type=IAS&num=1&code=ifrs-tx-2023-en-r&anchor=para_69&doctype=Standard
-URIDate 2023-03-23
| Name: |
ifrs-full_CurrentLiabilities |
| Namespace Prefix: |
ifrs-full_ |
| Data Type: |
xbrli:monetaryItemType |
| Balance Type: |
credit |
| Period Type: |
instant |
|
| X |
- DefinitionThe amount of tax expense or income relating to changes in deferred tax liabilities and deferred tax assets, recognised in profit or loss. [Refer: Deferred tax assets; Deferred tax expense (income); Deferred tax liabilities] Reference 1: http://www.xbrl.org/2003/role/disclosureRef
-Name IAS
-Number 12
-IssueDate 2023-01-01
-Paragraph 81
-Subparagraph g
-Clause ii
-URI https://taxonomy.ifrs.org/xifrs-link?type=IAS&num=12&code=ifrs-tx-2023-en-r&anchor=para_81_g_ii&doctype=Standard
-URIDate 2023-03-23
| Name: |
ifrs-full_DeferredTaxExpenseIncomeRecognisedInProfitOrLoss |
| Namespace Prefix: |
ifrs-full_ |
| Data Type: |
xbrli:monetaryItemType |
| Balance Type: |
na |
| Period Type: |
duration |
|
| X |
- DefinitionThe amount recognised as of the business combination's acquisition date for goodwill. [Refer: Goodwill; Business combinations [member]] Reference 1: http://www.xbrl.org/2003/role/exampleRef
-Name IFRS
-Number 3
-IssueDate 2023-01-01
-Paragraph IE72
-URI https://taxonomy.ifrs.org/xifrs-link?type=IFRS&num=3&code=ifrs-tx-2023-en-r&anchor=para_IE72&doctype=Illustrative%20Examples
-URIDate 2023-03-23
Reference 2: http://www.xbrl.org/2003/role/exampleRef
-Name IFRS
-Number 3
-IssueDate 2023-01-01
-Paragraph B64
-URI https://taxonomy.ifrs.org/xifrs-link?type=IFRS&num=3&code=ifrs-tx-2023-en-r&anchor=para_B64&doctype=Appendix&subtype=B
-URIDate 2023-03-23
| Name: |
ifrs-full_GoodwillRecognisedAsOfAcquisitionDate |
| Namespace Prefix: |
ifrs-full_ |
| Data Type: |
xbrli:monetaryItemType |
| Balance Type: |
debit |
| Period Type: |
instant |
|
| X |
- DefinitionThe amount recognised as of the acquisition date for identifiable intangible assets acquired in a business combination. [Refer: Intangible assets other than goodwill; Business combinations [member]] Reference 1: http://www.xbrl.org/2003/role/exampleRef
-Name IFRS
-Number 3
-IssueDate 2023-01-01
-Paragraph B64
-Subparagraph i
-URI https://taxonomy.ifrs.org/xifrs-link?type=IFRS&num=3&code=ifrs-tx-2023-en-r&anchor=para_B64_i&doctype=Appendix&subtype=B
-URIDate 2023-03-23
Reference 2: http://www.xbrl.org/2003/role/exampleRef
-Name IFRS
-Number 3
-IssueDate 2023-01-01
-Paragraph IE72
-URI https://taxonomy.ifrs.org/xifrs-link?type=IFRS&num=3&code=ifrs-tx-2023-en-r&anchor=para_IE72&doctype=Illustrative%20Examples
-URIDate 2023-03-23
| Name: |
ifrs-full_IdentifiableIntangibleAssetsRecognisedAsOfAcquisitionDate |
| Namespace Prefix: |
ifrs-full_ |
| Data Type: |
xbrli:monetaryItemType |
| Balance Type: |
debit |
| Period Type: |
instant |
|
| X |
- DefinitionThe amount of current assets that the entity does not separately disclose in the same statement or note. [Refer: Current assets] Reference 1: http://www.xbrl.org/2009/role/commonPracticeRef
-Name IAS
-Number 1
-IssueDate 2023-01-01
-Paragraph 55
-URI https://taxonomy.ifrs.org/xifrs-link?type=IAS&num=1&code=ifrs-tx-2023-en-r&anchor=para_55&doctype=Standard
-URIDate 2023-03-23
| Name: |
ifrs-full_OtherCurrentAssets |
| Namespace Prefix: |
ifrs-full_ |
| Data Type: |
xbrli:monetaryItemType |
| Balance Type: |
debit |
| Period Type: |
instant |
|
| X |
- DefinitionThe amount of non-current financial assets that the entity does not separately disclose in the same statement or note. [Refer: Other financial assets] Reference 1: http://www.xbrl.org/2003/role/disclosureRef
-Name IAS
-Number 1
-IssueDate 2023-01-01
-Paragraph 54
-Subparagraph d
-URI https://taxonomy.ifrs.org/xifrs-link?type=IAS&num=1&code=ifrs-tx-2023-en-r&anchor=para_54_d&doctype=Standard
-URIDate 2023-03-23
| Name: |
ifrs-full_OtherNoncurrentFinancialAssets |
| Namespace Prefix: |
ifrs-full_ |
| Data Type: |
xbrli:monetaryItemType |
| Balance Type: |
debit |
| Period Type: |
instant |
|
| X |
- DefinitionThe amount recognised as of the acquisition date for plant, property and equipment acquired in a business combination. [Refer: Property, plant and equipment; Business combinations [member]] Reference 1: http://www.xbrl.org/2003/role/exampleRef
-Name IFRS
-Number 3
-IssueDate 2023-01-01
-Paragraph B64
-Subparagraph i
-URI https://taxonomy.ifrs.org/xifrs-link?type=IFRS&num=3&code=ifrs-tx-2023-en-r&anchor=para_B64_i&doctype=Appendix&subtype=B
-URIDate 2023-03-23
Reference 2: http://www.xbrl.org/2003/role/exampleRef
-Name IFRS
-Number 3
-IssueDate 2023-01-01
-Paragraph IE72
-URI https://taxonomy.ifrs.org/xifrs-link?type=IFRS&num=3&code=ifrs-tx-2023-en-r&anchor=para_IE72&doctype=Illustrative%20Examples
-URIDate 2023-03-23
| Name: |
ifrs-full_PropertyPlantAndEquipmentRecognisedAsOfAcquisitionDate |
| Namespace Prefix: |
ifrs-full_ |
| Data Type: |
xbrli:monetaryItemType |
| Balance Type: |
debit |
| Period Type: |
instant |
|
| X |
- Details
| Name: |
ifrs-full_NonadjustingEventsAfterReportingPeriodAxis=ifrs-full_MajorBusinessCombinationMember |
| Namespace Prefix: |
|
| Data Type: |
na |
| Balance Type: |
|
| Period Type: |
|
|
v3.23.3
Cash, Cash Equivalents and Restricted Cash (Details) - Schedule of Cash Equivalents and Restricted Cash - USD ($)
|
Jun. 30, 2023 |
Dec. 31, 2022 |
| Schedule of Cash Equivalents and Restricted Cash [Abstract] |
|
|
|
| Cash on hand |
|
$ 465,853
|
$ 471,408
|
| Cash in bank |
|
24,272,524
|
6,459,231
|
| Subtotal |
|
24,783,377
|
6,930,639
|
| Restricted cash – current |
[1] |
17,059
|
|
| Restricted cash – non-current |
[2] |
1,274,956
|
1,300,005
|
| Cash, cash equivalents, and restricted cash |
|
$ 26,030,392
|
$ 8,230,644
|
|
|
| X |
- DefinitionThe amount of cash on hand and demand deposits.
| Name: |
gfai_Cash1 |
| Namespace Prefix: |
gfai_ |
| Data Type: |
xbrli:monetaryItemType |
| Balance Type: |
debit |
| Period Type: |
instant |
|
| X |
- References
+ Details
| Name: |
gfai_ScheduleOfCashEquivalentsAndRestrictedCashAbstract |
| Namespace Prefix: |
gfai_ |
| Data Type: |
xbrli:stringItemType |
| Balance Type: |
na |
| Period Type: |
duration |
|
| X |
- DefinitionThe amount of cash balances held at banks. Reference 1: http://www.xbrl.org/2009/role/commonPracticeRef
-Name IAS
-Number 7
-IssueDate 2023-01-01
-Paragraph 45
-URI https://taxonomy.ifrs.org/xifrs-link?type=IAS&num=7&code=ifrs-tx-2023-en-r&anchor=para_45&doctype=Standard
-URIDate 2023-03-23
| Name: |
ifrs-full_BalancesWithBanks |
| Namespace Prefix: |
ifrs-full_ |
| Data Type: |
xbrli:monetaryItemType |
| Balance Type: |
debit |
| Period Type: |
instant |
|
| X |
- DefinitionThe amount of cash held by the entity. This does not include demand deposits. Reference 1: http://www.xbrl.org/2009/role/commonPracticeRef
-Name IAS
-Number 7
-IssueDate 2023-01-01
-Paragraph 45
-URI https://taxonomy.ifrs.org/xifrs-link?type=IAS&num=7&code=ifrs-tx-2023-en-r&anchor=para_45&doctype=Standard
-URIDate 2023-03-23
| Name: |
ifrs-full_CashOnHand |
| Namespace Prefix: |
ifrs-full_ |
| Data Type: |
xbrli:monetaryItemType |
| Balance Type: |
debit |
| Period Type: |
instant |
|
| X |
- DefinitionThe amount of current restricted cash and cash equivalents. [Refer: Restricted cash and cash equivalents] Reference 1: http://www.xbrl.org/2009/role/commonPracticeRef
-Name IAS
-Number 1
-IssueDate 2023-01-01
-Paragraph 55
-URI https://taxonomy.ifrs.org/xifrs-link?type=IAS&num=1&code=ifrs-tx-2023-en-r&anchor=para_55&doctype=Standard
-URIDate 2023-03-23
| Name: |
ifrs-full_CurrentRestrictedCashAndCashEquivalents |
| Namespace Prefix: |
ifrs-full_ |
| Data Type: |
xbrli:monetaryItemType |
| Balance Type: |
debit |
| Period Type: |
instant |
|
| X |
- DefinitionThe amount of non-current restricted cash and cash equivalents. [Refer: Restricted cash and cash equivalents] Reference 1: http://www.xbrl.org/2009/role/commonPracticeRef
-Name IAS
-Number 1
-IssueDate 2023-01-01
-Paragraph 55
-URI https://taxonomy.ifrs.org/xifrs-link?type=IAS&num=1&code=ifrs-tx-2023-en-r&anchor=para_55&doctype=Standard
-URIDate 2023-03-23
| Name: |
ifrs-full_NoncurrentRestrictedCashAndCashEquivalents |
| Namespace Prefix: |
ifrs-full_ |
| Data Type: |
xbrli:monetaryItemType |
| Balance Type: |
debit |
| Period Type: |
instant |
|
| X |
- DefinitionThe amount of cash and cash equivalents whose use or withdrawal is restricted. [Refer: Cash and cash equivalents] Reference 1: http://www.xbrl.org/2009/role/commonPracticeRef
-Name IAS
-Number 1
-IssueDate 2023-01-01
-Paragraph 55
-URI https://taxonomy.ifrs.org/xifrs-link?type=IAS&num=1&code=ifrs-tx-2023-en-r&anchor=para_55&doctype=Standard
-URIDate 2023-03-23
| Name: |
ifrs-full_RestrictedCashAndCashEquivalents |
| Namespace Prefix: |
ifrs-full_ |
| Data Type: |
xbrli:monetaryItemType |
| Balance Type: |
debit |
| Period Type: |
instant |
|
v3.23.3
| X |
- References
+ Details
| Name: |
ifrs-full_ClassesOfInventoriesAbstract |
| Namespace Prefix: |
ifrs-full_ |
| Data Type: |
xbrli:stringItemType |
| Balance Type: |
na |
| Period Type: |
duration |
|
| X |
- DefinitionThe amount of inventories carried at net realisable value. [Refer: Inventories] Reference 1: http://www.xbrl.org/2009/role/commonPracticeRef
-Name IAS
-Number 2
-IssueDate 2023-01-01
-Paragraph 36
-URI https://taxonomy.ifrs.org/xifrs-link?type=IAS&num=2&code=ifrs-tx-2023-en-r&anchor=para_36&doctype=Standard
-URIDate 2023-03-23
| Name: |
ifrs-full_InventoriesAtNetRealisableValue |
| Namespace Prefix: |
ifrs-full_ |
| Data Type: |
xbrli:monetaryItemType |
| Balance Type: |
debit |
| Period Type: |
instant |
|
v3.23.3
Inventories (Details) - Schedule of Inventories - USD ($)
|
Jun. 30, 2023 |
Dec. 31, 2022 |
| Inventories (Details) - Schedule of Inventories [Line Items] |
|
|
| Inventories |
$ 1,636,245
|
$ 5,105,770
|
| Robots at warehouse [Member] |
|
|
| Inventories (Details) - Schedule of Inventories [Line Items] |
|
|
| Inventories |
4,976,219
|
5,553,859
|
| Robots in transit [Member] |
|
|
| Inventories (Details) - Schedule of Inventories [Line Items] |
|
|
| Inventories |
46,950
|
|
| Security equipment [Member] |
|
|
| Inventories (Details) - Schedule of Inventories [Line Items] |
|
|
| Inventories |
415,036
|
494,793
|
| Impairment provision for inventories [Member] |
|
|
| Inventories (Details) - Schedule of Inventories [Line Items] |
|
|
| Inventories |
$ (3,801,960)
|
$ (942,882)
|
| X |
- References
+ Details
| Name: |
gfai_InventoriesDetailsScheduleofInventoriesLineItems |
| Namespace Prefix: |
gfai_ |
| Data Type: |
xbrli:stringItemType |
| Balance Type: |
na |
| Period Type: |
duration |
|
| X |
- DefinitionA classification of current inventory representing the amount of inventories in transit. [Refer: Inventories] Reference 1: http://www.xbrl.org/2009/role/commonPracticeRef
-Name IAS
-Number 2
-IssueDate 2023-01-01
-Paragraph 37
-URI https://taxonomy.ifrs.org/xifrs-link?type=IAS&num=2&code=ifrs-tx-2023-en-r&anchor=para_37&doctype=Standard
-URIDate 2023-03-23
| Name: |
ifrs-full_CurrentInventoriesInTransit |
| Namespace Prefix: |
ifrs-full_ |
| Data Type: |
xbrli:monetaryItemType |
| Balance Type: |
debit |
| Period Type: |
instant |
|
| X |
- Details
| Name: |
ifrs-full_ClassesOfAssetsAxis=gfai_RobotsAtWarehouseMember |
| Namespace Prefix: |
|
| Data Type: |
na |
| Balance Type: |
|
| Period Type: |
|
|
| X |
- Details
| Name: |
ifrs-full_ClassesOfAssetsAxis=gfai_RobotsInTransitMember |
| Namespace Prefix: |
|
| Data Type: |
na |
| Balance Type: |
|
| Period Type: |
|
|
| X |
- Details
| Name: |
ifrs-full_ClassesOfAssetsAxis=gfai_SecurityEquipmentMember |
| Namespace Prefix: |
|
| Data Type: |
na |
| Balance Type: |
|
| Period Type: |
|
|
| X |
- Details
| Name: |
ifrs-full_ClassesOfAssetsAxis=gfai_ImpairmentProvisionForInventoriesMember |
| Namespace Prefix: |
|
| Data Type: |
na |
| Balance Type: |
|
| Period Type: |
|
|
v3.23.3
| X |
- References
+ Details
| Name: |
gfai_TradeReceivablesNetAbstract |
| Namespace Prefix: |
gfai_ |
| Data Type: |
xbrli:stringItemType |
| Balance Type: |
na |
| Period Type: |
duration |
|
v3.23.3
Trade Receivables, Net (Details) - Schedule of Trade Receivable - USD ($)
|
Jun. 30, 2023 |
Dec. 31, 2022 |
| Schedule of Trade Receivable [Abstract] |
|
|
| Trade receivable |
$ 5,160,600
|
$ 5,392,720
|
| (Impairment provision) recovery of doubtful accounts |
(32,602)
|
7,466
|
| Trade receivable, net |
$ 5,127,998
|
$ 5,400,186
|
| X |
- References
+ Details
| Name: |
gfai_AllowanceForDoubtfulAccountsContractedCustomers |
| Namespace Prefix: |
gfai_ |
| Data Type: |
xbrli:monetaryItemType |
| Balance Type: |
credit |
| Period Type: |
instant |
|
| X |
- References
+ Details
| Name: |
gfai_ScheduleOfTradeReceivableAbstract |
| Namespace Prefix: |
gfai_ |
| Data Type: |
xbrli:stringItemType |
| Balance Type: |
na |
| Period Type: |
duration |
|
| X |
- DefinitionThe amount of current trade receivables and current other receivables. [Refer: Current trade receivables; Other current receivables] Reference 1: http://www.xbrl.org/2003/role/disclosureRef
-Name IAS
-Number 1
-IssueDate 2023-01-01
-Paragraph 54
-Subparagraph h
-URI https://taxonomy.ifrs.org/xifrs-link?type=IAS&num=1&code=ifrs-tx-2023-en-r&anchor=para_54_h&doctype=Standard
-URIDate 2023-03-23
Reference 2: http://www.xbrl.org/2003/role/disclosureRef
-Name IAS
-Number 1
-IssueDate 2023-01-01
-Paragraph 78
-Subparagraph b
-URI https://taxonomy.ifrs.org/xifrs-link?type=IAS&num=1&code=ifrs-tx-2023-en-r&anchor=para_78_b&doctype=Standard
-URIDate 2023-03-23
| Name: |
ifrs-full_TradeAndOtherCurrentReceivables |
| Namespace Prefix: |
ifrs-full_ |
| Data Type: |
xbrli:monetaryItemType |
| Balance Type: |
debit |
| Period Type: |
instant |
|
v3.23.3
Withholding Tax Receivable (Details)
$ in Millions |
|
6 Months Ended |
|
|
|
Jul. 12, 2023
USD ($)
|
Jul. 12, 2023
THB (฿)
|
Jun. 30, 2022
USD ($)
|
Jun. 30, 2022
THB (฿)
|
Jun. 30, 2023
USD ($)
|
Dec. 31, 2022
USD ($)
|
| Withholding Tax Receivable [Abstract] |
|
|
|
|
|
|
| Tax refund |
$ 0.5
|
฿ 959,514
|
$ 1.6
|
฿ 107,574
|
|
|
| Total tax refund |
0.8
|
฿ 188,153
|
1.0
|
฿ 312,291
|
|
|
| Wrote off |
$ 0.3
|
|
0.6
|
|
|
|
| Withholding taxes receivable |
|
|
$ 0.1
|
|
$ 0.3
|
|
| Allowance balance |
|
|
|
|
$ 1.2
|
$ 0.9
|
| X |
- DefinitionAllowance of withholding taxes receivable.
| Name: |
gfai_AllowanceOfWithholdingTaxesReceivable |
| Namespace Prefix: |
gfai_ |
| Data Type: |
xbrli:monetaryItemType |
| Balance Type: |
credit |
| Period Type: |
instant |
|
| X |
- References
+ Details
| Name: |
gfai_WithholdingTaxReceivableAbstract |
| Namespace Prefix: |
gfai_ |
| Data Type: |
xbrli:stringItemType |
| Balance Type: |
na |
| Period Type: |
duration |
|
| X |
- DefinitionThe amount of an allowance account used to record impairments to financial assets due to credit losses. [Refer: Financial assets] Reference 1: http://www.xbrl.org/2003/role/disclosureRef
-Note Expired 2023-01-01
-Name IFRS
-Number 7
-IssueDate 2023-01-01
-Paragraph 16
-URI https://taxonomy.ifrs.org/xifrs-link?type=IFRS&num=7&code=ifrs-tx-2017-en-b&anchor=para_16&doctype=Standard&book=b
-URIDate 2023-03-23
| Name: |
ifrs-full_AllowanceAccountForCreditLossesOfFinancialAssets |
| Namespace Prefix: |
ifrs-full_ |
| Data Type: |
xbrli:monetaryItemType |
| Balance Type: |
credit |
| Period Type: |
instant |
|
v3.23.3
Withholding Tax Receivable (Details) - Schedule of Withholding Tax Receivables - USD ($)
|
6 Months Ended |
Jun. 30, 2023 |
Jun. 30, 2022 |
| Schedule of Withholding Tax Receivables [Abstract] |
|
|
| Balance at January 1, |
$ 2,691,096
|
$ 3,531,953
|
| Addition |
401,941
|
381,966
|
| Collection |
|
(1,045,061)
|
| Write off/ Allowance for uncollectible |
(561,277)
|
(263,340)
|
| Exchange difference |
(73,713)
|
(153,902)
|
| Balance at June 30, |
$ 2,458,047
|
$ 2,451,616
|
| X |
- DefinitionAllowance for uncollectible.
| Name: |
gfai_AllowanceForUncollectible |
| Namespace Prefix: |
gfai_ |
| Data Type: |
xbrli:monetaryItemType |
| Balance Type: |
credit |
| Period Type: |
duration |
|
| X |
- References
+ Details
| Name: |
gfai_ScheduleOfWithholdingTaxReceivablesAbstract |
| Namespace Prefix: |
gfai_ |
| Data Type: |
xbrli:stringItemType |
| Balance Type: |
na |
| Period Type: |
duration |
|
| X |
- References
+ Details
| Name: |
gfai_TaxExchangeDifferenceValue |
| Namespace Prefix: |
gfai_ |
| Data Type: |
xbrli:monetaryItemType |
| Balance Type: |
credit |
| Period Type: |
duration |
|
| X |
- DefinitionWithholding tax receivables
| Name: |
gfai_WithholdingTaxReceivables |
| Namespace Prefix: |
gfai_ |
| Data Type: |
xbrli:monetaryItemType |
| Balance Type: |
debit |
| Period Type: |
instant |
|
v3.23.3
Withholding Tax Receivable (Details) - Schedule of Current and Non Current Portion of Tax Receivables - USD ($)
|
Jun. 30, 2023 |
Dec. 31, 2022 |
| Schedule of Current and Non Current Portion of Tax Receivables [Abstract] |
|
|
| Current portion |
$ 536,974
|
$ 757,024
|
| Non-current portion |
1,921,073
|
1,934,072
|
| Withholding taxes receivables, net |
$ 2,458,047
|
$ 2,691,096
|
| X |
- References
+ Details
| Name: |
gfai_ScheduleOfCurrentAndNonCurrentPortionOfTaxReceivablesAbstract |
| Namespace Prefix: |
gfai_ |
| Data Type: |
xbrli:stringItemType |
| Balance Type: |
na |
| Period Type: |
duration |
|
| X |
- DefinitionWithholding tax receivables, net
| Name: |
gfai_TaxReceivablesNet |
| Namespace Prefix: |
gfai_ |
| Data Type: |
xbrli:monetaryItemType |
| Balance Type: |
debit |
| Period Type: |
instant |
|
v3.23.3
| X |
- References
+ Details
| Name: |
ifrs-full_TradeAndOtherReceivablesAbstract |
| Namespace Prefix: |
ifrs-full_ |
| Data Type: |
xbrli:stringItemType |
| Balance Type: |
na |
| Period Type: |
duration |
|
v3.23.3
| X |
- DefinitionCash advance to a third-party vendor.
| Name: |
gfai_CashAdvanceToAThirdpartyVendor |
| Namespace Prefix: |
gfai_ |
| Data Type: |
xbrli:monetaryItemType |
| Balance Type: |
debit |
| Period Type: |
duration |
|
| X |
- DefinitionImpairment provision for other receivables.
| Name: |
gfai_ImpairmentProvisionForOtherReceivables |
| Namespace Prefix: |
gfai_ |
| Data Type: |
xbrli:monetaryItemType |
| Balance Type: |
debit |
| Period Type: |
duration |
|
| X |
- References
+ Details
| Name: |
gfai_OtherReceivablesDetailsScheduleofOtherReceivablesLineItems |
| Namespace Prefix: |
gfai_ |
| Data Type: |
xbrli:stringItemType |
| Balance Type: |
na |
| Period Type: |
duration |
|
| X |
- DefinitionThe amount receivable by the entity that it does not separately disclose in the same statement or note. Reference 1: http://www.xbrl.org/2003/role/exampleRef
-Name IAS
-Number 1
-IssueDate 2023-01-01
-Paragraph 78
-Subparagraph b
-URI https://taxonomy.ifrs.org/xifrs-link?type=IAS&num=1&code=ifrs-tx-2023-en-r&anchor=para_78_b&doctype=Standard
-URIDate 2023-03-23
| Name: |
ifrs-full_OtherReceivables |
| Namespace Prefix: |
ifrs-full_ |
| Data Type: |
xbrli:monetaryItemType |
| Balance Type: |
debit |
| Period Type: |
instant |
|
v3.23.3
| X |
- DefinitionAllowance for doubtful accounts.
| Name: |
gfai_AllowanceForDoubtfulAccounts |
| Namespace Prefix: |
gfai_ |
| Data Type: |
xbrli:monetaryItemType |
| Balance Type: |
credit |
| Period Type: |
duration |
|
| X |
- References
+ Details
| Name: |
gfai_OtherCurrentAndOtherNonCurrentAssetsAbstract |
| Namespace Prefix: |
gfai_ |
| Data Type: |
xbrli:stringItemType |
| Balance Type: |
na |
| Period Type: |
duration |
|
v3.23.3
Other Current and Other Non-Current Assets (Details) - Schedule of Other Current and Other Non-Current Assets - USD ($)
|
Jun. 30, 2023 |
Dec. 31, 2022 |
| Schedule Of Other Current And Other Non Current Assets Abstract |
|
|
| Input VAT and other taxes receivable |
$ 314,855
|
$ 293,429
|
| Prepayments – office and warehouse rental |
1,240,967
|
780,279
|
| Prepayments - insurance |
375,985
|
106,167
|
| Prepayments - others |
166,165
|
91,926
|
| Uniforms |
14,781
|
24,699
|
| Tools and supplies |
152,035
|
155,642
|
| Deferred costs |
90,555
|
219,782
|
| Cash advances to employees |
25,375
|
71,084
|
| Other current assets |
2,380,718
|
1,743,008
|
| Deposits |
397,030
|
437,602
|
| Deferred costs |
|
9,720
|
| Other non-current assets |
$ 397,030
|
$ 447,322
|
| X |
- DefinitionDeffered cost other current assets.
| Name: |
gfai_DefferedCostOtherCurrentAsset |
| Namespace Prefix: |
gfai_ |
| Data Type: |
xbrli:monetaryItemType |
| Balance Type: |
debit |
| Period Type: |
instant |
|
| X |
- DefinitionDeffered cost other non current assets.
| Name: |
gfai_DefferedCostOtherNonCurrentAsset |
| Namespace Prefix: |
gfai_ |
| Data Type: |
xbrli:monetaryItemType |
| Balance Type: |
debit |
| Period Type: |
instant |
|
| X |
- References
+ Details
| Name: |
gfai_ScheduleOfOtherCurrentAndOtherNonCurrentAssetsAbstract |
| Namespace Prefix: |
gfai_ |
| Data Type: |
xbrli:stringItemType |
| Balance Type: |
na |
| Period Type: |
duration |
|
| X |
- DefinitionThe amount of non-current non-financial assets that the entity does not separately disclose in the same statement or note. [Refer: Financial assets] Reference 1: http://www.xbrl.org/2009/role/commonPracticeRef
-Name IAS
-Number 1
-IssueDate 2023-01-01
-Paragraph 55
-URI https://taxonomy.ifrs.org/xifrs-link?type=IAS&num=1&code=ifrs-tx-2023-en-r&anchor=para_55&doctype=Standard
-URIDate 2023-03-23
| Name: |
ifrs-full_OtherNoncurrentNonfinancialAssets |
| Namespace Prefix: |
ifrs-full_ |
| Data Type: |
xbrli:monetaryItemType |
| Balance Type: |
debit |
| Period Type: |
instant |
|
| X |
- DefinitionThe amount of non-financial assets that the entity does not separately disclose in the same statement or note. [Refer: Financial assets] Reference 1: http://www.xbrl.org/2009/role/commonPracticeRef
-Name IAS
-Number 1
-IssueDate 2023-01-01
-Paragraph 55
-URI https://taxonomy.ifrs.org/xifrs-link?type=IAS&num=1&code=ifrs-tx-2023-en-r&anchor=para_55&doctype=Standard
-URIDate 2023-03-23
| Name: |
ifrs-full_OtherNonfinancialAssets |
| Namespace Prefix: |
ifrs-full_ |
| Data Type: |
xbrli:monetaryItemType |
| Balance Type: |
debit |
| Period Type: |
instant |
|
| X |
- DefinitionA classification of current inventory representing the amount of supplies to be used for the production process. [Refer: Inventories] Reference 1: http://www.xbrl.org/2009/role/commonPracticeRef
-Name IAS
-Number 2
-IssueDate 2023-01-01
-Paragraph 37
-URI https://taxonomy.ifrs.org/xifrs-link?type=IAS&num=2&code=ifrs-tx-2023-en-r&anchor=para_37&doctype=Standard
-URIDate 2023-03-23
Reference 2: http://www.xbrl.org/2003/role/exampleRef
-Name IAS
-Number 1
-IssueDate 2023-01-01
-Paragraph 78
-Subparagraph c
-URI https://taxonomy.ifrs.org/xifrs-link?type=IAS&num=1&code=ifrs-tx-2023-en-r&anchor=para_78_c&doctype=Standard
-URIDate 2023-03-23
| Name: |
ifrs-full_ProductionSupplies |
| Namespace Prefix: |
ifrs-full_ |
| Data Type: |
xbrli:monetaryItemType |
| Balance Type: |
debit |
| Period Type: |
instant |
|
| X |
- DefinitionThe amount of receivables arising from the rental of properties. Property is land or a building - or part of a building - or both. Reference 1: http://www.xbrl.org/2009/role/commonPracticeRef
-Name IAS
-Number 1
-IssueDate 2023-01-01
-Paragraph 78
-Subparagraph b
-URI https://taxonomy.ifrs.org/xifrs-link?type=IAS&num=1&code=ifrs-tx-2023-en-r&anchor=para_78_b&doctype=Standard
-URIDate 2023-03-23
| Name: |
ifrs-full_ReceivablesFromRentalOfProperties |
| Namespace Prefix: |
ifrs-full_ |
| Data Type: |
xbrli:monetaryItemType |
| Balance Type: |
debit |
| Period Type: |
instant |
|
v3.23.3
Property, Plant and Equipment (Details) - USD ($)
|
6 Months Ended |
Jun. 30, 2023 |
Jun. 30, 2022 |
| Property, Plant and Equipment [Abstract] |
|
|
| Depreciation expense |
$ 1,057,117
|
$ 1,460,187
|
| Impairment loss |
1,591,766
|
|
| Net book value |
$ 695,000
|
$ 1,145,000
|
| X |
- DefinitionThe net book value of the asset(s) sold in connection with the sale of the property to another party and lease back to the seller.
| Name: |
gfai_NetBookValueAssets |
| Namespace Prefix: |
gfai_ |
| Data Type: |
xbrli:monetaryItemType |
| Balance Type: |
debit |
| Period Type: |
instant |
|
| X |
- DefinitionThe amount of depreciation expense. Depreciation is the systematic allocation of depreciable amounts of tangible assets over their useful lives. Reference 1: http://www.xbrl.org/2009/role/commonPracticeRef
-Name IAS
-Number 1
-IssueDate 2023-01-01
-Paragraph 112
-Subparagraph c
-URI https://taxonomy.ifrs.org/xifrs-link?type=IAS&num=1&code=ifrs-tx-2023-en-r&anchor=para_112_c&doctype=Standard
-URIDate 2023-03-23
| Name: |
ifrs-full_DepreciationExpense |
| Namespace Prefix: |
ifrs-full_ |
| Data Type: |
xbrli:monetaryItemType |
| Balance Type: |
debit |
| Period Type: |
duration |
|
| X |
- DefinitionThe amount of impairment loss recognised in profit or loss for property, plant and equipment. [Refer: Impairment loss recognised in profit or loss; Property, plant and equipment] Reference 1: http://www.xbrl.org/2003/role/disclosureRef
-Name IAS
-Number 16
-IssueDate 2023-01-01
-Paragraph 73
-Subparagraph e
-Clause v
-URI https://taxonomy.ifrs.org/xifrs-link?type=IAS&num=16&code=ifrs-tx-2023-en-r&anchor=para_73_e_v&doctype=Standard
-URIDate 2023-03-23
Reference 2: http://www.xbrl.org/2003/role/disclosureRef
-Name IAS
-Number 1
-IssueDate 2023-01-01
-Paragraph 98
-Subparagraph a
-URI https://taxonomy.ifrs.org/xifrs-link?type=IAS&num=1&code=ifrs-tx-2023-en-r&anchor=para_98_a&doctype=Standard
-URIDate 2023-03-23
| Name: |
ifrs-full_ImpairmentLossRecognisedInProfitOrLossPropertyPlantAndEquipment |
| Namespace Prefix: |
ifrs-full_ |
| Data Type: |
xbrli:monetaryItemType |
| Balance Type: |
na |
| Period Type: |
duration |
|
| X |
- References
+ Details
| Name: |
ifrs-full_PropertyPlantAndEquipmentAbstract |
| Namespace Prefix: |
ifrs-full_ |
| Data Type: |
xbrli:stringItemType |
| Balance Type: |
na |
| Period Type: |
duration |
|
v3.23.3
Property, Plant and Equipment (Details) - Schedule of Property, Plant and Equipment - USD ($)
|
6 Months Ended |
|
Jun. 30, 2023 |
Jun. 30, 2022 |
Dec. 31, 2022 |
| Cost |
|
|
|
| Cost, Beginning balance |
$ 38,064,952
|
$ 37,326,178
|
|
| Acquisitions through business combinations |
|
2,917,702
|
|
| Additions |
906,619
|
2,641,812
|
|
| Disposals |
(363,211)
|
(709,376)
|
|
| Exchange differences |
(796,529)
|
(2,138,852)
|
|
| Impairment of fixed assets |
(1,591,766)
|
|
|
| Cost, Ending balance |
36,220,065
|
40,037,464
|
|
| Accumulated Depreciation |
|
|
|
| Accumulated Depreciation, Beginning balance |
29,998,191
|
27,428,877
|
|
| Acquisitions through business combinations |
|
841,603
|
|
| Depreciation charged for the period |
1,153,837
|
1,574,030
|
|
| Disposals |
(325,864)
|
(459,024)
|
|
| Exchange differences |
(624,507)
|
(1,567,498)
|
|
| Accumulated Depreciation, Ending balance |
30,201,657
|
27,817,988
|
|
| Net book value |
|
|
|
| Net book value |
6,018,408
|
12,219,476
|
$ 8,066,761
|
| Leasehold improvements [Member] |
|
|
|
| Cost |
|
|
|
| Cost, Beginning balance |
3,146,864
|
3,239,683
|
|
| Acquisitions through business combinations |
|
|
|
| Additions |
|
26,342
|
|
| Disposals |
(104,773)
|
(101,834)
|
|
| Exchange differences |
(60,518)
|
(173,963)
|
|
| Impairment of fixed assets |
|
|
|
| Cost, Ending balance |
2,981,573
|
2,990,228
|
|
| Accumulated Depreciation |
|
|
|
| Accumulated Depreciation, Beginning balance |
2,577,341
|
2,693,472
|
|
| Acquisitions through business combinations |
|
|
|
| Depreciation charged for the period |
48,922
|
51,903
|
|
| Disposals |
(108,213)
|
(99,439)
|
|
| Exchange differences |
(48,443)
|
(146,005)
|
|
| Accumulated Depreciation, Ending balance |
2,469,607
|
2,499,931
|
|
| Net book value |
|
|
|
| Net book value |
511,966
|
490,298
|
|
| Machinery and equipment [Member] |
|
|
|
| Cost |
|
|
|
| Cost, Beginning balance |
4,868,015
|
5,108,501
|
|
| Acquisitions through business combinations |
|
|
|
| Additions |
1,750
|
18,698
|
|
| Disposals |
(105,939)
|
(7,437)
|
|
| Exchange differences |
(95,521)
|
(281,325)
|
|
| Impairment of fixed assets |
|
|
|
| Cost, Ending balance |
4,668,305
|
4,838,437
|
|
| Accumulated Depreciation |
|
|
|
| Accumulated Depreciation, Beginning balance |
4,748,031
|
4,906,277
|
|
| Acquisitions through business combinations |
|
|
|
| Depreciation charged for the period |
34,180
|
57,623
|
|
| Disposals |
(109,514)
|
(7,396)
|
|
| Exchange differences |
(90,705)
|
(271,901)
|
|
| Accumulated Depreciation, Ending balance |
4,581,992
|
4,684,603
|
|
| Net book value |
|
|
|
| Net book value |
86,313
|
153,834
|
|
| Office decoration and equipment [Member] |
|
|
|
| Cost |
|
|
|
| Cost, Beginning balance |
5,354,351
|
5,412,444
|
|
| Acquisitions through business combinations |
|
205,070
|
|
| Additions |
6,964
|
18,603
|
|
| Disposals |
(48,955)
|
(15,463)
|
|
| Exchange differences |
(106,807)
|
(298,630)
|
|
| Impairment of fixed assets |
|
|
|
| Cost, Ending balance |
5,205,553
|
5,322,024
|
|
| Accumulated Depreciation |
|
|
|
| Accumulated Depreciation, Beginning balance |
4,889,742
|
4,799,149
|
|
| Acquisitions through business combinations |
|
184,364
|
|
| Depreciation charged for the period |
87,164
|
96,235
|
|
| Disposals |
(44,542)
|
(15,432)
|
|
| Exchange differences |
(101,287)
|
(268,318)
|
|
| Accumulated Depreciation, Ending balance |
4,831,077
|
4,795,998
|
|
| Net book value |
|
|
|
| Net book value |
374,476
|
526,026
|
|
| Vehicles [Member] |
|
|
|
| Cost |
|
|
|
| Cost, Beginning balance |
15,518,987
|
16,233,868
|
|
| Acquisitions through business combinations |
|
141,619
|
|
| Additions |
|
80,350
|
|
| Disposals |
(47,155)
|
(344,818)
|
|
| Exchange differences |
(353,552)
|
(880,949)
|
|
| Impairment of fixed assets |
|
|
|
| Cost, Ending balance |
15,118,280
|
15,230,070
|
|
| Accumulated Depreciation |
|
|
|
| Accumulated Depreciation, Beginning balance |
13,493,656
|
13,447,168
|
|
| Acquisitions through business combinations |
|
136,723
|
|
| Depreciation charged for the period |
263,962
|
416,775
|
|
| Disposals |
(48,748)
|
(330,993)
|
|
| Exchange differences |
(275,519)
|
(742,974)
|
|
| Accumulated Depreciation, Ending balance |
13,433,351
|
12,926,699
|
|
| Net book value |
|
|
|
| Net book value |
1,684,929
|
2,303,371
|
|
| Assets under construction [Member] |
|
|
|
| Cost |
|
|
|
| Cost, Beginning balance |
33,222
|
248,686
|
|
| Acquisitions through business combinations |
|
|
|
| Additions |
|
|
|
| Disposals |
|
(211,659)
|
|
| Exchange differences |
(652)
|
(4,472)
|
|
| Impairment of fixed assets |
|
|
|
| Cost, Ending balance |
32,570
|
32,555
|
|
| Accumulated Depreciation |
|
|
|
| Accumulated Depreciation, Beginning balance |
|
|
|
| Acquisitions through business combinations |
|
|
|
| Depreciation charged for the period |
|
|
|
| Disposals |
|
|
|
| Exchange differences |
|
|
|
| Accumulated Depreciation, Ending balance |
|
|
|
| Net book value |
|
|
|
| Net book value |
32,570
|
32,555
|
|
| GDM machines [Member] |
|
|
|
| Cost |
|
|
|
| Cost, Beginning balance |
1,948,698
|
1,713,926
|
|
| Acquisitions through business combinations |
|
|
|
| Additions |
624,126
|
318,905
|
|
| Disposals |
|
(15,892)
|
|
| Exchange differences |
(38,238)
|
(107,391)
|
|
| Impairment of fixed assets |
|
|
|
| Cost, Ending balance |
2,534,586
|
1,909,548
|
|
| Accumulated Depreciation |
|
|
|
| Accumulated Depreciation, Beginning balance |
1,230,247
|
891,378
|
|
| Acquisitions through business combinations |
|
|
|
| Depreciation charged for the period |
202,983
|
188,620
|
|
| Disposals |
|
(5,303)
|
|
| Exchange differences |
(30,774)
|
(56,970)
|
|
| Accumulated Depreciation, Ending balance |
1,402,456
|
1,017,725
|
|
| Net book value |
|
|
|
| Net book value |
1,132,130
|
891,822
|
|
| Robots [Member] |
|
|
|
| Cost |
|
|
|
| Cost, Beginning balance |
7,194,815
|
5,369,070
|
|
| Acquisitions through business combinations |
|
2,571,013
|
|
| Additions |
273,779
|
2,178,914
|
|
| Disposals |
(56,389)
|
(12,273)
|
|
| Exchange differences |
(141,241)
|
(392,122)
|
|
| Impairment of fixed assets |
(1,591,766)
|
|
|
| Cost, Ending balance |
5,679,198
|
9,714,602
|
|
| Accumulated Depreciation |
|
|
|
| Accumulated Depreciation, Beginning balance |
3,059,174
|
691,433
|
|
| Acquisitions through business combinations |
|
520,516
|
|
| Depreciation charged for the period |
516,626
|
762,874
|
|
| Disposals |
(14,847)
|
(461)
|
|
| Exchange differences |
(77,779)
|
(81,330)
|
|
| Accumulated Depreciation, Ending balance |
3,483,174
|
1,893,032
|
|
| Net book value |
|
|
|
| Net book value |
$ 2,196,024
|
$ 7,821,570
|
|
| X |
- DefinitionAmount of exchange differences.
| Name: |
gfai_AccumulatedAmortizationsExchangeDifferences |
| Namespace Prefix: |
gfai_ |
| Data Type: |
xbrli:monetaryItemType |
| Balance Type: |
debit |
| Period Type: |
duration |
|
| X |
- References
+ Details
| Name: |
gfai_AccumulatedDepreciationAbstract |
| Namespace Prefix: |
gfai_ |
| Data Type: |
xbrli:stringItemType |
| Balance Type: |
na |
| Period Type: |
duration |
|
| X |
- DefinitionAcquisitions through business combinations.
| Name: |
gfai_AcquisitionsThroughBusinessCombinationsInvestmentProperty1 |
| Namespace Prefix: |
gfai_ |
| Data Type: |
xbrli:monetaryItemType |
| Balance Type: |
debit |
| Period Type: |
duration |
|
| X |
- References
+ Details
| Name: |
gfai_CostAbstract |
| Namespace Prefix: |
gfai_ |
| Data Type: |
xbrli:stringItemType |
| Balance Type: |
na |
| Period Type: |
duration |
|
| X |
- Definition
+ References
+ Details
| Name: |
gfai_ExchangeDifferencesCost |
| Namespace Prefix: |
gfai_ |
| Data Type: |
xbrli:monetaryItemType |
| Balance Type: |
debit |
| Period Type: |
duration |
|
| X |
- References
+ Details
| Name: |
gfai_NetBookValueAbstract |
| Namespace Prefix: |
gfai_ |
| Data Type: |
xbrli:stringItemType |
| Balance Type: |
na |
| Period Type: |
duration |
|
| X |
- DefinitionProperty plant and equipment.
| Name: |
gfai_PropertyPlantAndEquipment1 |
| Namespace Prefix: |
gfai_ |
| Data Type: |
xbrli:monetaryItemType |
| Balance Type: |
debit |
| Period Type: |
instant |
|
| X |
- DefinitionThe amount of accumulated depreciation of property, plant and equipment.
| Name: |
gfai_PropertyPlantAndEquipmentAccumulatedDepreciation |
| Namespace Prefix: |
gfai_ |
| Data Type: |
xbrli:monetaryItemType |
| Balance Type: |
debit |
| Period Type: |
instant |
|
| X |
- DefinitionThe increase in investment property resulting from acquisitions through business combinations. [Refer: Business combinations [member]; Investment property] Reference 1: http://www.xbrl.org/2003/role/disclosureRef
-Name IAS
-Number 40
-IssueDate 2023-01-01
-Paragraph 76
-Subparagraph b
-URI https://taxonomy.ifrs.org/xifrs-link?type=IAS&num=40&code=ifrs-tx-2023-en-r&anchor=para_76_b&doctype=Standard
-URIDate 2023-03-23
Reference 2: http://www.xbrl.org/2003/role/disclosureRef
-Name IAS
-Number 40
-IssueDate 2023-01-01
-Paragraph 79
-Subparagraph d
-Clause ii
-URI https://taxonomy.ifrs.org/xifrs-link?type=IAS&num=40&code=ifrs-tx-2023-en-r&anchor=para_79_d_ii&doctype=Standard
-URIDate 2023-03-23
| Name: |
ifrs-full_AcquisitionsThroughBusinessCombinationsInvestmentProperty |
| Namespace Prefix: |
ifrs-full_ |
| Data Type: |
xbrli:monetaryItemType |
| Balance Type: |
debit |
| Period Type: |
duration |
|
| X |
- DefinitionThe amount of additions to property, plant and equipment other than those acquired through business combinations. [Refer: Business combinations [member]; Property, plant and equipment] Reference 1: http://www.xbrl.org/2003/role/disclosureRef
-Name IAS
-Number 16
-IssueDate 2023-01-01
-Paragraph 73
-Subparagraph e
-Clause i
-URI https://taxonomy.ifrs.org/xifrs-link?type=IAS&num=16&code=ifrs-tx-2023-en-r&anchor=para_73_e_i&doctype=Standard
-URIDate 2023-03-23
| Name: |
ifrs-full_AdditionsOtherThanThroughBusinessCombinationsPropertyPlantAndEquipment |
| Namespace Prefix: |
ifrs-full_ |
| Data Type: |
xbrli:monetaryItemType |
| Balance Type: |
debit |
| Period Type: |
duration |
|
| X |
- DefinitionThe amount of depreciation of property, plant and equipment. [Refer: Depreciation and amortisation expense; Property, plant and equipment] Reference 1: http://www.xbrl.org/2003/role/disclosureRef
-Name IAS
-Number 16
-IssueDate 2023-01-01
-Paragraph 73
-Subparagraph e
-Clause vii
-URI https://taxonomy.ifrs.org/xifrs-link?type=IAS&num=16&code=ifrs-tx-2023-en-r&anchor=para_73_e_vii&doctype=Standard
-URIDate 2023-03-23
Reference 2: http://www.xbrl.org/2003/role/disclosureRef
-Name IAS
-Number 16
-IssueDate 2023-01-01
-Paragraph 75
-Subparagraph a
-URI https://taxonomy.ifrs.org/xifrs-link?type=IAS&num=16&code=ifrs-tx-2023-en-r&anchor=para_75_a&doctype=Standard
-URIDate 2023-03-23
| Name: |
ifrs-full_DepreciationPropertyPlantAndEquipment |
| Namespace Prefix: |
ifrs-full_ |
| Data Type: |
xbrli:monetaryItemType |
| Balance Type: |
na |
| Period Type: |
duration |
|
| X |
- DefinitionThe decrease in intangible assets other than goodwill resulting from disposals and retirements. [Refer: Intangible assets other than goodwill] Reference 1: http://www.xbrl.org/2009/role/commonPracticeRef
-Name IAS
-Number 38
-IssueDate 2023-01-01
-Paragraph 118
-Subparagraph e
-URI https://taxonomy.ifrs.org/xifrs-link?type=IAS&num=38&code=ifrs-tx-2023-en-r&anchor=para_118_e&doctype=Standard
-URIDate 2023-03-23
| Name: |
ifrs-full_DisposalsAndRetirementsIntangibleAssetsOtherThanGoodwill |
| Namespace Prefix: |
ifrs-full_ |
| Data Type: |
xbrli:monetaryItemType |
| Balance Type: |
credit |
| Period Type: |
duration |
|
| X |
- DefinitionThe decrease in property, plant and equipment resulting from disposals. [Refer: Property, plant and equipment] Reference 1: http://www.xbrl.org/2003/role/disclosureRef
-Name IAS
-Number 16
-IssueDate 2023-01-01
-Paragraph 73
-Subparagraph e
-Clause ii
-URI https://taxonomy.ifrs.org/xifrs-link?type=IAS&num=16&code=ifrs-tx-2023-en-r&anchor=para_73_e_ii&doctype=Standard
-URIDate 2023-03-23
| Name: |
ifrs-full_DisposalsPropertyPlantAndEquipment |
| Namespace Prefix: |
ifrs-full_ |
| Data Type: |
xbrli:monetaryItemType |
| Balance Type: |
credit |
| Period Type: |
duration |
|
| X |
- DefinitionThe amount of impairment loss recognised in other comprehensive income for property, plant and equipment. [Refer: Impairment loss recognised in other comprehensive income; Property, plant and equipment] Reference 1: http://www.xbrl.org/2003/role/disclosureRef
-Name IAS
-Number 16
-IssueDate 2023-01-01
-Paragraph 73
-Subparagraph e
-Clause iv
-URI https://taxonomy.ifrs.org/xifrs-link?type=IAS&num=16&code=ifrs-tx-2023-en-r&anchor=para_73_e_iv&doctype=Standard
-URIDate 2023-03-23
| Name: |
ifrs-full_ImpairmentLossRecognisedInOtherComprehensiveIncomePropertyPlantAndEquipment |
| Namespace Prefix: |
ifrs-full_ |
| Data Type: |
xbrli:monetaryItemType |
| Balance Type: |
na |
| Period Type: |
duration |
|
| X |
- DefinitionThe amount of tangible assets that: (a) are held for use in the production or supply of goods or services, for rental to others, or for administrative purposes; and (b) are expected to be used during more than one period. Note that right-of-use assets are not included. [Contrast: Property, plant and equipment including right-of-use assets] Reference 1: http://www.xbrl.org/2003/role/disclosureRef
-Name IAS
-Number 16
-IssueDate 2023-01-01
-Paragraph 73
-Subparagraph e
-URI https://taxonomy.ifrs.org/xifrs-link?type=IAS&num=16&code=ifrs-tx-2023-en-r&anchor=para_73_e&doctype=Standard
-URIDate 2023-03-23
Reference 2: http://www.xbrl.org/2003/role/disclosureRef
-Name IAS
-Number 1
-IssueDate 2023-01-01
-Paragraph 54
-Subparagraph a
-URI https://taxonomy.ifrs.org/xifrs-link?type=IAS&num=1&code=ifrs-tx-2023-en-r&anchor=para_54_a&doctype=Standard
-URIDate 2023-03-23
| Name: |
ifrs-full_PropertyPlantAndEquipment |
| Namespace Prefix: |
ifrs-full_ |
| Data Type: |
xbrli:monetaryItemType |
| Balance Type: |
debit |
| Period Type: |
instant |
|
| X |
- Details
| Name: |
ifrs-full_ClassesOfPropertyPlantAndEquipmentAxis=ifrs-full_LeaseholdImprovementsMember |
| Namespace Prefix: |
|
| Data Type: |
na |
| Balance Type: |
|
| Period Type: |
|
|
| X |
- Details
| Name: |
ifrs-full_ClassesOfPropertyPlantAndEquipmentAxis=ifrs-full_MachineryMember |
| Namespace Prefix: |
|
| Data Type: |
na |
| Balance Type: |
|
| Period Type: |
|
|
| X |
- Details
| Name: |
ifrs-full_ClassesOfPropertyPlantAndEquipmentAxis=ifrs-full_OfficeEquipmentMember |
| Namespace Prefix: |
|
| Data Type: |
na |
| Balance Type: |
|
| Period Type: |
|
|
| X |
- Details
| Name: |
ifrs-full_ClassesOfPropertyPlantAndEquipmentAxis=ifrs-full_VehiclesMember |
| Namespace Prefix: |
|
| Data Type: |
na |
| Balance Type: |
|
| Period Type: |
|
|
| X |
- Details
| Name: |
ifrs-full_ClassesOfPropertyPlantAndEquipmentAxis=ifrs-full_ConstructionInProgressMember |
| Namespace Prefix: |
|
| Data Type: |
na |
| Balance Type: |
|
| Period Type: |
|
|
| X |
- Details
| Name: |
ifrs-full_ClassesOfPropertyPlantAndEquipmentAxis=gfai_GDMMachinesMember |
| Namespace Prefix: |
|
| Data Type: |
na |
| Balance Type: |
|
| Period Type: |
|
|
| X |
- Details
| Name: |
ifrs-full_ClassesOfPropertyPlantAndEquipmentAxis=gfai_RobotsMember |
| Namespace Prefix: |
|
| Data Type: |
na |
| Balance Type: |
|
| Period Type: |
|
|
v3.23.3
| X |
- References
+ Details
| Name: |
gfai_RightofUseAssetsandOperatingLeaseLiabilitiesDetailsLineItems |
| Namespace Prefix: |
gfai_ |
| Data Type: |
xbrli:stringItemType |
| Balance Type: |
na |
| Period Type: |
duration |
|
| X |
- DefinitionThe amount of depreciation of right-of-use assets. [Refer: Depreciation and amortisation expense; Right-of-use assets] Reference 1: http://www.xbrl.org/2003/role/disclosureRef
-Name IFRS
-Number 16
-IssueDate 2023-01-01
-Paragraph 53
-Subparagraph a
-URI https://taxonomy.ifrs.org/xifrs-link?type=IFRS&num=16&code=ifrs-tx-2023-en-r&anchor=para_53_a&doctype=Standard
-URIDate 2023-03-23
| Name: |
ifrs-full_DepreciationRightofuseAssets |
| Namespace Prefix: |
ifrs-full_ |
| Data Type: |
xbrli:monetaryItemType |
| Balance Type: |
na |
| Period Type: |
duration |
|
| X |
- DefinitionThe amount of expense arising from interest. Reference 1: http://www.xbrl.org/2003/role/disclosureRef
-Name IFRS
-Number 8
-IssueDate 2023-01-01
-Paragraph 28
-Subparagraph e
-URI https://taxonomy.ifrs.org/xifrs-link?type=IFRS&num=8&code=ifrs-tx-2023-en-r&anchor=para_28_e&doctype=Standard
-URIDate 2023-03-23
Reference 2: http://www.xbrl.org/2003/role/disclosureRef
-Name IFRS
-Number 12
-IssueDate 2023-01-01
-Paragraph B13
-Subparagraph f
-URI https://taxonomy.ifrs.org/xifrs-link?type=IFRS&num=12&code=ifrs-tx-2023-en-r&anchor=para_B13_f&doctype=Appendix&subtype=B
-URIDate 2023-03-23
Reference 3: http://www.xbrl.org/2003/role/disclosureRef
-Name IFRS
-Number 8
-IssueDate 2023-01-01
-Paragraph 23
-Subparagraph d
-URI https://taxonomy.ifrs.org/xifrs-link?type=IFRS&num=8&code=ifrs-tx-2023-en-r&anchor=para_23_d&doctype=Standard
-URIDate 2023-03-23
| Name: |
ifrs-full_InterestExpense |
| Namespace Prefix: |
ifrs-full_ |
| Data Type: |
xbrli:monetaryItemType |
| Balance Type: |
debit |
| Period Type: |
duration |
|
| X |
- DefinitionThe weighted average lessee's incremental borrowing rate applied to lease liabilities recognised in the statement of financial position at the date of initial application of IFRS 16. The incremental borrowing rate is the rate of interest that a lessee would have to pay to borrow over a similar term, and with a similar security, the funds necessary to obtain an asset of a similar value to the right-of-use asset in a similar economic environment. Reference 1: http://www.xbrl.org/2003/role/disclosureRef
-Name IFRS
-Number 16
-IssueDate 2023-01-01
-Paragraph C12
-Subparagraph a
-URI https://taxonomy.ifrs.org/xifrs-link?type=IFRS&num=16&code=ifrs-tx-2023-en-r&anchor=para_C12_a&doctype=Appendix&subtype=C
-URIDate 2023-03-23
| Name: |
ifrs-full_WeightedAverageLesseesIncrementalBorrowingRateAppliedToLeaseLiabilitiesRecognisedAtDateOfInitialApplicationOfIFRS16 |
| Namespace Prefix: |
ifrs-full_ |
| Data Type: |
dtr-types:percentItemType |
| Balance Type: |
na |
| Period Type: |
instant |
|
| X |
- Details
| Name: |
ifrs-full_RangeAxis=ifrs-full_BottomOfRangeMember |
| Namespace Prefix: |
|
| Data Type: |
na |
| Balance Type: |
|
| Period Type: |
|
|
| X |
- Details
| Name: |
ifrs-full_RangeAxis=ifrs-full_TopOfRangeMember |
| Namespace Prefix: |
|
| Data Type: |
na |
| Balance Type: |
|
| Period Type: |
|
|
v3.23.3
Right-of-Use Assets and Operating Lease Liabilities (Details) - Schedule of Carrying Amounts of Right-of-Use Assets - USD ($)
|
6 Months Ended |
Jun. 30, 2023 |
Jun. 30, 2022 |
| Schedule of Carrying Amounts of Right of Use Assets [Abstract] |
|
|
| Balance at January 1, |
$ 4,171,409
|
$ 2,364,993
|
| New leases |
271,004
|
804,500
|
| New leases acquired through business combinations |
|
167,597
|
| Depreciation expense |
(1,042,981)
|
(1,095,227)
|
| Exchange difference |
(75,562)
|
(108,566)
|
| Balance at June 30, |
$ 3,323,870
|
$ 2,133,297
|
| X |
- DefinitionCarrying amount of right of use assets.
| Name: |
gfai_CarryingAmountRightOfUseAssets |
| Namespace Prefix: |
gfai_ |
| Data Type: |
xbrli:monetaryItemType |
| Balance Type: |
debit |
| Period Type: |
instant |
|
| X |
- DefinitionAmount of depreciation expense.
| Name: |
gfai_Depreciationexpenses |
| Namespace Prefix: |
gfai_ |
| Data Type: |
xbrli:monetaryItemType |
| Balance Type: |
debit |
| Period Type: |
duration |
|
| X |
- References
+ Details
| Name: |
gfai_NewLeases |
| Namespace Prefix: |
gfai_ |
| Data Type: |
xbrli:monetaryItemType |
| Balance Type: |
debit |
| Period Type: |
duration |
|
| X |
- References
+ Details
| Name: |
gfai_ScheduleOfCarryingAmountsOfRightOfUseAssetsAbstract |
| Namespace Prefix: |
gfai_ |
| Data Type: |
xbrli:stringItemType |
| Balance Type: |
na |
| Period Type: |
duration |
|
| X |
- DefinitionThe increase in property, plant and equipment resulting from acquisitions through business combinations. [Refer: Business combinations [member]; Property, plant and equipment] Reference 1: http://www.xbrl.org/2003/role/disclosureRef
-Name IAS
-Number 16
-IssueDate 2023-01-01
-Paragraph 73
-Subparagraph e
-Clause iii
-URI https://taxonomy.ifrs.org/xifrs-link?type=IAS&num=16&code=ifrs-tx-2023-en-r&anchor=para_73_e_iii&doctype=Standard
-URIDate 2023-03-23
| Name: |
ifrs-full_AcquisitionsThroughBusinessCombinationsPropertyPlantAndEquipment |
| Namespace Prefix: |
ifrs-full_ |
| Data Type: |
xbrli:monetaryItemType |
| Balance Type: |
debit |
| Period Type: |
duration |
|
v3.23.3
| X |
- DefinitionThe amount of amortisation of intangible assets other than goodwill. [Refer: Depreciation and amortisation expense; Intangible assets other than goodwill] Reference 1: http://www.xbrl.org/2003/role/disclosureRef
-Name IAS
-Number 38
-IssueDate 2023-01-01
-Paragraph 118
-Subparagraph e
-Clause vi
-URI https://taxonomy.ifrs.org/xifrs-link?type=IAS&num=38&code=ifrs-tx-2023-en-r&anchor=para_118_e_vi&doctype=Standard
-URIDate 2023-03-23
| Name: |
ifrs-full_AmortisationIntangibleAssetsOtherThanGoodwill |
| Namespace Prefix: |
ifrs-full_ |
| Data Type: |
xbrli:monetaryItemType |
| Balance Type: |
na |
| Period Type: |
duration |
|
| X |
- References
+ Details
| Name: |
ifrs-full_IntangibleAssetsAndGoodwillAbstract |
| Namespace Prefix: |
ifrs-full_ |
| Data Type: |
xbrli:stringItemType |
| Balance Type: |
na |
| Period Type: |
duration |
|
v3.23.3
Intangible Assets (Details) - Schedule of Intangible Assets - USD ($)
|
6 Months Ended |
Jun. 30, 2023 |
Jun. 30, 2022 |
| Cost |
|
|
| Balance at beginning |
$ 7,657,621
|
$ 907,304
|
| Acquisitions through business combinations |
|
3,471,614
|
| Additions |
1,792,841
|
3,082,880
|
| Exchange differences |
(433,045)
|
(53,480)
|
| Balance at ending |
9,017,417
|
7,408,318
|
| Transfer |
|
|
| Accumulated amortization |
|
|
| Balance at beginning |
1,864,478
|
742,988
|
| Acquisitions through business combinations |
|
285,433
|
| Amortization charged for the period |
535,568
|
172,568
|
| Exchange differences |
(337,096)
|
(41,944)
|
| Balance at ending |
2,062,950
|
1,159,045
|
| Net book value |
|
|
| Net book value |
6,954,467
|
6,249,273
|
| Computer software [member] |
|
|
| Cost |
|
|
| Balance at beginning |
887,745
|
907,304
|
| Acquisitions through business combinations |
|
|
| Additions |
|
1,761
|
| Exchange differences |
(17,419)
|
(49,955)
|
| Balance at ending |
870,326
|
859,110
|
| Transfer |
|
|
| Accumulated amortization |
|
|
| Balance at beginning |
767,168
|
742,988
|
| Acquisitions through business combinations |
|
|
| Amortization charged for the period |
26,139
|
25,290
|
| Exchange differences |
(15,908)
|
(41,944)
|
| Balance at ending |
777,399
|
726,334
|
| Net book value |
|
|
| Net book value |
92,927
|
132,776
|
| Right-of-use Platform [Member] |
|
|
| Cost |
|
|
| Balance at beginning |
673,029
|
|
| Acquisitions through business combinations |
|
733,311
|
| Additions |
|
|
| Exchange differences |
(31,974)
|
|
| Balance at ending |
641,055
|
733,311
|
| Transfer |
|
|
| Accumulated amortization |
|
|
| Balance at beginning |
50,477
|
|
| Acquisitions through business combinations |
|
|
| Amortization charged for the period |
33,582
|
17,951
|
| Exchange differences |
(3,927)
|
|
| Balance at ending |
80,132
|
17,951
|
| Net book value |
|
|
| Net book value |
560,923
|
715,360
|
| Customer base [Member] |
|
|
| Cost |
|
|
| Balance at beginning |
1,042,110
|
|
| Acquisitions through business combinations |
|
1,120,688
|
| Additions |
|
|
| Exchange differences |
(49,509)
|
|
| Balance at ending |
992,601
|
1,120,688
|
| Transfer |
|
|
| Accumulated amortization |
|
|
| Balance at beginning |
405,868
|
|
| Acquisitions through business combinations |
|
|
| Amortization charged for the period |
201,013
|
129,327
|
| Exchange differences |
(28,438)
|
|
| Balance at ending |
578,443
|
129,327
|
| Net book value |
|
|
| Net book value |
414,158
|
991,361
|
| Technical know-how [Member] |
|
|
| Cost |
|
|
| Balance at beginning |
499,344
|
|
| Acquisitions through business combinations |
|
514,968
|
| Additions |
|
|
| Exchange differences |
(23,723)
|
|
| Balance at ending |
475,621
|
514,968
|
| Transfer |
|
|
| Accumulated amortization |
|
|
| Balance at beginning |
28,405
|
|
| Acquisitions through business combinations |
|
|
| Amortization charged for the period |
28,346
|
|
| Exchange differences |
(2,641)
|
|
| Balance at ending |
54,110
|
|
| Net book value |
|
|
| Net book value |
421,511
|
514,968
|
| Security Surveillance system [Member] |
|
|
| Cost |
|
|
| Balance at beginning |
1,360,898
|
|
| Acquisitions through business combinations |
|
1,102,647
|
| Additions |
195,087
|
|
| Exchange differences |
(306,604)
|
|
| Balance at ending |
1,249,381
|
1,102,647
|
| Transfer |
|
|
| Accumulated amortization |
|
|
| Balance at beginning |
612,560
|
|
| Acquisitions through business combinations |
|
285,433
|
| Amortization charged for the period |
63,817
|
|
| Exchange differences |
(286,182)
|
|
| Balance at ending |
390,195
|
285,433
|
| Net book value |
|
|
| Net book value |
859,186
|
817,214
|
| Assets under construction Cash Management Systems [Member] |
|
|
| Cost |
|
|
| Balance at beginning |
194,495
|
|
| Acquisitions through business combinations |
|
|
| Additions |
|
81,119
|
| Exchange differences |
(3,816)
|
(3,525)
|
| Balance at ending |
190,679
|
77,594
|
| Transfer |
|
|
| Accumulated amortization |
|
|
| Balance at beginning |
|
|
| Acquisitions through business combinations |
|
|
| Amortization charged for the period |
|
|
| Exchange differences |
|
|
| Balance at ending |
|
|
| Net book value |
|
|
| Net book value |
190,679
|
77,594
|
| Assets under construction Intelligent Cloud Platform [Member] |
|
|
| Cost |
|
|
| Balance at beginning |
3,000,000
|
|
| Acquisitions through business combinations |
|
|
| Additions |
|
3,000,000
|
| Exchange differences |
|
|
| Balance at ending |
178,118
|
3,000,000
|
| Transfer |
(2,821,882)
|
|
| Accumulated amortization |
|
|
| Balance at beginning |
|
|
| Acquisitions through business combinations |
|
|
| Amortization charged for the period |
|
|
| Exchange differences |
|
|
| Balance at ending |
|
|
| Net book value |
|
|
| Net book value |
178,118
|
3,000,000
|
| Intelligent Cloud Platforms [Member] |
|
|
| Cost |
|
|
| Balance at beginning |
|
|
| Acquisitions through business combinations |
|
|
| Additions |
1,597,754
|
|
| Exchange differences |
|
|
| Balance at ending |
4,419,636
|
|
| Transfer |
2,821,882
|
|
| Accumulated amortization |
|
|
| Balance at beginning |
|
|
| Acquisitions through business combinations |
|
|
| Amortization charged for the period |
182,671
|
|
| Exchange differences |
|
|
| Balance at ending |
182,671
|
|
| Net book value |
|
|
| Net book value |
$ 4,236,965
|
|
| X |
- References
+ Details
| Name: |
gfai_AccumulatedAmortizationAbstract |
| Namespace Prefix: |
gfai_ |
| Data Type: |
xbrli:stringItemType |
| Balance Type: |
na |
| Period Type: |
duration |
|
| X |
- Definition
+ References
+ Details
| Name: |
gfai_AccumulatedAmortizationExchangeDifferences |
| Namespace Prefix: |
gfai_ |
| Data Type: |
xbrli:monetaryItemType |
| Balance Type: |
debit |
| Period Type: |
duration |
|
| X |
- DefinitionThe increase in property, plant and equipment resulting from acquisitions through business combinations.
| Name: |
gfai_AcquisitionsThroughBusinessCombinations |
| Namespace Prefix: |
gfai_ |
| Data Type: |
xbrli:monetaryItemType |
| Balance Type: |
debit |
| Period Type: |
duration |
|
| X |
- References
+ Details
| Name: |
gfai_CostAbstract0 |
| Namespace Prefix: |
gfai_ |
| Data Type: |
xbrli:stringItemType |
| Balance Type: |
na |
| Period Type: |
duration |
|
| X |
- DefinitionIntangible Assets Accumulated Amortization.
| Name: |
gfai_IntangibleAssetsAccumulatedAmortization |
| Namespace Prefix: |
gfai_ |
| Data Type: |
xbrli:monetaryItemType |
| Balance Type: |
debit |
| Period Type: |
instant |
|
| X |
- References
+ Details
| Name: |
gfai_NetBookValueAbstract0 |
| Namespace Prefix: |
gfai_ |
| Data Type: |
xbrli:stringItemType |
| Balance Type: |
na |
| Period Type: |
duration |
|
| X |
- DefinitionThe increase in intangible assets and goodwill resulting from acquisitions through business combinations. [Refer: Business combinations [member]; Intangible assets and goodwill] Reference 1: http://www.xbrl.org/2009/role/commonPracticeRef
-Name IAS
-Number 38
-IssueDate 2023-01-01
-Paragraph 118
-Subparagraph e
-Clause i
-URI https://taxonomy.ifrs.org/xifrs-link?type=IAS&num=38&code=ifrs-tx-2023-en-r&anchor=para_118_e_i&doctype=Standard
-URIDate 2023-03-23
| Name: |
ifrs-full_AcquisitionsThroughBusinessCombinationsIntangibleAssetsAndGoodwill |
| Namespace Prefix: |
ifrs-full_ |
| Data Type: |
xbrli:monetaryItemType |
| Balance Type: |
debit |
| Period Type: |
duration |
|
| X |
- DefinitionThe amount of additions to intangible assets other than goodwill, other than those acquired through business combinations. [Refer: Business combinations [member]; Intangible assets other than goodwill] Reference 1: http://www.xbrl.org/2003/role/disclosureRef
-Name IAS
-Number 38
-IssueDate 2023-01-01
-Paragraph 118
-Subparagraph e
-Clause i
-URI https://taxonomy.ifrs.org/xifrs-link?type=IAS&num=38&code=ifrs-tx-2023-en-r&anchor=para_118_e_i&doctype=Standard
-URIDate 2023-03-23
| Name: |
ifrs-full_AdditionsOtherThanThroughBusinessCombinationsIntangibleAssetsOtherThanGoodwill |
| Namespace Prefix: |
ifrs-full_ |
| Data Type: |
xbrli:monetaryItemType |
| Balance Type: |
debit |
| Period Type: |
duration |
|
| X |
- DefinitionThe amount of amortisation of intangible assets other than goodwill. [Refer: Depreciation and amortisation expense; Intangible assets other than goodwill] Reference 1: http://www.xbrl.org/2003/role/disclosureRef
-Name IAS
-Number 38
-IssueDate 2023-01-01
-Paragraph 118
-Subparagraph e
-Clause vi
-URI https://taxonomy.ifrs.org/xifrs-link?type=IAS&num=38&code=ifrs-tx-2023-en-r&anchor=para_118_e_vi&doctype=Standard
-URIDate 2023-03-23
| Name: |
ifrs-full_AmortisationIntangibleAssetsOtherThanGoodwill |
| Namespace Prefix: |
ifrs-full_ |
| Data Type: |
xbrli:monetaryItemType |
| Balance Type: |
na |
| Period Type: |
duration |
|
| X |
- DefinitionThe increase (decrease) in intangible assets other than goodwill resulting from net exchange differences arising on the translation of the financial statements from the functional currency into a different presentation currency, including the translation of a foreign operation into the presentation currency of the reporting entity. [Refer: Intangible assets other than goodwill] Reference 1: http://www.xbrl.org/2003/role/disclosureRef
-Name IAS
-Number 38
-IssueDate 2023-01-01
-Paragraph 118
-Subparagraph e
-Clause vii
-URI https://taxonomy.ifrs.org/xifrs-link?type=IAS&num=38&code=ifrs-tx-2023-en-r&anchor=para_118_e_vii&doctype=Standard
-URIDate 2023-03-23
| Name: |
ifrs-full_IncreaseDecreaseThroughNetExchangeDifferencesIntangibleAssetsOtherThanGoodwill |
| Namespace Prefix: |
ifrs-full_ |
| Data Type: |
xbrli:monetaryItemType |
| Balance Type: |
debit |
| Period Type: |
duration |
|
| X |
- DefinitionThe increase (decrease) in intangible assets other than goodwill resulting from transfers. [Refer: Intangible assets other than goodwill] Reference 1: http://www.xbrl.org/2009/role/commonPracticeRef
-Name IAS
-Number 38
-IssueDate 2023-01-01
-Paragraph 118
-Subparagraph e
-URI https://taxonomy.ifrs.org/xifrs-link?type=IAS&num=38&code=ifrs-tx-2023-en-r&anchor=para_118_e&doctype=Standard
-URIDate 2023-03-23
| Name: |
ifrs-full_IncreaseDecreaseThroughTransfersIntangibleAssetsOtherThanGoodwill |
| Namespace Prefix: |
ifrs-full_ |
| Data Type: |
xbrli:monetaryItemType |
| Balance Type: |
debit |
| Period Type: |
duration |
|
| X |
- Details
| Name: |
ifrs-full_ClassesOfIntangibleAssetsOtherThanGoodwillAxis=ifrs-full_ComputerSoftwareMember |
| Namespace Prefix: |
|
| Data Type: |
na |
| Balance Type: |
|
| Period Type: |
|
|
| X |
- Details
| Name: |
ifrs-full_ClassesOfIntangibleAssetsOtherThanGoodwillAxis=gfai_CustomerBaseMember |
| Namespace Prefix: |
|
| Data Type: |
na |
| Balance Type: |
|
| Period Type: |
|
|
| X |
- Details
| Name: |
ifrs-full_ClassesOfIntangibleAssetsOtherThanGoodwillAxis=gfai_TechnicalKnowhowMember |
| Namespace Prefix: |
|
| Data Type: |
na |
| Balance Type: |
|
| Period Type: |
|
|
| X |
- Details
| Name: |
ifrs-full_ClassesOfIntangibleAssetsOtherThanGoodwillAxis=gfai_SecuritySurveillanceSystemMember |
| Namespace Prefix: |
|
| Data Type: |
na |
| Balance Type: |
|
| Period Type: |
|
|
| X |
- Details
| Name: |
ifrs-full_ClassesOfIntangibleAssetsOtherThanGoodwillAxis=gfai_AssetsUnderConstructionCashManagementSystemsMember |
| Namespace Prefix: |
|
| Data Type: |
na |
| Balance Type: |
|
| Period Type: |
|
|
v3.23.3
| X |
- DefinitionAmount of provision for penalty claims.
| Name: |
gfai_ProvisionForPenaltyClaims |
| Namespace Prefix: |
gfai_ |
| Data Type: |
xbrli:monetaryItemType |
| Balance Type: |
credit |
| Period Type: |
instant |
|
| X |
- References
+ Details
| Name: |
gfai_TradeAndOtherPayablesAndOtherCurrentLiabilitiesAbstract |
| Namespace Prefix: |
gfai_ |
| Data Type: |
xbrli:stringItemType |
| Balance Type: |
na |
| Period Type: |
duration |
|
v3.23.3
Trade and Other payables and Other Current Liabilities (Details) - Schedule of Trade and Other Payables and Other Current Liabilities - USD ($)
|
Jun. 30, 2023 |
Dec. 31, 2022 |
| Schedule of Trade and Other Payables and Other Current Liabilities [Abstract] |
|
|
|
| Trade payables – third parties |
|
$ 2,596,576
|
$ 2,060,856
|
| Accrued salaries and bonus |
|
454,218
|
515,758
|
| Accrued customer claims, cash loss and shortage |
[1] |
15,044
|
57,381
|
| Trade and other payables |
|
3,065,838
|
2,633,995
|
| Output VAT |
|
74,171
|
118,125
|
| Accrued expenses |
|
389,318
|
522,059
|
| Payroll payable |
|
1,776,907
|
979,027
|
| Other payables |
|
168,052
|
289,494
|
| Deferred revenue |
|
428,839
|
568,664
|
| Other current liabilities |
|
$ 2,837,287
|
$ 2,477,369
|
|
|
| X |
- DefinitionAccrued customer claims, cash loss and shortage.
| Name: |
gfai_AccruedCustomerClaimsCashLossAndShortage |
| Namespace Prefix: |
gfai_ |
| Data Type: |
xbrli:monetaryItemType |
| Balance Type: |
credit |
| Period Type: |
instant |
|
| X |
- DefinitionAccrued salaries and bonus.
| Name: |
gfai_AccruedSalariesAndBonus |
| Namespace Prefix: |
gfai_ |
| Data Type: |
xbrli:monetaryItemType |
| Balance Type: |
credit |
| Period Type: |
instant |
|
| X |
- DefinitionAmount of payroll payable.
| Name: |
gfai_PayrollPayable |
| Namespace Prefix: |
gfai_ |
| Data Type: |
xbrli:monetaryItemType |
| Balance Type: |
credit |
| Period Type: |
instant |
|
| X |
- References
+ Details
| Name: |
gfai_ScheduleOfTradeAndOtherPayablesAndOtherCurrentLiabilitiesAbstract |
| Namespace Prefix: |
gfai_ |
| Data Type: |
xbrli:stringItemType |
| Balance Type: |
na |
| Period Type: |
duration |
|
| X |
- DefinitionThe amount of trade payables and other payables. [Refer: Trade payables; Other payables]
| Name: |
gfai_TradeAndOtherPayable |
| Namespace Prefix: |
gfai_ |
| Data Type: |
xbrli:monetaryItemType |
| Balance Type: |
credit |
| Period Type: |
instant |
|
| X |
- DefinitionThe amount of liabilities to pay for goods or services that have been received or supplied but have not been paid, invoiced or formally agreed with the supplier, including amounts due to employees. Reference 1: http://www.xbrl.org/2009/role/commonPracticeRef
-Name IAS
-Number 1
-IssueDate 2023-01-01
-Paragraph 78
-URI https://taxonomy.ifrs.org/xifrs-link?type=IAS&num=1&code=ifrs-tx-2023-en-r&anchor=para_78&doctype=Standard
-URIDate 2023-03-23
| Name: |
ifrs-full_Accruals |
| Namespace Prefix: |
ifrs-full_ |
| Data Type: |
xbrli:monetaryItemType |
| Balance Type: |
credit |
| Period Type: |
instant |
|
| X |
- DefinitionThe amount of current liabilities that the entity does not separately disclose in the same statement or note. [Refer: Current liabilities] Reference 1: http://www.xbrl.org/2009/role/commonPracticeRef
-Name IAS
-Number 1
-IssueDate 2023-01-01
-Paragraph 55
-URI https://taxonomy.ifrs.org/xifrs-link?type=IAS&num=1&code=ifrs-tx-2023-en-r&anchor=para_55&doctype=Standard
-URIDate 2023-03-23
| Name: |
ifrs-full_OtherCurrentLiabilities |
| Namespace Prefix: |
ifrs-full_ |
| Data Type: |
xbrli:monetaryItemType |
| Balance Type: |
credit |
| Period Type: |
instant |
|
| X |
- DefinitionThe amount of trade payables and other payables. [Refer: Trade payables; Other payables] Reference 1: http://www.xbrl.org/2003/role/disclosureRef
-Name IAS
-Number 1
-IssueDate 2023-01-01
-Paragraph 54
-Subparagraph k
-URI https://taxonomy.ifrs.org/xifrs-link?type=IAS&num=1&code=ifrs-tx-2023-en-r&anchor=para_54_k&doctype=Standard
-URIDate 2023-03-23
| Name: |
ifrs-full_TradeAndOtherPayables |
| Namespace Prefix: |
ifrs-full_ |
| Data Type: |
xbrli:monetaryItemType |
| Balance Type: |
credit |
| Period Type: |
instant |
|
| X |
- DefinitionThe amount of payment due to suppliers for goods and services used in the entity's business. Reference 1: http://www.xbrl.org/2009/role/commonPracticeRef
-Name IAS
-Number 1
-IssueDate 2023-01-01
-Paragraph 78
-URI https://taxonomy.ifrs.org/xifrs-link?type=IAS&num=1&code=ifrs-tx-2023-en-r&anchor=para_78&doctype=Standard
-URIDate 2023-03-23
| Name: |
ifrs-full_TradeAndOtherPayablesToTradeSuppliers |
| Namespace Prefix: |
ifrs-full_ |
| Data Type: |
xbrli:monetaryItemType |
| Balance Type: |
credit |
| Period Type: |
instant |
|
| X |
- DefinitionThe amount of payables related to a value added tax. Reference 1: http://www.xbrl.org/2009/role/commonPracticeRef
-Name IAS
-Number 1
-IssueDate 2023-01-01
-Paragraph 78
-URI https://taxonomy.ifrs.org/xifrs-link?type=IAS&num=1&code=ifrs-tx-2023-en-r&anchor=para_78&doctype=Standard
-URIDate 2023-03-23
| Name: |
ifrs-full_ValueAddedTaxPayables |
| Namespace Prefix: |
ifrs-full_ |
| Data Type: |
xbrli:monetaryItemType |
| Balance Type: |
credit |
| Period Type: |
instant |
|
v3.23.3
Borrowings (Details)
$ / shares in Units, ฿ in Millions |
|
|
6 Months Ended |
|
|
Sep. 28, 2023
USD ($)
$ / shares
|
Apr. 25, 2018
USD ($)
|
Jun. 30, 2023
USD ($)
|
Jun. 30, 2022
USD ($)
|
Jun. 30, 2023
THB (฿)
|
| Borrowings (Details) [Line Items] |
|
|
|
|
|
| Borrowings mature |
|
|
Jul. 29, 2023
|
|
Jul. 29, 2023
|
| Borrowings mature |
|
|
Apr. 07, 2025
|
|
|
| Interest expense |
|
|
$ 411,270
|
$ 400,920
|
|
| Unused bank overdraft |
|
|
$ 283,000
|
|
฿ 10
|
| Loan principal amount |
|
$ 13,420,000
|
|
|
|
| Percentage of interest |
|
|
4.00%
|
|
4.00%
|
| Borrowings description |
|
|
In accordance with the terms of the Agreements, the Company is required
to pay the full principal amount of the Loan, along with accrued interest, on December 31, 2024 and the Company is not required to make
monthly payments on this obligation.
|
|
|
| Loan aggregate amount |
$ 15,914,615
|
|
|
|
|
| Conversion price (in Dollars per share) | $ / shares |
$ 5.4
|
|
|
|
|
| TH [Member] |
|
|
|
|
|
| Borrowings (Details) [Line Items] |
|
|
|
|
|
| Interest expense |
|
|
$ 33,394
|
$ 33,745
|
|
| Maximum [Member] |
|
|
|
|
|
| Borrowings (Details) [Line Items] |
|
|
|
|
|
| Percentage of carry interest rates |
|
|
4.72%
|
|
4.72%
|
| Minimum [Member] |
|
|
|
|
|
| Borrowings (Details) [Line Items] |
|
|
|
|
|
| Percentage of carry interest rates |
|
|
4.69%
|
|
4.69%
|
| X |
- References
+ Details
| Name: |
gfai_BorrowingsDescription |
| Namespace Prefix: |
gfai_ |
| Data Type: |
xbrli:stringItemType |
| Balance Type: |
na |
| Period Type: |
duration |
|
| X |
- References
+ Details
| Name: |
gfai_BorrowingsDetailsLineItems |
| Namespace Prefix: |
gfai_ |
| Data Type: |
xbrli:stringItemType |
| Balance Type: |
na |
| Period Type: |
duration |
|
| X |
- DefinitionConversion price per share
| Name: |
gfai_ConversionPricePerShares |
| Namespace Prefix: |
gfai_ |
| Data Type: |
dtr:perShareItemType |
| Balance Type: |
na |
| Period Type: |
duration |
|
| X |
- DefinitionDebts instrument maturity date.
| Name: |
gfai_DebtsInstrumentMaturityDate |
| Namespace Prefix: |
gfai_ |
| Data Type: |
xbrli:dateItemType |
| Balance Type: |
na |
| Period Type: |
duration |
|
| X |
- DefinitionThe amount of loan in the principal amount.
| Name: |
gfai_LoanPrincipalAmount |
| Namespace Prefix: |
gfai_ |
| Data Type: |
xbrli:monetaryItemType |
| Balance Type: |
credit |
| Period Type: |
duration |
|
| X |
- References
+ Details
| Name: |
gfai_UnusedBankOverdraft |
| Namespace Prefix: |
gfai_ |
| Data Type: |
xbrli:monetaryItemType |
| Balance Type: |
credit |
| Period Type: |
instant |
|
| X |
- DefinitionThe adjustment to the basis (reference rate) used for calculation of the interest rate on borrowings. [Refer: Borrowings] Reference 1: http://www.xbrl.org/2009/role/commonPracticeRef
-Name IFRS
-Number 7
-IssueDate 2023-01-01
-Paragraph 7
-URI https://taxonomy.ifrs.org/xifrs-link?type=IFRS&num=7&code=ifrs-tx-2023-en-r&anchor=para_7&doctype=Standard
-URIDate 2023-03-23
| Name: |
ifrs-full_BorrowingsAdjustmentToInterestRateBasis |
| Namespace Prefix: |
ifrs-full_ |
| Data Type: |
dtr-types:percentItemType |
| Balance Type: |
na |
| Period Type: |
instant |
|
| X |
- DefinitionThe interest rate on borrowings. [Refer: Borrowings] Reference 1: http://www.xbrl.org/2009/role/commonPracticeRef
-Name IFRS
-Number 7
-IssueDate 2023-01-01
-Paragraph 7
-URI https://taxonomy.ifrs.org/xifrs-link?type=IFRS&num=7&code=ifrs-tx-2023-en-r&anchor=para_7&doctype=Standard
-URIDate 2023-03-23
| Name: |
ifrs-full_BorrowingsInterestRate |
| Namespace Prefix: |
ifrs-full_ |
| Data Type: |
dtr-types:percentItemType |
| Balance Type: |
na |
| Period Type: |
instant |
|
| X |
- DefinitionThe amount of interest expense on borrowings. [Refer: Interest expense; Borrowings] Reference 1: http://www.xbrl.org/2009/role/commonPracticeRef
-Name IAS
-Number 1
-IssueDate 2023-01-01
-Paragraph 112
-Subparagraph c
-URI https://taxonomy.ifrs.org/xifrs-link?type=IAS&num=1&code=ifrs-tx-2023-en-r&anchor=para_112_c&doctype=Standard
-URIDate 2023-03-23
| Name: |
ifrs-full_InterestExpenseOnBorrowings |
| Namespace Prefix: |
ifrs-full_ |
| Data Type: |
xbrli:monetaryItemType |
| Balance Type: |
debit |
| Period Type: |
duration |
|
| X |
- DefinitionThe amount of borrowings that the entity does not separately disclose in the same statement or note. [Refer: Borrowings] Reference 1: http://www.xbrl.org/2009/role/commonPracticeRef
-Name IAS
-Number 1
-IssueDate 2023-01-01
-Paragraph 112
-Subparagraph c
-URI https://taxonomy.ifrs.org/xifrs-link?type=IAS&num=1&code=ifrs-tx-2023-en-r&anchor=para_112_c&doctype=Standard
-URIDate 2023-03-23
| Name: |
ifrs-full_OtherBorrowings |
| Namespace Prefix: |
ifrs-full_ |
| Data Type: |
xbrli:monetaryItemType |
| Balance Type: |
credit |
| Period Type: |
instant |
|
| X |
- DefinitionMaturity date of long-term debt, in YYYY-MM-DD format. Reference 1: http://www.xbrl.org/2009/role/commonPracticeRef
-Topic 820
-SubTopic 10
-Name Accounting Standards Codification
-Section 50
-Paragraph 2
-Subparagraph (bbb)(2)
-Publisher FASB
-URI https://asc.fasb.org//1943274/2147482106/820-10-50-2
| Name: |
us-gaap_LongTermDebtMaturityDate |
| Namespace Prefix: |
us-gaap_ |
| Data Type: |
xbrli:dateItemType |
| Balance Type: |
na |
| Period Type: |
instant |
|
| X |
- Details
| Name: |
ifrs-full_GeographicalAreasAxis=gfai_THMember |
| Namespace Prefix: |
|
| Data Type: |
na |
| Balance Type: |
|
| Period Type: |
|
|
| X |
- Details
| Name: |
srt_RangeAxis=srt_MaximumMember |
| Namespace Prefix: |
|
| Data Type: |
na |
| Balance Type: |
|
| Period Type: |
|
|
| X |
- Details
| Name: |
srt_RangeAxis=srt_MinimumMember |
| Namespace Prefix: |
|
| Data Type: |
na |
| Balance Type: |
|
| Period Type: |
|
|
v3.23.3
Borrowings (Details) - Schedule of Borrowings - USD ($)
|
Jun. 30, 2023 |
Dec. 31, 2022 |
| Schedule of Borrowings [Abstract] |
|
|
| Current portion of long-term bank borrowings |
$ 1,039,988
|
$ 947,559
|
| Current portion of long-term third-party borrowing |
2,469,721
|
2,234,057
|
| Long-term bank borrowings |
138,212
|
432,179
|
| Long-term third-party borrowing |
13,589,362
|
13,467,639
|
| Total borrowings |
$ 17,237,283
|
$ 17,081,434
|
| X |
- References
+ Details
| Name: |
gfai_CurrentPortionOfLongtermBankBorrowings |
| Namespace Prefix: |
gfai_ |
| Data Type: |
xbrli:monetaryItemType |
| Balance Type: |
credit |
| Period Type: |
instant |
|
| X |
- References
+ Details
| Name: |
gfai_CurrentPortionOfLongtermThirdPartyBorrowing |
| Namespace Prefix: |
gfai_ |
| Data Type: |
xbrli:monetaryItemType |
| Balance Type: |
credit |
| Period Type: |
instant |
|
| X |
- References
+ Details
| Name: |
gfai_LongtermBankBorrowings |
| Namespace Prefix: |
gfai_ |
| Data Type: |
xbrli:monetaryItemType |
| Balance Type: |
credit |
| Period Type: |
instant |
|
| X |
- DefinitionAmount of long term third party borrowing.
| Name: |
gfai_LongtermThirdPartyBorrowing |
| Namespace Prefix: |
gfai_ |
| Data Type: |
xbrli:monetaryItemType |
| Balance Type: |
credit |
| Period Type: |
instant |
|
| X |
- References
+ Details
| Name: |
gfai_ScheduleOfBorrowingsAbstract |
| Namespace Prefix: |
gfai_ |
| Data Type: |
xbrli:stringItemType |
| Balance Type: |
na |
| Period Type: |
duration |
|
| X |
- DefinitionThe amount of outstanding funds that the entity is obligated to repay. Reference 1: http://www.xbrl.org/2009/role/commonPracticeRef
-Name IAS
-Number 1
-IssueDate 2023-01-01
-Paragraph 55
-URI https://taxonomy.ifrs.org/xifrs-link?type=IAS&num=1&code=ifrs-tx-2023-en-r&anchor=para_55&doctype=Standard
-URIDate 2023-03-23
| Name: |
ifrs-full_Borrowings |
| Namespace Prefix: |
ifrs-full_ |
| Data Type: |
xbrli:monetaryItemType |
| Balance Type: |
credit |
| Period Type: |
instant |
|
v3.23.3
Convertible Note Payable (Details) - USD ($)
|
1 Months Ended |
6 Months Ended |
|
Apr. 19, 2023 |
Apr. 17, 2023 |
Jun. 30, 2023 |
Oct. 25, 2022 |
| Convertible Note Payable [Abstract] |
|
|
|
|
| Principal amount |
|
|
|
$ 1,707,500
|
| Interest rate |
|
|
8%
|
|
| Investor, description |
|
|
Subject to the occurrence of any triggering
events as defined in the Note, the Investor shall have the right to increase the balance of the Note by 5% or 10%.
|
|
| Investor percentage |
|
|
120.00%
|
|
| Convert amount |
|
$ 1,238,400
|
|
|
| Conversion price per share (in Dollars per share) |
|
$ 7.2
|
|
|
| Restricted ordinary shares issued (in Shares) |
172,000
|
|
|
|
| Outstanding amount |
|
$ 534,744
|
|
|
| Interest expense |
|
|
$ 65,644
|
|
| X |
- DefinitionConversion price per share.
| Name: |
gfai_ConversionPricePerShare |
| Namespace Prefix: |
gfai_ |
| Data Type: |
dtr:perShareItemType |
| Balance Type: |
na |
| Period Type: |
duration |
|
| X |
- References
+ Details
| Name: |
gfai_ConvertibleNotePayableAbstract |
| Namespace Prefix: |
gfai_ |
| Data Type: |
xbrli:stringItemType |
| Balance Type: |
na |
| Period Type: |
duration |
|
| X |
- DefinitionInterest expense on conversion of stock.
| Name: |
gfai_InterestExpenseOnConversionOfStock |
| Namespace Prefix: |
gfai_ |
| Data Type: |
xbrli:monetaryItemType |
| Balance Type: |
debit |
| Period Type: |
duration |
|
| X |
- DefinitionThe percentage of investor.
| Name: |
gfai_InvestorPercentage |
| Namespace Prefix: |
gfai_ |
| Data Type: |
dtr:percentItemType |
| Balance Type: |
na |
| Period Type: |
duration |
|
| X |
- DefinitionRestricted shares are unregistered, non-transferable shares issued to a company's employees. They give employees incentive to help companies attain success. They are most common in established companies that want to motivate people with an equity stake.
| Name: |
gfai_IssuedRestrictedOrdinaryShares |
| Namespace Prefix: |
gfai_ |
| Data Type: |
xbrli:sharesItemType |
| Balance Type: |
na |
| Period Type: |
duration |
|
| X |
- DefinitionOutstanding amount of convertible share.
| Name: |
gfai_OutstandingAmountOfConvertibleShare |
| Namespace Prefix: |
gfai_ |
| Data Type: |
xbrli:monetaryItemType |
| Balance Type: |
debit |
| Period Type: |
duration |
|
| X |
- DefinitionThe basis (reference rate) used for calculation of the interest rate on borrowings. [Refer: Borrowings] Reference 1: http://www.xbrl.org/2009/role/commonPracticeRef
-Name IFRS
-Number 7
-IssueDate 2023-01-01
-Paragraph 7
-URI https://taxonomy.ifrs.org/xifrs-link?type=IFRS&num=7&code=ifrs-tx-2023-en-r&anchor=para_7&doctype=Standard
-URIDate 2023-03-23
| Name: |
ifrs-full_BorrowingsInterestRateBasis |
| Namespace Prefix: |
ifrs-full_ |
| Data Type: |
xbrli:stringItemType |
| Balance Type: |
na |
| Period Type: |
duration |
|
| X |
- DefinitionThe description of significant judgements and assumptions made in determining that the entity has significant influence over another entity even though it holds less than 20 per cent of the voting rights of another entity. Reference 1: http://www.xbrl.org/2003/role/exampleRef
-Name IFRS
-Number 12
-IssueDate 2023-01-01
-Paragraph 9
-Subparagraph e
-URI https://taxonomy.ifrs.org/xifrs-link?type=IFRS&num=12&code=ifrs-tx-2023-en-r&anchor=para_9_e&doctype=Standard
-URIDate 2023-03-23
| Name: |
ifrs-full_DescriptionOfReasonsWhyPresumptionThatInterestOfLessThanTwentyPerCentInAssociateIsOvercome |
| Namespace Prefix: |
ifrs-full_ |
| Data Type: |
xbrli:stringItemType |
| Balance Type: |
na |
| Period Type: |
duration |
|
| X |
- DefinitionThe nominal or principal amount of a financial instrument on discontinuation of its measurement at fair value through profit or loss, because a credit derivative is used to manage the credit risk of that financial instrument. [Refer: Credit risk [member]; Derivatives [member]; Financial instruments, class [member]] Reference 1: http://www.xbrl.org/2003/role/disclosureRef
-Name IFRS
-Number 7
-IssueDate 2023-01-01
-Paragraph 24G
-Subparagraph c
-URI https://taxonomy.ifrs.org/xifrs-link?type=IFRS&num=7&code=ifrs-tx-2023-en-r&anchor=para_24G_c&doctype=Standard
-URIDate 2023-03-23
| Name: |
ifrs-full_NominalOrPrincipalAmountOfFinancialInstrumentOnDiscontinuationOfMeasurementAtFairValueThroughProfitOrLossBecauseCreditDerivativeIsUsedToManageCreditRisk |
| Namespace Prefix: |
ifrs-full_ |
| Data Type: |
xbrli:monetaryItemType |
| Balance Type: |
na |
| Period Type: |
instant |
|
v3.23.3
| X |
- DefinitionThe amount of interest expense on lease liabilities. [Refer: Lease liabilities] Reference 1: http://www.xbrl.org/2003/role/disclosureRef
-Name IFRS
-Number 16
-IssueDate 2023-01-01
-Paragraph 53
-Subparagraph b
-URI https://taxonomy.ifrs.org/xifrs-link?type=IFRS&num=16&code=ifrs-tx-2023-en-r&anchor=para_53_b&doctype=Standard
-URIDate 2023-03-23
| Name: |
ifrs-full_InterestExpenseOnLeaseLiabilities |
| Namespace Prefix: |
ifrs-full_ |
| Data Type: |
xbrli:monetaryItemType |
| Balance Type: |
debit |
| Period Type: |
duration |
|
| X |
- References
+ Details
| Name: |
ifrs-full_LeaseLiabilitiesAbstract |
| Namespace Prefix: |
ifrs-full_ |
| Data Type: |
xbrli:stringItemType |
| Balance Type: |
na |
| Period Type: |
duration |
|
v3.23.3
| X |
- References
+ Details
| Name: |
gfai_CurrentFinanceLeaseLiabilities |
| Namespace Prefix: |
gfai_ |
| Data Type: |
xbrli:monetaryItemType |
| Balance Type: |
credit |
| Period Type: |
instant |
|
| X |
- References
+ Details
| Name: |
gfai_FinanceLeaseLiabilities1 |
| Namespace Prefix: |
gfai_ |
| Data Type: |
xbrli:monetaryItemType |
| Balance Type: |
credit |
| Period Type: |
instant |
|
| X |
- DefinitionFinance lease liabilities, net.
| Name: |
gfai_NoncurrentFinanceLeaseLiabilities |
| Namespace Prefix: |
gfai_ |
| Data Type: |
xbrli:monetaryItemType |
| Balance Type: |
credit |
| Period Type: |
instant |
|
| X |
- References
+ Details
| Name: |
gfai_ScheduleOfFinanceLeaseLiabilitiesAbstract |
| Namespace Prefix: |
gfai_ |
| Data Type: |
xbrli:stringItemType |
| Balance Type: |
na |
| Period Type: |
duration |
|
v3.23.3
Finance Lease Liabilities (Details) - Schedule of Minimum Lease Payments Under Finance Lease Agreements - USD ($)
|
Jun. 30, 2023 |
Dec. 31, 2022 |
| Schedule of Minimum Lease Payments Under Finance Lease Agreements [Abstract] |
|
|
| Within 1 year |
$ 212,173
|
$ 423,514
|
| After 1 year but within 5 years |
248,490
|
253,448
|
| Less: Finance charges |
(30,533)
|
(45,276)
|
| Present value of finance lease liabilities, net |
$ 430,130
|
$ 631,686
|
| X |
- DefinitionFinance lease liability payments due after one year but within five years.
| Name: |
gfai_FinanceLeaseLiabilitiesPaymentsAfterOneYearButWithinFiveYears |
| Namespace Prefix: |
gfai_ |
| Data Type: |
xbrli:monetaryItemType |
| Balance Type: |
credit |
| Period Type: |
instant |
|
| X |
- DefinitionFinance lease liability payments due next twelve months.
| Name: |
gfai_FinanceLeaseLiabilitiesPaymentsDueNextTwelveMonths |
| Namespace Prefix: |
gfai_ |
| Data Type: |
xbrli:monetaryItemType |
| Balance Type: |
credit |
| Period Type: |
instant |
|
| X |
- References
+ Details
| Name: |
gfai_FutureFinanceChargesOnFinanceLeases |
| Namespace Prefix: |
gfai_ |
| Data Type: |
xbrli:monetaryItemType |
| Balance Type: |
debit |
| Period Type: |
instant |
|
| X |
- References
+ Details
| Name: |
gfai_ScheduleOfMinimumLeasePaymentsUnderFinanceLeaseAgreementsAbstract |
| Namespace Prefix: |
gfai_ |
| Data Type: |
xbrli:stringItemType |
| Balance Type: |
na |
| Period Type: |
duration |
|
| X |
- DefinitionThe amount of liabilities related to the entity's leases. Lease is a contract, or part of a contract, that conveys the right to use an underlying asset for a period of time in exchange for consideration. Reference 1: http://www.xbrl.org/2003/role/disclosureRef
-Name IFRS
-Number 16
-IssueDate 2023-01-01
-Paragraph 47
-Subparagraph b
-URI https://taxonomy.ifrs.org/xifrs-link?type=IFRS&num=16&code=ifrs-tx-2023-en-r&anchor=para_47_b&doctype=Standard
-URIDate 2023-03-23
| Name: |
ifrs-full_LeaseLiabilities |
| Namespace Prefix: |
ifrs-full_ |
| Data Type: |
xbrli:monetaryItemType |
| Balance Type: |
credit |
| Period Type: |
instant |
|
v3.23.3
Finance Lease Liabilities (Details) - Schedule of Finance Lease Assets Comprise Primarily Vehicles and Office Equipment - USD ($)
|
Jun. 30, 2023 |
Dec. 31, 2022 |
| Schedule of Finance Lease Assets Comprise Primarily Vehicles and Office Equipment [Abstract] |
|
|
| Cost |
$ 1,540,416
|
$ 1,571,075
|
| Less: Accumulated depreciation |
(618,097)
|
(564,844)
|
| Net book value |
$ 922,319
|
$ 1,006,231
|
| X |
- DefinitionFinance lease liabilities, accumulated depreciation.
| Name: |
gfai_FinanceLeaseLiabilitiesAccumulatedDepreciation |
| Namespace Prefix: |
gfai_ |
| Data Type: |
xbrli:monetaryItemType |
| Balance Type: |
debit |
| Period Type: |
instant |
|
| X |
- DefinitionFinance lease liabilities, cost.
| Name: |
gfai_FinanceLeaseLiabilitiesCost |
| Namespace Prefix: |
gfai_ |
| Data Type: |
xbrli:monetaryItemType |
| Balance Type: |
credit |
| Period Type: |
instant |
|
| X |
- DefinitionFinance lease liabilities, net book value.
| Name: |
gfai_FinanceLeaseLiabilitiesNetBookValue |
| Namespace Prefix: |
gfai_ |
| Data Type: |
xbrli:monetaryItemType |
| Balance Type: |
credit |
| Period Type: |
instant |
|
| X |
- References
+ Details
| Name: |
gfai_ScheduleOfFinanceLeaseAssetsComprisePrimarilyVehiclesAndOfficeEquipmentAbstract |
| Namespace Prefix: |
gfai_ |
| Data Type: |
xbrli:stringItemType |
| Balance Type: |
na |
| Period Type: |
duration |
|
v3.23.3
| X |
- References
+ Details
| Name: |
gfai_TaxationAbstract |
| Namespace Prefix: |
gfai_ |
| Data Type: |
xbrli:stringItemType |
| Balance Type: |
na |
| Period Type: |
duration |
|
| X |
- DefinitionAmount after allocation of valuation allowances of deferred tax asset attributable to deductible temporary differences and carryforwards.
| Name: |
gfai_ValuationAllowances |
| Namespace Prefix: |
gfai_ |
| Data Type: |
xbrli:monetaryItemType |
| Balance Type: |
debit |
| Period Type: |
duration |
|
| X |
- DefinitionPercentage of value added tax for construction projects.
| Name: |
gfai_ValueAddedTaxForConstructionProjectsPercentage |
| Namespace Prefix: |
gfai_ |
| Data Type: |
dtr:percentItemType |
| Balance Type: |
na |
| Period Type: |
duration |
|
| X |
- DefinitionPercentage of value added tax for goods delivered and rental provided.
| Name: |
gfai_ValueAddedTaxForGoodsDeliveredAndRentalPercentage |
| Namespace Prefix: |
gfai_ |
| Data Type: |
dtr:percentItemType |
| Balance Type: |
na |
| Period Type: |
duration |
|
| X |
- References
+ Details
| Name: |
gfai_ValueAddedTaxServiceRatePercentage |
| Namespace Prefix: |
gfai_ |
| Data Type: |
dtr:percentItemType |
| Balance Type: |
na |
| Period Type: |
duration |
|
| X |
- DefinitionThe tax rate effect on the reconciliation between the average effective tax rate and the applicable tax rate resulting from the application of foreign tax rates. [Refer: Average effective tax rate; Applicable tax rate] Reference 1: http://www.xbrl.org/2003/role/disclosureRef
-Name IAS
-Number 12
-IssueDate 2023-01-01
-Paragraph 81
-Subparagraph c
-Clause ii
-URI https://taxonomy.ifrs.org/xifrs-link?type=IAS&num=12&code=ifrs-tx-2023-en-r&anchor=para_81_c_ii&doctype=Standard
-URIDate 2023-03-23
| Name: |
ifrs-full_TaxRateEffectOfForeignTaxRates |
| Namespace Prefix: |
ifrs-full_ |
| Data Type: |
dtr-types:percentItemType |
| Balance Type: |
na |
| Period Type: |
duration |
|
v3.23.3
Provision for Employee Benefits (Details) - Schedule of Retired Benefit Plan - USD ($)
|
Jun. 30, 2023 |
Jun. 30, 2022 |
| Schedule of Retired Benefit Plan [Abstract] |
|
|
|
| Defined benefit obligations at January 1, |
|
$ 4,849,614
|
$ 5,819,132
|
| Estimate for the six months period |
[1] |
(74,552)
|
(348,418)
|
| Defined benefit obligations at June 30, |
|
$ 4,775,062
|
$ 5,470,714
|
|
|
| X |
- DefinitionEstimate for the six months period.
| Name: |
gfai_EstimateAmount |
| Namespace Prefix: |
gfai_ |
| Data Type: |
xbrli:monetaryItemType |
| Balance Type: |
credit |
| Period Type: |
instant |
|
| X |
- DefinitionThe amount of deficit or surplus in a defined benefit plan, adjusted for any effect of limiting a net defined benefit asset to the asset ceiling.
| Name: |
gfai_LiabilityAssetsOfDefinedBenefitPlans |
| Namespace Prefix: |
gfai_ |
| Data Type: |
xbrli:monetaryItemType |
| Balance Type: |
credit |
| Period Type: |
instant |
|
| X |
- References
+ Details
| Name: |
gfai_ScheduleOfRetiredBenefitPlanAbstract |
| Namespace Prefix: |
gfai_ |
| Data Type: |
xbrli:stringItemType |
| Balance Type: |
na |
| Period Type: |
duration |
|
| X |
- DefinitionThe amount of deficit or surplus in a defined benefit plan, adjusted for any effect of limiting a net defined benefit asset to the asset ceiling. [Refer: Defined benefit plans [member]] Reference 1: http://www.xbrl.org/2003/role/disclosureRef
-Name IAS
-Number 19
-IssueDate 2023-01-01
-Paragraph 140
-Subparagraph a
-URI https://taxonomy.ifrs.org/xifrs-link?type=IAS&num=19&code=ifrs-tx-2023-en-r&anchor=para_140_a&doctype=Standard
-URIDate 2023-03-23
| Name: |
ifrs-full_LiabilityAssetOfDefinedBenefitPlans |
| Namespace Prefix: |
ifrs-full_ |
| Data Type: |
xbrli:monetaryItemType |
| Balance Type: |
credit |
| Period Type: |
instant |
|
v3.23.3
Shareholders’ Equity (Details) - USD ($)
$ / shares in Units, $ in Millions |
|
|
|
|
1 Months Ended |
6 Months Ended |
|
|
May 12, 2023 |
May 05, 2023 |
Mar. 08, 2023 |
Mar. 01, 2023 |
Apr. 19, 2023 |
Feb. 17, 2023 |
Feb. 13, 2023 |
Jun. 16, 2022 |
Jun. 30, 2023 |
Jan. 31, 2023 |
Dec. 31, 2022 |
| Shareholders’ Equity (Details) [Line Items] |
|
|
|
|
|
|
|
|
|
|
|
| Ordinary share par value (in Dollars per share) |
|
|
|
|
|
|
|
|
$ 0.12
|
|
$ 0.12
|
| Ordinary shares authorized |
|
|
|
|
|
|
|
|
300,000,000
|
|
7,500,000
|
| Fractional shares canceled |
|
|
|
|
|
2,339
|
|
|
|
|
|
| Restricted ordinary shares issued |
|
|
|
|
172,000
|
|
|
|
|
|
|
| Warrants outstanding |
|
|
|
|
|
|
|
|
2,013,759
|
|
|
| Warrants issued |
|
|
|
|
|
|
|
|
2,013,759
|
|
|
| Warrants description |
|
|
the Company issued a Notice regarding
Adjustment of Exercise Price (for Public Warrants) after share consolidation to the Company’s public warrant holders.
|
|
|
|
|
|
|
|
|
| Additional share |
387,090
|
258,064
|
|
|
|
|
|
|
|
|
|
| Offering price (in Dollars per share) |
$ 4.65
|
$ 4.65
|
|
|
|
|
|
|
|
|
|
| Gross proceeds (in Dollars) |
$ 13.8
|
$ 9.2
|
|
|
|
|
|
|
|
|
|
| Warrants [Member] |
|
|
|
|
|
|
|
|
|
|
|
| Shareholders’ Equity (Details) [Line Items] |
|
|
|
|
|
|
|
|
|
|
|
| Warrants shares |
|
|
|
|
|
|
|
|
128,901
|
|
|
| Warrants description |
|
|
|
|
|
|
|
|
As a result
of the share consolidation, the exercise price under the public warrant was proportionately increased from $0.16 to $6.40, the exercise
price under the private warrant was proportionately increased from $0.18 to $7.20. If any holder exercises one warrant, one-40th (1/40)
ordinary share will be received in cash (by Cash in Lieu), holders must exercise at least 40 warrants to receive 1 ordinary share.
|
|
|
| Over-Allotment Options [Member] |
|
|
|
|
|
|
|
|
|
|
|
| Shareholders’ Equity (Details) [Line Items] |
|
|
|
|
|
|
|
|
|
|
|
| Ordinary shares, issued |
2,580,600
|
1,720,430
|
|
|
|
|
|
|
|
|
|
| Bottom of range [member] |
|
|
|
|
|
|
|
|
|
|
|
| Shareholders’ Equity (Details) [Line Items] |
|
|
|
|
|
|
|
|
|
|
|
| Ordinary share par value (in Dollars per share) |
|
|
|
|
|
|
|
|
|
$ 0.003
|
|
| Ordinary shares authorized |
|
|
|
|
|
|
|
|
|
300,000,000
|
|
| Top of range [member] |
|
|
|
|
|
|
|
|
|
|
|
| Shareholders’ Equity (Details) [Line Items] |
|
|
|
|
|
|
|
|
|
|
|
| Ordinary share par value (in Dollars per share) |
|
|
|
|
|
|
|
|
|
$ 0.12
|
|
| Ordinary shares authorized |
|
|
|
|
|
|
|
|
|
7,500,000
|
|
| Beijing Wanjia [Member] |
|
|
|
|
|
|
|
|
|
|
|
| Shareholders’ Equity (Details) [Line Items] |
|
|
|
|
|
|
|
|
|
|
|
| Equity interests rate |
|
|
|
|
|
|
|
100.00%
|
|
|
|
| Seven Kewei Group companies [Member] |
|
|
|
|
|
|
|
|
|
|
|
| Shareholders’ Equity (Details) [Line Items] |
|
|
|
|
|
|
|
|
|
|
|
| Returned and cancelled shares |
|
|
|
|
|
|
243,000
|
|
|
|
|
| Total shares issued deposit |
|
|
|
262,500
|
|
|
|
|
|
|
|
| X |
- References
+ Details
| Name: |
gfai_ClassOfWarrantOrRightReason |
| Namespace Prefix: |
gfai_ |
| Data Type: |
xbrli:stringItemType |
| Balance Type: |
na |
| Period Type: |
duration |
|
| X |
- DefinitionThe percentage of equity interests rate.
| Name: |
gfai_EquityInterestsRate |
| Namespace Prefix: |
gfai_ |
| Data Type: |
dtr:percentItemType |
| Balance Type: |
na |
| Period Type: |
duration |
|
| X |
- DefinitionNumber of fractional shares canceled.
| Name: |
gfai_FractionalSharesCanceled |
| Namespace Prefix: |
gfai_ |
| Data Type: |
xbrli:sharesItemType |
| Balance Type: |
na |
| Period Type: |
duration |
|
| X |
- DefinitionThe amount is gross proceeds.
| Name: |
gfai_GrossProceeds |
| Namespace Prefix: |
gfai_ |
| Data Type: |
xbrli:monetaryItemType |
| Balance Type: |
debit |
| Period Type: |
duration |
|
| X |
- DefinitionRestricted shares are unregistered, non-transferable shares issued to a company's employees. They give employees incentive to help companies attain success. They are most common in established companies that want to motivate people with an equity stake.
| Name: |
gfai_IssuedRestrictedOrdinaryShares |
| Namespace Prefix: |
gfai_ |
| Data Type: |
xbrli:sharesItemType |
| Balance Type: |
na |
| Period Type: |
duration |
|
| X |
- DefinitionNumber of additional share.
| Name: |
gfai_NumberOfAdditionalShare |
| Namespace Prefix: |
gfai_ |
| Data Type: |
xbrli:sharesItemType |
| Balance Type: |
na |
| Period Type: |
instant |
|
| X |
- DefinitionThe number of shares returned and cancelled shares.
| Name: |
gfai_ReturnedAndCancelledShares |
| Namespace Prefix: |
gfai_ |
| Data Type: |
xbrli:sharesItemType |
| Balance Type: |
na |
| Period Type: |
duration |
|
| X |
- References
+ Details
| Name: |
gfai_ShareholdersEquityDetailsLineItems |
| Namespace Prefix: |
gfai_ |
| Data Type: |
xbrli:stringItemType |
| Balance Type: |
na |
| Period Type: |
duration |
|
| X |
- DefinitionThe number of shares issued by the deposit.
| Name: |
gfai_TotalSharesIssuedDeposit |
| Namespace Prefix: |
gfai_ |
| Data Type: |
xbrli:sharesItemType |
| Balance Type: |
na |
| Period Type: |
duration |
|
| X |
- References
+ Details
| Name: |
gfai_WarrantsIssued |
| Namespace Prefix: |
gfai_ |
| Data Type: |
xbrli:sharesItemType |
| Balance Type: |
na |
| Period Type: |
instant |
|
| X |
- References
+ Details
| Name: |
gfai_WarrantsOutstanding |
| Namespace Prefix: |
gfai_ |
| Data Type: |
xbrli:sharesItemType |
| Balance Type: |
na |
| Period Type: |
instant |
|
| X |
- References
+ Details
| Name: |
gfai_WarrantsShares |
| Namespace Prefix: |
gfai_ |
| Data Type: |
xbrli:sharesItemType |
| Balance Type: |
na |
| Period Type: |
instant |
|
| X |
- DefinitionThe number of shares authorised. Reference 1: http://www.xbrl.org/2003/role/disclosureRef
-Name IAS
-Number 1
-IssueDate 2023-01-01
-Paragraph 79
-Subparagraph a
-Clause i
-URI https://taxonomy.ifrs.org/xifrs-link?type=IAS&num=1&code=ifrs-tx-2023-en-r&anchor=para_79_a_i&doctype=Standard
-URIDate 2023-03-23
| Name: |
ifrs-full_NumberOfSharesAuthorised |
| Namespace Prefix: |
ifrs-full_ |
| Data Type: |
xbrli:sharesItemType |
| Balance Type: |
na |
| Period Type: |
instant |
|
| X |
- DefinitionThe number of shares issued by the entity. Reference 1: http://www.xbrl.org/2009/role/commonPracticeRef
-Name IAS
-Number 1
-IssueDate 2023-01-01
-Paragraph 106
-Subparagraph d
-URI https://taxonomy.ifrs.org/xifrs-link?type=IAS&num=1&code=ifrs-tx-2023-en-r&anchor=para_106_d&doctype=Standard
-URIDate 2023-03-23
| Name: |
ifrs-full_NumberOfSharesIssued |
| Namespace Prefix: |
ifrs-full_ |
| Data Type: |
xbrli:sharesItemType |
| Balance Type: |
na |
| Period Type: |
instant |
|
| X |
- DefinitionThe nominal value per share. Reference 1: http://www.xbrl.org/2003/role/disclosureRef
-Name IAS
-Number 1
-IssueDate 2023-01-01
-Paragraph 79
-Subparagraph a
-Clause iii
-URI https://taxonomy.ifrs.org/xifrs-link?type=IAS&num=1&code=ifrs-tx-2023-en-r&anchor=para_79_a_iii&doctype=Standard
-URIDate 2023-03-23
| Name: |
ifrs-full_ParValuePerShare |
| Namespace Prefix: |
ifrs-full_ |
| Data Type: |
dtr-types:perShareItemType |
| Balance Type: |
na |
| Period Type: |
instant |
|
| X |
- Details
| Name: |
ifrs-full_ClassesOfOrdinarySharesAxis=gfai_NoteWarrantsMember |
| Namespace Prefix: |
|
| Data Type: |
na |
| Balance Type: |
|
| Period Type: |
|
|
| X |
- Details
| Name: |
ifrs-full_ClassesOfOrdinarySharesAxis=gfai_OverAllotmentOptionsMember |
| Namespace Prefix: |
|
| Data Type: |
na |
| Balance Type: |
|
| Period Type: |
|
|
| X |
- Details
| Name: |
ifrs-full_RangeAxis=ifrs-full_BottomOfRangeMember |
| Namespace Prefix: |
|
| Data Type: |
na |
| Balance Type: |
|
| Period Type: |
|
|
| X |
- Details
| Name: |
ifrs-full_RangeAxis=ifrs-full_TopOfRangeMember |
| Namespace Prefix: |
|
| Data Type: |
na |
| Balance Type: |
|
| Period Type: |
|
|
v3.23.3
Selling, Distribution and Administrative Expenses (Details) - Schedule of Administrative Expenses - USD ($)
|
6 Months Ended |
Jun. 30, 2023 |
Jun. 30, 2022 |
| Schedule of Administrative Expenses [Abstract] |
|
|
|
| Staff expense |
|
$ 3,602,127
|
$ 2,988,331
|
| Rental expense |
|
345,026
|
77,999
|
| Depreciation and amortization expense |
|
1,251,359
|
1,176,705
|
| Utilities expense |
|
53,015
|
30,021
|
| Travelling and entertainment expense |
|
135,186
|
216,633
|
| Marketing expense |
|
150,203
|
228,054
|
| Professional fees |
|
774,553
|
1,262,085
|
| Repairs and maintenance |
|
35,298
|
26,835
|
| Employee benefits |
|
29,316
|
228,506
|
| Research and development expense |
|
95,322
|
68,946
|
| Other expenses |
[1] |
510,255
|
673,881
|
| Selling ,distribution and administrative expenses |
|
$ 6,981,660
|
$ 6,977,996
|
|
|
| X |
- DefinitionDepreciation and amortization expense.
| Name: |
gfai_DepreciationAndAmortizationExpense |
| Namespace Prefix: |
gfai_ |
| Data Type: |
xbrli:monetaryItemType |
| Balance Type: |
debit |
| Period Type: |
duration |
|
| X |
- References
+ Details
| Name: |
gfai_ScheduleOfAdministrativeExpensesAbstract |
| Namespace Prefix: |
gfai_ |
| Data Type: |
xbrli:stringItemType |
| Balance Type: |
na |
| Period Type: |
duration |
|
| X |
- References
+ Details
| Name: |
gfai_StaffExpense |
| Namespace Prefix: |
gfai_ |
| Data Type: |
xbrli:monetaryItemType |
| Balance Type: |
debit |
| Period Type: |
duration |
|
| X |
- DefinitionThe amount of expenses that the entity classifies as being administrative. Reference 1: http://www.xbrl.org/2003/role/disclosureRef
-Name IAS
-Number 26
-IssueDate 2023-01-01
-Paragraph 35
-Subparagraph b
-Clause vi
-URI https://taxonomy.ifrs.org/xifrs-link?type=IAS&num=26&code=ifrs-tx-2023-en-r&anchor=para_35_b_vi&doctype=Standard
-URIDate 2023-03-23
Reference 2: http://www.xbrl.org/2003/role/exampleRef
-Name IAS
-Number 1
-IssueDate 2023-01-01
-Paragraph 103
-URI https://taxonomy.ifrs.org/xifrs-link?type=IAS&num=1&code=ifrs-tx-2023-en-r&anchor=para_103&doctype=Standard
-URIDate 2023-03-23
Reference 3: http://www.xbrl.org/2003/role/disclosureRef
-Name IAS
-Number 1
-IssueDate 2023-01-01
-Paragraph 99
-URI https://taxonomy.ifrs.org/xifrs-link?type=IAS&num=1&code=ifrs-tx-2023-en-r&anchor=para_99&doctype=Standard
-URIDate 2023-03-23
| Name: |
ifrs-full_AdministrativeExpense |
| Namespace Prefix: |
ifrs-full_ |
| Data Type: |
xbrli:monetaryItemType |
| Balance Type: |
debit |
| Period Type: |
duration |
|
| X |
- DefinitionThe expense of all forms of consideration given by an entity in exchange for a service rendered by employees or for the termination of employment. Reference 1: http://www.xbrl.org/2003/role/exampleRef
-Name IAS
-Number 1
-IssueDate 2023-01-01
-Paragraph 102
-URI https://taxonomy.ifrs.org/xifrs-link?type=IAS&num=1&code=ifrs-tx-2023-en-r&anchor=para_102&doctype=Standard
-URIDate 2023-03-23
Reference 2: http://www.xbrl.org/2003/role/disclosureRef
-Name IAS
-Number 1
-IssueDate 2023-01-01
-Paragraph 99
-URI https://taxonomy.ifrs.org/xifrs-link?type=IAS&num=1&code=ifrs-tx-2023-en-r&anchor=para_99&doctype=Standard
-URIDate 2023-03-23
Reference 3: http://www.xbrl.org/2003/role/disclosureRef
-Name IAS
-Number 1
-IssueDate 2023-01-01
-Paragraph 104
-URI https://taxonomy.ifrs.org/xifrs-link?type=IAS&num=1&code=ifrs-tx-2023-en-r&anchor=para_104&doctype=Standard
-URIDate 2023-03-23
| Name: |
ifrs-full_EmployeeBenefitsExpense |
| Namespace Prefix: |
ifrs-full_ |
| Data Type: |
xbrli:monetaryItemType |
| Balance Type: |
debit |
| Period Type: |
duration |
|
| X |
- DefinitionThe amount of expenses that the entity does not separately disclose in the same statement or note when the entity uses the 'nature of expense' form for its analysis of expenses. [Refer: Expenses, by nature] Reference 1: http://www.xbrl.org/2003/role/exampleRef
-Name IAS
-Number 1
-IssueDate 2023-01-01
-Paragraph 102
-URI https://taxonomy.ifrs.org/xifrs-link?type=IAS&num=1&code=ifrs-tx-2023-en-r&anchor=para_102&doctype=Standard
-URIDate 2023-03-23
Reference 2: http://www.xbrl.org/2003/role/disclosureRef
-Name IAS
-Number 1
-IssueDate 2023-01-01
-Paragraph 99
-URI https://taxonomy.ifrs.org/xifrs-link?type=IAS&num=1&code=ifrs-tx-2023-en-r&anchor=para_99&doctype=Standard
-URIDate 2023-03-23
| Name: |
ifrs-full_OtherExpenseByNature |
| Namespace Prefix: |
ifrs-full_ |
| Data Type: |
xbrli:monetaryItemType |
| Balance Type: |
debit |
| Period Type: |
duration |
|
| X |
- DefinitionThe amount of fees paid or payable for professional services. Reference 1: http://www.xbrl.org/2009/role/commonPracticeRef
-Name IAS
-Number 1
-IssueDate 2023-01-01
-Paragraph 112
-Subparagraph c
-URI https://taxonomy.ifrs.org/xifrs-link?type=IAS&num=1&code=ifrs-tx-2023-en-r&anchor=para_112_c&doctype=Standard
-URIDate 2023-03-23
| Name: |
ifrs-full_ProfessionalFeesExpense |
| Namespace Prefix: |
ifrs-full_ |
| Data Type: |
xbrli:monetaryItemType |
| Balance Type: |
debit |
| Period Type: |
duration |
|
| X |
- DefinitionThe amount of expense recognised on rental activities. Reference 1: http://www.xbrl.org/2009/role/commonPracticeRef
-Name IAS
-Number 1
-IssueDate 2023-01-01
-Paragraph 85
-URI https://taxonomy.ifrs.org/xifrs-link?type=IAS&num=1&code=ifrs-tx-2023-en-r&anchor=para_85&doctype=Standard
-URIDate 2023-03-23
| Name: |
ifrs-full_RentalExpense |
| Namespace Prefix: |
ifrs-full_ |
| Data Type: |
xbrli:monetaryItemType |
| Balance Type: |
debit |
| Period Type: |
duration |
|
| X |
- DefinitionThe amount of expenses incurred for the day-to-day servicing of assets, which may include the cost of labour, consumables or small parts. Reference 1: http://www.xbrl.org/2009/role/commonPracticeRef
-Name IAS
-Number 1
-IssueDate 2023-01-01
-Paragraph 85
-URI https://taxonomy.ifrs.org/xifrs-link?type=IAS&num=1&code=ifrs-tx-2023-en-r&anchor=para_85&doctype=Standard
-URIDate 2023-03-23
| Name: |
ifrs-full_RepairsAndMaintenanceExpense |
| Namespace Prefix: |
ifrs-full_ |
| Data Type: |
xbrli:monetaryItemType |
| Balance Type: |
debit |
| Period Type: |
duration |
|
| X |
- DefinitionThe amount of expenditure directly attributable to research or development activities, recognised in profit or loss. Reference 1: http://www.xbrl.org/2003/role/disclosureRef
-Name IAS
-Number 38
-IssueDate 2023-01-01
-Paragraph 126
-URI https://taxonomy.ifrs.org/xifrs-link?type=IAS&num=38&code=ifrs-tx-2023-en-r&anchor=para_126&doctype=Standard
-URIDate 2023-03-23
| Name: |
ifrs-full_ResearchAndDevelopmentExpense |
| Namespace Prefix: |
ifrs-full_ |
| Data Type: |
xbrli:monetaryItemType |
| Balance Type: |
debit |
| Period Type: |
duration |
|
| X |
- DefinitionThe amount of expense relating to the marketing and selling of goods or services. Reference 1: http://www.xbrl.org/2009/role/commonPracticeRef
-Name IAS
-Number 1
-IssueDate 2023-01-01
-Paragraph 85
-URI https://taxonomy.ifrs.org/xifrs-link?type=IAS&num=1&code=ifrs-tx-2023-en-r&anchor=para_85&doctype=Standard
-URIDate 2023-03-23
| Name: |
ifrs-full_SalesAndMarketingExpense |
| Namespace Prefix: |
ifrs-full_ |
| Data Type: |
xbrli:monetaryItemType |
| Balance Type: |
debit |
| Period Type: |
duration |
|
| X |
- DefinitionThe amount of expense arising from travel. Reference 1: http://www.xbrl.org/2009/role/commonPracticeRef
-Name IAS
-Number 1
-IssueDate 2023-01-01
-Paragraph 112
-Subparagraph c
-URI https://taxonomy.ifrs.org/xifrs-link?type=IAS&num=1&code=ifrs-tx-2023-en-r&anchor=para_112_c&doctype=Standard
-URIDate 2023-03-23
| Name: |
ifrs-full_TravelExpense |
| Namespace Prefix: |
ifrs-full_ |
| Data Type: |
xbrli:monetaryItemType |
| Balance Type: |
debit |
| Period Type: |
duration |
|
| X |
- DefinitionThe amount of expense arising from purchased utilities. Reference 1: http://www.xbrl.org/2009/role/commonPracticeRef
-Name IAS
-Number 1
-IssueDate 2023-01-01
-Paragraph 112
-Subparagraph c
-URI https://taxonomy.ifrs.org/xifrs-link?type=IAS&num=1&code=ifrs-tx-2023-en-r&anchor=para_112_c&doctype=Standard
-URIDate 2023-03-23
| Name: |
ifrs-full_UtilitiesExpense |
| Namespace Prefix: |
ifrs-full_ |
| Data Type: |
xbrli:monetaryItemType |
| Balance Type: |
debit |
| Period Type: |
duration |
|
v3.23.3
| X |
- DefinitionPercentage of after tax profits.
| Name: |
gfai_AfterTaxProfitsPercentage |
| Namespace Prefix: |
gfai_ |
| Data Type: |
dtr:percentItemType |
| Balance Type: |
na |
| Period Type: |
duration |
|
| X |
- DefinitionDividend distribution percentage.
| Name: |
gfai_DividendDistributionPercentage |
| Namespace Prefix: |
gfai_ |
| Data Type: |
dtr:percentItemType |
| Balance Type: |
na |
| Period Type: |
instant |
|
| X |
- DefinitionA component of equity representing reserves created based on legal requirements.
| Name: |
gfai_LegalReserve |
| Namespace Prefix: |
gfai_ |
| Data Type: |
xbrli:monetaryItemType |
| Balance Type: |
credit |
| Period Type: |
instant |
|
| X |
- References
+ Details
| Name: |
gfai_LegalReserveAbstract |
| Namespace Prefix: |
gfai_ |
| Data Type: |
xbrli:stringItemType |
| Balance Type: |
na |
| Period Type: |
duration |
|
| X |
- DefinitionPercentage of PRC entity registered capital.
| Name: |
gfai_PRCEntityRegisteredCapital |
| Namespace Prefix: |
gfai_ |
| Data Type: |
dtr:percentItemType |
| Balance Type: |
na |
| Period Type: |
duration |
|
| X |
- References
+ Details
| Name: |
gfai_PercentageOfLegalReserve |
| Namespace Prefix: |
gfai_ |
| Data Type: |
dtr:percentItemType |
| Balance Type: |
na |
| Period Type: |
duration |
|
v3.23.3
Related Party Transactions (Details)
|
|
1 Months Ended |
5 Months Ended |
6 Months Ended |
12 Months Ended |
|
|
|
|
|
|
|
Sep. 30, 2023
USD ($)
|
Feb. 13, 2023
USD ($)
shares
|
May 25, 2023
USD ($)
|
Jun. 30, 2023
USD ($)
|
Dec. 31, 2022
USD ($)
|
Mar. 31, 2023
USD ($)
|
Mar. 31, 2023
CNY (¥)
|
Jun. 30, 2022
USD ($)
|
May 24, 2022 |
Sep. 09, 2020
USD ($)
|
Apr. 17, 2020
USD ($)
|
Dec. 31, 2019
USD ($)
|
| Related Party Transactions (Details) [Line Items] |
|
|
|
|
|
|
|
|
|
|
|
|
| Amounts due prepayments |
|
|
|
$ 4,481,346
|
|
|
|
|
|
|
|
|
| Purchase from a related party |
|
|
|
1,062,809
|
|
|
|
|
|
|
|
|
| Related party receivables |
$ 1,500,000
|
|
$ 1,500,000
|
1,500,000
|
|
|
|
|
|
|
|
|
| Equity interests, percentage |
|
|
|
|
|
|
|
|
100.00%
|
|
|
|
| Acquisition purchase price |
|
|
|
|
$ 21,600,000
|
|
|
|
|
|
|
|
| Acquisition cash percentage |
|
|
|
|
10.00%
|
|
|
|
|
|
|
|
| Restricted ordinary shares percentage |
|
|
|
|
90.00%
|
|
|
|
|
|
|
|
| Deposit paid |
|
|
|
4,860,000
|
|
|
|
|
|
|
|
|
| Shareholder's amount |
|
|
|
|
|
$ 291,000
|
¥ 2,000,000
|
|
|
|
|
|
| Comprised advance |
|
|
|
195,398
|
|
|
|
|
|
|
|
|
| Accrued interests |
|
|
|
227,786
|
|
|
|
|
|
|
|
|
| Trade payable |
|
|
|
2,590,621
|
|
|
|
|
|
|
|
|
| Expense paid for related party |
|
|
|
22,173
|
|
|
|
|
|
|
|
|
| Borrowed amount |
|
|
|
|
|
|
|
|
|
$ 413,500
|
$ 2,735,000
|
$ 1,499,998
|
| Principal loan amount |
|
|
18,346
|
|
|
|
|
|
|
|
|
|
| Purchase robots amounting |
|
|
|
229,162
|
|
|
|
|
|
|
|
|
| Placing purchase orders |
|
|
|
50,927
|
|
|
|
|
|
|
|
|
| Returned robots amounting |
|
|
|
138,520
|
|
|
|
|
|
|
|
|
| Contract amount |
|
|
|
$ 3,000,000
|
|
|
|
|
|
|
|
|
| Shenzhen Kewei Robot Technology Co., Limited [Member] |
|
|
|
|
|
|
|
|
|
|
|
|
| Related Party Transactions (Details) [Line Items] |
|
|
|
|
|
|
|
|
|
|
|
|
| Restricted ordinary shares (in Shares) | shares |
|
243,000
|
|
|
|
|
|
|
|
|
|
|
| Restricted ordinary shares amounting |
|
$ 4,860,000
|
|
|
|
|
|
|
|
|
|
|
| Guardforce Holdings (HK) Limited [Member] |
|
|
|
|
|
|
|
|
|
|
|
|
| Related Party Transactions (Details) [Line Items] |
|
|
|
|
|
|
|
|
|
|
|
|
| Agreement description |
|
|
|
As of December 31, 2022, the outstanding balance of this loan was $2,735,000. The loan is unsecured and bears an interest rate at 2%. The loan was due on April 16, 2023 and was verbally agreed to extend with the same terms and conditions until this loan is scheduled to be settled in late 2023.
|
|
|
|
|
|
|
|
|
| Interest expenses on loan |
|
|
|
$ 25,570
|
|
|
|
$ 27,350
|
|
|
|
|
| Principal loan amount |
|
|
1,068,154
|
|
|
|
|
|
|
|
|
|
| Guardforce Holdings (HK) Limited One [Member] |
|
|
|
|
|
|
|
|
|
|
|
|
| Related Party Transactions (Details) [Line Items] |
|
|
|
|
|
|
|
|
|
|
|
|
| Agreement description |
|
|
|
The loan is unsecured and it bears interest at 2%. The loan is due on September 8, 2023.
|
|
|
|
|
|
|
|
|
| Interest expenses on loan |
|
|
|
$ 3,446
|
|
|
|
4,135
|
|
|
|
|
| Principal loan amount |
|
|
$ 413,500
|
|
|
|
|
|
|
|
|
|
| Guardforce Holdings (HK) Limited Two [Member] |
|
|
|
|
|
|
|
|
|
|
|
|
| Related Party Transactions (Details) [Line Items] |
|
|
|
|
|
|
|
|
|
|
|
|
| Agreement description |
|
|
|
As of December 31, 2022, the outstanding balance of this loan was $18,346. The loan is unsecured and it bears an interest rate of 2%. The loan is due on June 30,2025.
|
|
|
|
|
|
|
|
|
| Interest expenses on loan |
|
|
|
$ 153
|
|
|
|
770
|
|
|
|
|
| Tu Jingyi [Member] |
|
|
|
|
|
|
|
|
|
|
|
|
| Related Party Transactions (Details) [Line Items] |
|
|
|
|
|
|
|
|
|
|
|
|
| Agreement description |
|
|
|
(c)On September 1, 2018, the Company entered into an agreement with Tu Jingyi whereby Tu Jingyi loaned $1,437,303 (RMB10 million) to the Company. The loan is unsecured with an interest rate at 1.5%.
|
|
|
|
|
|
|
|
|
| Interest expenses on loan |
|
|
|
$ 10,780
|
|
|
|
|
|
|
|
|
| X |
- DefinitionThe amount of accrued interests.
| Name: |
gfai_AccruedInterests |
| Namespace Prefix: |
gfai_ |
| Data Type: |
xbrli:monetaryItemType |
| Balance Type: |
debit |
| Period Type: |
duration |
|
| X |
- DefinitionThe description related to agreement to related party.
| Name: |
gfai_AgreementDescription |
| Namespace Prefix: |
gfai_ |
| Data Type: |
xbrli:stringItemType |
| Balance Type: |
na |
| Period Type: |
duration |
|
| X |
- DefinitionThe amount of comprised advance.
| Name: |
gfai_ComprisedAdvance |
| Namespace Prefix: |
gfai_ |
| Data Type: |
xbrli:monetaryItemType |
| Balance Type: |
credit |
| Period Type: |
duration |
|
| X |
- DefinitionEquity interests, percentage.
| Name: |
gfai_EquityInterestsPercentage |
| Namespace Prefix: |
gfai_ |
| Data Type: |
dtr:percentItemType |
| Balance Type: |
na |
| Period Type: |
instant |
|
| X |
- DefinitionInterest And Debt Expense.
| Name: |
gfai_InterestAndDebtExpenses |
| Namespace Prefix: |
gfai_ |
| Data Type: |
xbrli:monetaryItemType |
| Balance Type: |
na |
| Period Type: |
instant |
|
| X |
- DefinitionAmounts payable that the entity does not separately disclose in the same statement or note.
| Name: |
gfai_OtherPayable |
| Namespace Prefix: |
gfai_ |
| Data Type: |
xbrli:monetaryItemType |
| Balance Type: |
credit |
| Period Type: |
duration |
|
| X |
- DefinitionPurchase robots amounting.
| Name: |
gfai_PurchaseRobotsAmounting |
| Namespace Prefix: |
gfai_ |
| Data Type: |
xbrli:monetaryItemType |
| Balance Type: |
debit |
| Period Type: |
duration |
|
| X |
- DefinitionReturned robots amounting
| Name: |
gfai_ReturnedRobotsAmounting |
| Namespace Prefix: |
gfai_ |
| Data Type: |
xbrli:monetaryItemType |
| Balance Type: |
credit |
| Period Type: |
duration |
|
| X |
- DefinitionThe amount of insurance acquisition cash flows that are assets, recognised for insurance acquisition cash flows paid (or insurance acquisition cash flows for which a liability has been recognised applying another IFRS Standard) before the related group of insurance contracts is recognised. Insurance acquisition cash flows are cash flows arising from the costs of selling, underwriting and starting a group of insurance contracts (issued or expected to be issued) that are directly attributable to the portfolio of insurance contracts to which the group belongs. Such cash flows include cash flows that are not directly attributable to individual contracts or groups of insurance contracts within the portfolio. [Refer: Assets; Insurance contracts [member]] Reference 1: http://www.xbrl.org/2003/role/disclosureRef
-Name IFRS
-Number 17
-IssueDate 2023-01-01
-Paragraph 105A
-URI https://taxonomy.ifrs.org/xifrs-link?type=IFRS&num=17&code=ifrs-tx-2023-en-r&anchor=para_105A&doctype=Standard
-URIDate 2023-03-23
Reference 2: http://www.xbrl.org/2003/role/disclosureRef
-Name IFRS
-Number 17
-IssueDate 2023-01-01
-Paragraph 109A
-URI https://taxonomy.ifrs.org/xifrs-link?type=IFRS&num=17&code=ifrs-tx-2023-en-r&anchor=para_109A&doctype=Standard
-URIDate 2023-03-23
| Name: |
ifrs-full_AssetsForInsuranceAcquisitionCashFlows |
| Namespace Prefix: |
ifrs-full_ |
| Data Type: |
xbrli:monetaryItemType |
| Balance Type: |
debit |
| Period Type: |
duration |
|
| X |
- DefinitionThe percentage cash and cash equivalents contribute to the fair value of defined benefit plan assets. [Refer: Cash and cash equivalents; Plan assets, at fair value; Defined benefit plans [member]] [Contrast: Cash and cash equivalents, amount contributed to fair value of plan assets] Reference 1: http://www.xbrl.org/2009/role/commonPracticeRef
-Name IAS
-Number 19
-IssueDate 2023-01-01
-Paragraph 142
-Subparagraph a
-URI https://taxonomy.ifrs.org/xifrs-link?type=IAS&num=19&code=ifrs-tx-2023-en-r&anchor=para_142_a&doctype=Standard
-URIDate 2023-03-23
| Name: |
ifrs-full_CashAndCashEquivalentsPercentageContributedToFairValueOfPlanAssets |
| Namespace Prefix: |
ifrs-full_ |
| Data Type: |
dtr-types:percentItemType |
| Balance Type: |
na |
| Period Type: |
instant |
|
| X |
- DefinitionThe amount of capital commitments for which the entity has entered into a contract. [Refer: Capital commitments] Reference 1: http://www.xbrl.org/2009/role/commonPracticeRef
-Name IAS
-Number 1
-IssueDate 2023-01-01
-Paragraph 112
-Subparagraph c
-URI https://taxonomy.ifrs.org/xifrs-link?type=IAS&num=1&code=ifrs-tx-2023-en-r&anchor=para_112_c&doctype=Standard
-URIDate 2023-03-23
| Name: |
ifrs-full_ContractualCapitalCommitments |
| Namespace Prefix: |
ifrs-full_ |
| Data Type: |
xbrli:monetaryItemType |
| Balance Type: |
credit |
| Period Type: |
instant |
|
| X |
- DefinitionThe amount of deposit liabilities from customers held by the entity. Reference 1: http://www.xbrl.org/2009/role/commonPracticeRef
-Name IAS
-Number 1
-IssueDate 2023-01-01
-Paragraph 55
-URI https://taxonomy.ifrs.org/xifrs-link?type=IAS&num=1&code=ifrs-tx-2023-en-r&anchor=para_55&doctype=Standard
-URIDate 2023-03-23
| Name: |
ifrs-full_DepositsFromCustomers |
| Namespace Prefix: |
ifrs-full_ |
| Data Type: |
xbrli:monetaryItemType |
| Balance Type: |
credit |
| Period Type: |
instant |
|
| X |
- DefinitionThe amount of dividends paid by the entity on ordinary shares. [Refer: Ordinary shares [member]] Reference 1: http://www.xbrl.org/2003/role/disclosureRef
-Name IAS
-Number 34
-IssueDate 2023-01-01
-Paragraph 16A
-Subparagraph f
-URI https://taxonomy.ifrs.org/xifrs-link?type=IAS&num=34&code=ifrs-tx-2023-en-r&anchor=para_16A_f&doctype=Standard
-URIDate 2023-03-23
| Name: |
ifrs-full_DividendsPaidOrdinaryShares |
| Namespace Prefix: |
ifrs-full_ |
| Data Type: |
xbrli:monetaryItemType |
| Balance Type: |
debit |
| Period Type: |
duration |
|
| X |
- DefinitionThe amount instruments representing equity (rather than debt) contribute to the fair value of defined benefit plan assets. [Refer: Plan assets, at fair value; Defined benefit plans [member]] Reference 1: http://www.xbrl.org/2003/role/exampleRef
-Name IAS
-Number 19
-IssueDate 2023-01-01
-Paragraph 142
-Subparagraph b
-URI https://taxonomy.ifrs.org/xifrs-link?type=IAS&num=19&code=ifrs-tx-2023-en-r&anchor=para_142_b&doctype=Standard
-URIDate 2023-03-23
| Name: |
ifrs-full_EquityInstrumentsAmountContributedToFairValueOfPlanAssets |
| Namespace Prefix: |
ifrs-full_ |
| Data Type: |
xbrli:monetaryItemType |
| Balance Type: |
debit |
| Period Type: |
instant |
|
| X |
- DefinitionThe percentage equity instruments contribute to the fair value of defined benefit plan assets. [Refer: Plan assets, at fair value; Defined benefit plans [member]] [Contrast: Equity instruments, amount contributed to fair value of plan assets] Reference 1: http://www.xbrl.org/2009/role/commonPracticeRef
-Name IAS
-Number 19
-IssueDate 2023-01-01
-Paragraph 142
-Subparagraph b
-URI https://taxonomy.ifrs.org/xifrs-link?type=IAS&num=19&code=ifrs-tx-2023-en-r&anchor=para_142_b&doctype=Standard
-URIDate 2023-03-23
| Name: |
ifrs-full_EquityInstrumentsPercentageContributedToFairValueOfPlanAssets |
| Namespace Prefix: |
ifrs-full_ |
| Data Type: |
dtr-types:percentItemType |
| Balance Type: |
na |
| Period Type: |
instant |
|
| X |
- DefinitionThe number of shares issued by the entity. Reference 1: http://www.xbrl.org/2009/role/commonPracticeRef
-Name IAS
-Number 1
-IssueDate 2023-01-01
-Paragraph 106
-Subparagraph d
-URI https://taxonomy.ifrs.org/xifrs-link?type=IAS&num=1&code=ifrs-tx-2023-en-r&anchor=para_106_d&doctype=Standard
-URIDate 2023-03-23
| Name: |
ifrs-full_NumberOfSharesIssued |
| Namespace Prefix: |
ifrs-full_ |
| Data Type: |
xbrli:sharesItemType |
| Balance Type: |
na |
| Period Type: |
instant |
|
| X |
- DefinitionReceivables that represent amounts paid for goods and services before they have been delivered. Reference 1: http://www.xbrl.org/2003/role/exampleRef
-Name IAS
-Number 1
-IssueDate 2023-01-01
-Paragraph 78
-Subparagraph b
-URI https://taxonomy.ifrs.org/xifrs-link?type=IAS&num=1&code=ifrs-tx-2023-en-r&anchor=para_78_b&doctype=Standard
-URIDate 2023-03-23
| Name: |
ifrs-full_Prepayments |
| Namespace Prefix: |
ifrs-full_ |
| Data Type: |
xbrli:monetaryItemType |
| Balance Type: |
debit |
| Period Type: |
instant |
|
| X |
- DefinitionThe cash outflow for the purchase of biological assets. [Refer: Biological assets] Reference 1: http://www.xbrl.org/2009/role/commonPracticeRef
-Name IAS
-Number 7
-IssueDate 2023-01-01
-Paragraph 16
-URI https://taxonomy.ifrs.org/xifrs-link?type=IAS&num=7&code=ifrs-tx-2023-en-r&anchor=para_16&doctype=Standard
-URIDate 2023-03-23
| Name: |
ifrs-full_PurchaseOfBiologicalAssets |
| Namespace Prefix: |
ifrs-full_ |
| Data Type: |
xbrli:monetaryItemType |
| Balance Type: |
credit |
| Period Type: |
duration |
|
| X |
- DefinitionThe amount of instruments purchased for resale in reverse repurchase agreements and cash collateral on securities borrowed. [Refer: Repurchase agreements and cash collateral on securities lent] Reference 1: http://www.xbrl.org/2009/role/commonPracticeRef
-Name IAS
-Number 1
-IssueDate 2023-01-01
-Paragraph 55
-URI https://taxonomy.ifrs.org/xifrs-link?type=IAS&num=1&code=ifrs-tx-2023-en-r&anchor=para_55&doctype=Standard
-URIDate 2023-03-23
| Name: |
ifrs-full_ReverseRepurchaseAgreementsAndCashCollateralOnSecuritiesBorrowed |
| Namespace Prefix: |
ifrs-full_ |
| Data Type: |
xbrli:monetaryItemType |
| Balance Type: |
debit |
| Period Type: |
instant |
|
v3.23.3
Related Party Transactions (Details) - Schedule of Amounts Due from Related Parties - USD ($)
|
Jun. 30, 2023 |
Dec. 31, 2022 |
| Related Party Transactions (Details) - Schedule of Amounts Due from Related Parties [Line Items] |
|
|
|
| Due from related parties |
|
$ 7,716,503
|
$ 14,508,873
|
| Guardforce TH Group Company Limited [Member] |
|
|
|
| Related Party Transactions (Details) - Schedule of Amounts Due from Related Parties [Line Items] |
|
|
|
| Due from related parties |
[1] |
1,749
|
894
|
| Guardforce AI Technology Limited [Member] |
|
|
|
| Related Party Transactions (Details) - Schedule of Amounts Due from Related Parties [Line Items] |
|
|
|
| Due from related parties |
[1] |
423
|
423
|
| Guardforce AI Service Limited [Member] |
|
|
|
| Related Party Transactions (Details) - Schedule of Amounts Due from Related Parties [Line Items] |
|
|
|
| Due from related parties |
[1] |
423
|
423
|
| Shenzhen Intelligent Guardforce Robot Technology Co., Limited [Member] |
|
|
|
| Related Party Transactions (Details) - Schedule of Amounts Due from Related Parties [Line Items] |
|
|
|
| Due from related parties |
[2] |
5,544,156
|
7,312,883
|
| Shareholders’ of Shenzhen Kewei Robot Technology Co., Limited and its subsidiaries [Member] |
|
|
|
| Related Party Transactions (Details) - Schedule of Amounts Due from Related Parties [Line Items] |
|
|
|
| Due from related parties |
[3] |
2,160,000
|
7,020,000
|
| Nanjing Zhongzhi Yonghao Robot Co., Ltd. [Member] |
|
|
|
| Related Party Transactions (Details) - Schedule of Amounts Due from Related Parties [Line Items] |
|
|
|
| Due from related parties |
[1] |
|
7,297
|
| Nanchang Zongkun Intelligent Technology Co., Ltd. [Member] |
|
|
|
| Related Party Transactions (Details) - Schedule of Amounts Due from Related Parties [Line Items] |
|
|
|
| Due from related parties |
[1] |
|
7,310
|
| Sichuan Qiantu Guardforce Robot Technology Co., Ltd. [Member] |
|
|
|
| Related Party Transactions (Details) - Schedule of Amounts Due from Related Parties [Line Items] |
|
|
|
| Due from related parties |
[1] |
|
3,777
|
| Shanghai Nanshao Fire Engineering and Equipment Co., Ltd. [Member] |
|
|
|
| Related Party Transactions (Details) - Schedule of Amounts Due from Related Parties [Line Items] |
|
|
|
| Due from related parties |
[1] |
|
144,737
|
| CSF Mingda Technology Co., Ltd [Member] |
|
|
|
| Related Party Transactions (Details) - Schedule of Amounts Due from Related Parties [Line Items] |
|
|
|
| Due from related parties |
[1] |
$ 9,752
|
$ 11,129
|
|
|
v3.23.3
Related Party Transactions (Details) - Schedule of Amounts Due to Related Parties - USD ($)
|
Jun. 30, 2023 |
Dec. 31, 2022 |
| Related Party Transactions (Details) - Schedule of Amounts Due to Related Parties [Line Items] |
|
|
|
| Due to related parties |
|
$ 3,703,038
|
$ 3,868,691
|
| Tu Jingyi [Member] |
|
|
|
| Related Party Transactions (Details) - Schedule of Amounts Due to Related Parties [Line Items] |
|
|
|
| Due to related parties |
[1] |
220,808
|
210,028
|
| Guardforce Holdings (HK) Limited [Member] |
|
|
|
| Related Party Transactions (Details) - Schedule of Amounts Due to Related Parties [Line Items] |
|
|
|
| Due to related parties |
[2] |
423,184
|
394,016
|
| Guardforce Security (Thailand) Company Limited [Member] |
|
|
|
| Related Party Transactions (Details) - Schedule of Amounts Due to Related Parties [Line Items] |
|
|
|
| Due to related parties |
[3] |
68,897
|
77,413
|
| Shenzhen Kewei Robot Technology Co., Limited and its subsidiaries [Member] |
|
|
|
| Related Party Transactions (Details) - Schedule of Amounts Due to Related Parties [Line Items] |
|
|
|
| Due to related parties |
[4] |
2,569,448
|
2,403,555
|
| Shenzhen Zhongzhi Yonghao Robot Co., Ltd. [Member] |
|
|
|
| Related Party Transactions (Details) - Schedule of Amounts Due to Related Parties [Line Items] |
|
|
|
| Due to related parties |
|
376,391
|
394,151
|
| Shenzhen Qianban Technology Co., Ltd. [Member] |
|
|
|
| Related Party Transactions (Details) - Schedule of Amounts Due to Related Parties [Line Items] |
|
|
|
| Due to related parties |
[4] |
|
99,733
|
| Guardforce Security Service (Shanghai) Co., Ltd. [Member] |
|
|
|
| Related Party Transactions (Details) - Schedule of Amounts Due to Related Parties [Line Items] |
|
|
|
| Due to related parties |
[5] |
34,465
|
267,764
|
| Shenzhen Guardforce Qiyun Technology Co., Ltd. [Member] |
|
|
|
| Related Party Transactions (Details) - Schedule of Amounts Due to Related Parties [Line Items] |
|
|
|
| Due to related parties |
[5] |
|
189
|
| Shanghai Yongan Security Alarm System Co., Ltd. [Member] |
|
|
|
| Related Party Transactions (Details) - Schedule of Amounts Due to Related Parties [Line Items] |
|
|
|
| Due to related parties |
[5] |
9,650
|
21,842
|
| Guardforce Aviation Security Company Limited [Member] |
|
|
|
| Related Party Transactions (Details) - Schedule of Amounts Due to Related Parties [Line Items] |
|
|
|
| Due to related parties |
[3] |
$ 195
|
|
|
|
v3.23.3
| X |
- References
+ Details
| Name: |
gfai_ShorttermBorrowing |
| Namespace Prefix: |
gfai_ |
| Data Type: |
xbrli:monetaryItemType |
| Balance Type: |
credit |
| Period Type: |
instant |
|
v3.23.3
Related Party Transactions (Details) - Schedule of Long-Term Borrowings from Related Parties - USD ($)
|
Jun. 30, 2023 |
Dec. 31, 2022 |
| Related Party Transactions (Details) - Schedule of Long-Term Borrowings from Related Parties [Line Items] |
|
|
|
| Long-term borrowings from related parties |
|
$ 1,437,303
|
$ 1,455,649
|
| Guardforce Holdings (HK) Limited [Member] |
|
|
|
| Related Party Transactions (Details) - Schedule of Long-Term Borrowings from Related Parties [Line Items] |
|
|
|
| Long-term borrowings from related parties |
[1] |
|
18,346
|
| Tu Jingyi [Member] |
|
|
|
| Related Party Transactions (Details) - Schedule of Long-Term Borrowings from Related Parties [Line Items] |
|
|
|
| Long-term borrowings from related parties |
[2] |
$ 1,437,303
|
$ 1,437,303
|
|
|
v3.23.3
Related Party Transactions (Details) - Schedule of Related Party Transactions - USD ($)
|
6 Months Ended |
Jun. 30, 2023 |
Jun. 30, 2022 |
| Service/ Products received from related parties: |
|
|
|
| Service/ Products received from related parties |
|
$ 211,066
|
$ 10,920,441
|
| Guardforce Security (Thailand) Company Limited [Member] |
|
|
|
| Service/ Products received from related parties: |
|
|
|
| Service/ Products received from related parties |
[1] |
68,897
|
67,864
|
| Guardforce Aviation Security Company Limited [Member] |
|
|
|
| Service/ Products received from related parties: |
|
|
|
| Service/ Products received from related parties |
[2] |
600
|
|
| Shenzhen Intelligent Guardforce Robot Technology Co., Limited – Purchases [Member] |
|
|
|
| Service/ Products received from related parties: |
|
|
|
| Service/ Products received from related parties |
[3] |
|
7,008,322
|
| Shenzhen Kewei Robot Technology Co., Ltd. – Purchases [Member] |
|
|
|
| Service/ Products received from related parties: |
|
|
|
| Service/ Products received from related parties |
[3] |
141,569
|
844,255
|
| Shenzhen Kewei Robot Technology Co., Limited - ICP [Member] |
|
|
|
| Service/ Products received from related parties: |
|
|
|
| Service/ Products received from related parties |
[4] |
|
3,000,000
|
| GF Technovation Company Limited [Member] |
|
|
|
| Service/ Products delivered to related parties: |
|
|
|
| Service/ Products delivered to related parties |
[5] |
|
$ 134,123
|
|
|
v3.23.3
| X |
- References
+ Details
| Name: |
gfai_ConsolidatedSegmentDataDetailsLineItems |
| Namespace Prefix: |
gfai_ |
| Data Type: |
xbrli:stringItemType |
| Balance Type: |
na |
| Period Type: |
duration |
|
| X |
- DefinitionThe amount of dividends payable by means of the distribution of non-cash assets to owners. Reference 1: http://www.xbrl.org/2003/role/disclosureRef
-Name IFRIC
-Number 17
-IssueDate 2023-01-01
-Paragraph 16
-Subparagraph a
-URI https://taxonomy.ifrs.org/xifrs-link?type=IFRIC&num=17&code=ifrs-tx-2023-en-r&anchor=para_16_a&doctype=Standard
-URIDate 2023-03-23
| Name: |
ifrs-full_DividendsPayable |
| Namespace Prefix: |
ifrs-full_ |
| Data Type: |
xbrli:monetaryItemType |
| Balance Type: |
credit |
| Period Type: |
instant |
|
v3.23.3
Consolidated Segment Data (Details) - Schedule of Selected Information by Segment - USD ($)
|
6 Months Ended |
Jun. 30, 2023 |
Jun. 30, 2022 |
| Schedule of Selected Information by Segment [Abstract] |
|
|
|
| Revenues |
|
$ 18,413,292
|
$ 16,942,522
|
| Foreign exchange losses, net |
|
169,410
|
(197,909)
|
| Finance costs: |
|
|
|
| Finance costs |
|
(584,897)
|
(410,861)
|
| Loss before income tax |
|
(12,975,002)
|
(6,659,397)
|
| Provision for income tax (expense) benefit |
|
(874,431)
|
320,183
|
| Net loss for the period |
|
(13,849,433)
|
(6,339,214)
|
| Less: Loss attributable to the non-controlling interest |
|
30,214
|
32,392
|
| Net loss attributable to equity holders of the Company |
|
(13,819,219)
|
(6,306,822)
|
| Operating loss [Member] |
|
|
|
| Schedule of Selected Information by Segment [Abstract] |
|
|
|
| Operating loss |
|
(11,884,209)
|
(5,549,636)
|
| Total other income from five segments |
|
77,765
|
46,859
|
| Secured logistics [Member] | Operating loss [Member] |
|
|
|
| Schedule of Selected Information by Segment [Abstract] |
|
|
|
| Operating loss |
|
(1,101,369)
|
(962,310)
|
| Secured logistics [Member] | Foreign exchange losses, net [Member] | Operating loss [Member] |
|
|
|
| Schedule of Selected Information by Segment [Abstract] |
|
|
|
| Foreign exchange losses, net |
|
(598,053)
|
(751,622)
|
| Secured logistics [Member] | Finance costs [Member] | Operating loss [Member] |
|
|
|
| Finance costs: |
|
|
|
| Finance costs |
|
(423,440)
|
(405,365)
|
| Information security [Member] | Operating loss [Member] |
|
|
|
| Schedule of Selected Information by Segment [Abstract] |
|
|
|
| Operating loss |
|
(311,916)
|
(19,041)
|
| Information security [Member] | Foreign exchange losses, net [Member] | Operating loss [Member] |
|
|
|
| Schedule of Selected Information by Segment [Abstract] |
|
|
|
| Foreign exchange losses, net |
|
432
|
44
|
| Information security [Member] | Finance costs [Member] | Operating loss [Member] |
|
|
|
| Finance costs: |
|
|
|
| Finance costs |
|
(6,589)
|
(1,648)
|
| Robotics AI solutions [Member] | Operating loss [Member] |
|
|
|
| Schedule of Selected Information by Segment [Abstract] |
|
|
|
| Operating loss |
|
(8,320,982)
|
(1,977,324)
|
| Robotics AI solutions [Member] | Foreign exchange losses, net [Member] | Operating loss [Member] |
|
|
|
| Schedule of Selected Information by Segment [Abstract] |
|
|
|
| Foreign exchange losses, net |
|
13,150
|
5,973
|
| General security solutions [Member] | Operating loss [Member] |
|
|
|
| Schedule of Selected Information by Segment [Abstract] |
|
|
|
| Operating loss |
|
(542,569)
|
|
| Corporate and others [Member] | Operating loss [Member] |
|
|
|
| Schedule of Selected Information by Segment [Abstract] |
|
|
|
| Operating loss |
[1] |
(1,607,373)
|
(2,590,961)
|
| Corporate and others [Member] | Foreign exchange losses, net [Member] | Operating loss [Member] |
|
|
|
| Schedule of Selected Information by Segment [Abstract] |
|
|
|
| Foreign exchange losses, net |
|
810
|
(154)
|
| Corporate and others [Member] | Finance costs [Member] | Operating loss [Member] |
|
|
|
| Finance costs: |
|
|
|
| Finance costs |
|
(154,868)
|
(3,848)
|
| Revenue [Member] |
|
|
|
| Schedule of Selected Information by Segment [Abstract] |
|
|
|
| Revenues |
[2] |
18,413,292
|
16,942,522
|
| Revenue [Member] | Secured logistics [Member] |
|
|
|
| Schedule of Selected Information by Segment [Abstract] |
|
|
|
| Revenues |
[2] |
15,943,156
|
15,960,547
|
| Revenue [Member] | Information security [Member] |
|
|
|
| Schedule of Selected Information by Segment [Abstract] |
|
|
|
| Revenues |
[2] |
407,689
|
262,934
|
| Revenue [Member] | Robotics AI solutions [Member] |
|
|
|
| Schedule of Selected Information by Segment [Abstract] |
|
|
|
| Revenues |
[2] |
440,229
|
719,041
|
| Revenue [Member] | General security solutions [Member] |
|
|
|
| Schedule of Selected Information by Segment [Abstract] |
|
|
|
| Revenues |
[2] |
$ 1,622,218
|
|
|
|
| X |
- References
+ Details
| Name: |
gfai_FinanceCostsAbstract |
| Namespace Prefix: |
gfai_ |
| Data Type: |
xbrli:stringItemType |
| Balance Type: |
na |
| Period Type: |
duration |
|
| X |
- DefinitionNet loss attributable to equity holders of the company.
| Name: |
gfai_ProfitLossAttributablesToOwnersOfParent |
| Namespace Prefix: |
gfai_ |
| Data Type: |
xbrli:monetaryItemType |
| Balance Type: |
credit |
| Period Type: |
duration |
|
| X |
- DefinitionThe amount of costs associated with financing activities of the entity. Reference 1: http://www.xbrl.org/2003/role/disclosureRef
-Name IAS
-Number 1
-IssueDate 2023-01-01
-Paragraph 82
-Subparagraph b
-URI https://taxonomy.ifrs.org/xifrs-link?type=IAS&num=1&code=ifrs-tx-2023-en-r&anchor=para_82_b&doctype=Standard
-URIDate 2023-03-23
| Name: |
ifrs-full_FinanceCosts |
| Namespace Prefix: |
ifrs-full_ |
| Data Type: |
xbrli:monetaryItemType |
| Balance Type: |
debit |
| Period Type: |
duration |
|
| X |
- DefinitionThe gains (losses) recognised in other comprehensive income on exchange differences on the translation of financial statements of foreign operations, net of tax, before reclassification adjustments. [Refer: Other comprehensive income] Reference 1: http://www.xbrl.org/2003/role/disclosureRef
-Name IAS
-Number 1
-IssueDate 2023-01-01
-Paragraph 91
-Subparagraph a
-URI https://taxonomy.ifrs.org/xifrs-link?type=IAS&num=1&code=ifrs-tx-2023-en-r&anchor=para_91_a&doctype=Standard
-URIDate 2023-03-23
| Name: |
ifrs-full_GainsLossesOnExchangeDifferencesOnTranslationNetOfTax |
| Namespace Prefix: |
ifrs-full_ |
| Data Type: |
xbrli:monetaryItemType |
| Balance Type: |
credit |
| Period Type: |
duration |
|
| X |
- DefinitionThe amount of other comprehensive income that will not be reclassified to profit or loss, net of tax. [Refer: Other comprehensive income] Reference 1: http://www.xbrl.org/2003/role/exampleRef
-Name IAS
-Number 1
-IssueDate 2023-01-01
-Paragraph IG6
-URI https://taxonomy.ifrs.org/xifrs-link?type=IAS&num=1&code=ifrs-tx-2023-en-r&anchor=para_IG6&doctype=Implementation%20Guidance
-URIDate 2023-03-23
Reference 2: http://www.xbrl.org/2003/role/exampleRef
-Name IAS
-Number 1
-IssueDate 2023-01-01
-Paragraph 82A
-URI https://taxonomy.ifrs.org/xifrs-link?type=IAS&num=1&code=ifrs-tx-2023-en-r&anchor=para_82A&doctype=Standard
-URIDate 2023-03-23
| Name: |
ifrs-full_OtherComprehensiveIncomeThatWillNotBeReclassifiedToProfitOrLossNetOfTax |
| Namespace Prefix: |
ifrs-full_ |
| Data Type: |
xbrli:monetaryItemType |
| Balance Type: |
credit |
| Period Type: |
duration |
|
| X |
- DefinitionThe gains (losses) that the entity does not separately disclose in the same statement or note. Reference 1: http://www.xbrl.org/2009/role/commonPracticeRef
-Name IAS
-Number 1
-IssueDate 2023-01-01
-Paragraph 102
-URI https://taxonomy.ifrs.org/xifrs-link?type=IAS&num=1&code=ifrs-tx-2023-en-r&anchor=para_102&doctype=Standard
-URIDate 2023-03-23
Reference 2: http://www.xbrl.org/2009/role/commonPracticeRef
-Name IAS
-Number 1
-IssueDate 2023-01-01
-Paragraph 103
-URI https://taxonomy.ifrs.org/xifrs-link?type=IAS&num=1&code=ifrs-tx-2023-en-r&anchor=para_103&doctype=Standard
-URIDate 2023-03-23
| Name: |
ifrs-full_OtherGainsLosses |
| Namespace Prefix: |
ifrs-full_ |
| Data Type: |
xbrli:monetaryItemType |
| Balance Type: |
credit |
| Period Type: |
duration |
|
| X |
- DefinitionThe profit (loss) from continuing operations attributable to ordinary equity holders of the parent entity. [Refer: Continuing operations [member]; Profit (loss) from continuing operations] Reference 1: http://www.xbrl.org/2003/role/disclosureRef
-Name IAS
-Number 33
-IssueDate 2023-01-01
-Paragraph 70
-Subparagraph a
-URI https://taxonomy.ifrs.org/xifrs-link?type=IAS&num=33&code=ifrs-tx-2023-en-r&anchor=para_70_a&doctype=Standard
-URIDate 2023-03-23
| Name: |
ifrs-full_ProfitLossFromContinuingOperationsAttributableToOrdinaryEquityHoldersOfParentEntity |
| Namespace Prefix: |
ifrs-full_ |
| Data Type: |
xbrli:monetaryItemType |
| Balance Type: |
credit |
| Period Type: |
duration |
|
| X |
- DefinitionThe income arising in the course of an entity's ordinary activities. Income is increases in assets, or decreases in liabilities, that result in increases in equity, other than those relating to contributions from holders of equity claims. Reference 1: http://www.xbrl.org/2003/role/disclosureRef
-Name IFRS
-Number 8
-IssueDate 2023-01-01
-Paragraph 28
-Subparagraph a
-URI https://taxonomy.ifrs.org/xifrs-link?type=IFRS&num=8&code=ifrs-tx-2023-en-r&anchor=para_28_a&doctype=Standard
-URIDate 2023-03-23
Reference 2: http://www.xbrl.org/2003/role/disclosureRef
-Name IFRS
-Number 8
-IssueDate 2023-01-01
-Paragraph 23
-Subparagraph a
-URI https://taxonomy.ifrs.org/xifrs-link?type=IFRS&num=8&code=ifrs-tx-2023-en-r&anchor=para_23_a&doctype=Standard
-URIDate 2023-03-23
Reference 3: http://www.xbrl.org/2003/role/disclosureRef
-Name IFRS
-Number 8
-IssueDate 2023-01-01
-Paragraph 32
-URI https://taxonomy.ifrs.org/xifrs-link?type=IFRS&num=8&code=ifrs-tx-2023-en-r&anchor=para_32&doctype=Standard
-URIDate 2023-03-23
Reference 4: http://www.xbrl.org/2003/role/disclosureRef
-Name IFRS
-Number 5
-IssueDate 2023-01-01
-Paragraph 33
-Subparagraph b
-Clause i
-URI https://taxonomy.ifrs.org/xifrs-link?type=IFRS&num=5&code=ifrs-tx-2023-en-r&anchor=para_33_b_i&doctype=Standard
-URIDate 2023-03-23
Reference 5: http://www.xbrl.org/2003/role/disclosureRef
-Name IFRS
-Number 8
-IssueDate 2023-01-01
-Paragraph 33
-Subparagraph a
-URI https://taxonomy.ifrs.org/xifrs-link?type=IFRS&num=8&code=ifrs-tx-2023-en-r&anchor=para_33_a&doctype=Standard
-URIDate 2023-03-23
Reference 6: http://www.xbrl.org/2003/role/disclosureRef
-Name IFRS
-Number 8
-IssueDate 2023-01-01
-Paragraph 34
-URI https://taxonomy.ifrs.org/xifrs-link?type=IFRS&num=8&code=ifrs-tx-2023-en-r&anchor=para_34&doctype=Standard
-URIDate 2023-03-23
Reference 7: http://www.xbrl.org/2003/role/disclosureRef
-Name IFRS
-Number 12
-IssueDate 2023-01-01
-Paragraph B12
-Subparagraph b
-Clause v
-URI https://taxonomy.ifrs.org/xifrs-link?type=IFRS&num=12&code=ifrs-tx-2023-en-r&anchor=para_B12_b_v&doctype=Appendix&subtype=B
-URIDate 2023-03-23
Reference 8: http://www.xbrl.org/2003/role/exampleRef
-Name IFRS
-Number 12
-IssueDate 2023-01-01
-Paragraph B10
-Subparagraph b
-URI https://taxonomy.ifrs.org/xifrs-link?type=IFRS&num=12&code=ifrs-tx-2023-en-r&anchor=para_B10_b&doctype=Appendix&subtype=B
-URIDate 2023-03-23
Reference 9: http://www.xbrl.org/2003/role/disclosureRef
-Name IAS
-Number 1
-IssueDate 2023-01-01
-Paragraph 82
-Subparagraph a
-URI https://taxonomy.ifrs.org/xifrs-link?type=IAS&num=1&code=ifrs-tx-2023-en-r&anchor=para_82_a&doctype=Standard
-URIDate 2023-03-23
Reference 10: http://www.xbrl.org/2003/role/exampleRef
-Name IAS
-Number 1
-IssueDate 2023-01-01
-Paragraph 103
-URI https://taxonomy.ifrs.org/xifrs-link?type=IAS&num=1&code=ifrs-tx-2023-en-r&anchor=para_103&doctype=Standard
-URIDate 2023-03-23
Reference 11: http://www.xbrl.org/2003/role/exampleRef
-Name IAS
-Number 1
-IssueDate 2023-01-01
-Paragraph 102
-URI https://taxonomy.ifrs.org/xifrs-link?type=IAS&num=1&code=ifrs-tx-2023-en-r&anchor=para_102&doctype=Standard
-URIDate 2023-03-23
| Name: |
ifrs-full_Revenue |
| Namespace Prefix: |
ifrs-full_ |
| Data Type: |
xbrli:monetaryItemType |
| Balance Type: |
credit |
| Period Type: |
duration |
|
| X |
- DefinitionThe amount that represents the difference between the tax expense (income) and the product of the accounting profit multiplied by the applicable tax rate(s) that relates to foreign tax rates. [Refer: Accounting profit] Reference 1: http://www.xbrl.org/2003/role/disclosureRef
-Name IAS
-Number 12
-IssueDate 2023-01-01
-Paragraph 81
-Subparagraph c
-Clause i
-URI https://taxonomy.ifrs.org/xifrs-link?type=IAS&num=12&code=ifrs-tx-2023-en-r&anchor=para_81_c_i&doctype=Standard
-URIDate 2023-03-23
| Name: |
ifrs-full_TaxEffectOfForeignTaxRates |
| Namespace Prefix: |
ifrs-full_ |
| Data Type: |
xbrli:monetaryItemType |
| Balance Type: |
debit |
| Period Type: |
duration |
|
| X |
- DefinitionThe consolidated profit or loss for the period, net of income taxes, including the portion attributable to the noncontrolling interest. Reference 1: http://www.xbrl.org/2003/role/disclosureRef
-Topic 235
-SubTopic 10
-Name Accounting Standards Codification
-Section S99
-Paragraph 1
-Subparagraph (SX 210.4-08(g)(1)(ii))
-Publisher FASB
-URI https://asc.fasb.org//1943274/2147480678/235-10-S99-1
Reference 2: http://www.xbrl.org/2003/role/disclosureRef
-Topic 323
-SubTopic 10
-Name Accounting Standards Codification
-Section 50
-Paragraph 3
-Subparagraph (c)
-Publisher FASB
-URI https://asc.fasb.org//1943274/2147481687/323-10-50-3
Reference 3: http://www.xbrl.org/2003/role/disclosureRef
-Topic 825
-SubTopic 10
-Name Accounting Standards Codification
-Section 50
-Paragraph 28
-Subparagraph (f)
-Publisher FASB
-URI https://asc.fasb.org//1943274/2147482907/825-10-50-28
Reference 4: http://www.xbrl.org/2003/role/disclosureRef
-Topic 250
-SubTopic 10
-Name Accounting Standards Codification
-Section 50
-Paragraph 1
-Subparagraph (b)(2)
-Publisher FASB
-URI https://asc.fasb.org//1943274/2147483443/250-10-50-1
Reference 5: http://www.xbrl.org/2003/role/disclosureRef
-Topic 815
-SubTopic 40
-Name Accounting Standards Codification
-Section 65
-Paragraph 1
-Subparagraph (f)
-Publisher FASB
-URI https://asc.fasb.org//1943274/2147480175/815-40-65-1
Reference 6: http://www.xbrl.org/2003/role/disclosureRef
-Topic 250
-SubTopic 10
-Name Accounting Standards Codification
-Section 50
-Paragraph 8
-Publisher FASB
-URI https://asc.fasb.org//1943274/2147483443/250-10-50-8
Reference 7: http://www.xbrl.org/2003/role/disclosureRef
-Topic 250
-SubTopic 10
-Name Accounting Standards Codification
-Section 50
-Paragraph 9
-Publisher FASB
-URI https://asc.fasb.org//1943274/2147483443/250-10-50-9
Reference 8: http://www.xbrl.org/2003/role/exampleRef
-Topic 946
-SubTopic 830
-Name Accounting Standards Codification
-Section 55
-Paragraph 11
-Publisher FASB
-URI https://asc.fasb.org//1943274/2147480167/946-830-55-11
Reference 9: http://www.xbrl.org/2003/role/disclosureRef
-Topic 946
-SubTopic 205
-Name Accounting Standards Codification
-Section 45
-Paragraph 3
-Subparagraph (a)
-Publisher FASB
-URI https://asc.fasb.org//1943274/2147480767/946-205-45-3
Reference 10: http://www.xbrl.org/2003/role/disclosureRef
-Topic 946
-SubTopic 220
-Name Accounting Standards Codification
-Section 45
-Paragraph 7
-Publisher FASB
-URI https://asc.fasb.org//1943274/2147483581/946-220-45-7
Reference 11: http://www.xbrl.org/2003/role/disclosureRef
-Topic 944
-SubTopic 220
-Name Accounting Standards Codification
-Section S99
-Paragraph 1
-Subparagraph (SX 210.7-04(16))
-Publisher FASB
-URI https://asc.fasb.org//1943274/2147483586/944-220-S99-1
Reference 12: http://www.xbrl.org/2003/role/disclosureRef
-Topic 280
-SubTopic 10
-Name Accounting Standards Codification
-Section 50
-Paragraph 22
-Publisher FASB
-URI https://asc.fasb.org//1943274/2147482810/280-10-50-22
Reference 13: http://www.xbrl.org/2003/role/disclosureRef
-Topic 946
-SubTopic 220
-Name Accounting Standards Codification
-Section S99
-Paragraph 1
-Subparagraph (SX 210.6-07(9))
-Publisher FASB
-URI https://asc.fasb.org//1943274/2147483575/946-220-S99-1
Reference 14: http://www.xbrl.org/2003/role/disclosureRef
-Topic 946
-SubTopic 220
-Name Accounting Standards Codification
-Section S99
-Paragraph 3
-Subparagraph (SX 210.6-09(1)(d))
-Publisher FASB
-URI https://asc.fasb.org//1943274/2147483575/946-220-S99-3
Reference 15: http://www.xbrl.org/2003/role/disclosureRef
-Topic 810
-SubTopic 10
-Name Accounting Standards Codification
-Section 45
-Paragraph 19
-Publisher FASB
-URI https://asc.fasb.org//1943274/2147481231/810-10-45-19
Reference 16: http://www.xbrl.org/2009/role/commonPracticeRef
-Topic 220
-SubTopic 10
-Name Accounting Standards Codification
-Section 50
-Paragraph 6
-Publisher FASB
-URI https://asc.fasb.org//1943274/2147482765/220-10-50-6
Reference 17: http://www.xbrl.org/2003/role/disclosureRef
-Topic 470
-SubTopic 10
-Name Accounting Standards Codification
-Section S99
-Paragraph 1A
-Subparagraph (SX 210.13-01(a)(4)(i))
-Publisher FASB
-URI https://asc.fasb.org//1943274/2147480097/470-10-S99-1A
Reference 18: http://www.xbrl.org/2009/role/commonPracticeRef
-Topic 470
-SubTopic 10
-Name Accounting Standards Codification
-Section S99
-Paragraph 1A
-Subparagraph (SX 210.13-01(a)(4)(ii))
-Publisher FASB
-URI https://asc.fasb.org//1943274/2147480097/470-10-S99-1A
Reference 19: http://www.xbrl.org/2003/role/disclosureRef
-Topic 470
-SubTopic 10
-Name Accounting Standards Codification
-Section S99
-Paragraph 1A
-Subparagraph (SX 210.13-01(a)(4)(iii)(A))
-Publisher FASB
-URI https://asc.fasb.org//1943274/2147480097/470-10-S99-1A
Reference 20: http://www.xbrl.org/2003/role/disclosureRef
-Topic 470
-SubTopic 10
-Name Accounting Standards Codification
-Section S99
-Paragraph 1A
-Subparagraph (SX 210.13-01(a)(4)(iv))
-Publisher FASB
-URI https://asc.fasb.org//1943274/2147480097/470-10-S99-1A
Reference 21: http://www.xbrl.org/2003/role/disclosureRef
-Topic 470
-SubTopic 10
-Name Accounting Standards Codification
-Section S99
-Paragraph 1A
-Subparagraph (SX 210.13-01(a)(5))
-Publisher FASB
-URI https://asc.fasb.org//1943274/2147480097/470-10-S99-1A
Reference 22: http://www.xbrl.org/2003/role/disclosureRef
-Topic 470
-SubTopic 10
-Name Accounting Standards Codification
-Section S99
-Paragraph 1B
-Subparagraph (SX 210.13-02(a)(4)(i))
-Publisher FASB
-URI https://asc.fasb.org//1943274/2147480097/470-10-S99-1B
Reference 23: http://www.xbrl.org/2003/role/disclosureRef
-Topic 470
-SubTopic 10
-Name Accounting Standards Codification
-Section S99
-Paragraph 1B
-Subparagraph (SX 210.13-02(a)(4)(iii)(A))
-Publisher FASB
-URI https://asc.fasb.org//1943274/2147480097/470-10-S99-1B
Reference 24: http://www.xbrl.org/2003/role/disclosureRef
-Topic 470
-SubTopic 10
-Name Accounting Standards Codification
-Section S99
-Paragraph 1B
-Subparagraph (SX 210.13-02(a)(4)(iii)(B))
-Publisher FASB
-URI https://asc.fasb.org//1943274/2147480097/470-10-S99-1B
Reference 25: http://www.xbrl.org/2003/role/disclosureRef
-Topic 470
-SubTopic 10
-Name Accounting Standards Codification
-Section S99
-Paragraph 1B
-Subparagraph (SX 210.13-02(a)(4)(iv))
-Publisher FASB
-URI https://asc.fasb.org//1943274/2147480097/470-10-S99-1B
Reference 26: http://www.xbrl.org/2003/role/disclosureRef
-Topic 470
-SubTopic 10
-Name Accounting Standards Codification
-Section S99
-Paragraph 1B
-Subparagraph (SX 210.13-02(a)(5))
-Publisher FASB
-URI https://asc.fasb.org//1943274/2147480097/470-10-S99-1B
Reference 27: http://www.xbrl.org/2003/role/disclosureRef
-Topic 280
-SubTopic 10
-Name Accounting Standards Codification
-Section 50
-Paragraph 30
-Subparagraph (b)
-Publisher FASB
-URI https://asc.fasb.org//1943274/2147482810/280-10-50-30
Reference 28: http://www.xbrl.org/2003/role/disclosureRef
-Topic 280
-SubTopic 10
-Name Accounting Standards Codification
-Section 50
-Paragraph 32
-Subparagraph (f)
-Publisher FASB
-URI https://asc.fasb.org//1943274/2147482810/280-10-50-32
Reference 29: http://www.xbrl.org/2003/role/exampleRef
-Topic 280
-SubTopic 10
-Name Accounting Standards Codification
-Section 50
-Paragraph 31
-Publisher FASB
-URI https://asc.fasb.org//1943274/2147482810/280-10-50-31
Reference 30: http://www.xbrl.org/2003/role/disclosureRef
-Topic 280
-SubTopic 10
-Name Accounting Standards Codification
-Section 50
-Paragraph 32
-Subparagraph (c)
-Publisher FASB
-URI https://asc.fasb.org//1943274/2147482810/280-10-50-32
Reference 31: http://www.xbrl.org/2003/role/disclosureRef
-Topic 942
-SubTopic 235
-Name Accounting Standards Codification
-Section S99
-Paragraph 1
-Subparagraph (SX 210.9-05(b)(2))
-Publisher FASB
-URI https://asc.fasb.org//1943274/2147479557/942-235-S99-1
Reference 32: http://www.xbrl.org/2003/role/disclosureRef
-Topic 205
-SubTopic 20
-Name Accounting Standards Codification
-Section 50
-Paragraph 7
-Publisher FASB
-URI https://asc.fasb.org//1943274/2147483499/205-20-50-7
Reference 33: http://www.xbrl.org/2003/role/exampleRef
-Topic 810
-SubTopic 10
-Name Accounting Standards Codification
-Section 55
-Paragraph 4J
-Publisher FASB
-URI https://asc.fasb.org//1943274/2147481175/810-10-55-4J
Reference 34: http://www.xbrl.org/2003/role/exampleRef
-Topic 810
-SubTopic 10
-Name Accounting Standards Codification
-Section 55
-Paragraph 4K
-Publisher FASB
-URI https://asc.fasb.org//1943274/2147481175/810-10-55-4K
Reference 35: http://www.xbrl.org/2003/role/disclosureRef
-Topic 220
-SubTopic 10
-Name Accounting Standards Codification
-Section 45
-Paragraph 1A
-Subparagraph (a)
-Publisher FASB
-URI https://asc.fasb.org//1943274/2147482790/220-10-45-1A
Reference 36: http://www.xbrl.org/2003/role/disclosureRef
-Topic 220
-SubTopic 10
-Name Accounting Standards Codification
-Section 45
-Paragraph 1B
-Subparagraph (a)
-Publisher FASB
-URI https://asc.fasb.org//1943274/2147482790/220-10-45-1B
Reference 37: http://www.xbrl.org/2003/role/disclosureRef
-Topic 230
-SubTopic 10
-Name Accounting Standards Codification
-Section 45
-Paragraph 2
-Publisher FASB
-URI https://asc.fasb.org//1943274/2147482740/230-10-45-2
Reference 38: http://www.xbrl.org/2003/role/disclosureRef
-Topic 810
-SubTopic 10
-Name Accounting Standards Codification
-Section 50
-Paragraph 1A
-Subparagraph (a)(1)
-Publisher FASB
-URI https://asc.fasb.org//1943274/2147481203/810-10-50-1A
Reference 39: http://www.xbrl.org/2003/role/disclosureRef
-Topic 810
-SubTopic 10
-Name Accounting Standards Codification
-Section 50
-Paragraph 1A
-Subparagraph (c)(1)
-Publisher FASB
-URI https://asc.fasb.org//1943274/2147481203/810-10-50-1A
| Name: |
us-gaap_ProfitLoss |
| Namespace Prefix: |
us-gaap_ |
| Data Type: |
xbrli:monetaryItemType |
| Balance Type: |
credit |
| Period Type: |
duration |
|
| X |
- Details
| Name: |
gfai_OperatingLossAxis=gfai_OperatingLossMember |
| Namespace Prefix: |
|
| Data Type: |
na |
| Balance Type: |
|
| Period Type: |
|
|
| X |
- Details
| Name: |
ifrs-full_TypesOfSharebasedPaymentArrangementsAxis=gfai_SecuredLogisticsMember |
| Namespace Prefix: |
|
| Data Type: |
na |
| Balance Type: |
|
| Period Type: |
|
|
| X |
- Details
| Name: |
ifrs-full_TypesOfHedgesAxis=gfai_ForeignExchangeLossesNetMember |
| Namespace Prefix: |
|
| Data Type: |
na |
| Balance Type: |
|
| Period Type: |
|
|
| X |
- Details
| Name: |
ifrs-full_TypesOfHedgesAxis=gfai_FinanceCostsMember |
| Namespace Prefix: |
|
| Data Type: |
na |
| Balance Type: |
|
| Period Type: |
|
|
| X |
- Details
| Name: |
ifrs-full_TypesOfSharebasedPaymentArrangementsAxis=gfai_RoboticsAISolutionsMember |
| Namespace Prefix: |
|
| Data Type: |
na |
| Balance Type: |
|
| Period Type: |
|
|
| X |
- Details
| Name: |
ifrs-full_TypesOfSharebasedPaymentArrangementsAxis=gfai_GeneralSecuritySolutionsMember |
| Namespace Prefix: |
|
| Data Type: |
na |
| Balance Type: |
|
| Period Type: |
|
|
| X |
- Details
| Name: |
ifrs-full_TypesOfSharebasedPaymentArrangementsAxis=gfai_CorporateAndOthersMember |
| Namespace Prefix: |
|
| Data Type: |
na |
| Balance Type: |
|
| Period Type: |
|
|
| X |
- Details
| Name: |
gfai_RevenueAxis=gfai_RevenueMember |
| Namespace Prefix: |
|
| Data Type: |
na |
| Balance Type: |
|
| Period Type: |
|
|
v3.23.3
Consolidated Segment Data (Details) - Schedule of Depreciation and Amortization by Segment - USD ($)
|
6 Months Ended |
Jun. 30, 2023 |
Jun. 30, 2022 |
| Schedule of Depreciation and Amortization by Segment [Abstract] |
|
|
| Total depreciation and amortization |
$ 2,436,330
|
$ 2,697,378
|
| Secured logistics [Member] |
|
|
| Schedule of Depreciation and Amortization by Segment [Abstract] |
|
|
| Total depreciation and amortization |
1,570,069
|
1,887,059
|
| Robotics AI solutions [Member] |
|
|
| Schedule of Depreciation and Amortization by Segment [Abstract] |
|
|
| Total depreciation and amortization |
741,548
|
810,319
|
| General security solutions [Member] |
|
|
| Schedule of Depreciation and Amortization by Segment [Abstract] |
|
|
| Total depreciation and amortization |
$ 124,713
|
|
| X |
- References
+ Details
| Name: |
gfai_ConsolidatedSegmentDataDetailsScheduleofDepreciationandAmortizationbySegmentLineItems |
| Namespace Prefix: |
gfai_ |
| Data Type: |
xbrli:stringItemType |
| Balance Type: |
na |
| Period Type: |
duration |
|
| X |
- DefinitionTotal depreciation and amortization.
| Name: |
gfai_TotalDepreciationAndAmortization |
| Namespace Prefix: |
gfai_ |
| Data Type: |
xbrli:monetaryItemType |
| Balance Type: |
debit |
| Period Type: |
duration |
|
| X |
- Details
| Name: |
ifrs-full_TypesOfSharebasedPaymentArrangementsAxis=gfai_SecuredLogisticsMember |
| Namespace Prefix: |
|
| Data Type: |
na |
| Balance Type: |
|
| Period Type: |
|
|
| X |
- Details
| Name: |
ifrs-full_TypesOfSharebasedPaymentArrangementsAxis=gfai_RoboticsAISolutionsMember |
| Namespace Prefix: |
|
| Data Type: |
na |
| Balance Type: |
|
| Period Type: |
|
|
| X |
- Details
| Name: |
ifrs-full_TypesOfSharebasedPaymentArrangementsAxis=gfai_GeneralSecuritySolutionsMember |
| Namespace Prefix: |
|
| Data Type: |
na |
| Balance Type: |
|
| Period Type: |
|
|
v3.23.3
Consolidated Segment Data (Details) - Schedule of Total Assets by Segment - USD ($)
|
Jun. 30, 2023 |
Dec. 31, 2022 |
| Schedule of Total Assets by Segment [Abstract] |
|
|
| Total assets |
$ 64,094,702
|
$ 61,166,974
|
| Secured logistics [Member] |
|
|
| Schedule of Total Assets by Segment [Abstract] |
|
|
| Total assets |
22,854,857
|
25,315,845
|
| Information security [Member] |
|
|
| Schedule of Total Assets by Segment [Abstract] |
|
|
| Total assets |
199,259
|
615,517
|
| Robotics AI solutions [Member] |
|
|
| Schedule of Total Assets by Segment [Abstract] |
|
|
| Total assets |
17,330,745
|
23,577,547
|
| General security solutions [Member] |
|
|
| Schedule of Total Assets by Segment [Abstract] |
|
|
| Total assets |
2,296,882
|
4,260,811
|
| Corporate and others [Member] |
|
|
| Schedule of Total Assets by Segment [Abstract] |
|
|
| Total assets |
$ 21,412,959
|
$ 7,397,254
|
| X |
- References
+ Details
| Name: |
gfai_ConsolidatedSegmentDataDetailsScheduleofTotalAssetsbySegmentLineItems |
| Namespace Prefix: |
gfai_ |
| Data Type: |
xbrli:stringItemType |
| Balance Type: |
na |
| Period Type: |
duration |
|
| X |
- DefinitionThe amount of financial assets that the entity does not separately disclose in the same statement or note. [Refer: Financial assets] Reference 1: http://www.xbrl.org/2003/role/disclosureRef
-Name IAS
-Number 1
-IssueDate 2023-01-01
-Paragraph 54
-Subparagraph d
-URI https://taxonomy.ifrs.org/xifrs-link?type=IAS&num=1&code=ifrs-tx-2023-en-r&anchor=para_54_d&doctype=Standard
-URIDate 2023-03-23
| Name: |
ifrs-full_OtherFinancialAssets |
| Namespace Prefix: |
ifrs-full_ |
| Data Type: |
xbrli:monetaryItemType |
| Balance Type: |
debit |
| Period Type: |
instant |
|
| X |
- Details
| Name: |
ifrs-full_TypesOfSharebasedPaymentArrangementsAxis=gfai_SecuredLogisticsMember |
| Namespace Prefix: |
|
| Data Type: |
na |
| Balance Type: |
|
| Period Type: |
|
|
| X |
- Details
| Name: |
ifrs-full_TypesOfSharebasedPaymentArrangementsAxis=gfai_RoboticsAISolutionsMember |
| Namespace Prefix: |
|
| Data Type: |
na |
| Balance Type: |
|
| Period Type: |
|
|
| X |
- Details
| Name: |
ifrs-full_TypesOfSharebasedPaymentArrangementsAxis=gfai_GeneralSecuritySolutionsMember |
| Namespace Prefix: |
|
| Data Type: |
na |
| Balance Type: |
|
| Period Type: |
|
|
| X |
- Details
| Name: |
ifrs-full_TypesOfSharebasedPaymentArrangementsAxis=gfai_CorporateAndOthersMember |
| Namespace Prefix: |
|
| Data Type: |
na |
| Balance Type: |
|
| Period Type: |
|
|
v3.23.3
Consolidated Segment Data (Details) - Schedule of Total Non-current Assets by Geographical Segment - USD ($)
|
Jun. 30, 2023 |
Dec. 31, 2022 |
| Schedule of Total Non-current Assets by Geographical Segment [Abstract] |
|
|
| Total non-current assets |
$ 21,940,828
|
$ 25,903,910
|
| Hong Kong and Macau [Member] |
|
|
| Schedule of Total Non-current Assets by Geographical Segment [Abstract] |
|
|
| Total non-current assets |
11,762,228
|
11,234,176
|
| Thailand [Member] |
|
|
| Schedule of Total Non-current Assets by Geographical Segment [Abstract] |
|
|
| Total non-current assets |
9,774,623
|
14,223,714
|
| Other countries [Member] |
|
|
| Schedule of Total Non-current Assets by Geographical Segment [Abstract] |
|
|
| Total non-current assets |
$ 403,977
|
$ 446,020
|
| X |
- References
+ Details
| Name: |
gfai_ConsolidatedSegmentDataDetailsScheduleofTotalNoncurrentAssetsbyGeographicalSegmentLineItems |
| Namespace Prefix: |
gfai_ |
| Data Type: |
xbrli:stringItemType |
| Balance Type: |
na |
| Period Type: |
duration |
|
| X |
- DefinitionThe amount of non-current assets that the entity does not separately disclose in the same statement or note. [Refer: Non-current assets] Reference 1: http://www.xbrl.org/2009/role/commonPracticeRef
-Name IAS
-Number 1
-IssueDate 2023-01-01
-Paragraph 55
-URI https://taxonomy.ifrs.org/xifrs-link?type=IAS&num=1&code=ifrs-tx-2023-en-r&anchor=para_55&doctype=Standard
-URIDate 2023-03-23
| Name: |
ifrs-full_OtherNoncurrentAssets |
| Namespace Prefix: |
ifrs-full_ |
| Data Type: |
xbrli:monetaryItemType |
| Balance Type: |
debit |
| Period Type: |
instant |
|
| X |
- Details
| Name: |
ifrs-full_GeographicalAreasAxis=country_HK |
| Namespace Prefix: |
|
| Data Type: |
na |
| Balance Type: |
|
| Period Type: |
|
|
| X |
- Details
| Name: |
ifrs-full_GeographicalAreasAxis=gfai_THMember |
| Namespace Prefix: |
|
| Data Type: |
na |
| Balance Type: |
|
| Period Type: |
|
|
| X |
- Details
| Name: |
ifrs-full_GeographicalAreasAxis=gfai_OtherCountriesMember |
| Namespace Prefix: |
|
| Data Type: |
na |
| Balance Type: |
|
| Period Type: |
|
|
v3.23.3
Consolidated Segment Data (Details) - Schedule of Total liabilities by Segment - USD ($)
|
Jun. 30, 2023 |
Dec. 31, 2022 |
| Schedule of Total liabilities by segment [Abstract] |
|
|
| Total liabilities |
$ 39,091,609
|
$ 42,034,672
|
| Secured logistics [Member] |
|
|
| Schedule of Total liabilities by segment [Abstract] |
|
|
| Total liabilities |
12,850,116
|
28,789,053
|
| Information security [Member] |
|
|
| Schedule of Total liabilities by segment [Abstract] |
|
|
| Total liabilities |
143,919
|
238,229
|
| Robotics AI solutions [Member] |
|
|
| Schedule of Total liabilities by segment [Abstract] |
|
|
| Total liabilities |
4,477,486
|
4,580,740
|
| General security solutions [Member] |
|
|
| Schedule of Total liabilities by segment [Abstract] |
|
|
| Total liabilities |
1,425,037
|
1,661,469
|
| Corporate and others [Member] |
|
|
| Schedule of Total liabilities by segment [Abstract] |
|
|
| Total liabilities |
$ 20,195,051
|
$ 6,765,181
|
| X |
- References
+ Details
| Name: |
gfai_ConsolidatedSegmentDataDetailsScheduleofTotalliabilitiesbySegmentLineItems |
| Namespace Prefix: |
gfai_ |
| Data Type: |
xbrli:stringItemType |
| Balance Type: |
na |
| Period Type: |
duration |
|
| X |
- DefinitionThe amount of financial liabilities that the entity does not separately disclose in the same statement or note. [Refer: Financial liabilities] Reference 1: http://www.xbrl.org/2003/role/disclosureRef
-Name IAS
-Number 1
-IssueDate 2023-01-01
-Paragraph 54
-Subparagraph m
-URI https://taxonomy.ifrs.org/xifrs-link?type=IAS&num=1&code=ifrs-tx-2023-en-r&anchor=para_54_m&doctype=Standard
-URIDate 2023-03-23
| Name: |
ifrs-full_OtherFinancialLiabilities |
| Namespace Prefix: |
ifrs-full_ |
| Data Type: |
xbrli:monetaryItemType |
| Balance Type: |
credit |
| Period Type: |
instant |
|
| X |
- Details
| Name: |
ifrs-full_TypesOfSharebasedPaymentArrangementsAxis=gfai_SecuredLogisticsMember |
| Namespace Prefix: |
|
| Data Type: |
na |
| Balance Type: |
|
| Period Type: |
|
|
| X |
- Details
| Name: |
ifrs-full_TypesOfSharebasedPaymentArrangementsAxis=gfai_RoboticsAISolutionsMember |
| Namespace Prefix: |
|
| Data Type: |
na |
| Balance Type: |
|
| Period Type: |
|
|
| X |
- Details
| Name: |
ifrs-full_TypesOfSharebasedPaymentArrangementsAxis=gfai_GeneralSecuritySolutionsMember |
| Namespace Prefix: |
|
| Data Type: |
na |
| Balance Type: |
|
| Period Type: |
|
|
| X |
- Details
| Name: |
ifrs-full_TypesOfSharebasedPaymentArrangementsAxis=gfai_CorporateAndOthersMember |
| Namespace Prefix: |
|
| Data Type: |
na |
| Balance Type: |
|
| Period Type: |
|
|
v3.23.3
| X |
- DefinitionAmount of bank guarantees.
| Name: |
gfai_BankGuarantees |
| Namespace Prefix: |
gfai_ |
| Data Type: |
xbrli:monetaryItemType |
| Balance Type: |
credit |
| Period Type: |
instant |
|
| X |
- References
+ Details
| Name: |
gfai_CommitmentsandContingenciesDetailsLineItems |
| Namespace Prefix: |
gfai_ |
| Data Type: |
xbrli:stringItemType |
| Balance Type: |
na |
| Period Type: |
duration |
|
| X |
- DefinitionMinimum period the individual is required to perform services to be fully vested under the deferred compensation arrangement, in 'PnYnMnDTnHnMnS' format, for example, 'P1Y5M13D' represents the reported fact of one year, five months, and thirteen days.
| Name: |
gfai_DeferredCompensationArrangementWithIndividualRequisiteServicePeriod |
| Namespace Prefix: |
gfai_ |
| Data Type: |
xbrli:durationItemType |
| Balance Type: |
na |
| Period Type: |
duration |
|
| X |
- DefinitionEmployment agreement description.
| Name: |
gfai_EmploymentAgreementDescription |
| Namespace Prefix: |
gfai_ |
| Data Type: |
xbrli:stringItemType |
| Balance Type: |
na |
| Period Type: |
duration |
|
| X |
- DefinitionLitigation totaling amount.
| Name: |
gfai_LitigationTotalingAmount |
| Namespace Prefix: |
gfai_ |
| Data Type: |
xbrli:monetaryItemType |
| Balance Type: |
credit |
| Period Type: |
instant |
|
v3.23.3
| X |
- References
+ Details
| Name: |
gfai_CommitmentsandContingenciesDetailsScheduleofFuturePaymentsforEmploymentAgreementsLineItems |
| Namespace Prefix: |
gfai_ |
| Data Type: |
xbrli:stringItemType |
| Balance Type: |
na |
| Period Type: |
duration |
|
| X |
- DefinitionAmount of employment agreement future minimum payments due in next year.
| Name: |
gfai_EmploymentAgreementFutureMinimumPaymentsDueInNextYear |
| Namespace Prefix: |
gfai_ |
| Data Type: |
xbrli:monetaryItemType |
| Balance Type: |
credit |
| Period Type: |
instant |
|
| X |
- References
+ Details
| Name: |
gfai_EmploymentAgreementFutureMinimumPaymentsDueInThreeYears |
| Namespace Prefix: |
gfai_ |
| Data Type: |
xbrli:monetaryItemType |
| Balance Type: |
credit |
| Period Type: |
instant |
|
| X |
- References
+ Details
| Name: |
gfai_EmploymentAgreementFutureMinimumPaymentsDueInTwoYears |
| Namespace Prefix: |
gfai_ |
| Data Type: |
xbrli:monetaryItemType |
| Balance Type: |
credit |
| Period Type: |
instant |
|
| X |
- References
+ Details
| Name: |
gfai_FuturePaymentsForEmploymentAgreementsTotalMinimumPaymentRequired |
| Namespace Prefix: |
gfai_ |
| Data Type: |
xbrli:monetaryItemType |
| Balance Type: |
credit |
| Period Type: |
instant |
|
v3.23.3
Commitments and Contingencies (Details) - Schedule of Contracted Expenditures Commitments
|
Jun. 30, 2023
USD ($)
|
| Schedule of Contracted Expenditures Commitments [Abstract] |
|
|
| Service fee commitments |
$ 56,644
|
[1] |
| Operating lease commitments |
3,589,243
|
[2] |
| Purchase commitments |
3,106,786
|
[3] |
| Total |
6,752,673
|
|
| Less than 1 year [Member] |
|
|
| Schedule of Contracted Expenditures Commitments [Abstract] |
|
|
| Service fee commitments |
56,644
|
[1] |
| Operating lease commitments |
1,924,149
|
[2] |
| Purchase commitments |
3,106,786
|
[3] |
| Total |
5,087,579
|
|
| 1-3 years [Member] |
|
|
| Schedule of Contracted Expenditures Commitments [Abstract] |
|
|
| Service fee commitments |
|
[1] |
| Operating lease commitments |
1,645,840
|
[2] |
| Purchase commitments |
|
[3] |
| Total |
1,645,840
|
|
| 4-5 years [Member] |
|
|
| Schedule of Contracted Expenditures Commitments [Abstract] |
|
|
| Service fee commitments |
|
[1] |
| Operating lease commitments |
19,254
|
[2] |
| Purchase commitments |
|
[3] |
| Total |
19,254
|
|
| More than 5 years [Member] |
|
|
| Schedule of Contracted Expenditures Commitments [Abstract] |
|
|
| Service fee commitments |
|
[1] |
| Operating lease commitments |
|
[2] |
| Purchase commitments |
|
[3] |
| Total |
|
|
|
|
| X |
- References
+ Details
| Name: |
gfai_CommitmentsandContingenciesDetailsScheduleofContractedExpendituresCommitmentsLineItems |
| Namespace Prefix: |
gfai_ |
| Data Type: |
xbrli:stringItemType |
| Balance Type: |
na |
| Period Type: |
duration |
|
| X |
- DefinitionAmount of operating lease commitments.
| Name: |
gfai_OperatingLeaseCommitments |
| Namespace Prefix: |
gfai_ |
| Data Type: |
xbrli:monetaryItemType |
| Balance Type: |
credit |
| Period Type: |
instant |
|
| X |
- DefinitionAmount of purchase commitments.
| Name: |
gfai_PurchaseCommitments |
| Namespace Prefix: |
gfai_ |
| Data Type: |
xbrli:monetaryItemType |
| Balance Type: |
credit |
| Period Type: |
instant |
|
| X |
- Definition
+ References
+ Details
| Name: |
gfai_ServiceFeeCommitments |
| Namespace Prefix: |
gfai_ |
| Data Type: |
xbrli:monetaryItemType |
| Balance Type: |
credit |
| Period Type: |
instant |
|
| X |
- DefinitionThe amount of contractual commitments for the acquisition of intangible assets. Reference 1: http://www.xbrl.org/2003/role/disclosureRef
-Name IAS
-Number 38
-IssueDate 2023-01-01
-Paragraph 122
-Subparagraph e
-URI https://taxonomy.ifrs.org/xifrs-link?type=IAS&num=38&code=ifrs-tx-2023-en-r&anchor=para_122_e&doctype=Standard
-URIDate 2023-03-23
| Name: |
ifrs-full_ContractualCommitmentsForAcquisitionOfIntangibleAssets |
| Namespace Prefix: |
ifrs-full_ |
| Data Type: |
xbrli:monetaryItemType |
| Balance Type: |
credit |
| Period Type: |
instant |
|
| X |
- Details
| Name: |
ifrs-full_MaturityAxis=ifrs-full_NotLaterThanOneYearMember |
| Namespace Prefix: |
|
| Data Type: |
na |
| Balance Type: |
|
| Period Type: |
|
|
| X |
- Details
| Name: |
ifrs-full_MaturityAxis=ifrs-full_LaterThanOneYearAndNotLaterThanTwoYearsMember |
| Namespace Prefix: |
|
| Data Type: |
na |
| Balance Type: |
|
| Period Type: |
|
|
| X |
- Details
| Name: |
ifrs-full_MaturityAxis=ifrs-full_LaterThanThreeYearsAndNotLaterThanFiveYearsMember |
| Namespace Prefix: |
|
| Data Type: |
na |
| Balance Type: |
|
| Period Type: |
|
|
| X |
- Details
| Name: |
ifrs-full_MaturityAxis=ifrs-full_LaterThanFiveYearsMember |
| Namespace Prefix: |
|
| Data Type: |
na |
| Balance Type: |
|
| Period Type: |
|
|
Grounded Lithium (PK) (USOTC:GRDAF)
Historical Stock Chart
From Feb 2025 to Mar 2025
 Charts.")
Grounded Lithium (PK) (USOTC:GRDAF)
Historical Stock Chart
From Mar 2024 to Mar 2025
 Charts.")
