Q.E.P. CO., INC. Reports Fiscal 2016 Results of Operations
20 May 2016 - 6:39AM

Net Sales - $309.2
Million Net Income - $4.0 Million or $1.23
Per Diluted Share
Q.E.P. CO., INC. (OTC:QEPC.PK) (the
“Company”) today reported its consolidated results of operations
for the fiscal year ended February 29, 2016:
| |
|
|
|
|
|
| |
Q.E.P. CO., INC. AND SUBSIDIARIES |
|
| |
CONSOLIDATED STATEMENTS OF
EARNINGS |
|
| |
(In thousands except per share data) |
|
| |
|
|
|
|
|
| |
|
For the Year Ended |
|
| |
|
February 29, |
|
February 28, |
|
| |
|
|
2016 |
|
|
|
2015 |
|
|
| |
|
|
|
|
|
| |
Net
sales |
$ |
309,237 |
|
|
$ |
297,666 |
|
|
| |
Cost of
goods sold |
|
227,698 |
|
|
|
217,820 |
|
|
| |
Gross
profit |
|
81,539 |
|
|
|
79,846 |
|
|
| |
Operating expenses |
|
73,546 |
|
|
|
75,621 |
|
|
| |
Operating income |
|
7,993 |
|
|
|
4,225 |
|
|
| |
Interest
expense, net |
|
(1,152 |
) |
|
|
(1,347 |
) |
|
| |
Income
before provision for income taxes |
|
6,841 |
|
|
|
2,878 |
|
|
| |
Provision for income taxes |
|
2,865 |
|
|
|
1,018 |
|
|
| |
Net
income |
$ |
3,976 |
|
|
$ |
1,860 |
|
|
| |
|
|
|
|
|
|
|
|
|
| |
Net
income per share: |
|
|
|
|
|
|
|
|
| |
Basic |
$ |
1.24 |
|
|
$ |
0.57 |
|
|
| |
Diluted |
$ |
1.23 |
|
|
$ |
0.57 |
|
|
| |
|
|
|
|
|
|
|
|
|
| |
Weighted average number of
common |
|
|
|
|
|
|
|
|
| |
shares outstanding: |
|
|
|
|
|
|
|
|
| |
Basic |
|
3,206 |
|
|
|
3,237 |
|
|
| |
Diluted |
|
3,228 |
|
|
|
3,261 |
|
|
| |
|
|
|
|
|
Lewis Gould, Chairman of the Board, commented, “Your Company has
grown this year in the face of many challenges. We have worked
diligently to achieve profit improvement through increases in sales
and lowering of operating expenses, globally. Our
profitability this year enabled us to strengthen our balance sheet
through increased cash balances and the pay down of debt. Our
strong balance sheet will enable your company to make strategic
investments for continued growth in the future. During this
year we have continued to make investments in our Faus laminate
program and other new flooring products.” Mr. Gould
concluded, “There is much work to do, but we are confident in our
strategic direction and the focus of our near term
initiatives.”
Net sales of $309.2 million increased during
fiscal year 2016 by $11.5 million or approximately 3.9% as compared
to the prior fiscal year reflecting the expansion of our product
lines with existing customers in the Company’s domestic and
international operations.
The Company’s gross profit of $81.5 million
increased more than 2% in the current year due to sales volume
growth, most significantly in North America. The Company’s
gross profit as a percentage of net sales for the current fiscal
year as compared to the prior fiscal year declined slightly.
Changes in product mix and decreased purchasing power of the
Company’s international operations as a result of adverse changes
in currency exchange rates mitigated the sales improvement impact
on gross margin.
Operating expenses for fiscal 2016 and fiscal
2015 were $73.6 million and $75.6 million, respectively, or 23.8%
and 25.4%, respectively, of net sales in those periods. In
the current year, sales increased 3.9% while operating expenses
decreased 2.7%. The decrease in operating expenses reflects
decreased domestic selling and marketing expenses achieved through
cost containment efforts that began late in the previous fiscal
year. In addition, currency exchange rates had a net favorable
effect on operating expenses of the Company’s international
operations compared to the prior fiscal year.
The decrease in interest expense for fiscal 2016
as compared to fiscal 2015 is primarily the result of $7.1 million
of debt payments, including a $5.6 million term loan payment in May
2015.
The provision for income taxes as a percentage
of income before taxes for fiscal 2016 was 41.9% compared to 35.4%
for fiscal 2015. The increase in the effective tax rate reflects
the relative contribution of the Company’s earnings sourced from
its international operations.
As a result, fiscal 2016 net income increased to
$4.0 million from $1.9 million in fiscal 2015 and net income per
diluted share increased to $1.23 per share from $0.57 per share,
respectively.
Earnings before interest, taxes, depreciation
and amortization (EBITDA) were $12.4 million in fiscal 2016 as
compared to $9.3 million for fiscal 2015:
| |
|
|
|
|
|
| |
|
|
Fiscal Year |
| |
|
|
|
2016 |
|
|
|
2015 |
|
| |
Net
income |
$ |
3,976 |
|
|
$ |
1,860 |
|
| |
Add
back: |
|
|
|
|
|
|
|
| |
|
Interest expense, net |
|
1,152 |
|
|
|
1,347 |
|
| |
|
Provision for income taxes |
|
2,865 |
|
|
|
1,018 |
|
| |
|
Depreciation and amortization |
|
4,404 |
|
|
|
5,112 |
|
| |
EBITDA |
$ |
12,397 |
|
|
$ |
9,337 |
|
| |
|
|
|
|
|
Cash provided by operations for fiscal 2016 was $13.7 million
compared to $4.2 million in fiscal 2015 reflecting the improvement
in operating results and an overall improvement in working
capital. During fiscal 2016, the Company’s increased cash
balances as well as funding for capital expenditures and debt
payments were provided by cash from operations. During fiscal 2015,
the Company’s increased cash balances as well as funding for
capital expenditures, acquisitions and the treasury stock program
were funded through borrowings and cash from operations.
Working capital at the end of the Company’s
fiscal year 2016 increased to $38.7 million from $34.5 million at
the end of the 2015 fiscal year and total debt decreased to $36.0
million from $45.4 million during the same period last year
primarily due to a $5.6 million pay-off of one of the Company’s
term loans through cash on-hand.
The Company will be hosting a conference call to
discuss these results and to answer your questions at 10:30 a.m.
Eastern Time on Friday, May 20, 2016. If you would like to join the
conference call, dial 1-888-401-4668 toll free from the US or
1-719-325-2429 internationally approximately 10 minutes prior to
the start time and ask for the Q.E.P. Co., Inc. Fiscal 2016
Conference Call / Conference ID 4751382. A replay of the conference
call will be available until midnight May 27, 2016 by calling
1-877-870-5176 toll free from the US and entering pin number
4751382; internationally, please call 1-858-384-5517 using the same
pin number.
The Company is posting its consolidated fiscal
2016 audited financial statements on the Investor section of its
website at www.qepcorporate.com today.
Q.E.P. Co., Inc., founded in 1979, is a world
class, worldwide provider of innovative, quality and value-driven
flooring and industrial solutions. As a leading manufacturer,
marketer and distributor, QEP delivers a comprehensive line of
hardwood and laminate flooring, flooring installation tools,
adhesives and flooring related products targeted for the
professional installer as well as the do-it-yourselfer. In
addition, the Company provides industrial tools with cutting edge
technology to the industrial trades. Under brand names including
QEP®, ROBERTS®, HarrisWood®, Fausfloor®, Capitol®, Nupla®, HISCO®,
Ludell®, Porta-Nails®, Elastiment®, Vitrex®, Homelux®, Tilerite®,
PRCI®, Plasplugs®, Tomecanic® and Benetiere®, the Company sells its
products to home improvement retail centers, specialty distribution
outlets, municipalities and industrial solution providers in 50
states and throughout the world.
This press release contains forward-looking
statements, including statements regarding future sales growth,
international and domestic market position, pricing and
profitability, acquisition integration activities, potential
acquisition opportunities, and product development. These
statements are not guarantees of future performance and actual
results could differ materially from our current expectations.
CONTACT:
Q.E.P. Co., Inc.
Mark S. Walter
Senior Vice President and
Chief Financial Officer
561-994-5550
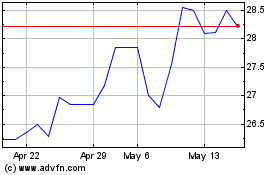
Q E P (QX) (USOTC:QEPC)
Historical Stock Chart
From Dec 2024 to Jan 2025

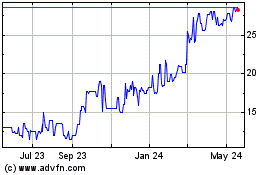
Q E P (QX) (USOTC:QEPC)
Historical Stock Chart
From Jan 2024 to Jan 2025
