1st Quarter Results
23 April 2010 - 1:58AM
UK Regulatory
TIDMCOD

RNS Number : 6568K
Compagnie de Saint-Gobain
22 April 2010


April 22, 2010


                            FIRST-QUARTER 2010 SALES:
                      down 0.5% (down 2.4% like-for-like)


Saint-Gobain's consolidated sales for first-quarter 2010 came in at EUR8,737
million, versus EUR8,782 million in the first quarter of 2009, representing a
decline of 0.5% on an actual structure basis and of 2.0% at constant exchange
rates*.

Exchange rates accounted for a 1.5% rise in sales, powered chiefly by sharp
gains in Scandinavian currencies and most emerging country currencies
(particularly the Brazilian real) against the euro, offsetting the slide in the
US dollar. Changes in Group structure also had a slightly positive impact,
driving sales up 0.4%.

Like-for-like (comparable Group structure and exchange rates), consolidated
sales were down 2.4%. Volumesslipped 1.7%, while sales prices edged down 0.7%
compared to the strong 2.3% rise in first-quarter 2009.

This slight drop in like-for-like consolidated sales conceals starkly
contrasting performances across business sectors and geographical areas, in line
with the economic scenario presented by the Group at the end of February.

Trading was very upbeat in the following Group businesses and areas:

-     activities linked to industrial output (representing the bulk of sales for
the Innovative Materials Sector), which saw double-digit organic growth over the
quarter;
-     all Group businesses in Asia and Latin America, which confirmed their
return to growth, delivering a 22% rise in sales over the three months to March
31.

Businesses related to household consumption (Packaging Sector) continued to hold
up very well, reporting like-for-like sales almost identical to the previous
year.


*  Based on average exchange rates for first-quarter 2009.

The Group's other businesses exposed to construction markets in Europe and North
America continued to face tough conditions, amplified by a very cold winter in
the first two months of the year.

For the Group's businesses in general, March - which benefited from a return to
"normal" weather conditions in the Northern hemisphere and an extra working day
compared with 2009 - saw a sharp improvement in trading compared to the first
two months of the year.


Sales trends by business sector and major geographic area are as follows:


+------------------------+-----------+-----------+-----------+------------+---------------+
|                        |           |           |           |            |               |
|                        |    Q1     |    Q1     |    %      | %          |   % change    |
|                        |   2009    |   2010    |  change   | change     |like-for-like  |
|                        |    (EUR     |    (EUR     |  on an    | on a       |               |
|                        |millions)  |millions)  |  actual   | comparable |               |
|                        |           |           |structure  | structure  |               |
|                        |           |           |  basis    | basis      |               |
|                        |           |           |  (en %)   | (en %)     |               |
|                        |           |           |           |            |               |
|                        |           |           |           |            |               |
+------------------------+-----------+-----------+-----------+------------+---------------+
| BY BUSINESS SECTOR     |           |           |           |            |               |
|                        |           |           |           |            |               |
| Innovative Materials   |     1,863 |     2,106 |  +13.0%   |  +12.9%    |    +10.4%     |
| (1)                    |     1,050 |     1,193 |  +13.6%   |  +14.1%    |    +9.6%      |
| Flat Glass             |       818 |       921 |  +12.6%   |  +11.8%    |    +11.9%     |
| High-Performance       |           |           |           |            |               |
| Materials              |     2,456 |     2,413 |  -1.8%    |   -2.3%    |    -3.3%      |
|                        |     1,280 |     1,191 |  -6.9%    |   -6.5%    |    -8.1%      |
| Construction Products  |     1,184 |     1,229 |  +3.8%    |   +2.4%    |    +1.9%      |
| (1)                    |           |           |           |            |               |
| Interior Solutions     |     3,911 |     3,663 |  -6.3%    |   -6.8%    |    -8.8%      |
| Exterior Solutions     |           |           |           |            |               |
|                        |       800 |       787 |  -1.6%    |   -1.7%    |    -0.4%      |
| Building Distribution  |           |           |           |            |               |
|                        |     (248) |     (232) |  ------   |  -------   |    -------    |
| Packaging              |           |           |           |            |               |
|                        |     8,782 |     8,737 |  -0.5%    |   -0.9%    |    -2.4%      |
| Internal sales and     |           |           |           |            |               |
| other                  |           |           |           |            |               |
|                        |           |           |           |            |               |
| GROUP                  |           |           |           |            |               |
|                        |           |           |           |            |               |
|                        |     2,822 |     2,678 |  -5.1%    |   -5.1%    |    -5.1%      |
|                        |     3,756 |     3,622 |  -3.6%    |   -3.6%    |    -5.6%      |
| BY GEOGRAPHIC AREA     |     1,228 |     1,249 |  +1.7%    |   +0.9%    |    +6.1%      |
|                        |     1,339 |     1,609 |  +20.2%   |  +17.9%    |    +8.3%      |
| France                 |           |           |           |            |               |
| Other Western European |     (363) |     (421) |  -----    |   -----    |    -----      |
| countries              |           |           |           |            |               |
| North America          |     8,782 |     8,737 |  -0.5%    |   -0.9%    |    -2.4%      |
| Emerging countries and |           |           |           |            |               |
| Asia/Pacific           |           |           |           |            |               |
|                        |           |           |           |            |               |
| Internal sales         |           |           |           |            |               |
|                        |           |           |           |            |               |
| GROUP                  |           |           |           |            |               |
+------------------------+-----------+-----------+-----------+------------+---------------+

    (1) Including inter-division eliminations.


Performance of Group business sectors (like-for-like basis)


Innovative Materials reported double-digit organic growth of 10.4% over the
quarter, buoyed by the rebound in markets linked to industrial output in North
America and to a lesser extent in Western Europe, as well as the sharp rise in
sales in emerging countries and Asia (which represent 35% of the Sector's
sales).

·     Flat Glass reported 9.6% organic growth. The strong rally in the global
automotive market and robust momentum in Asia and emerging countries (which
account for over 39% of the Sector's sales) more than offset sluggish
construction markets across Western Europe. Despite the slight rise in prices
for commodity products (float glass) in Europe compared with first-quarter 2009,
sales prices across the Sector were still down, mainly due to the time-lag in
passing float glass price increases onto processed products.

·     High-Performance Materials (HPM) posted an 11.9% increase in sales, fueled
chiefly by the sharp rally in industrial output in Asia and North and South
America, and the more modest industrial output gains in Europe. This more than
offset the slowdown (in terms of volumes and prices) in businesses linked to
capital expenditure.


Construction Products (CP) salesfell 3.3%, reflecting the impact of very poor
weather conditions in the Northern hemisphere over the first two months of the
year.

·     Interior Solutions sales for the first quarter were dampened by slack
construction markets across Europe and the US, which vigorous demand in Asia and
Latin America failed to offset. In this context, sales prices were slightly down
on average compared to the same year-ago period, particularly in the US, despite
an upward trend at the end of the quarter.

·     Exterior Solutions salesclimbed 1.9% on the back of vigorous growth in
Asia (particularly for Pipe) and Latin America, as well as brisk trading in US
Exterior Products, bolstered by the rebuilding of inventory levels by
distributors. Sales prices remained upbeat, reflecting the rising trend in
commodity and energy costs.


Building Distribution was hard hit by persistently tough conditions on European
construction markets and by extremely harsh winter weather in the first two
months of the year, driving an 8.8% drop in sales. Sales fell in most countries
where the Sector operates, although the decline was smaller in the UK, thanks to
a more favorable basis for comparison. Sales prices held up well.

Trading remained brisk for thePackaging business, in line with first-quarter
2009 (down 0.4%). Robust sales prices helped offset the slight drop in volumes
in Europe.


Analysis by geographic area (like-for-like basis)

Sales trends for the quarter varied widely from one region to the next. Latin
America and Asia confirmed the recovery begun in fourth-quarter 2009. Countries
in the Northern hemisphere benefited from the upturn in industrial output, but
continued to face challenging market conditions in construction, intensified by
very bad weather conditions over the first two months of the year. Trading in
March - which gained from an extra working day compared to 2009 - was up
significantly compared to January and February in both Europe and North America.

-   Sales in France and other Western European countries were down 5.1% and
5.6%, respectively, for the quarter, on the back of the ongoing contraction in
sales to the construction industry. In contrast, markets linked to industrial
output saw a timid recovery, allowing the Innovative Materials business to post
robust growth gains throughout the region.

-   North America reported 6.1% organic growth, buoyed by the strong rebound in
industrial output combined with robust sales for Packaging and Exterior
Products.

-   Like-for-like sales advanced 8.3% in Asia and emerging countries, thanks to
vigorous momentum in Latin America and Asia, with overall organic growth of 22%
for the quarter. Trading in Eastern European countries remained very sluggish,
although there was a relative improvement in March compared to the previous two
months, spurred by more favorable weather conditions.


Update on asbestos claims in the United States

Some 1,000 claims were filed against CertainTeed in first-quarter 2010, in line
with the number of claims filed in the three months to March 31, 2009. Taking
into account some 1,000 claims settled during this period (unchanged from
first-quarter 2009), the number of claims outstanding at March 31, 2010 was
virtually the same as at December 31, 2009.


Outlook


After persistently tough conditions in the three months to March 31, the Group
is expecting for the next few quarters:

- consolidation of the relative improvement in residential construction observed
in March inNorth America and Western Europe, although trading should continue to
vary widely from one country to the next (upturn in the UK and US, further
decline in Southern Europe). Industrial markets should continue to trend upwards
in the short term, while household consumption should remain upbeat.

- further growth gains throughout 2010 in Asia and emerging countries
particularly in Asia and Latin America. In Eastern Europe, however, trading is
expected to remain difficult over the next few months, although somewhat better
than in the first three months of the year.


During this first quarter,the Group resolutely pursued its action plan
priorities amid an economic climate that remained fragile. As announced in
February, further cost cutting measures were launched, targeting EUR200 million in
additional cost savings for full-year 2010, while the Group's first-quarter
operating income also received a boost from the cost savings already unlocked in
the second half of 2009.


The Group therefore confirms its targets for full-year 2010:

- strong growth in operating income at constant exchange rates (2009 exchange
rates);

- free cash flow of above EUR1 billion;

- a persistently robust financial structure.


Forthcoming results announcements:

Results for first-half 2010: July 29, 2010, after close of trading on the Paris
Bourse.


+-------------------------------------+-------------------------------+
| C    Analyst & Investor relations   |        Press relations        |
+-------------------------------------+-------------------------------+
|                                     |                               |
| F    Florence TRIOU-TEIXEIRA +33 1  | S   Sophie CHEVALLON +33 1 47 |
| 47 62 45 19                         | 62 30 48                      |
| E    Etienne HUMBERT                |                               |
| +33 1 47 62 30 49                   |                               |
| V    Vivien DARDEL                  |                               |
| +33 1 47 62 44 29                   |                               |
|                                     |                               |
+-------------------------------------+-------------------------------+


This information is provided by RNS
            The company news service from the London Stock Exchange
   END

 QRFPGUCACUPUGAP
Compagnie De Saint-gobain (LSE:COD)
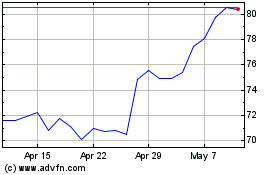
Historical Stock Chart
From Oct 2024 to Nov 2024

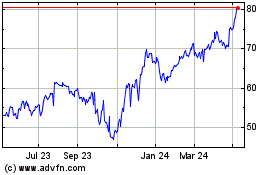
Compagnie De Saint-gobain (LSE:COD)
Historical Stock Chart
From Nov 2023 to Nov 2024
