Hot Features

Key Resistance levels: $0.30, $0.35, $0.40
Key Support Levels: $0.20, $0.15,$0.10

ZRX/USD Price Long-term Trend: Bearish
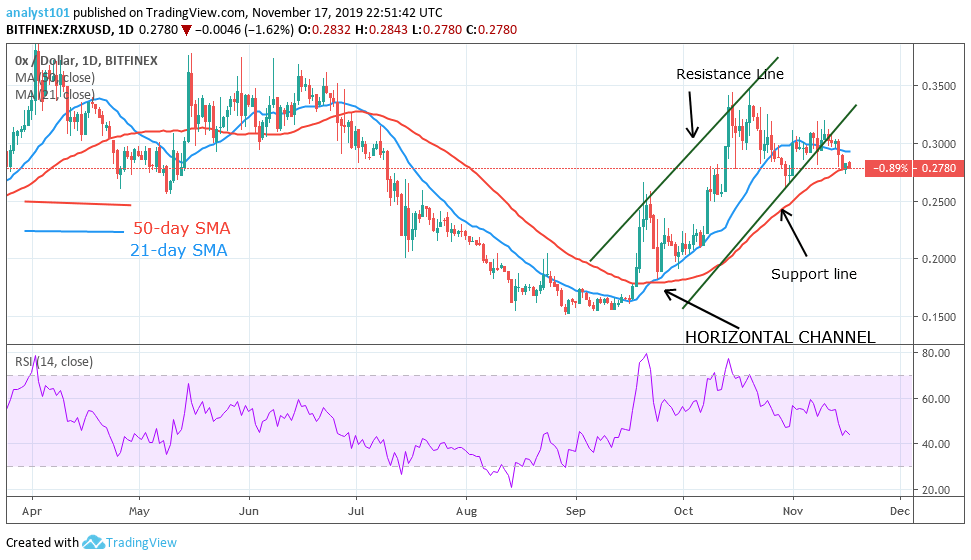
The ZRX/USD pair is in a downward move after the market retests the $0.30 price level. In October, the coin was in a bullish move and tested the $0.35 resistance level. The bulls tested the $0.35 price level again and formed a bearish double top. With the formation of the bearish double top, the coin fell to the support line of the channel.
The bulls may a retest at the $0.30 price level and resumed the downward move. The market has fallen to a low of $0.27 and it is consolidating above that level. This was the previous low in May. However, if the price breaks below $0.27, the pair will drop to a low at $0.20. Nevertheless, if the $0.27 support holds, the price will move up.
Daily Chart Indicators Reading:
The price has fallen to the support of the 50-day SMA and if the 50-day SMA holds, the 0x will move up to retest the resistance level. The RSI period 14 level44 indicates that the price is in the range-bound zone.
ZRX/USD Medium-term bias: Ranging
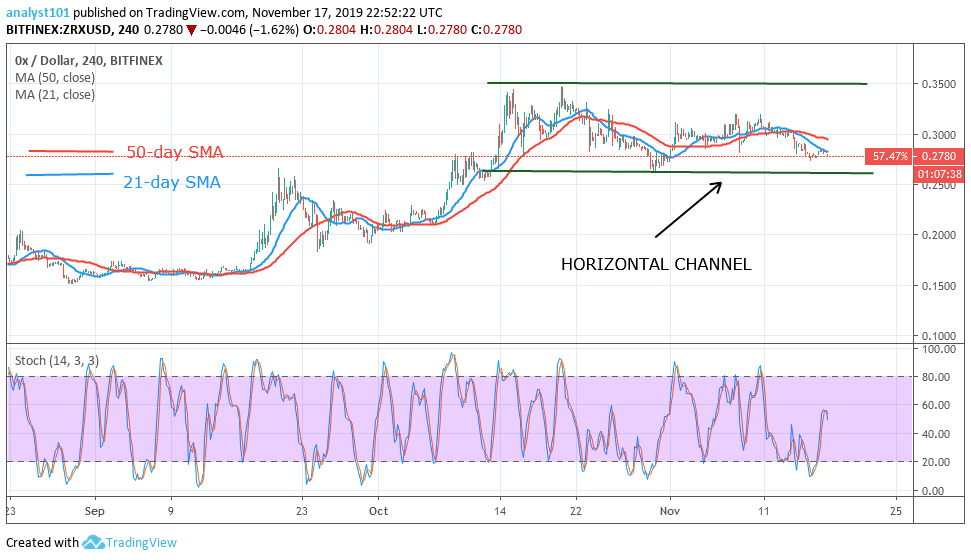
The bulls move up to test the resistance at $0.35 on two occasions and commenced a sideways move. The coin is fluctuating between the levels of $0.27 and $0.35. Nevertheless, the bears tested the support line and rebounded. The pair is likely to continue with the sideways move.
4-hour Chart Indicators Reading
The 21-day SMA and 50-day SMA are trending horizontally indicating that price is in a sideways move. The stochastic indicator is above the 40% range indicating that price is in bullish momentum.
General Outlook for 0x
The ZRX/USD pair is in a downward move but the price is ranging above the $0.27 support level. After the sideways move above $0.27 and if the bears break below the support level, the selling pressure will resume.
0x Trade Signal
Instrument: ZRXUSD
Order: Buy Limit
Entry price: $0.25
Stop: $0.20
Target: $0.35
Source: https://learn2.trade