Key Support Levels: $0.06, $0.05,$0.04

Key Resistance Levels: $0.09, $0.10, $0.11
XLM/USD Long-term Trend: Ranging
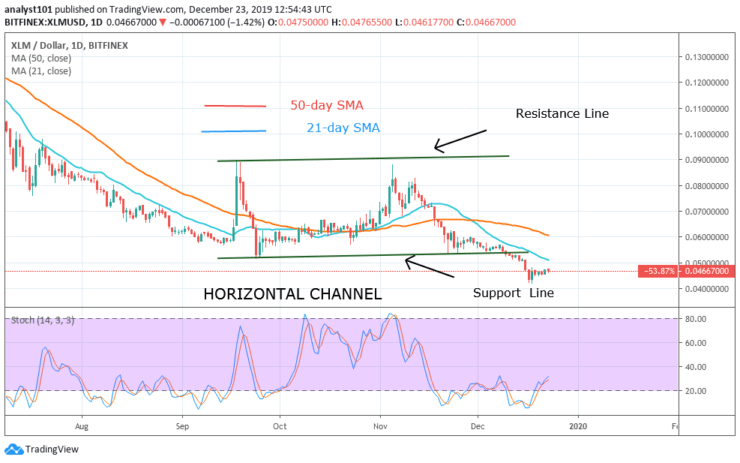
Stellar has been relatively slow in price movement. On December 17, the coin fell to a low of $0.042. In defense of the current low, the price pulled back to a high of $0.046. The price movement has been insignificant as the market commences consolidation above the current price level.
Consolidation at the oversold region implies that buyers and sellers have reached equilibrium at the current price level. Stellar lacks buying at a lower level as the bears may take undue advantage to sink XLM to the $0.036 low. Alternatively, if the bulls continue their hold above the $0.042, the market will continue the sideways trend.

Daily Chart Indicators Reading:
Stellar is making frantic efforts to rise, as the coin is trading above the 25% range of the daily stochastic. This implies that the market is also in a bullish momentum. The 21-day SMA and the 50-day SMA are trending horizontally indicating the price range.
XLM/USD Medium-term bias: Bearish
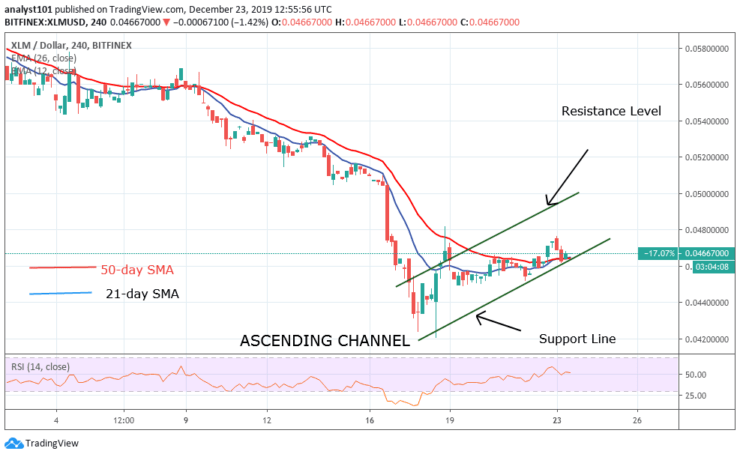
On the 4 hour chart, the bear market exhausted its bearish run at the $0.042 support level. The coin is in a bullish move but it is struggling above the $0.046 price level. The price action is characterized by small body candlesticks that are responsible for the range-bound movement.

4-hour Chart Indicators Reading
The Relative Strength Index period 14 level 52 is above the centerline 50 which indicates that the price is rising. XLM may further depreciate if the support line of the channel is breached.
General Outlook for Stellar
Stellar is still in a downtrend. The coin is still at the bottom of the chart. Buyers are scarce at the lower price level to push Stellar upward. The market may depreciate further if the bulls fail to hold the $0.042 support.
Stellar Trade Signal
Instrument: XLM/USD
Order: Buy Limit
Entry price: $0.041
Stop: $0.035
Target: $0.08
Source: https://learn2.trade


 Hot Features


