Key Support Levels: $150, $125, $100

ETH/USD Long-term Trend: Bearish
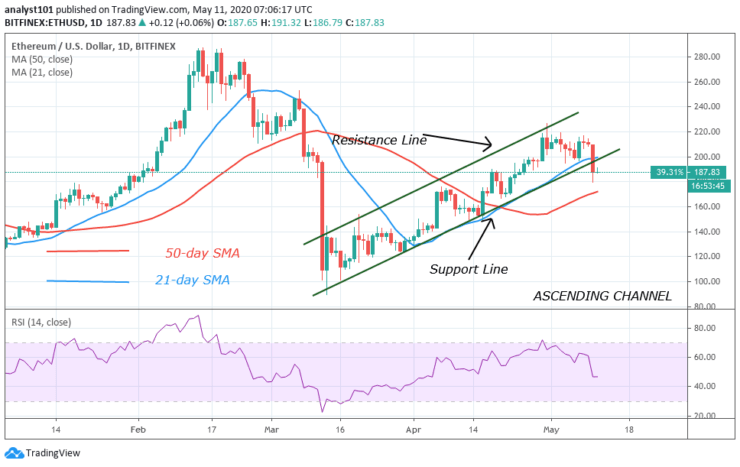
Ethereum has been trading above $200 after a rebound on May 7. However, the king altcoin suffered another setback after a breakdown yesterday. The coin dropped to $180 low but price corrected upward above $185. On the downside, ETH is likely to fall as there is a bearish signal. The market is heading to $180 low and if $180 low cracks, the coin will reach the low of $170. Alternatively, if bulls buy from the dips, a rebound above $180 will propel price to rally above $200.

Chart Indicators Reading:
The price has broken the support line and closed below it. This implies that Ether will continue the downward move. ETH is at level 46 of the Relative Strength Index period 14. This indicates that the coin is in the downtrend and it is likely to fall.
ETH/USD Medium-term Trend: Bearish
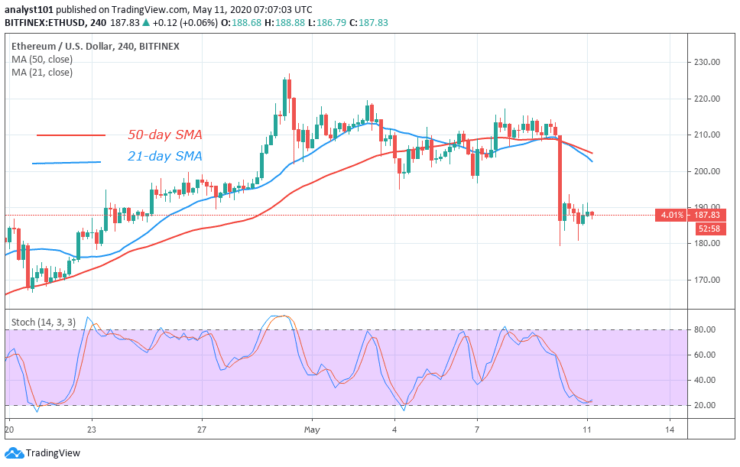
On the 4 hour chart, price breaks the support levels of $200 and $190 to reach a low of $180. The price is presently consolidating above $180 support level. Presently, the price has resumed a downward move.

4-hour Chart Indicators Reading
The 21-day SMA and 50-day SMA are sloping downward indicating the downtrend. ETH is below 40% range of the daily stochastic but the bands are sloping upward. This is contrary to the present price action that is indicating a bullish signal.
General Outlook for ETH
Ethereum is in a downtrend as it trades in the bearish trend zone. Price is approaching $180 support, and ETH will be weakened if the support cracks. The coin will decline to $170 and $150 if the downtrend continues.
Source: https://learn2.trade


 Hot Features


