Key Support Levels: 1.34000, 1.32000, 1.30000

USD/CAD Price Long-term Trend: Bearish
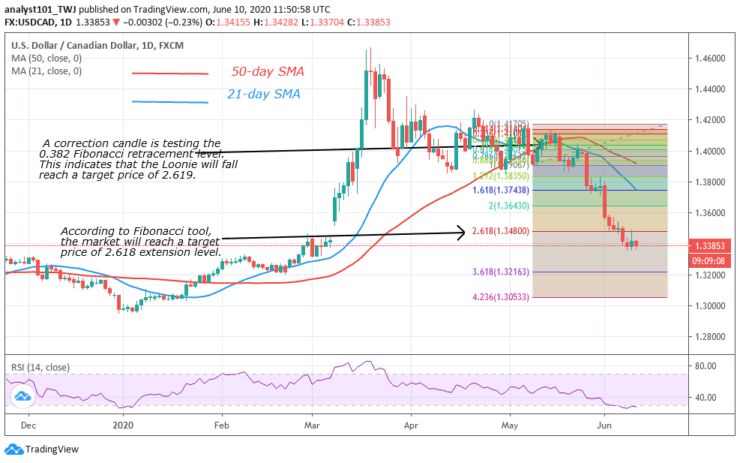
The USD/CAD pair is on a downtrend. A correction candle is testing the 0.382 Fibonacci retracement level. This indicates that the Loonie will fall and reach a target price of 2.619 Fibonacci retracement level. The target price has been achieved and the market is currently consolidating. The RSI is indicating that the Loonie is in the oversold region.

Daily Chart Indicators Reading:
The 50-day SMA and the 21-day SMA are sloping downwards indicating the bearish trend. The Loonie has fallen to level 28 of the Relative Strength Index. This indicates that the pair is in the oversold region and also below the centerline 50.
USD/CAD Medium-term Trend: Bearish
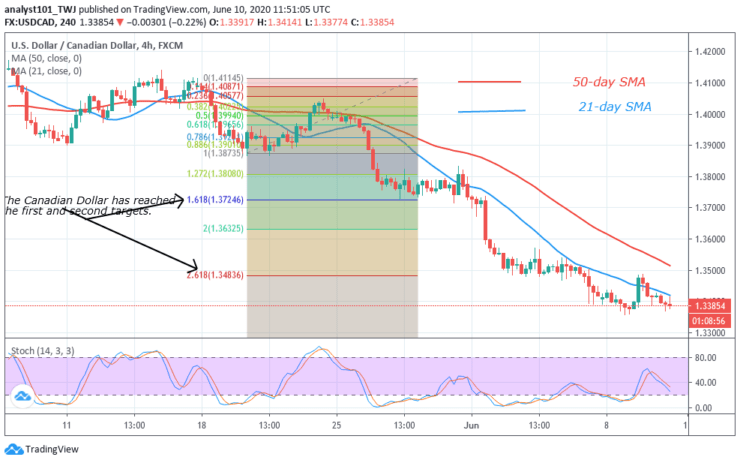
The Loonie is in a downtrend. The market has reached the first target and the second target of the Fibonacci tool. The price fell to level 1.33595 low and moved up. The pair corrected upward but was resisted at level 1.35000. After the retest, the downtrend is continuing. It is likely we are going to short again.

4-hour Chart Indicators Reading
Presently, the 21-day SMA and 50-day SMA are slowing downward indicating the downtrend. The Canadian dollar is below 40% range of the daily stochastic. This indicates that the pair is in a bearish trend.
General Outlook for USD/CAD
The USD/CAD pair is in approaching the oversold region. The market is sowing a bearish exhaustion as price consolidates.
Source: https://learn2.trade


 Hot Features


