Key Resistance Zones: 74.000, 76.000, 78.000
Key Support Zones: 66.000, 64.000, 62.000

AUD/JPY Long-term Trend: Bearish
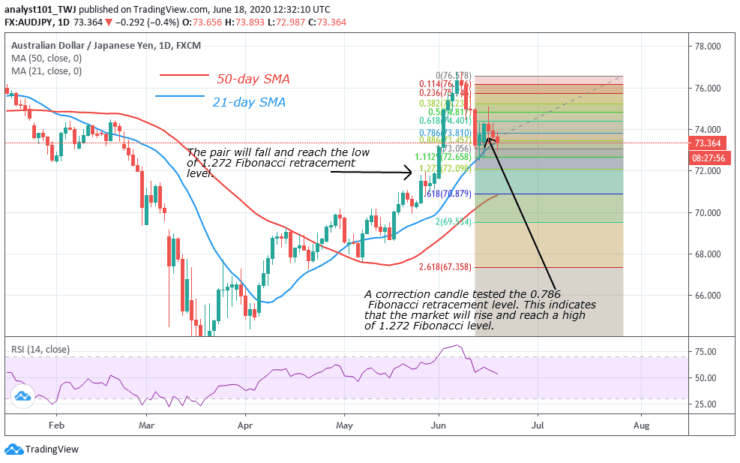
The pair is in a downward move. The market was earlier in a bearish trend. A correction candle tested the 0.786 Fibonacci retracement level. It indicates that the market will rise and reach a high of 1.272 Fibonacci level. The pair is currently on a downward move as it reaches the overbought region.

Daily Chart Indicators Reading:
Presently, the pair has fallen to level 55 of the Relative Strength Index period 14. It implies that AUD/JPY is on a downward move after an overbought region of the market. Sellers have emerged to push prices down. The 21-day SMA and the 50-day SMA are sloping upward.It implies that the market is rising.
AUD/JPY Medium-term Trend: Bearish
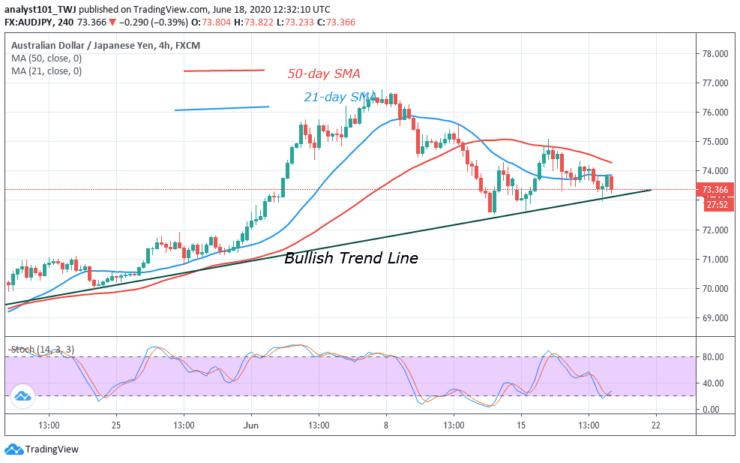
On the 4- hour chart, the currency pair is in a downward move. The market makes an upward move to retest level 75.000 and later resume the downward move. If price breaks the bullish trend line and closes below it, it will revisit level 72.000.

4-hour Chart Indicators Reading
The market is presently above 20 % range of the daily stochastic. This implies that the pair is in a bullish momentum. This is contrary to the price action which indicates a bullish signal. The 21-day and 50-day SMA are sloping downward indicating the downtrend.
.
General Outlook for Italy AUD/JPY
The currency pair is on a downward move after retesting level 75.000. The Fibonacci tool has indicated that the market will reach a low of level 1.272. In other words, the market will reach level 72.000.
Source: https://learn2.trade


 Hot Features


