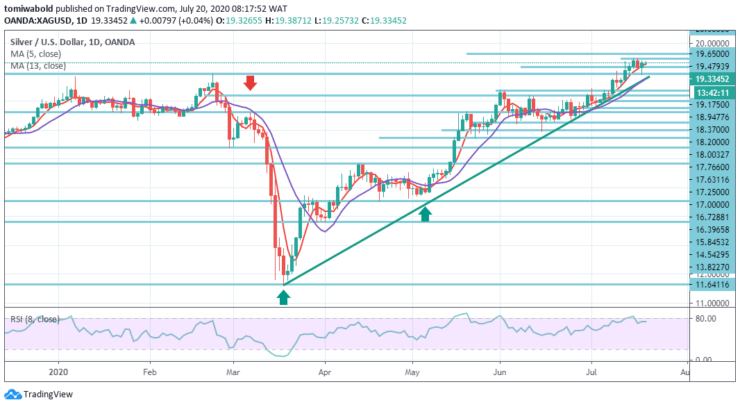
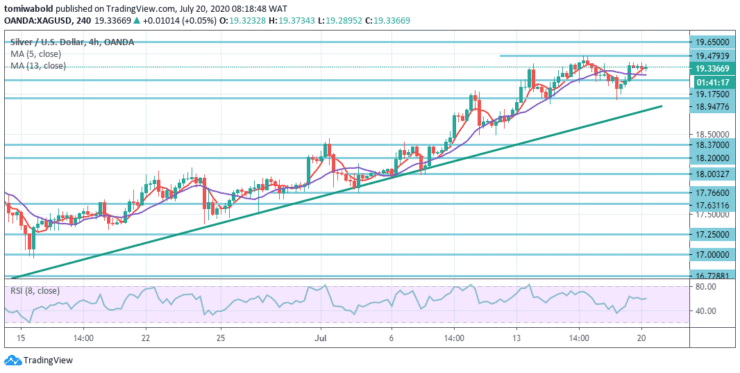
The white metal rebounded from prior day losses as market activity turned upside. XAGUSD price continued to ascend gradually to the exit of the day before, settling at around $19.32 level, it nevertheless, reflects a lower high.

Key Levels
Resistance Levels: $21.00, $20.50, $19.65
Support Levels: $18.94, $18.37, $18.00
 XAGUSD Long term Trend: Bullish
XAGUSD trades at a level of $19.33; the instrument rises beyond its horizontal resistance turned support at a level of $19.17, which suggests an upward trend. The markets may suggest that the price could test the upside boundary at a level of $19.65 and then start pushing upwards to a level of $20.50 later in the week.
A recovery from support level might be another indicator for more uptrend. Nevertheless, if the price crosses the downside barrier and fixes beneath $18.94 level the bullish scenario may no longer be the case. The pair may start to decline towards $18.00 level in this situation.
 XAGUSD Short term Trend: Bullish
On the shorter time frame bulls persisted and moved the precious metal higher spontaneously after a simple breach of $19.17 barrier, attempting a short-term resistance in the process. Price may re-test the $19.17 level broken short-term barrier as potential support.
Short to mid-term bias is bullish and it is probable that if this broken short-term resistance holds as support another push back up to $19.47 level is imminent. On the other hand, a break and close back beneath the $19.17 level may put $18.94 level back into view.
Source: https://learn2.trade


 Hot Features


