ADVFN Logo ADVFN

We could not find any results for:
Make sure your spelling is correct or try broadening your search.

Trending Now

Toplists

It looks like you aren't logged in.
Click the button below to log in and view your recent history.

Hot Features

Registration Strip Icon for charts Register for streaming realtime charts, analysis tools, and prices.

XAGUSD Bulls Re-Attempts Resistance at $28.15 Level

Share On Facebook
share on Linkedin
Print

Silver price increases past the $28.15 hurdle, up 0.45 percent on a day, during Wednesday’s session. The white metal leaps forward to the sixth month of gains also since it swung off in April. While the recent weakening risk-tone bias might contest the initial trajectories of the bullion, wide US dollar vulnerability and risk-safety chase retain the metal investors steady.

©
XAGUSD Price Analysis – September 2

Key Levels
Resistance Levels: $30.00, $29.50, $28.15
Support Levels: $27.15, $26.50, $25.00
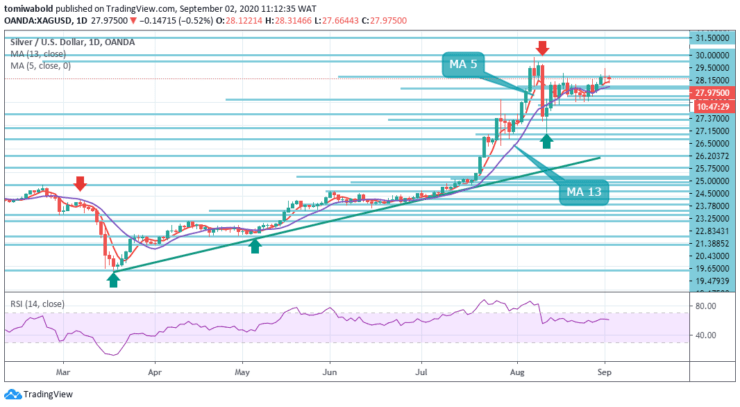
XAGUSD Long term Trend: Bullish
Considering the sustained break of the $28.15 resistance level, the August 18 high near $28.50 level and $29.00 round-figures are on the bulls’ radars ahead of the previous month’s peak near $29.85 level. Meanwhile, the MA 13 level of $27.37 questions the short-term sellers.

If at all the bears manage to sneak in around the $27.15 level, the August 25 low near $26.50 level and August 12 bottom close to $23.25 level could regain market attention. Meanwhile, the $28.00 mark and MA 13 near $27.37 level may offer immediate supports to the metal ahead of an ascending trend line from March 19 in the event of a bear market.
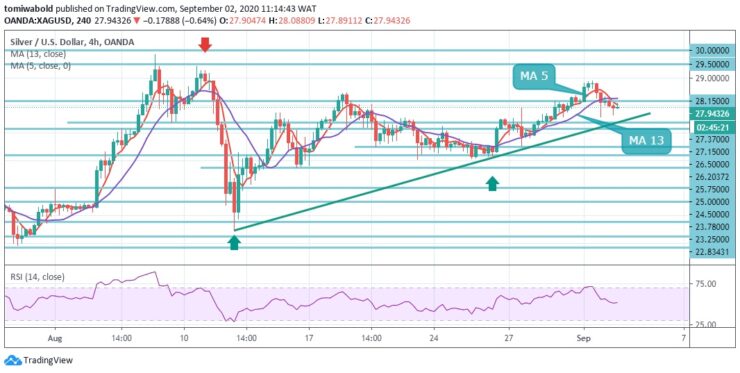
XAGUSD Short term Trend: Ranging
Looking at the 4-hour chart, the price looks to be heading to test the resistance at $28.15 level. A break of this level could mean that the recent high of $29.85 level might be the target for the bulls.

If this fails then the $26.20 level may stay as big thorn in the side for the bears as it is a very stubborn support zone. The indicators are staying in the positive zone at the moment as the MA 5 and MA 13 exhibit intact upside traction. The Relative Strength Index is beyond its 50 midlines with more space for a move higher.

Source: https://learn2.trade

CLICK HERE TO REGISTER FOR FREE ON ADVFN, the world's leading stocks and shares information website, provides the private investor with all the latest high-tech trading tools and includes live price data streaming, stock quotes and the option to access 'Level 2' data on all of the world's key exchanges (LSE, NYSE, NASDAQ, Euronext etc).

This area of the ADVFN.com site is for independent financial commentary. These blogs are provided by independent authors via a common carrier platform and do not represent the opinions of ADVFN Plc. ADVFN Plc does not monitor, approve, endorse or exert editorial control over these articles and does not therefore accept responsibility for or make any warranties in connection with or recommend that you or any third party rely on such information. The information available at ADVFN.com is for your general information and use and is not intended to address your particular requirements. In particular, the information does not constitute any form of advice or recommendation by ADVFN.COM and is not intended to be relied upon by users in making (or refraining from making) any investment decisions. Authors may or may not have positions in stocks that they are discussing but it should be considered very likely that their opinions are aligned with their trading and that they hold positions in companies, forex, commodities and other instruments they discuss.

Leave A Reply

 
Do you want to write for our Newspaper? Get in touch: newspaper@advfn.com